Simultaneous super-resolution and optical sectioning with four-beam interference structured illumination microscopy (4I-SIM)
Structured illumination microscopy (SIM) has emerged as a widely adopted super-resolution fluorescence imaging modality, offering high speed, low phototoxicity, large field-of-view, and compatibility with conventional probes. However, when applied to…
Authors: Jiaming Qian, Jing Feng, Hongjun Wu
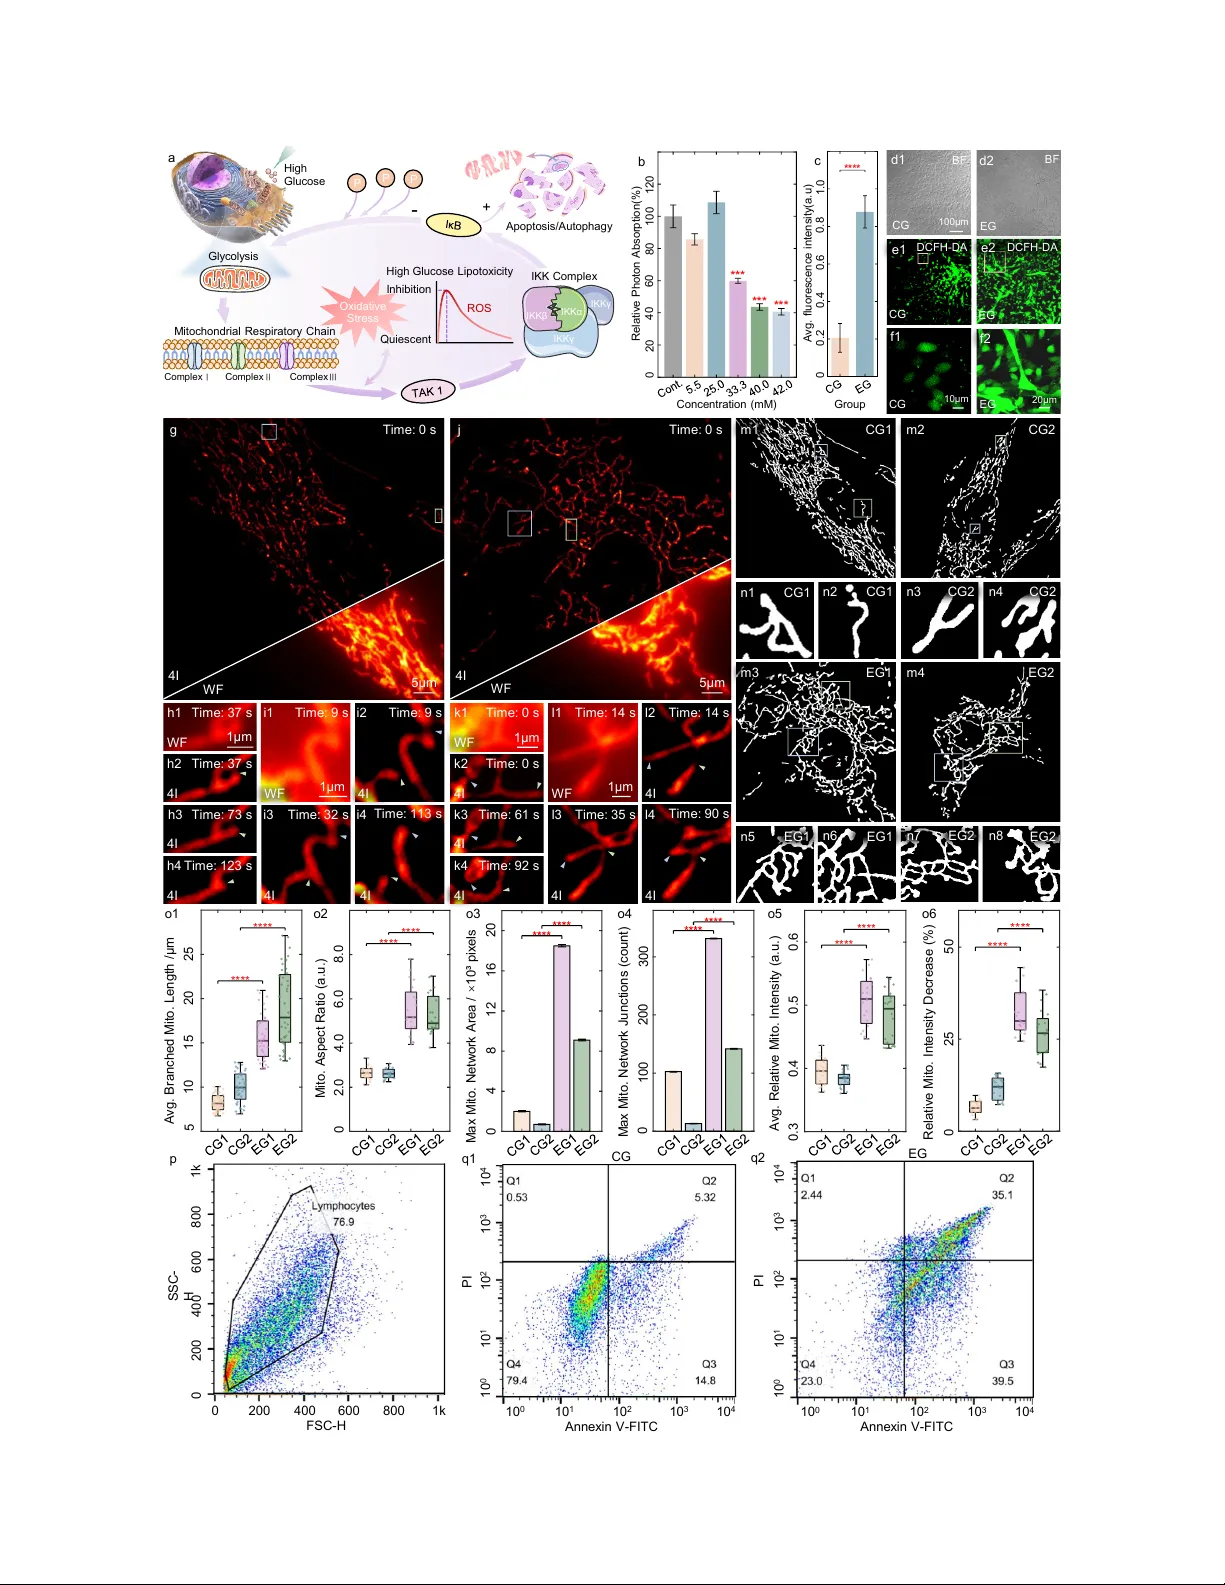
Sim ultaneous super -resolution and optical sectioning with f our -beam interference structured illumination micr oscop y (4I-SIM) Jiaming Qian 1,2,3,4,† , Jing Feng 1,2,3,† , Hongjun W u 1,2,3,4,† , Mao xian Zhang 1,2,3 , Dongqin Lu 1,2,3 , Tianchi Kang 1,2,3 , Xinyu Han 1,2,3 , Qian Chen 3,4,** , and Chao Zuo 1,2,3,4* 1 Smar t Computational Imaging (SCI) Laboratory , Nanjing University of Science and T echnology , Nanjing, Jiangsu Province 210094, China 2 Smar t Computational Imaging Research Institute (SCIRI) of Nanjing University of Science and T echnology , Nanjing, Jiangsu Province 210094, China 3 Jiangsu K ey Labor ator y of Visual Sensing & Intelligent P erception, Nanjing, Jiangsu Province 210094, China 4 State K ey Labor ator y of Extreme Environment Optoelectronic Dynamic Measurement T echnology and Instr ument, T aiyuan, Shanxi Province 030051, China * zuochao@njust.edu.cn ** chenqian@njust.edu.cn † These authors contributed equally to this work ABSTRA CT Structured illumination microscopy (SIM) has emerged as a widely adopted super-resolution fluorescence imaging modality , off er ing high speed, lo w phototo xicity , large field-of-view , and compatibility with conv entional probes. Howe ver , when applied to thick or scattering specimens, con ventional tw o-dimensional SIM (2D-SIM) suff ers from the “missing cone” prob lem in its optical transf er function, resulting in prominent out-of-focus bac kground and se vere reconstruction ar tif acts that compromise image fidelity . Here, we present f our-beam interf erence structured illumination microscopy (4I-SIM), which introduces additional interf erence orders to expand lateral frequency support and compensate the axial missing cone simultaneously . This strategy achie ves ar tif act-free super-resolution with intr insic optical sectioning, eff ectively ov ercoming the fundamental limitation of 2D- SIM without additional acquisition overhead. Experimental v alidation across diverse thick fixed and live specimens demonstrates that 4I-SIM delivers nearly twof old lateral resolution enhancement and substantially impro ved sectioning compared with its 2D counterpar t, achie ving later al and axial resolutions of 103 nm and 336 nm, respectively . In par ticular , 4I-SIM rev eals mitochondrial remodeling and apoptosis under high-glucose stress with millisecond temporal resolution – features that remain obscured with conv entional SIM. With minimal hardware modification, low phototo xicity , and open-source reconstruction tools, 4I-SIM establishes a practical and reproducib le platf or m f or simultaneous super-resolution and optical sectioning imaging in comple x biological environments. 1 Introduction Understanding the nanoscale architecture and rapid dynamics of subcellular or ganelles, such as mitochondria, endoplasmic reticulum, and cytoskeletal filaments, is essential for elucidating fundamental biological processes and disease mechanisms 1 – 4 . Many of these processes, including mitochondrial fission and fusion, endocytic trafficking, and c ytoskeletal remodeling, occur at spatiotemporal scales well below the dif fraction limit and often unfold on sub-second to millisecond timescales. Capturing such fast, nanoscale e vents in their nati ve ph ysiological context therefore demands li ve-cell imaging modalities that pro vide high spatial resolution, millisecond-lev el temporal fidelity , and minimal phototoxicity 5 – 7 . Structured illumination microscopy (SIM), which of fers up to twofold lateral resolution enhancement while preserving photon ef ficiency and compatibility with standard fluorescent probes, has consequently become a widely adopted modality for long-term, high-speed visualization of subcellular dynamics in living cells 8 – 17 . Despite its broad utility , conv entional two-dimensional (2D) super-resolution structured illumination microscopy (SR-SIM) is often compromised in thick or scattering biological specimens, where out-of-focus fluorescence de grades image contrast and obscures fine structural details. This limitation stems from the well-known axial missing cone in its three-dimensional (3D) optical transfer function (O TF), which renders essential axial spatial frequencies inaccessible and allows out-of-focus fluorescence to dominate the detected signal 18 , 19 . The resulting loss of axial support produces blurred backgrounds, distorted structures, and reconstruction artif acts that sev erely degrade sectioning capability and undermine image fidelity in comple x or densely labeled en vironments. These effects are particularly consequential for li ve-cell imaging, where axial background can obscure dynamic subcellular processes and undermine the reliability of structural interpretation. 3D-SIM addresses this limitation by employing coherent three-beam interference to generate v olumetric illumination patterns that extend axial frequency support, enabling simultaneous lateral and axial resolution enhancement 20 – 23 . Ne vertheless, these adv antages come at the cost of extensi ve z-stack acquisition, stringent optical alignment, increased illumination dose, and reduced temporal resolution – trade-of fs that restrict its practicality for general-purpose biological imaging, especially in dynamic or phototoxicity-sensitiv e liv e-cell contexts. As a simplified alternativ e, optical-sectioning SIM (OS-SIM) suppresses out-of-focus fluorescence by exploiting the intrinsic loss of modulation contrast with defocus under spatially incoherent illumination 24 – 30 . Building on this concept, multiple strategies, including WLR-SIM 31 and iSIM 32 , have been dev eloped to integrate OS into SR-SIM. Howe ver , these approaches typically exploit illumination frequencies near 1.5 × the original cutoff to partially mitigate the axial missing cone, which inherently restricts the heterodyning range and leads to a substantial loss of lateral SR compared with standard SR-SIM. Decon volution-based methods applied to v olumetric stacks, such as BF-SIM 33 , attenuate defocus contributions b ut inherit the heavy acquisition load and phototoxicity of 3D-SIM. Other ef forts, inspired by HiLo microscopy 25 , attempt to enhance OS by selecti vely suppressing out-of-focus spectral components and reinforcing in-focus modulated signals 14 , 34 . More recently , model-free post-processing techniques such as Dark-SIM 35 hav e emerged, le veraging statistical priors to remo ve background without requiring additional hardware. Howe ver , operating solely at the post-processing stage, these methods do not modify the underlying encoding of 3D information during image formation and therefore cannot recover axial spatial frequencies fundamentally lost to the missing cone, intrinsically limiting OS and compromising the fidelity of weak but genuine structures in dense or thick specimens. Collectiv ely , these limitations highlight a persistent methodological gap: there is still no SIM modality capable of deli vering both rob ust OS and ∼ two-fold lateral SR while preserving the simplicity , speed, and live-cell compatibility of con ventional 2D-SIM – a capability essential for high-fidelity imaging in thick or heterogeneous specimens. Here, we present four -beam interference structured illumination microscopy (4I-SIM), a composite illumination and reconstruction framew ork that bridges the long-standing gap between robust OS and high lateral SR within a standard 2D SIM architecture. By reshaping the effecti ve 3D O TF through engineered four-beam interference, 4I-SIM generates additional illumination orders that substantially e xtend the accessible lateral spatial-frequenc y support while simultaneously compensating for the axial missing cone without resorting to volumetric illumination patterns or z-stack acquisition. T o fully exploit the enriched frequency content, we dev elop a 3D O TF-informed optimal frequency-weighting reconstruction framew ork that suppresses out-of-focus contrib utions while reinforcing weak axial-frequenc y components, enabling intrinsic OS alongside high lateral fidelity ev en under conditions where con ventional 2D SIM fails. Importantly , 4I-SIM preserves the standard nine-frame acquisition and requires no additional hardware or alignment, ensuring seamless compatibility with existing SIM platforms. Across a variety of thick fix ed and liv e specimens, 4I-SIM consistently deliv ers effecti ve OS while retaining the lateral resolution expected from standard SR-SIM. In BSC-1 cells imaged with a 100 × /1.45 N A objecti ve, 4I-SIM reached lateral and axial resolutions of 103.4 nm and 336.2 nm, representing ∼ 1.91 × and ∼ 1.59 × improv ements ov er wide-field imaging. In heterogeneous liv e-cell en vironments, such as high-glucose-stressed cultures, 4I-SIM further re vealed mitochondrial remodeling and apoptosis dynamics that remain obscured with con v entional SI due to its lack of sectioning capability . These results establish 4I-SIM as a practical, robust, and broadly applicable solution for high-fidelity SR imaging across di verse and complex biological conte xts. 2 Results 2.1 3D O TF reinterpretation of 2D SIM Con ventional 2D-SIM is most often formulated as a lateral SR technique, in which high-frequenc y information is recov ered through heterodyne mixing between the object spectrum and structured illumination patterns produced by two-beam interference (Figs. 1 a1). As a result, in the frequenc y domain, the recorded signal is decomposed into a set of modulated spectral components, as illustrated in Fig. 1 b1. These components comprise the central 0-order term C 0 , together with the ± 1st-order terms C ± 1 Conv . symmetrically distrib uted on either side, where C ± 1 Conv . carries SR information beyond the dif fraction limit by approximately the illumination frequency k ex (the subscript Conv . is used to distinguish the con ventional illumination mode). In this framework, axial effects are typically treated implicitly , and OS is regarded as a secondary consequence of modulation contrast rather than a property of the underlying transfer function. From a physical imaging standpoint, howe ver , SIM is inherently a 3D process. When imaging a thick specimen, the interaction between structured illumination and the object encodes volumetric information that is transferred to the recorded images through the 3D O TF . As a result, the effecti ve 2D transfer function governing 2D-SIM imaging corresponds to a projection of the 3D O TF along the axial frequency dimension 36 , 37 , giv en by: ˜ h ( k xy ) = Z ˜ h ( k ) d k z (1) 2/ 23 where ˜ h ( k ) denotes the 3D O TF , defined over spatial frequenc y coordinates ( k x , k y , k z ). This projection redistributes the av ailable axial-frequency content into the lateral frequency plane, disproportionately accumulating low-axial-frequenc y components while suppressing high-axial-frequency contrib utions. V iewed from this perspecti ve, the limited OS of con ventional 2D-SIM arises from the anisotropic support of its ef fectiv e 3D O TF . In particular , the axial missing cone leads to a systematic under- representation of axial spatial frequencies, causing out-of-focus and scattered contributions to be preferentially transferred into the reconstructed image (Supplementary Figs. S1a and S1b). Importantly , this limitation is intrinsic to how spatial frequencies are encoded and weighted during image formation, rather than a consequence of reconstruction algorithms or post-processing choices. This 3D OTF reinterpretation re veals a critical but pre viously underexploited degree of freedom in 2D-SIM. Although standard SIM acquisitions are not designed for volumetric imaging, the frequency-mixing process inherently generates multiple spectral components with distinct axial sensiti vities. In con ventional reconstructions, these components are ef fectiv ely collapsed into a single projected transfer function, discarding their differential axial information (detailed in Supplementary Notes S1 and S2). Recognizing OS as an encoding- and transfer-function-le vel problem fundamentally changes how it can be addressed in 2D-SIM. Rather than relying on background suppression or volumetric illumination, improving sectioning performance requires reshaping the effecti ve 3D O TF by selectively accessing and combining frequency components according to their axial information content. This insight provides the conceptual foundation for four -beam interference structured illumination microscopy (4I-SIM), which e xplicitly treats OS as a problem of 3D transfer-function engineering within a standard 2D-SIM acquisition framew ork. 2.2 Four-beam interference and async hronous phase encoding f or O TF engineering Guided by the 3D OTF reinterpretation of SIM, 4I-SIM employs coherent four-beam interference to actively engineer the frequency content of the illumination field (Fig. 1 a2). In contrast to con ventional two-beam SIM, four-beam interference generates a composite structured illumination pattern containing multiple spatial-frequency components with distinct axial transfer characteristics (Fig. 1 b2). The resulting illumination spectrum ˜ D can be expressed in the frequency domain as a superposition of zero-, first-, and second-order components: ˜ D ( k ) = O ( k ) ˜ S 0 ( k ) + ∑ i = ± 1 m 1 u , v 2 O ( k ) ˜ S i [ k − i · ( k u ± k v )] + ∑ i = ± 2 m 2 u , v 2 O ( k ) ˜ S i [ k − i · k u , v )] (2) where k denotes the spatial-frequency vector , O ( k ) and ˜ S ( k ) represent the object spectrum and the system O TF , respectively , the index i represents the i -th spectral order , k u and k v are the spatial wa ve vectors of the horizontal and vertical illumination patterns, and m i u , m i v denote the modulation depth for the i -th spectral order in the horizontal and axial directions, respectively . Among these spectral distributions, second-order components function similarly to C ± 1 Conv . in con ventional illumination, primarily extending lateral frequency support nearly twofold, as shown in Fig. 1 c1. Although the first-order components provide only ∼ 1 . 4 × lateral resolution enhancement, they partially fill in the diagonal spectral gaps left by the synthetic second-order components, impro ving the uniformity of lateral resolution across the entire field (Figs. 1 c2 and 1 c3). Importantly , the first-order components exhibit enhanced axial sensiti vity from the perspecti ve of the 3D O TF (Figs. 1 c2 and 1 c3). As a result, the four-beam interference pattern simultaneously provides frequency components that fa vor lateral SR and components that compensate for the axial missing cone. This complementary axial-lateral frequency distribution forms the basis for intrinsic OS within a standard 2D SIM acquisition. More technical details are provided in Supplementary Note S3, Supplementary Figs. S1c-S1e and Supplementary V ideo S1. T o reliably separate the multiple frequency components generated by four-beam interference, 4I-SIM adopts an asynchronous phase-encoding strategy (detailed in Supplementary T able S1). Unlike conv entional SIM, which employs synchronized phase stepping across all illumination components, asynchronous phase shifting decouples the phase ev olution of different beam pairs, increasing the di versity of frequency encoding without increasing the number of ra w images. The phase-modulated raw images can be written in matrix form as: ˜ D n ( k ) = 1 m 1 u e − j ( ϕ u − ϕ v + ϕ 1 u ) / 2 m 1 u e j ( ϕ u − ϕ v + ϕ 1 u ) / 2 m 1 v e − j ( ϕ u + ϕ v − π + ϕ 1 v ) / 2 m 1 v e j ( ϕ u + ϕ n − π + ϕ 1 v ) / 2 m 2 u e − j ( 2 ϕ u − π + ϕ 2 u ) / 2 m 2 u e j ( 2 ϕ u − π + ϕ 2 u ) / 2 m 2 v e − j ( 2 ϕ v − π + ϕ 2 v ) / 2 m 2 v e j ( 2 ϕ v − π + ϕ 2 v ) / 2 T O ( k ) ˜ S 0 ( k ) O ( k ) ˜ S − 1 [ k + ( k u − k v )] O ( k ) ˜ S + 1 [ k − ( k u − k v )] O ( k ) ˜ S − 1 [ k + ( k u + k v )] O ( k ) ˜ S + 1 [ k − ( k u + k v )] O ( k ) ˜ S − 2 ( k + 2 k u ) O ( k ) ˜ S + 2 ( k − 2 k u ) O ( k ) ˜ S − 2 ( k + 2 k v ) O ( k ) ˜ S + 2 ( k − 2 k v ) (3) 3/ 23 where T denotes the transpose operation, n represents the image sequence index, where n ∈ { 1 , 2 , . . . , 9 } , ϕ u and ϕ v are the phase shifts of the horizontal and vertical illumination patterns, respecti vely (values tak en from Supplementary T able S1), and ϕ 1 , 2 u , v denote the initial phases corresponding to dif ferent modulation orders. By combining the set phase shifts ϕ u and ϕ v , the illumination parameter estimation method based on principal component analysis (PCA) 38 allows for the accurate retrie v al of experimental parameters such as wa ve vectors, initial phases, and modulation depths, thus enabling precise spectral separation through matrix in version (detailed in Supplementary Notes S3 and S4). This asynchronous encoding strategy enables rob ust spectral separation using a standard nine-frame acquisition, equiv alent to con ventional 2D SR-SIM. By permitting larger phase increments and relaxing phase synchronization constraints, the approach improv es numerical stability and reduces sensiti vity to phase errors, while preserving compatibility with existing SIM hardware. From the perspecti ve of O TF engineering, asynchronous phase encoding ensures that the enriched frequenc y components generated by four-beam interference are faithfully separated and preserved for subsequent reconstruction. T ogether , four-beam interference and asynchronous phase encoding establish a flexible and ef ficient mechanism for reshaping the effecti ve 3D O TF without resorting to volumetric illumination or axial scanning. 1 st - order s pe c tr um 0 th - order s p e c trum 2 nd - order s pe c tr um d1 d2 c1 c2 c3 WF WF C on v en ti o n a l S IM k x k y k x k x ’ k y k x k y 4I - S IM k z 2 k S up po r t of the 2 nd - orde r s pe c tr um M i s s i n g c o n e k z k x ’ 1.4 k Fi l l e d m i s s i n g c o n e k x k z 2 k Fi l l e d m i s s i n g c o n e k x S up po r t of the 1 st - order s pe c tr um S up po r t of the 4I - S IM s pe c tr um O BJ FFT FFT a1 a2 b1 b2 Sa m p l e 1 st - o rd e r s p e c tru m 1 st - or der spect r um 2 nd - order s p e c t r u m a b 2 D OT F 2D O T F Fig. 1. Schematic illustration of the 4I-SIM principle. a1 T wo-beam interference configuration in con ventional 2D SR-SIM. a2 Four -beam interference configuration in 4I-SIM. b1 The initial illumination image and its spectrum map in con ventional 2D SR-SIM. b2 The initial illumination image and its spectrum map in 4I-SIM. c The support regions of dif ferent modulated spectral components in 4I-SIM, including the second-order spectral support region which suffers from the missing-cone ef fect ( c1 ), the first-order spectral support region where the missing cone is filled ( c2 ), and the combined support region of both first- and second-order components ( c3 ). d W orkflow of the frequenc y-domain composite filtering strategy constrained by the 3D O TF , where d1 shows the ef fectiv e 2D OTF applied to the first-order spectral components, used to construct a W iener filter that enhances the axial response, and d2 shows the ef fecti ve 2D O TF applied to the second-order spectral components, used to construct a W iener filter that suppresses low-frequenc y components in the missing-cone region. 2.3 3D O TF-informed optimal frequency-weighting reconstruction frame work Follo wing spectral separation, the central challenge of 4I-SIM reconstruction lies in ho w the extracted frequenc y components are optimally combined to achiev e both high lateral fidelity and robust OS. In con ventional SR-SIM, spectral recombination is commonly performed using generalized W iener filtering, in which dif ferent frequency components are weighted according 4/ 23 0 50 100 150 200 250 300 X /P ix e l 0 100 200 In te nsity 0 .2 0 0 .4 0 .6 0 .8 Con tra st( a .u .) WF 1s t 2nd S IM 4I 120 80 160 rFRC reso lut ion /n m Me an v al ue Me an v al ue 0 .0 1 0 0 .0 2 RSM( a .u .) 1 m WF a c 4I - S IM b1 b2 b3 b4 b5 b6 d e f WF GT Con v . S IM 4I - S IM - 1 st 4I - S IM 0. 5 m 4I - S IM - 2nd 1 st 2nd Fig. 2. Comparative simulations on standard structural samples with out-of-f ocus signals. a Comparison of the wide-field image and the super-resolution image obtained by 4I-SIM. b Magnified wide-field image and super -resolution images from the blue boxed re gions in a obtained by different methods (first-order spectrum reconstruction of 4I-SIM, second-order spectrum reconstruction of 4I-SIM, conv entional SR-SIM, 4I-SIM and the ground truth). c Fluorescence intensity profiles along the white line in b . d Comparison of local image contrast between the wide-field image and super-resolution images obtained by different methods. e Comparison of rFRC lateral resolution distributions between super -resolution images obtained by different methods. f Comparison of RSM distributions between super -resolution images obtained by different methods. ‘WF’ represents ‘wide-field’, ‘GT’ means ‘ground truth’, ‘1st’ and ‘2nd’ are the first- and second-order spectrum reconstructions of 4I-SIM respectiv ely , ‘Conv . SIM’ / ‘SIM’ here specifically refers to the conv entional SR-SIM, and ‘4I’ means ‘4I-SIM’.A two-tailed paired Student’ s t -test was performed on the contrast values in d , with **** indicating p < 0 . 0001. Each simulation was independently repeated ten times with consistent results. Colored arrows highlight regions with significant reconstruction differences. Scale bars: 1 µ m ( a ); 500 nm ( b ). to their corresponding 2D O TF responses. While effecti ve for lateral SR, this strategy becomes suboptimal when applied to 4I-SIM. From the 3D O TF perspectiv e, the limitation of Wiener -based fusion arises from the projection of volumetric frequency content onto the lateral frequency plane. As discussed abov e, the effecti ve 2D O TF is obtained by inte grating the 3D O TF along the axial frequency dimension (Eq. 1 ), causing frequency components originating from the axial missing-cone region to be disproportionately mapped onto the central region of the 2D frequenc y plane. Consequently , con v entional W iener filtering assigns relativ ely large weights to frequency components af fected by missing-cone deficiencies, while underweighting components that intrinsically compensate for axial-frequency loss. This mismatch leads to inef fectiv e OS and residual out-of-focus background. In contrast, 4I-SIM treats reconstruction as an optimal frequency-selection problem informed by the 3D O TF . Rather than assigning weights solely based on lateral frequency magnitude, the reconstruction explicitly accounts for the axial transfer characteristics of each spectral component. As illustrated in Extended Data Figs. 1 a1 and 1 b1, both the zeroth- and second-order spectral components suf fer from missing-cone deficiencies in the 3D O TF , and their corresponding projections onto the 2D Fourier plane should, in principle, be suppressed. Ho wev er , these projected components coincide with regions where the effecti ve 2D O TF exhibits relati vely strong responses (Extended Data Figs. 1 c1). Consequently , the application of an in v erse spectral operator whose spatial support matches that of the effecti ve 2D O TF enables targeted suppression of the undesired 5/ 23 projected components (Fig. 1 d1). In contrast, the first-order spectral components, which are responsible for compensating the missing cone, are associated with projected effecti ve 2D O TFs that exhibit markedly weaker responses (Extended Data Figs. 1 a2- 1 c2). Therefore, the same spectral operation naturally preserves these components to enhance the axial response (Fig. 1 d2). As a result, frequency components that compensate for the missing cone are selectiv ely emphasized, whereas components dominated by projected out-of-focus contributions are attenuated. This optimal frequency-weighted reconstruction can be expressed in the frequenc y domain as: M ( k ) = C mis . ( k xy ) ˜ h ∗ mis . ( k xy ) ˜ h mis . ( k xy ) 2 + w 2 + C com . ( k xy ) ˜ h ∗ com . ( k xy ) ˜ h com . ( k xy ) 2 + w 2 (4) where C and ˜ h denote the frequency-shifted spectral components with the modulation depth and initial phase terms remov ed and their corresponding effecti ve 2D O TFs, respectiv ely , the subscripts mis . and com . indicate the components affected by the missing-cone deficiency (zeroth- and second-order spectra) and those compensating for the missing cone (first-order spectra), respectiv ely , and w is the W iener constant (regularization parameter) set empirically . Importantly , the complementary projection characteristics of these two classes of spectral components allow the ef fectiv e 2D O TFs to act as intrinsic weighting functions, enabling physically consistent suppression of out-of-focus contributions while reinforcing axial-frequency information (Supplementary Fig. S2). Unlike empirical fusion strategies that rely on manually tuned frequenc y weights 14 , 34 , the proposed reconstruction frame work determines spectral contrib utions based on the physical constraints imposed by the 3D OTF , pro viding improv ed robustness and generalizability across di verse imaging conditions (Supplementary Note S5 and Supplementary Figs. S3-S4). T ogether , this 3D O TF-informed optimal frequency-weighted reconstruction framew ork completes the 4I-SIM pipeline by fully exploiting the enriched frequency encoding established by four -beam interference and asynchronous phase encoding, enabling intrinsic OS alongside high lateral SR within a standard 2D-SIM acquisition. 2.4 Numerical simulations to demonstrate the superior comprehensive perf ormance of 4I-SIM in terms of lateral super-resolution, optical sectioning, and reconstruction fidelity T o e valuate the performance of 4I-SIM, we constructed an ideal 3D two-layer fluorescence model comprising 512 × 512 × 9 vox els (vox el size 65 × 65 × 200 nm 3 ). W e positioned a standard high-contrast 2D resolution image in the first layer , defined as the in-focus distrib ution ρ 0 ( x , y ) , to establish the dominant high-frequenc y information and directional characteristics of the image; simultaneously , we rotated the image by π / 2 and placed it in the ninth layer (corresponding to a 1600 nm axial shift) to simulate the background distribution ρ 1 ( x , y ) . Subsequently , we conv olved this ground truth with a 3D point spread function ( N A = 1 . 45 , λ = 561 nm). Since the axial separation of 1 . 6 µ m significantly exceeds the depth of field, the con volution operation ex erted a strong low-pass filtering effect on the upper -layer signal, causing it to manifest at the focal plane solely as a lo w-frequency background with specific directional characteristics, without introducing interfering high-frequency components. As illustrated in Figs. 2 a- 2 c, both the con ventional SR-SIM and the second-order spectrum reconstruction of 4I-SIM achieve significant lateral resolution enhancement, clearly resolving the denser features near the center of the grating pattern (indicated by blue arrows). Howe ver , these reconstructions are adversely af fected by defocused background signals, especially in regions highlighted by the orange arro ws. In contrast, the first-order spectrum reconstruction pro vides superior OS capability b ut limited resolution improv ement. By integrating the first- and second-order spectral components, the 4I-SIM reconstruction attains a balance between enhanced lateral resolution and ef fectiv e suppression of defocused background signals. T o quantitati vely assess sectioning performance, local contrast ratios were calculated for each method (Fig. 2 d). The results demonstrate that 4I-SIM significantly outperforms other methods in this re gard. Additionally , Fig. 2 e presents lateral resolution distributions obtained via rolling F ourier ring correlation (rFRC) measurements 39 , sho wing that 4I-SIM achie ves resolution improv ements comparable to con ventional SR-SIM, with mean rFRC resolutions of 104.822 nm and 103.021 nm respecti vely , corresponding to 1.88 × and 1.90 × resolution enhancement, respectiv ely . T o further ev aluate reconstruction fidelity , we calculated the resolution-scaled error map (RSM) distrib ution shown in Fig. 2 f, where 4I-SIM demonstrates the best structural fidelity among the compared methods. These results collectively indicate that 4I-SIM achiev es superior overall performance by balancing SR and OS, thereby enhancing the reconstruction quality for thick specimen imaging. 2.5 Comparative experiments to demonstrate the superior reconstruction capability of 4I-SIM T o v alidate the practical performance of 4I-SIM, a custom SIM system using four-beam interference-based composite structured illumination was constructed (see Supplementary Fig. S5 for system details). This platform enabled subsequent systematic comparisons between 4I-SIM and various SR and OS strate gies. W e first imaged a fixed BP AE cell sample with the nucleus, actin filaments, and mitochondria labeled by DAPI, Alexa Fluor TM 568, and MitoT racker TM Green FM, respectiv ely . As shown in Figs. 3 a- 3 c, the two enlarged regions of interest exhibit substantial out-of-focus background, which is effecti vely suppressed by the first-order spectrum reconstruction of 4I-SIM thanks to its compensation for the O TF missing cone. Although the second-order spectrum reconstruction yields higher 6/ 23 X / P i x e l d1 WF 4I - S I M a 5 m b2 4I - SIM - 1 s t b3 4I - SIM - 2nd b1 WF 0 .5 m c2 4I - SI M - 1 s t c3 4I - SI M - 2nd b4 C o n v . SIM c4 C o n v . SI M b5 4I - SIM c5 4I - SI M WF 0 .3 m c1 r F R C r e s o l u t i o n / n m 120 160 200 80 f M e a n v a l u e C o n t r a s t ( a . u .) 0 .2 0 . 5 0 . 8 1 . 1 e WF 1s t 2nd SI M 4I I n t e n s i t y 100 200 0 20 40 0 10 20 30 0 I n t e n s i t y d2 0 100 200 X / P i x e l 4I 4I - SIM iS I M W L R C o n v . SIM D a r k WF D a r k Me a n : 1 0 6 . 7 n m Min : 7 4 . 8 n m Ma x : 2 7 2 . 3 n m rFRC:0 .4 2 9 9 4I Me a n : 1 0 3 . 1 n m Min : 7 4 . 8 n m Ma x : 2 2 6 . 2 n m rFRC:0 .3 8 5 2 iS I M M e a n : 1 2 1 .1 n m Min : 7 4 . 8 n m Ma x : 2 5 1 . 4 n m rFRC : 0 .8 4 1 8 0 . 2 0 . 7 1 . 2 1 . 7 Con tra s t ( a . u .) WF W L R i SIM Dark SIM 4I WF W L R i S I M D a r k S IM 4I g h1 h2 h4 h3 h6 h5 i2 i3 i4 j W L R Me a n : 1 3 2 . 2 n m Min : 7 4 . 8 n m Ma x : 2 5 1 . 4 n m rFRC : 1 .1 5 7 1 i1 r FR C m a p 50 100 150 200 250 (nm ) r FR C m a p 50 100 150 200 250 (n m ) r FR C m a p 50 100 150 200 250 (n m ) r FR C m a p 50 100 150 200 250 (n m ) WF W L R i SIM D a r k 4I m W L R i S I M D a r k S I M 4I 5 m 0. 5 m W L R i S I M D a r k 4I l 80 120 160 200 M e a n v a l u e rFRC re s o l u ti o n /n m 0 0 . 0 1 0 . 0 2 RSM ( a .u .) WF W L R D a r k iS I M SIM 4I In te n s i ty 0 100 200 k 5 10 15 20 25 30 X /Pi x e l 0 . 0 3 M e a n v a l u e WF 1 s t 2nd SIM 4I WF Fr . S e c . SIM 4I 7/ 23 Fig. 3. Comparative experiments on fixed BP AE cell samples. a Comparison between wide-field and 4I-SIM super-resolution images of mitochondria, actin filaments, and nuclei in BP AE cells. The raw images were acquired at 1024 × 1024 pixel resolution using a 100 × oil-immersion objectiv e (UPlanXApo 100/1.45 Oil, Olympus, Japan). For easy distinguishing, we show the mitochondria, actin filaments and nucleus in red, green and blue, respecti vely . b, c Magnified wide-field and super-resolution images from the blue (mitochondria) and yello w (actin filaments) boxed regions in a obtained by different methods (first-order spectrum reconstruction of 4I-SIM, second-order spectrum reconstruction of 4I-SIM, con ventional SR-SIM and 4I-SIM). d Fluorescence intensity profiles along the white lines in b and c . e Comparison of local image contrast between the wide-field image and super-resolution images obtained by dif ferent methods. f Comparison of rFRC lateral resolution distributions between super -resolution images obtained by different methods. g Comparison between wide-field and 4I-SIM super-resolution images of mitochondria in BP AE cells. h Magnified wide-field and super-resolution images from the blue boxed re gions in g obtained by different methods (con ventional SR-SIM, WLR-SIM 31 , iSIM 32 , Dark-SIM 35 and 4I-SIM). i Comparison of rFRC resolution maps between super-resolution images obtained by dif ferent methods. j Comparison of local image contrast between the wide-field image and super-resolution images obtained by different methods. k Fluorescence intensity profiles along the white line in h . l Comparison of rFRC lateral resolution distributions between super-resolution images obtained by dif ferent methods. m Comparison of RSM distributions between super-resolution images obtained by different methods. A two-tailed paired Student’ s t -test was applied to contrast values in j , with **** indicating p < 0 . 0001. Each experiment was independently repeated ten times with consistent results. Colored arro ws mark regions with significant reconstruction dif ferences. Scale bars: 5 µ m ( a , g ); 500 nm ( b , h ); 300 nm ( c ). spatial resolution comparable to conv entional SR-SIM, it remains susceptible to defocus-induced artifacts. In contrast, 4I-SIM, integrating all spectral orders, simultaneously eliminates background artifacts and preserv es high lateral resolution, as further supported by the fluorescence intensity profiles of mitochondria and actin filaments (Fig. 3 d). W e also ev aluated the image contrasts and rFRC resolutions across dif ferent methods, as illustrated in Figs. 3 e and 3 f. Quantitativ e contrast analysis (Fig. 3 e) confirms the superior OS capability of 4I-SIM, which outperforms first-order reconstruction alone after the application of composite frequency-domain filtering that fully exploits spectral components with strong axial responses. Regarding resolution, the rFRC resolution distributions in Fig. 3 f indicate that 4I-SIM achieves a lateral resolution of 100.876 nm, which is slightly lo wer than that of conv entional SR-SIM (101.334 nm). Additional comparativ e experiments on BP AE cells with different tar get configurations further confirmed that 4I-SIM yields superior SR image quality (Supplementary Figs. S6a and S6b). W e also extended the comparison to other samples, including a fix ed autofluorescent roundw orm sample collected with our experimental setup (Supplementary Figs. S6c and S6d) and microtubules in COS-7 cells (Extended Data Fig. 2 ). Across all these datasets, 4I-SIM consistently deliv ered higher-quality SR reconstructions with enhanced OS. W e subsequently compared 4I-SIM with other SIM v ariants optimized for thick-sample imaging, including WLR-SIM 31 , iSIM 32 , and Dark-SIM 35 . The reconstruction results obtained using these techniques are shown in Figs. 3 g- 3 m. While all methods exhibit varying degrees of SR and OS capabilities, each suffers from specific limitations—WLR-SIM shows constrained resolution, iSIM may introduce slight fidelity loss, and Dark-SIM enhances contrast but o verlooks finer structural features. In contrast, 4I-SIM re veals mitochondrial features with sharper boundaries and reduced background (Fig. 3 h), and exhibits a more uniform and refined resolution distrib ution across the field, as visually observ ed in the rFRC maps (Fig. 3 i). Further quantitati ve e valuations, including image contrast, rFRC resolution, and RSM distrib ution (Figs. 3 j- 3 m), demonstrate that 4I-SIM deliv ers superior ov erall performance in terms of spatial resolution, OS strength, and reconstruction fidelity . 2.6 Experiments to demonstrate the volumetric ima ging capability of 4I-SIM in thick biological specimens The excellent OS and SR capabilities of 4I-SIM make it well-suited for volumetric imaging of thick biological samples, which can be readily achieved by incorporating axial scanning into the imaging process. T o validate this, we integrated a nanometer-precision z -axis translation stage into our custom-built imaging system and performed sequential layer-by-layer scanning of a thick BSC-1 cell sample (with Alexa Fluor T M 555-labeled microtubules). At each axial position, 4I-SIM reconstruction was carried out accordingly to generate a volumetric result of the sample. As shown in Fig. 4 a, 4I-SIM resolves microtubule netw orks across the entire 3D volume with clear structural delineation across depth. The bottom panel compares the x − z slices of wide-field and 4I-SIM results along the blue dashed line, re vealing significantly enhanced axial resolution and reduced background in the 4I-SIM image. Based on the rFRC method, the mean rFRC axial resolution of 4I-SIM w as measured to be 336.2 nm, representing a 1.59-fold improvement o ver the 534.6 nm resolution achiev ed by wide-field imaging. T o assess performance across depth, we analyzed three specific axial planes (Slices 12, 28, and 38, as illustrated in Figs. 4 b- 4 d). 4I-SIM consistently rev eals fine microtubule filaments with high clarity , while conv entional SR-SIM exhibits elev ated background and defocus-induced reconstruction artifacts. Quantitativ e comparisons of image contrast (Fig. 4 e), lateral resolution (Fig. 4 f), and reconstruction fidelity (Fig. 4 g) further confirm the advantages of 4I-SIM, which achiev es higher contrast, finer resolution 8/ 23 WF S IM 4I 0 0. 5 1. 0 1. 5 2. 0 Con tra st( a .u .) WF S IM 4I b1 b2 b3 c1 d1 c2 c3 4I - S IM d3 4I - S IM 4I - S IM 4I - S IM S li ce 1 2 S li ce 2 8 S li ce 3 8 Con v . S IM 4I - S IM Con v . S IM 4I - S IM 4I - S IM Co n v . S IM 10 m 0 .3 m 0. 3 m 4I1 4I2 4I3 S IM1 S IM2 S IM3 M e a n v a lue 80 120 160 200 rF RC reso lut ion /n m 4 I1 4I2 4I3 S IM1 S IM2 S IM3 0 0. 01 0. 02 0. 03 RSM( a .u .) M e a n v a lue 0. 04 e f g S li ce 1 2 S li ce 2 8 S li ce 3 8 S li ce 1 2 S li ce 2 8 S li ce 3 8 a 0 .3 m 7.5 Dept h ( m) 0 x z 4I M e a n rF RC a x ial reso lut ion : 3 3 6 n m x WF z M e a n rF RC a x ial reso lut ion : 5 3 3 n m Sli ce 16 5 m S li ce 4 4 S li ce 4 4 2 m 4I 5 m x oy x o z x o z WF 4I 4I WF WF 4I x o z x o z 4I WF S li ce 5 4I 4I WF WF S li ce 1 1 S li ce 1 6 1 m WF WF 4I x o z x o z WF 4I S li ce 3 6 S li ce 3 6 3 m 4I WF h i j 9/ 23 Fig. 4. Comparative experiments on volumetric imaging acr oss different thick samples. a Comparison of wide-field and 4I-SIM super-resolution images of the entire 3D field of vie w of a fixed BSC-1 cell sample. The bottom panel shows the x - z slices of the wide-field and super -resolution images along the blue dashed line. The raw images were captured at a resolution of 1024 × 1024 pixels using a 100 × oil-immersion objectiv e (UPlanXApo 100/1.45 Oil, Olympus, Japan). b Super-resolution images obtained by 4I-SIM from different axial slices (slices 12, 28, and 38) in a . c Magnified super-resolution images from the blue boxed re gions in b obtained by con ventional SR-SIM. d Magnified super-resolution images from the blue box ed regions in b obtained by 4I-SIM. e Comparison of local image contrast between the wide-field image and super -resolution images obtained by different methods. f Comparison of rFRC lateral resolution distributions between super -resolution images obtained by different methods. g Comparison of RSM distributions between super -resolution images obtained by different methods. h Comparison between wide-field and 4I-SIM super-resolution images at dif ferent axial slices of a fixed COS-7 cell sample. For easy distinguishing, we sho w the microtubules, actin filaments and nucleus in yello w , magenta, and blue, respectiv ely . i Comparison of wide-field and 4I-SIM super-resolution images of the entire 3D field of view of a fix ed autofluorescent roundworm sample. j Comparison of wide-field and 4I-SIM super-resolution images of the entire 3D field of view of a fix ed autofluorescent geranium leaf cross-section. In f and g , the numbers following ‘4I’ and ‘SIM’ indicate the corresponding results in b n . A two-tailed paired Student’ s t -test was applied to contrast values in e , with **** indicating p < 0 . 0001. All experiments were independently repeated ten times with consistent results. Colored arrows indicate regions with significant differences in image reconstruction. Scale bars: 5 µ m ( a , h - j ); 10 µ m ( b ); 300 nm ( c , d ). Scale on z -axis: 50 slices, 150 nm per slice ( a ); 20 slices, 150 nm per slice ( h ); 130 slices, 150 nm per slice ( i ); 70 slices, 150 nm per slice ( j ). (with a mean rFRC lateral resolution of 103.4 nm, approximately a 1.91-fold improvement o ver wide-field imaging), and better reconstruction consistency (lower RSM) across all depths. Furthermore, we applied 4I-SIM to additional thick biological specimens, including COS-7 cell sample (Fig. 4 h), autofluorescent roundworm sample (Fig. 4 i), autofluorescent geranium leaf cross-section (Fig. 4 j), autofluorescent ascaris suum fertilized eggs sample (Extended Data Fig. 3 a), chlamydomonas sample (Extended Data Fig. 3 b), mouse brain section (Extended Data Fig. 3 c), and mouse kidney section (Extended Data Figs. 3 d). Supplementary V ideos S2-S8 show 3D volumetric renderings of these specimens. These results collectiv ely confirm that 4I-SIM enables robust and high-quality v olumetric imaging across a wide range of thick biological specimens. 2.7 Dynamic super-resolution ima ging of mitochondria in live HeLa cells under complex biological condi- tions using 4I-SIM Unlike fixed specimens, liv e-cell imaging imposes substantially greater demands on OS and reconstruction fidelity due to complex 3D architectures, imperfect labeling, and dynamically v arying background scattering 40 – 45 . Under these conditions, con ventional SIM often suf fers from se vere defocus contamination and background accumulation, leading to unstable recon- structions and unreliable interpretation of dynamic subcellular processes, as seen in Supplementary Fig. S7. In this context, 4I-SIM provides a rob ust imaging solution that maintains OS and SR performance under complex li ve-cell conditions, without relying on optimized labeling density or background suppression heuristics, as demonstrated by the experimental results acquired with 4I-SIM on mitochondrial dynamics in li ve HeLa cells labeled with PK Mito Red, where distinct mitochondrial behaviors were clearly observed (Fig. 5 ). As illustrated in Figs. 5 a and 5 b, a highly motile mitochondrion (green arro w) was observed migrating between tw o elongated, parallel-aligned mitochondria (0 s-109 s), where it rapidly fused upon contact. It was then fully incorporated into the fused structure, forming a continuous mitochondrial filament (207 s). At 274 s, a distinct fission ev ent occurred at the original fusion site, indicating a dynamic remodeling process in which motile mitochondria contribute to network fusion and subsequently undergo regulated fission. Figure 5 c provides a clear visualization of another mitochondrial remodeling ev ent. At 9 s, the mitochondrion indicated by the pink arrowhead appeared as an isolated structure. At 94 s, it gradually extended tow ard and fused with the adjacent mitochondrial network. Shortly thereafter , between 236 s and 254 s, a fission ev ent occurred at the fusion site, leaving the mitochondrion again as an isolated structure. Figure 5 d presents additional representati ve remodeling and fission e vents. At 0 s, the indicated mitochondrion (blue arrow) appeared as an extended tubular structure. Between 74 s and 183 s, it gradually retracted and merged into the main network, leaving behind a detached punctate structure. At 224 s, a visible break occurred at the narro w junction between a ring-like structure and the main network, suggesting that mitochondrial fission preferentially occurs at structurally constrained or transitional regions. Figures 5 e- 5 h highlights div erse mitochondrial remodeling behaviors. In one instance, a ring-shaped mitochondrion gradually extended a tubular projection that detached from the parent and ultimately fused with a neighboring network (Fig. 5 f). In another , a mitochondrion initially exhibited a coiled morphology , which progressively straightened into an elong ated, extending structure (Fig. 5 g). Additionally , a fission e vent occurred at a network junction, gi ving rise to an isolated fragment that subsequently adopted a constricted, curled shape (Fig. 5 h). These dynamic processes re veal the intricate regulation of mitochondrial morphology associated with metabolic adaptation, quality control, and structural reorganization 46 – 50 . Since 10/ 23 WF 4I - SI M T ime : 0 s 4I - SI M T ime : 0 s WF T i m e: 109 s 5 μ m T ime : 0 s T ime : 0 s T i m e: 39 s T i m e: 207 s T i m e: 274 s T ime : 9 s T i m e: 94 s T i m e: 236 s T i m e: 254 s WF a b1 b2 b3 b4 b5 b6 4I - SI M 4I - SI M 4I - SI M 4I - SI M 4I - SI M T ime : 9 s 4I - SI M 4I - SI M 4I - SI M 4I - SI M WF c1 c2 c3 c4 c5 WF 4I - SI M 4I - SI M 4I - SI M 4I - SI M 4I - SI M d1 d3 d2 d4 d5 d6 T ime : 0 s T ime : 0 s T i m e: 74 s T i m e: 124 s T i m e: 183 s T i m e: 224 s e T ime : 0 s T i m e: 76 s T ime : 0 s T i m e: 206 s T i m e: 127 s T i m e: 98 s 4I - SI M 4I - SI M 4I - SI M 4I - SI M 4I - SI M WF f 1 f 4 f 3 f 5 f 2 f 6 T ime : 0 s T ime : 0 s T i m e: 160 s T i m e: 110 s T ime : 0 s T i m e: 54 s T i m e: 34 s T ime : 0 s 4I - SI M 4I - SI M 4I - SI M WF WF 4I - SI M 4I - SI M 4I - SI M g1 g4 g3 g2 h1 h1 h1 h1 5 μ m 1 μ m 2 μ m 1 μ m 2 μ m 1 μ m 1 μ m Fig. 5. Super-r esolution reconstruction r esults of mitochondria in live HeLa cells at differ ent time points. a , e Comparison of wide-field and 4I-SIM reconstructed super-resolution images. The raw images were acquired at 1024 × 1024 pixel resolution using a 100 × oil-immersion objectiv e (UPlanXApo 100/1.45 Oil, Olympus, Japan). b , h Time-lapse super-resolution images of the green box ed regions in a and e , respecti vely . c , g Time-lapse super -resolution images of the yellow box ed regions in a and e , respecti vely . d , f T ime-lapse super-resolution images of the blue boxed re gions in a and e , respectiv ely . Scale bars: 5 µ m ( a , e ); 1 µ m ( b , d , g , h ); 2 µ m ( c , f ). 4I-SIM requires the same number of raw images as conv entional 2D-SIM and is compatible with PCA-based parameter estimation, it achiev es a reconstruction efficienc y comparable to PCA-SIM 38 , enabling real-time imaging at ∼ 30 Hz. The complete time-lapse videos are provided in Supplementary V ideos S9 and S10. T ogether , these results demonstrate that 4I-SIM enables reliable SR imaging of dynamic mitochondrial remodeling in liv e cells under conditions where conv entional SIM fails due to insufficient OS. 2.8 In vestigating mitochondrial structure and function under high-glucose conditions using 4I-SIM Beyond con v entional mitochondrial dynamics imaging, 4I-SIM is also capable of tackling more complex biological scenarios. One such scenario in volves in vestigating mitochondrial responses under prolonged high-glucose conditions, which significantly affect cellular physiology . As the central hub of cellular energy and metabolism, mitochondria have been regarded as key targets for high-glucose-induced damage 51 – 56 . Under such pathological states, the level of reactiv e oxygen species deriv ed from mitochondria (mtR OS) is significantly elev ated, the results of which oxidativ e stress responses and apoptosis factors are activ ated dramatically . W e conducted the response of oxidativ e stress and the classical signaling pathway in high-glucose en vironments (Fig. 6 a). Lipotoxicity is initiated when glycolysis proceeds under high-glucose conditions and the mitochondrial respiratory-chain complexes are drastically remodeled. The explosi ve micro-molecule, R OS and inflammatory mediators, activ ates the NF- κ B pathway . The upstream regulators such as T AK1 and the IKK complex are eng aged, provoking cellular injury and fragmentation of the mitochondrial network. Phosphorylation of the downstream target I κ B can transiently restrain this damage, b ut once the homeostatic balance is lost the cell is funneled into an irre v ersible fate such as apoptosis or autophagy . T o in vestigate these mitochondria mechanisms under high-glucose conditions, we employed 4I-SIM to dynamically monitor mitochondrial structure and function changes under high-glucose conditions in vi vo, providing ne w insights into the pathophysiology of metabolic disorders. Firstly , cell viability was detected by the CCK-8 kit, which showed a mark ed reduction 11/ 23 m1 C G1 m2 C G2 g Tim e : 9 s Tim e : 1 1 3 s Tim e : 3 2 s Tim e : 9 s i1 i3 i2 i4 WF 4I 4I 4I h1 h2 h3 h4 WF 4I 4I 4I Tim e : 1 2 3 s Tim e : 7 3 s Tim e : 3 7 s Tim e : 3 7 s k1 k2 k3 k4 WF 4I 4I 4I Tim e : 9 2 s Tim e : 6 1 s Tim e : 0 s Tim e : 0 s j WF 4I 4I WF Tim e : 0 s Tim e : 0 s Tim e : 1 4 s Tim e : 9 0 s Tim e : 3 5 s Tim e : 1 4 s l1 l3 l2 l4 WF 4I 4I 4I m3 EG1 n1 n2 n3 n4 C G1 C G 1 C G2 CG2 m4 EG2 n5 n6 n7 n8 E G1 E G1 E G2 E G2 M it o . A s p e c t R a t io ( a . u .) 2 . 0 4 . 0 6 . 0 8 . 0 0 o2 M a x M it o . N e t w o r k A r e a / × 1 0 ³ p ix e ls 0 4 8 12 16 20 o3 M a x M it o . N e t w o r k J u n c t ion s ( c o u n t ) 0 100 200 300 o4 0 . 3 0 . 4 0 . 5 0 . 6 A v g . R e lat iv e M it o . I n t e n s it y ( a . u .) o5 0 25 50 R e lat iv e M it o . I n t e n s it y D e c r e a s e ( % ) o6 5 10 15 20 25 A v g . B r a n c h e d M it o . L e n g t h / o1 5 m 5 m 1 m 1 m 1 m 1 m p 0 200 400 600 800 1k 0 200 400 600 800 1k FS C - H SSC - H PI q1 10 0 10 1 10 2 10 3 10 4 10 0 10 1 10 2 10 3 10 4 A n n e x in V - FI TC CG q 2 10 0 10 1 10 2 10 3 10 4 10 0 10 1 10 2 10 3 10 4 PI A n n e x in V - FI TC EG f2 EG 20 m d2 BF EG e2 DC F H - DA EG 10 m f1 CG d1 BF CG 100 m e1 D C F H - DA CG Gr o u p 0 0 .2 0 .4 0 .6 A vg . flu o r e sce n ce int e n sity ( a . u ) 0 .8 1 .0 c Con ce n tr a tio n ( m M ) 0 20 40 60 80 100 120 Rela tive P h o to n A b so r p tio n ( % ) b Hi g h Glu co se IK K IK K IK K IK K Com p lex M ito ch o n d r ial Resp ir a to r y Cha in Co m p l e x Ⅰ Com p l e x Ⅱ Com p l e x Ⅲ P P P G ly co ly sis A p o p to sis/A u to p h a g y O x ida tive S tr e ss I n h ib itio n Q uies c ent ROS Hi g h G luco se L ipo to x ici ty a - + 12/ 23 Fig. 6. Super-r esolution imaging analysis of mitochondria in live human myofibr oblasts under high-glucose conditions. a Response mechanism of oxidativ e stress and NF- κ B signaling pathway under high glucose en vironment. b High-glucose concentration was assayed by CCK-8 kit. c A verage fluorescence intensity of the DCFH-D A probe at dif ferent groups. d Cell morphology at different groups w as detected by bright-field microscopy (20 × ). e The expression of R OS was imaged by confocal microscopy (20 × ). f Magnified images of the regions marked with boxes in e . g , j Comparison of widefield and 4I-SIM reconstructed super-resolution images under normal glucose conditions (control group) and high glucose conditions (experimental group), respecti vely . Mitochondria were labeled with PK Mito Red and excited using a 561 nm laser . Raw SIM data were acquired at 1024 × 1024 pixel resolution using a 100 × oil-immersion objectiv e (UPlanXApo 100/1.45 Oil, Olympus, Japan). h , k T ime-lapse super-resolution images of the green boxed re gion in g and j , respectiv ely . i , l Time-lapse super-resolution images of the blue box ed region in g and j , respecti vely . m Representativ e binary images of mitochondria in control (normal glucose; m1, m2) and experimental (high glucose; m3, m4) groups. n Magnified view of the boxed re gion in m . o Comparativ e analysis of multiple mitochondrial parameters in control (normal glucose) and experimental (high glucose) groups. p Cell population dot plot. q Four-quadrant plots of the Control Group (q1) and the Experimental Group (q2). A two-tailed paired Student’ s t -test was used to compare v alues in b , c , and o ; *** and **** indicate p < 0 . 001 and p < 0 . 0001 , respectiv ely .All experiments were independently repeated ten times with consistent results. Colored arrows indicate re gions with significant differences in image reconstruction. Scale bars: 100 µ m ( d , e ); 10 µ m ( f ); 5 µ m ( g , j ); 1 µ m ( h , i , k , l ). under the high-glucose conditions compared to normal glucose (25 mM) conditions, with relative absorbance reduced to 0.64 (Fig. 6 b). The oxidative stress was subsequently assessed via intracellular R OS, as shown in Fig. 6 c. In this study , cells cultured under normal glucose concentration were designated as the control group (CG), while those exposed to high-glucose conditions were defined as the experimental group (EG). Notably , high-glucose conditions impaired cell adhesion and thickness, leading to elev ated background fluorescence, increased scattering, and pronounced structural heterogeneity , which collectively exacerbated the cellular microen vironment, increased imaging complexity , and heightened background noise. Semi-quantitativ e confocal analysis further confirmed that the R OS accumulation promoted mitochondrial dysfunction and apoptosis (Figs. 6 d- 6 f). These conditions pose a fundamental challenge to conv entional SIM, where insufficient os and background accumulation sev erely compromise reconstruction fidelity and long-term imaging stability (Supplementary Fig. S8). In contrast, 4I-SIM preserves both lateral SR and robust OS under high-glucose conditions, enabling high-fidelity , long-term live imaging of mitochondrial structure and network remodeling in optically challenging en vironments. (Figs. 6 g- 6 l, and Supplementary V ideos S11-S12). T o quantify mitochondrial alterations, we analyzed multiple morphological and functional parameters, including mitochondrial length, aspect ratio, maximal network area, counts of network nodes, as well as fluorescence intensity and its decay rate (Figs. 6 m- 6 o). These metrics comprehensi vely reflect the structural remodeling capacity of mitochondria, network-le vel spatial org anization and connectivity , and the dynamic changes in metabolic homeostasis and functional integrity . Under high-glucose conditions, mitochondria e xhibited disrupted spatial orientation and diminished structural order . Aspect ratio analysis showed significant mitochondrial shrinkage and reduced matrix density . Additionally , analysis of network fusion confirmed that mitochondrial network integrity was se vere disruption, thereby accelerating cellular apoptosis. Intriguingly , 4I-SIM also captured subtle changes in mitochondrial membrane morphology , such as blurring and rupture, which indirectly verified that cellular photostability was partially impaired (113 s vs. 90 s). Previous studies ha ve identified calcium ions as key regulators of mitochondrial membrane stability and oxidati ve stress 57 – 61 . W e thus further in vestigated calcium ion accumulation under high-glucose conditions and its impact on mitochondrial function. Confocal imaging re vealed excessi ve intracellular calcium, which increased mitochondrial membrane permeability and led to the loss of essential proteins like cytochrome c. Flow cytometry also confirmed that the high-glucose conditions induced premature apoptosis, as sho wn as Figs. 6 p- 6 q. The cells in CG were concentrated in the quadrant IV (Anne xin V - and FITC-PI-), which was normal cells. The cells in EG were concentrated in the quadrant II and III, which indicated that early apoptosis (39.5 % ) and late apoptosis (35.1 % ) ev ents was happened simultaneously . In summary , high-glucose conditions significantly impaired cell viability and disrupted mitochondrial homeostasis, partly via excessi ve calcium ion accumulation and increased oxidati ve stress. These pathological changes ultimately led to apoptosis. The robust imaging capability of 4I-SIM under such challenging conditions enabled detailed structural and functional mitochondrial analyses at the SR le vel, offering valuable insights into the cellular mechanisms of oxidativ e damage in metabolic disease contexts. 3 Discussion In summary , we have introduced four-beam interference structured illumination microscopy (4I-SIM), a 2D SIM-based framew ork that achie ves rob ust OS while preserving the lateral SR and acquisition effi ciency characteristic of con ventional 13/ 23 SR-SIM. By e xplicitly reinterpreting 2D SIM from a 3D transfer-function perspecti ve, 4I-SIM addresses the long-standing axial missing-cone limitation through engineered frequency encoding and physically informed reconstruction, enabling high-fidelity imaging in thick and optically complex biological specimens. A central advantage of 4I-SIM lies in its ability to integrate the complementary strengths of 2D- and 3D-SIM without inheriting their respecti ve limitations. Specifically , 4I-SIM retains the imaging speed, lo w phototoxicity , and hardware simplicity of 2D SIM, while substantially impro ving os and suppressing defocus- and scattering-induced artifacts that typically compromise image fidelity in thick samples. Unlike v olumetric SIM approaches, this enhancement is achiev ed without axial scanning, increased acquisition burden, or specialized optical configurations, ensuring seamless compatibility with e xisting SIM platforms. From a methodological standpoint, 4I-SIM differs fundamentally from prior efforts that combine SR and OS through empirical background suppression or manually tuned spectral fusion 14 , 34 , 35 . The proposed reconstruction framew ork is guided by the physical constraints of the 3D O TF , enabling optimal frequency weighting based on intrinsic axial sensiti vity rather than specimen-specific heuristics. This physics-informed strategy provides stable and reproducible performance across di verse imaging conditions, reducing dependence on e xpert parameter tuning and enhancing generalizability for practical biological applications. It is important to emphasize, howe ver , that while 4I-SIM effectiv ely compensates for the axial missing-cone region of the system O TF , it does not extend the detectable axial spatial-frequency support beyond the intrinsic cutof f imposed by the optical system. As such, 4I-SIM does not achieve genuine axial SR. In fact, the resolution limit of a microscopy modality is fundamentally limited by its signal-to-noise ratio (SNR) 62 , 63 . From an information-theoretic perspectiv e, the apparent improv ement in axial resolution primarily reflects an enhancement of the ef fecti ve SNR through suppression of out-of-focus background, resulting in improved axial contrast rather than an increase in true axial resolving power . Accordingly , the quantitativ e resolution improvements observed in this work should be interpreted in terms of enhanced OS and structural fidelity . Regarding lateral resolution, 4I-SIM extends the accessible spatial-frequency range by exploiting second-order spectral components. Although this extension is sufficient to achiev e near twofold lateral SR, the resulting frequency cov erage is inherently less uniform than that of con ventional SIM. While this non-uniformity does not manifest as a noticeable degradation in rFRC-based resolution metrics, it represents a potential limitation in the frequency domain. Future implementations may mitigate this effect through strategies such as alternating or rotational illumination schemes 64 , 65 , which could further homogenize lateral frequency support without increasing acquisition complexity . More broadly , 4I-SIM highlights a promising direction for adv ancing optical microscop y through 3D frequency engineering within 2D acquisition frameworks. By decoupling axial discrimination from v olumetric scanning, this approach opens ne w opportunities for de veloping high-throughput, lo w- phototoxicity imaging methods that remain compatible with live-cell and long-term observations. Future efforts aimed at extending this paradigm to ward true axial SR or integrating adapti ve frequenc y encoding strategies may further e xpand the capabilities of SIM-based imaging. T o facilitate broad adoption, the open-source implementation of 4I-SIM, together with representativ e datasets, has been made publicly a vailable (Supplementary Note S7). W e anticipate that 4I-SIM will serve not only as a practical tool for high-fidelity SR imaging in complex biological specimens, but also as a conceptual frame work for rethinking how 3D information can be optimally encoded and e xploited within fundamentally 2D imaging modalities. 14/ 23 4 Methods 4.1 SIM setup The tricolor composite SIM system dev eloped in this study is illustrated in Supplementary Fig. S5. T o achie ve ef ficient coupling of multi-wa velength laser sources, a series of dichroic mirrors (DM1: ZT561dcrb, Chroma, USA; DM2: ZT488dcrb, Chroma, USA) and planar mirrors (M1, M2: OMM1-A1, JCOPT iX, China) were employed to sequentially combine three laser lines into a single optical path (Laser 1: OBIS LX405, Coherent, USA; Laser 2: OBIS LX561, Coherent, USA; Laser 3: Sapphire 488LP-200, Coherent, USA). The combined beam then passes through a spatial filter and an achromatic lens (L1: LSB08-A, 150 mm, Thorlabs, USA) for beam shaping, expansion, and collimation, yielding a stable and uniform incident beam suitable for downstream modulation and structured illumination. A half-wav e plate (HW1: GCL-0604, Daheng Optics, China) conv erts the beam to p-polarization to minimize ener gy loss in the subsequent optical path. The beam is then directed by a polarizing beam splitter (PBS: PBS251, Thorlabs, USA) onto a ferroelectric liquid crystal spatial light modulator (SLM: QXGA-3DM, Fourth Dimension Displays, UK), where a composite grating pattern is displayed. The diffracted beam from the SLM is con verted to s-polarization using a second half-wav e plate (HW2: GCL-0604, Daheng Optics, China) and further reflected and collimated by another PBS and an achromatic lens (L2: LSB08-A, 250 mm, Thorlabs, USA). At the back focal plane ( i.e. , the F ourier plane), a precision-designed mask is placed to block the 0th-order dif fraction and retain only the ± 1st-order components along two orthogonal directions, thereby generating four mutually coherent high-order beams. T o achiev e balanced modulation and enhance the contrast of the interference fringes, a third half-wa ve plate (HW3: GCL-0604, Daheng Optics, China) was employed for polarization optimization. The polarization direction of this plate was precisely aligned with the bisector of the polarization directions of the two orthogonal coherent beams. The beams were then sequentially focused onto the back focal plane of the objectiv e using two achromatic lenses (L3: 200 mm; L4: 175 mm, both LSB08-A series, Thorlabs, USA), resulting in high-contrast structured illumination at the sample plane. Fluorescence emitted from the sample is collected by the same objecti ve and passes through a filter set (FM: U-FVN, U-FBW , U-FYW , Olympus, Japan), a tube lens (TL), and is ultimately detected by an sCMOS camera (PCO Edge 5.5, PCO, Germany) with a quantum efficienc y of 60 % . T o ensure temporal synchronization between the SLM and image acquisition, camera e xposure is precisely triggered by the SLM controller . Unlike conv entional SIM systems employing three illumination directions and three-step phase shifting based on two-beam interference, the proposed system adopts a four -beam interference strategy with nine-step asynchronous phase modulation. Specifically , the SLM displays a composite grating formed by the superposition of two orthogonal sinusoidal patterns. During imaging, this pattern is sequentially encoded with nine asynchronous phase steps to achieve ef ficient structured illumination. 4.2 Image reconstruction In 4I-SIM, the composite illumination pattern can be expressed as: I ( r ) = 1 + m 1 u · cos 2 π ( k u − k v ) · r + ( ϕ u − ϕ v ) + ϕ 1 u + m 1 v · cos 2 π ( k u + k v ) · r + ( ϕ m + ϕ n − π ) + ϕ 1 v + m 2 u · cos 4 π k u · r + ( 2 ϕ m − π ) + ϕ 2 u + m 2 v · cos 4 π k v · r + ( 2 ϕ n − π ) + ϕ 2 v (5) where r is the spatial coordinate. Notably , we did not adopt the con ventional nine-step synchronous phase-shifted scheme. When the number of phase-shifted steps is increased, the tolerance to intrinsic phase errors of SLM is significantly reduced. This effect becomes more sev ere in complex illumination scenarios inv olving nine spectral components, as encountered in 4I-SIM. T o address this issue, we employed a nine-step asynchr onous phase-shifting strategy . In this scheme, k u and k v in Eq. 5 are shifted independently in time, with each executing a three-step phase-shifted sequence (see Supplementary T able S1). In the image processing pipeline, raw SIM images were first subjected to mild edge tapering to suppress boundary artifacts 20 . T o enhance the signal-to-noise ratio and mitigate Poisson noise, preliminary restoration was performed using the Richardson-Lucy (RL) decon volution algorithm 61 , 66 . During illumination parameter estimation, a nine-step phase-shifted matrix was applied to preliminarily separate the raw images into nine modulated spectral components. A PCA-based algorithm was then employed to extract the illumination wa ve vectors and phases, enabling fast, non-iterativ e, and accurate parameter estimation 38 (detailed in Supplementary Note S4). With these parameters, the nine spectral components were precisely demodulated using the same nine-step matrix. For spectral reconstruction, the zeroth-order and four second-order components were combined to form the high-frequency second-order spectrum. Similarly , four first-order components were used to construct the lo w-frequency first-order spectrum. Finally , the complete 4I-SIM spectrum was reconstructed through the 3D O TF-informed optimal frequency-weighting reconstruction frame work (Eq. 4 ), integrating both spectral channels to achie ve tw ofold lateral SR and ef fectiv e OS. For benchmarking, alternati ve reconstruction methods, including con ventional SR-SIM 8 , WLR 31 , iSIM 32 , and Dark-SIM 35 , were implemented according to their original protocols to ensure fair and consistent comparison. 15/ 23 4.3 Sample preparation HeLa cells were incubated in 90% RPMI-1640, 10% FBS and 1% penicillin-streptomycin. Biological sample was prepared when cells are exponentially proliferating. Cells were seeded at a density of 5 × 10 8 cells in the dishes, which were cultured ov ernight. The cells were stained through immunofluorescence staining with the cell density reaching 60%. PK Mito Red ( λ abs = 549 nm; λ fl = 569 nm) were diluted to dimethyl sulfoxide (DMSO) at the concentration of 250 µ M. The primary liquor was diluted by the pre-w armed medium. They were washed by 0.5 mL phosphate b uffer (PBS) for 5 min. The prepared solution was incubated for 15 min. T o remove interference from free dyes, all samples were w ashed by pre-warmed PBS for 3 times. CCC-ESF-1 were cultured in vitro in DMEM medium supplemented with 10% fetal bovine serum and incubated at 37 ◦ C with 5% CO 2 . Cells incubated for 48 h in DMEM containing 5.5 mmol/L glucose were regarded as the control group, whereas those incubated for 48 h in DMEM containing 33.3 mmol/L glucose were regarded as the high-glucose group. 4.4 Statistical analysis Except for Fig. 5 and Fig. 6 , all presented results represent typical outcomes selected from ten independently repeated and representativ e experiments. In Figs. 2 - 4 and Extended Data Fig. 2 , local image contrast comparisons across different methods are presented as box plots, where the central line denotes the mean, the box edges correspond to the 75th and 25th percentiles, and the whiskers indicate the maximum and minimum v alues. The rFRC-based resolution distributions (Figs. 2 - 4 and Extended Data Fig. 2 ) and RSM distributions (Figs. 2 - 4 ) were calculated using the algorithm described in Ref. 39 and visualized as violin plots. These violin plots are rendered symmetrically: the contour represents the k ernel density estimation, the width reflects the distribution concentration, the horizontal line marks the mean, the box edges denote the 75th and 25th percentiles, and the whiskers sho w the data range from minimum to maximum. Additionally , the rFRC resolution maps sho wn in Fig. 4 were computed using the same method from Ref. 39 . All intensity profile curves presented in Figs. 2 - 4 were generated using linear interpolation in MA TLAB. Quantitati ve analysis of v arious mitochondrial morphological and functional parameters in Fig. 6 , including mitochondrial length, aspect ratio, network area, counts of network nodes, and fluorescence intensity , was performed using Fiji 67 with the MiN A (Mitochondrial Network Analysis) plugin 68 and related analytical tools. The specific definition of the rFRC measurements is given as follo ws. Local image resolution was quantified using rolling Fourier ring correlation. For each sliding windo w of size w × w pixels centered at position ( x , y ) , two statistically independent reconstructions of the same structure, denoted M 1 and M 2 , were transformed into the Fourier domain, and the Fourier ring correlation as a function of spatial frequency q i was defined as: FRC 12 ( q i ) = ∑ r ∈ q i F 1 ( r ) F ∗ 2 ( r ) r ∑ r ∈ q i | F 1 ( r ) | 2 ∑ r ∈ q i | F 2 ( r ) | 2 (6) where F 1 and F 2 denote the discrete Fourier transforms of M 1 and M 2 , r is the 2 spatial-frequency v ector , and the summation runs ov er all Fourier samples lying on the ring with radius q i . Spatial frequencies were grouped into concentric rings between zero and the Nyquist frequency , and the raw FRC curv e was smoothed along the frequency axis using a short mo ving-average filter to suppress statistical fluctuations. For each ring, the local cut-off frequency f co ( x , y ) was defined as the first spatial frequency at which FRC 12 ( q i ) dropped below a sigma-factor threshold σ i = 3 / p N i / 2 , where N i represents the number of Fourier samples in the ring. The rFRC resolution map F V ( x , y ) was then obtained as the reciprocal of this cut-of f frequency . T o summarize the overall image quality with a single number , the global rFRC resolution was computed as the arithmetic mean of the local rFRC resolution ov er all foreground pixels: Mean Resolution = ∑ F V ( x , y ) = 0 F V ( x , y ) F V ( x , y ) 0 (7) where F V ( x , y ) 0 denotes the number of pixels with non-zero FV ( x , y ) v alues. Local reconstruction errors were characterized using RSM. The underlying assumption is that, if the super-resolved reconstruction I H is faithful, an appropriately intensity-rescaled and blurred version of I H should reproduce the diffraction- limited wide-field image I L of the same field of view . Global intensity differences were compensated by applying a linear mapping I H S ( µ , θ ) = µ I H + θ , where µ and θ are a multiplicative gain and an additive offset that adjust ov erall bright- ness and background. The intensity-scaled image I H S was then conv olved with an anisotropic Gaussian resolution-scaling function I RSF ( σ x , σ y ) to mimic the optical blurring of the diffraction-limited system, yielding a pseudo wide-field image I H L = I H S ( µ , θ ) ⊗ I RSF ( σ x , σ y ) , where ⊗ denotes conv olution and σ x , σ y are the Gaussian standard deviations along the x - and y -axes. The parameters µ , θ , σ x and σ y were jointly optimized by minimizing the squared L 2 norm between I H L and the 16/ 23 measured diffraction-limited image I L . After optimization, the resolution-scaled error map was defined pixel-wise as: RSM ( x , y ) = | I L ( x , y ) − I H L ( x , y ) | (8) such that low RSM v alues indicate high local consistency between the super-resolv ed reconstruction and the diffraction-limited reference, corresponding to higher effecti ve resolution and fe wer reconstruction artefacts. Funding This work was supported by National Natural Science Foundation of China (62405136, 62227818, 62405137, 62275125, 62275121, 12204239, 62175109), China Postdoctoral Science Foundation (BX20240486, 2024M754141), Y outh Foundation of Jiangsu Province (BK20241466, BK20220946), Jiangsu Funding Programfor Excellent Postdoctoral T alent (2024ZB671), Fundamental Research Funds for the Central Uni versities (30922010313), Fundamental Research Funds for the Central Univ ersities (2023102001), and Open Research Fund of Jiangsu Ke y Laboratory of Spectral Imaging & Intelligent Sense (JSGP202201, JSGPCXZNGZ202402). A uthor contributions C.Z. and Q.C. supervised the project. C.Z. and J.Q. initiated and conceived the research. J.Q and J.F . programmed the reconstruction algorithm and analyzed the data. J.Q. and J.F . built the SIM system. H.W . helped with the biological experiment design. J.Q., J.F ., M.Z., D.L., T .K., and X.H. performed the experiments. C.Z., J.Q., J.F . and H.W . wrote the manuscript with input from all authors. Data and materials av ailability Source codes and data for 4I-SIM is publicly av ailable at https://doi.org/xxxxxx . Further details regarding the code can be found in Supplementary Note S7. Conflict of interest The authors declare that they ha ve no conflict of interest. 17/ 23 k x k z k z k x k x k x k x k x k x k x a1 a2 b1 c1 d1 d2 c2 b2 M i s s i n g c o n e F i l l e d mis s i n g c o n e h m i s . ~ h c om . ~ h m i s . ~ h c om . ~ a1 k y k y S u p p r e s s E n h a n c e Extended Data Fig. 1. Composite frequency-domain filtering constrained by the 3D O TF of 4I-SIM. a1 Lateral support of the 0th and 2nd spectral orders in 4I-SIM, containing the missing-cone region. a2 Lateral support of the 1st spectral order in 4I-SIM, which compensates for the missing-cone region. b Cross-sectional view of a in the k xz plane. From the 3D O TF perspectiv e, b1 exhibits a clear missing-cone ef fect, whereas b2 cov ers the regions missing in b1 . c The 2D O TF obtained by projecting the 3D O TF in b along the k x axis. From the 2D O TF perspectiv e, the spectral components projected from the missing-cone regions are emphasized, while information from regions with strong axial response is suppressed. d For ef fectiv e 2D OS, information from the missing-cone regions should be suppressed while enhancing information that compensates for these missing components. 18/ 23 a1 a2 a3 W id e - f i e l d 1 W id e - f i e l d 2 W id e - f i e l d 3 4I - S IM 1 4I - S IM 2 4I - S IM 3 5 m 5 m 5 m b1 b2 b3 W F1 Con v . S IM1 4 I1 c1 c2 c3 W F2 Con v . S IM2 4 I2 d1 d2 d3 W F3 Con v . S IM3 4 I3 e1 e2 e3 W F1 Con v . S IM1 4 I1 f1 f2 f3 W F2 Con v . S IM2 4 I2 g1 g2 g3 W F3 Con v . S IM3 4 I3 0 .5 m 0 .5 m r F R C r es ol uti on /nm 80 120 160 200 Cont r as t( a.u .) 0.5 1.0 1.5 2.0 0 S IM1 W F 1 4I1 S IM2 W F 2 4I2 S IM2 W F 3 4 I3 S IM1 4I1 SIM2 4I2 SIM3 4I3 h i S I M 1 W F 2 W F 1 W F 3 S I M 2 S I M 3 4 I 1 4 I 2 4 I 3 M e a n va lue S li ce 6 S li ce 12 S li ce 22 Extended Data Fig. 2. Comparison of super-r esolution imaging results of COS-7 cell micr otubules labeled with BODIPY R FL goat anti-mouse IgG. a Wide-field and 4I-SIM super -resolution images acquired at different axial planes. Raw SIM images were recorded at a resolution of 1024 × 1024 pixels using a 100 × oil-immersion objectiv e (UPlanXApo 100/1.45 Oil, Olympus, Japan). b - d Magnified views obtained using different methods (wide-field, con v entional SIM and 4I-SIM) from the green boxed region in a . e - g Magnified views obtained using different methods (wide-field, con ventional SIM and 4I-SIM) from the pink boxed re gion in a . h Local contrast comparison across different axial planes and reconstruction methods. i Lateral resolution distributions across axial layers, calculated using the rFRC method. A two-tailed paired Student’ s t -test was applied to contrast values in h , with **** indicating p < 0 . 0001 . Each experiment was independently repeated ten times with consistent results. Colored arrows indicate re gions with pronounced reconstruction differences. Scale bars: 5 µ m ( a ); 500 nm ( b - g ). 19/ 23 S li ce 1 1 9 Sli ce 1 19 Sli ce 41 S li ce 4 1 S li ce 3 1 S li ce 3 1 S li ce 4 0 S li ce 4 0 x o z x o z 4I WF x o z x o z 4I WF WF 4I WF 4I x o z x o z 4I WF WF 4I x o z x o z 4I WF WF 4I 0 .5 μ m 1 μ m 0 .5 μ m 0 .5 μ m a1 a2 a3 b2 b3 a4 a5 b4 b5 b1 c1 c2 c3 d2 d3 c4 c5 d4 d5 d1 Extended Data Fig. 3. Comparative experiments on different thick samples. a1 W ide-field and 4I-SIM super-resolution images of the entire 3D field of vie w of a fixed autofluorescent Ascaris suum fertilized egg. a2, a3 x - z slices extracted from the wide-field and super-resolution images in a1 along the blue dashed line. a4, a5 Enlarged vie w of the blue boxed region in a1 , taken from slice 41, comparing wide-field and 4I-SIM. b W ide-field and 4I-SIM super -resolution images of a fixed Chlamydomonas sample. c W ide-field and 4I-SIM super-resolution images of a fix ed mouse brain section. d W ide-field and 4I-SIM super-resolution images of a fix ed mouse kidney section. Raw SIM images were recorded at a resolution of 1024 × 1024 pixels using a 60 × oil-immersion objectiv e (UPlanXApo 100/1.45 Oil, Olympus, Japan). Scale bars: 5 µ m ( a1 , b1 , c1 , d1 ); 500 nm ( a4 , a5 , c4 , c5 , d4 , d5 ); 1 µ m ( b4 , b5 ). Scale on the z -axis: 80 slices, 150 nm per slice ( a ); 160 slices, 150 nm per slice ( b ); 40 slices, 150 nm per slice ( c ); 60 slices, 150 nm per slice ( d ). 20/ 23 References 1. Newme yer , D. D. & Ferguson-Miller , S. Mitochondria: releasing power for life and unleashing the machineries of death. Cell 112 , 481–490 (2003). 2. Akhmanov a, A. & Steinmetz, M. O. T racking the ends: a dynamic protein network controls the f ate of microtubule tips. Nat. Rev. Mol. Cell Biol. 9 , 309–322 (2008). 3. Bosch, M. et al. Structural and molecular remodeling of dendritic spine substructures during long-term potentiation. Neur on 82 , 444–459 (2014). 4. Behnke, O. & Moe, H. An electron microscope study of mature and dif ferentiating paneth cells in the rat, especially of their endoplasmic reticulum and lysosomes. J. Cell Biol. 22 , 633–652 (1964). 5. W estphal, V . et al. V ideo-rate far-field optical nanoscopy dissects synaptic vesicle movement. Science 320 , 246–249 (2008). 6. Chen, H., McCaffery , J. M. & Chan, D. C. Mitochondrial fusion protects against neurodegeneration in the cerebellum. Cell 130 , 548–562 (2007). 7. Cogliati, S. et al. Mitochondrial cristae shape determines respiratory chain supercomplexes assembly and respiratory efficienc y . Cell 155 , 160–171 (2013). 8. Gustafsson, M. G. Surpassing the lateral resolution limit by a factor of tw o using structured illumination microscopy . J. Micr osc. 198 , 82–87 (2000). 9. Heintzmann, R. & Cremer, C. G. Laterally modulated excitation microscopy: improv ement of resolution by using a diffraction grating. In Optical biopsies and micr oscopic techniques III , vol. 3568, 185–196 (SPIE, 1999). 10. Li, D. et al. Extended-resolution structured illumination imaging of endocytic and cytosk eletal dynamics. Science 349 , aab3500 (2015). 11. Guo, Y . et al. V isualizing intracellular organelle and cytoskeletal interactions at nanoscale resolution on millisecond timescales. Cell 175 , 1430–1442 (2018). 12. Huang, X. et al. Fast, long-term, super-resolution imaging with hessian structured illumination microscopy . Nat. Biotechnol. 36 , 451–459 (2018). 13. Zhao, W . et al. Sparse decon volution impro ves the resolution of li ve-cell super -resolution fluorescence microscopy . Nat. Biotechnol. 40 , 606–617 (2022). 14. W en, G. et al. High-fidelity structured illumination microscopy by point-spread-function engineering. Light. Sci. & Appl. 10 , 70 (2021). 15. W ang, Z. et al. High-speed image reconstruction for optically sectioned, super-resolution structured illumination microscopy . Adv. Photonics 4 , 026003–026003 (2022). 16. Zhang, C. et al. Deep tissue super-resolution imaging with adapti ve optical tw o-photon multifocal structured illumination microscopy . PhotoniX 4 , 38 (2023). 17. Chen, X. et al. Self-supervised denoising for multimodal structured illumination microscopy enables long-term super- resolution liv e-cell imaging. PhotoniX 5 , 4 (2024). 18. Macías-Garza, F ., Bovik, A. C., Diller , K. R., Aggarwal, S. J. & Aggarwal, J. The missing cone problem and lo w-pass distortion in optical serial sectioning microscopy . In ICASSP-88., International Confer ence on Acoustics, Speech, and Signal Processing , 890–891 (IEEE Computer Society , 1988). 19. W icker , K., Mandula, O., Best, G., Fiolka, R. & Heintzmann, R. Phase optimisation for structured illumination microscopy . Opt. Express 21 , 2032–2049 (2013). 20. Gustafsson, M. G. et al. Three-dimensional resolution doubling in wide-field fluorescence microscopy by structured illumination. Biophys. J. 94 , 4957–4970 (2008). 21. Schermelleh, L. et al. Subdiffraction multicolor imaging of the nuclear periphery with 3d structured illumination microscopy . Science 320 , 1332–1336 (2008). 22. Cao, R. et al. Open-3dsim: an open-source three-dimensional structured illumination microscopy reconstruction platform. Nat. Methods 20 , 1183–1186 (2023). 23. Cao, R. et al. Fast reconstruction and optical-sectioning three-dimensional structured illumination microscopy . The Innov. 6 (2025). 21/ 23 24. Neil, M. A., Juškaitis, R. & W ilson, T . Method of obtaining optical sectioning by using structured light in a con ventional microscope. Opt. Lett. 22 , 1905–1907 (1997). 25. Lim, D., Chu, K. K. & Mertz, J. Wide-field fluorescence sectioning with hybrid speckle and uniform-illumination microscopy . Opt. Lett. 33 , 1819–1821 (2008). 26. Santos, S. et al. Optically sectioned fluorescence endomicroscopy with hybrid-illumination imaging through a flexible fiber bundle. J. Biomed. Opt. 14 , 030502–030502 (2009). 27. Mertz, J. & Kim, J. Scanning light-sheet microscopy in the whole mouse brain with hilo background rejection. J. Biomed. Opt. 15 , 016027–016027 (2010). 28. Patorski, K., T rusiak, M. & Tkaczyk, T . Optically-sectioned tw o-shot structured illumination microscopy with hilbert-huang processing. Opt. Express 22 , 9517–9527 (2014). 29. Karadagli ´ c, D. Image formation in con ventional brightfield reflection microscopes with optical sectioning property via structured illumination. Micr on 39 , 302–310 (2008). 30. Karadagli ´ c, D. & W ilson, T . Image formation in structured illumination wide-field fluorescence microscopy . Micron 39 , 808–818 (2008). 31. O’Holleran, K. & Shaw , M. Optimized approaches for optical sectioning and resolution enhancement in 2d structured illumination microscopy . Biomed. Opt. Express 5 , 2580–2590 (2014). 32. Dan, D. et al. Super -resolution and optical sectioning integrated structured illumination microscopy . J. Phys. D: Appl. Phys. 54 , 074004 (2020). 33. Mo, Y . et al. Quantitativ e structured illumination microscopy via a physical model-based background filtering algorithm rev eals actin dynamics. Nat. Commun. 14 , 3089 (2023). 34. Johnson, K. A. & Hagen, G. M. Artifact-free whole-slide imaging with structured illumination microscopy and bayesian image reconstruction. Gigascience 9 , giaa035 (2020). 35. Cao, R. et al. Dark-based optical sectioning assists background remov al in fluorescence microscopy . bioRxiv 2024–03 (2024). 36. Radon, J. On the determination of functions from their integral values along certain manifolds. IEEE T ransactions on Med. Imaging 5 , 170–6 (1986). 37. Sheppard, C. J. R. & Gu, M. Three-dimensional optical transfer function for an annular lens. Opt. Commun. 81 , 276–280 (1991). 38. Qian, J. et al. Structured illumination microscopy based on principal component analysis. eLight 3 , 4 (2023). 39. Zhao, W . et al. Quantitati vely mapping local quality of super-resolution microscopy by rolling fourier ring correlation. Light. Sci. & Appl. 12 , 298 (2023). 40. Schneckenbur ger , H. & Richter , V . Challenges in 3d live cell imaging. In Photonics , vol. 8, 275 (MDPI, 2021). 41. Frigault, M. M., Lacoste, J., Swift, J. L. & Bro wn, C. M. Live-cell microscop y–tips and tools. J. Cell Sci. 122 , 753–767 (2009). 42. W ang, M. et al. High snr 3d imaging from millimeter-scale thick tissues to cellular dynamics via structured illumination microscopy . arXiv pr eprint arXiv:2412.05677 (2024). 43. Nath, S. et al. Identification of fluorescent compounds with non-specific binding property via high throughput li ve cell microscopy . PLoS One 7 , e28802 (2012). 44. Han, Y ., Li, M., Qiu, F ., Zhang, M. & Zhang, Y .-H. Cell-permeable organic fluorescent probes for live-cell long-term super-resolution imaging re veal lysosome-mitochondrion interactions. Nat. Commun. 8 , 1307 (2017). 45. K ollmannsperger , A. et al. Liv e-cell protein labelling with nanometre precision by cell squeezing. Nat. Commun. 7 , 10372 (2016). 46. Y oule, R. J. & V an Der Bliek, A. M. Mitochondrial fission, fusion, and stress. Science 337 , 1062–1065 (2012). 47. Sarraf, S. A. et al. Landscape of the parkin-dependent ubiquitylome in response to mitochondrial depolarization. Nature 496 , 372–376 (2013). 48. Jenkins, B. C. et al. Mitochondria in disease: changes in shapes and dynamics. T r ends Biochem. Sci. (2024). 49. Roca-Portoles, A. & T ait, S. W . Mitochondrial quality control: from molecule to organelle. Cell. Mol. Life Sci. 78 , 3853–3866 (2021). 22/ 23 50. Chen, W ., Zhao, H. & Li, Y . Mitochondrial dynamics in health and disease: mechanisms and potential targets. Signal T ransduct. T arget. Ther. 8 , 333 (2023). 51. Y u, T ., Robotham, J. L. & Y oon, Y . Increased production of reactiv e oxygen species in hyperglycemic conditions requires dynamic change of mitochondrial morphology . Pr oc. Natl. Acad. Sci. 103 , 2653–2658 (2006). 52. Otero, M. G. et al. Hyperglycemia-induced mitochondrial abnormalities in autonomic neurons via the rage axis. Sci. Reports 15 , 25231 (2025). 53. Jia, X. et al. Epigallocatechin gallate attenuated high glucose-induced pancreatic beta cell dysfunction by modulating drp1-mediated mitochondrial apoptosis pathways. Sci. Reports 14 , 16809 (2024). 54. Aluksanasuwan, S., Plumworasa wat, S., Malaitad, T ., Chaiyarit, S. & Thongboonkerd, V . High glucose induces phospho- rylation and oxidation of mitochondrial proteins in renal tubular cells: A proteomics approach. Sci. Reports 10 , 5843 (2020). 55. Xu, S. et al. High glucose-or age-induced oxidativ e stress inhibits hippocampal neuronal mitophagy through the k eap1– nrf2–phb2 pathway in diabetic encephalopathy . Sci. Reports 14 , 24044 (2024). 56. W u, Q.-R. et al. High glucose induces drp1-mediated mitochondrial fission via the orai1 calcium channel to participate in diabetic cardiomyocyte hypertrophy . Cell Death & Dis. 12 , 216 (2021). 57. Borbolis, F ., Ploumi, C. & P alikaras, K. Calcium-mediated regulation of mitophagy: implications in neurodegenerati ve diseases. npj Metab. Heal. Dis. 3 , 4 (2025). 58. Cheng, E. H.-Y ., Sheiko, T . V ., Fisher , J. K., Craigen, W . J. & K orsmeyer , S. J. Vdac2 inhibits bak activ ation and mitochondrial apoptosis. Science 301 , 513–517 (2003). 59. Shimizu, S., Narita, M., Tsujimoto, Y . & Tsujimoto, Y . Bcl-2 family proteins regulate the release of apoptogenic cytochrome c by the mitochondrial channel vdac. Natur e 399 , 483–487 (1999). 60. Zhang, Y ., Ma, P ., W ang, S., Chen, S. & Deng, H. Restoring calcium crosstalk between er and mitochondria promotes intestinal stem cell rejuvenation through autophagy in aged drosophila. Nat. Commun. 16 , 4909 (2025). 61. Perez, V ., Chang, B.-J. & Stelzer , E. H. K. Optimal 2d-sim reconstruction by two filtering steps with richardson-lucy decon volution. Sci. Reports 6 , 37149 (2016). 62. Cox, c. I. & Sheppard, C. Information capacity and resolution in an optical system. J. Opt. Soc. Am. A 3 , 1152–1158 (1986). 63. W ang, H. et al. Deep learning enables cross-modality super-resolution in fluorescence microscopy . Nat. Methods 16 , 103–110 (2019). 64. Sun, J., Chen, Q., Zhang, J., Fan, Y . & Zuo, C. Single-shot quantitativ e phase microscopy based on color-multiple xed fourier ptychography . Opt. Lett. 43 , 3365–3368 (2018). 65. Fan, Y . et al. Single-shot isotropic quantitativ e phase microscopy based on color -multiplexed dif ferential phase contrast. APL Photonics 4 (2019). 66. Sage, D. et al. Decon volutionlab2: An open-source software for decon volution microscopy . Methods 115 , 28–41 (2017). 67. Schindelin, J. et al. Fiji: an open-source platform for biological-image analysis. Nat. Methods 9 , 676–682 (2012). 68. V alente, A. J., Maddalena, L. A., Robb, E. L., Moradi, F . & Stuart, J. A. A simple imagej macro tool for analyzing mitochondrial network morphology in mammalian cell culture. Acta Histochem. 119 , 315–326 (2017). 23/ 23
Original Paper
Loading high-quality paper...
Comments & Academic Discussion
Loading comments...
Leave a Comment