LUMINA: Laplacian-Unifying Mechanism for Interpretable Neurodevelopmental Analysis via Quad-Stream GCN
Functional Magnetic Resonance Imaging(fMRI) has now become a classic way for measuring brain activity, and recent trend is shifting toward utilizing fMRI brain data for AI-driven diagnosis. Given that the brain functions as not a discrete but interco…
Authors: Minkyung Cha, Jooyoung Bae, Jaewon Jung
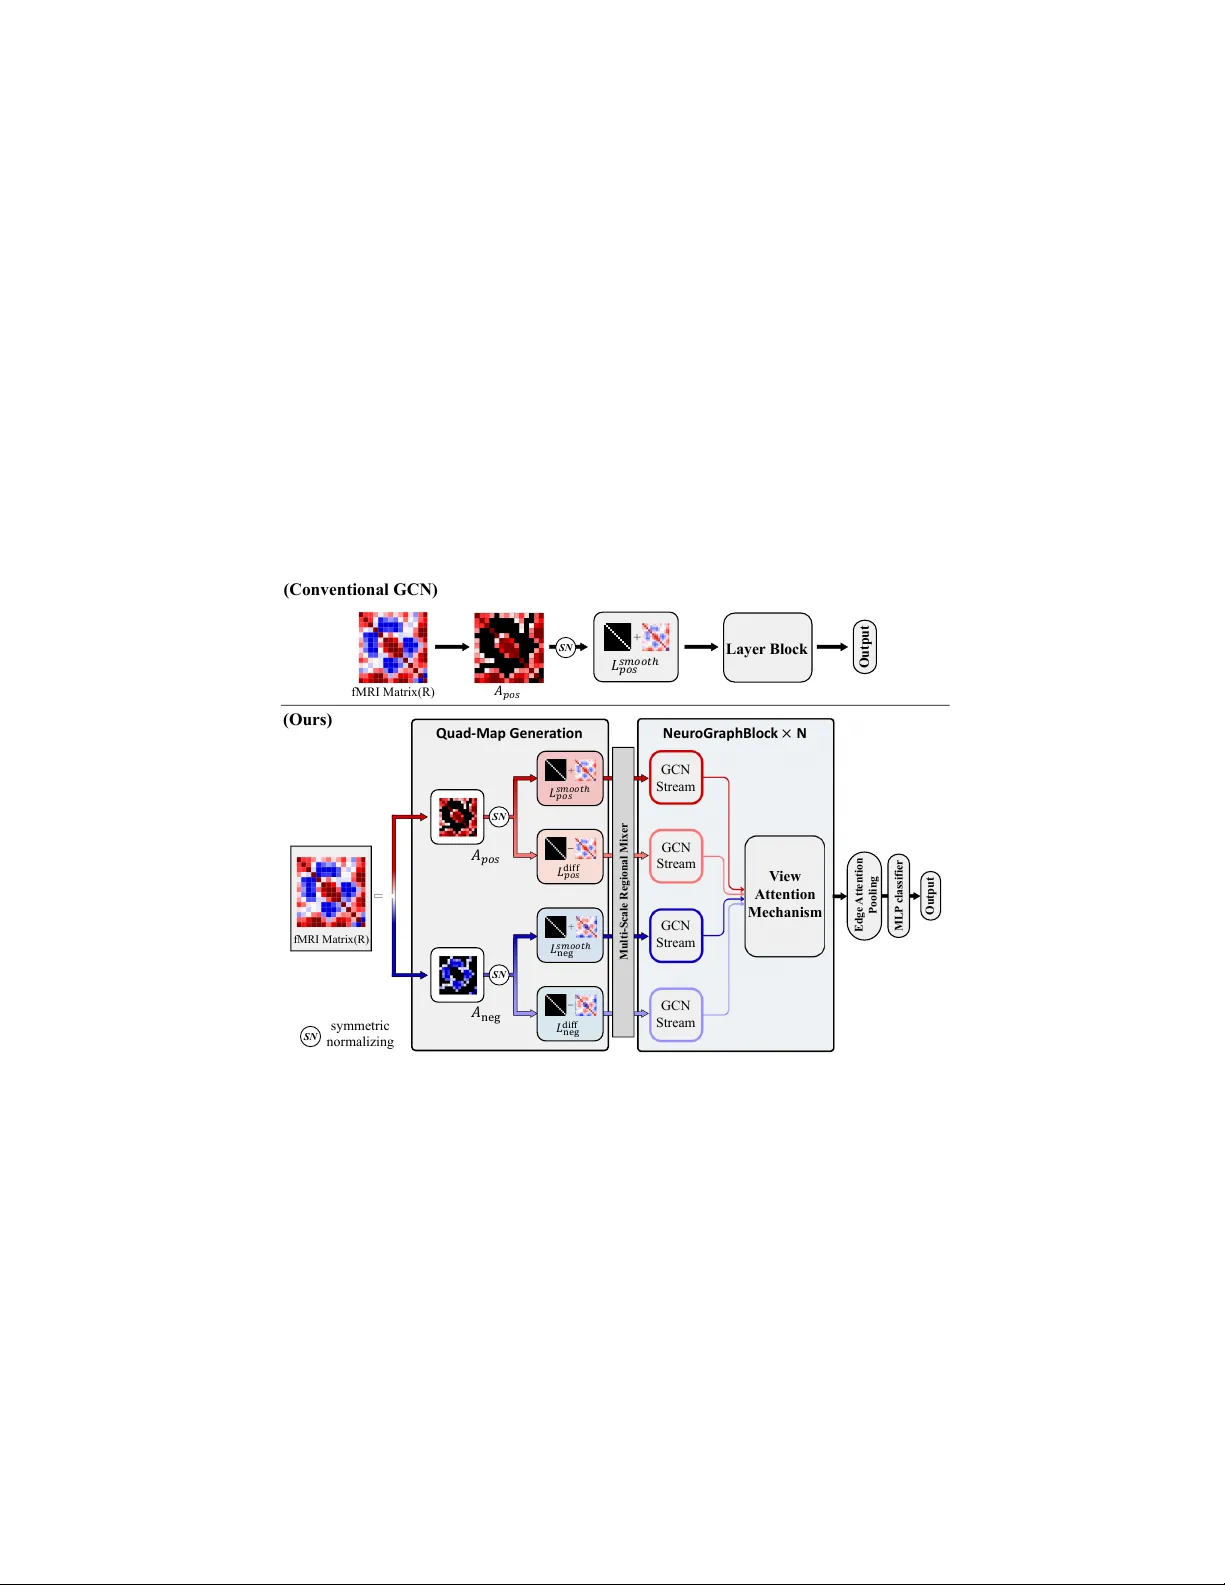
LUMINA: Laplacian-Unifying Mec hanism for In terpretable Neuro dev elopmen tal Analysis via Quad-Stream GCN Minkyung Cha 1 , Jo o y oung Bae 1 , Jaew on Jung 1 , Ping Sh u Ho 2 , Ka Ch un Cheung 2 , and Namjo on Kim 1 1 Seoul National Univ ersity , Seoul, Republic of K orea 2 NVIDIA AI T echnology Center HK, Hong Kong cmk4911@snu.ac.kr, domi37@snu.ac.kr, owenjaewon@snu.ac.kr, cliffh@nvidia.com, chcheung@nvidia.com, knj01@snu.ac.kr Abstract. F unctional Magnetic Resonance Imaging(fMRI) has no w be- come a classic w ay for measuring brain activit y , and recent trend is shifting to w ard utilizing fMRI brain data for AI-driv en diagnosis. Given that the brain functions as not a discrete but in terconnected whole, Graph Con volutional Net work(GCN) has emerged as a dominant framew ork for suc h task, since they are capable of treating ROIs as dynamically in terconnected no des and extracting relational architecture b et ween them. Ironically , ho wev er, it is the very nature of GCN’s architecture that acts as an obstacle to its p erformance. The mathematical foundation of GCN, effectiv e for capturing global regularities, acts as a tradeoff; by smo othing features across the connected no des rep eatedly , traditional GCN tend to blur out the con trastive dynamics that might be crucial in identifying certain n eurological disorders. In order to break through this structural b ottlenec k, we prop ose LUMINA, a Laplacian-Unifying Mec hanism for Interpretable Neuro dev elopmental Analysis. Our mo del is a Quad-Stream GCN that employs a bip olar RELU activ ation and a dual-spectrum graph Laplacian filtering mec hanism, thereb y capturing heterogeneous dynamics that w ere often blurred out in con ven tional GCN. By doing so, we can preserv e the diverse range and c haracteristics of neural connections in eac h fMRI data. Through 5-fold cross v alidation on the ADHD200 ( N = 144 ) and ABIDE ( N = 579 ) dataset, LUMINA demonstrates stable diagnostic p erformance in tw o of the most critical neurodevelopmen tal disorder in c hildhoo d, ADHD and ASD, outp erforming existing models with an accuracy of 84 . 66% and 88 . 41% each. Keyw ords: Childho od Neurodevelopmen tal Disorder · Graph Conv olu- tional Ne tw orks · Laplacian Filtering · View Atten tion. 1 In tro duction 1.1 fMRI as a Biomark er for Neuro dev elopmen tal Disorder ADHD (A ttention Deficit Hyperactivity Disorder) and ASD (Autism Spectrum Disorder) are one of the most common neuro dev elopmental disorders in c hildren[1]. 2 M. Cha et al. Timely therap eutic in terv entions could significan tly improv e a c hild’s cognitive function and the so cial life afterw ards, but not all c hildren with ADHD or ASD are diagnosed at the right time, since curren t diagnosis relies heavily on clinical examination[2, 3]. The difficult y of diagnosis escalates ev en further for individuals with relatively mild severit y , since it’s easy for them to unconsciously conceal their symptoms and blend in, a phenomenon called as so cial masking[4]. Due to these diagnostic c hallenges, recent focus has shifted tow ard the intrinsic brain activit y itself measured by fMRI, rather than the clinical symptoms pro duced b y it[5]. fMRI measures the brain activit y through the Blo o d-Oxygen-Lev el- Dep enden t(BOLD) signal based on the fact that on the fact that activ ated neurons induce increased lo cal o xygen from the blo o dstream[6]. Among subt yp es of fMRI, resting-state fMRI (rs-fMRI) is often utilized to capture the in trinsic brain dynamics in a natural condition[7]. W e focused on the rs-fmri of ADHD and ASD, and aimed to build a diagnostic mo del that could impro ve the early iden tification of childhoo d neuro dev elopmen tal disorders. 1.2 Graph Neural Net w orks F or analysis, fMRI data are typically mapp ed onto a pre-defined brain atlas, wh ere v oxel signals are grouped and av eraged within each R OIs. P airwise correlations are then computed to establish functional connectivity betw een them[8]. Graph Neural Net works (GNNs) ha ve been widely adopted to pro cess these functional connectomes, treating each R OI as a no de and the pairwise correlations as edge w eights. Most GNNs use the standard message passing mechanism based on the arc hitecture of Graph Conv olutional Netw ork (GCN). The initial connectome contains both p ositiv e and negativ e correlations, but standard message-passing mec hanisms in GCN generally assume non-negative adjacency matrices. Therefore, existing approaches tend to apply absolute v alues ( | R | ) or positive thresholding ( max (0 , R ) ) to the correlation matrix before con- structing the graph[9]. As a result, the division b et ween positive and negativ e correlationis erased; the bip olar nature of functional connectivity is discarded at this p oin t. One more limitation of existing GNN stems from the sp ectral prop erties of standard graph conv olutions. F or a graph with an adjacency matrix A and a diagonal degree matrix D , the thoretic idea of con volutional k ernel in standard GNN could b e expressed as: I + D − 1 / 2 AD − 1 / 2 (1) where I is the iden tit y matrix[10]. This acts inherently as a lo w-pass filter, since it performs a weigh ted av eraging of features of a node and its connected neigh b ors[11]. And when it’s applied repeatedly , information in no des with relativ ely high spatial frequency is o v ersmo othed and atten uated. Standard GNNs are therefore structurally limited on their abilit y to detect heterogeneous c haracteristics of brain connectivity . LUMINA: Quad-Stream GCN f or Neurodevelopmen tal Diagnosis 3 2 Metho dology 2.1 o verview T o address the current bottleneck, w e prop ose LUMINA, an fMRI-based clinical diagnosis mo del designed to preserv e the heterogeneous neural connections. The arc hitecture of our model is outlined in Fig. 1; Conv entional GCN typically utilizes only the absolute or p ositiv e v alues of adjacency matrices pro cessed through a monolithic low-pass filter, but LUMINA segregates the input fMRI matrix ( R ) in to p ositiv e and negative components ( A pos , A neg ), whic h are then transformed in to four distinct streams ( L smooth pos , L dif f pos , L smooth neg , L dif f neg ). These maps are pro cessed through the Multi-Scale Regional Mixer and m ultiple GCN streams, in tegrated by a View A ttention Mec hanism for final classification. SN SN fMRI Matrix (R) 𝐴 𝑝𝑜𝑠 𝐴 neg 𝐿 𝑝𝑜𝑠 𝑠𝑚 𝑜 𝑜𝑡ℎ 𝐿 𝑝𝑜𝑠 diff 𝐿 neg 𝑠𝑚 𝑜 𝑜𝑡ℎ 𝐿 neg diff symmetric normalizing Multi - Scale Regi onal Mixer GCN Stream V iew Attention Mechanism Quad - Map Gener a tion Neur oGr aph Block × N GCN Stream GCN Stream GCN Stream fMRI Matrix(R) 𝐴 𝑝𝑜𝑠 𝐿 𝑝𝑜𝑠 𝑠𝑚𝑜𝑜𝑡 ℎ Outp ut Layer Block (Ours) (Conventional GCN) MLP cla ssi fier Outpu t Edge Attent io n Pooli ng SN SN Fig. 1. Ov erview of the LUMINA framework. Unlike con ven tional GCN(T op), our mo del(Bottom) incorp orates a quad-stream input to capture div erse connectivit y patterns. After pro cessing by the Multi-Scale Regional Mixer and multiple GCN streams, they are passed through atten tion mec hanism for final classification. 2.2 Breakdo wn of LUMINA framework Laplacian Filters and Quad-stream generation Let X ( i ) ∈ R N × T denote the fMRI time-series data for the i -th sub ject, where N = 111 represen ts the 4 M. Cha et al. n umber of Regions of In terest (ROIs) defined b y the HO atlas, and T = 140 is the n umber of time p oin ts. W e first construct a functional connectivit y matrix R ( i ) ∈ R N × N b y computing the Pearson correlation co efficien t b et ween all pairs of R OIs. F or any t wo regions u and v , the correlation R uv is defined as: R uv = P T t =1 ( x u,t − ¯ x u )( x v ,t − ¯ x v ) q P T t =1 ( x u,t − ¯ x u ) 2 q P T t =1 ( x v ,t − ¯ x v ) 2 (2) This matrix R ( i ) serv es as the initial input feature for our mo del. T o preserv e each distinct connection, we decompose R in to p ositive and negativ e comp onen ts using the Rectified Linear Unit (ReLU) twice: A pos = ReLU ( R ) , A neg = ReLU ( − R ) (3) Next, w e construct tw o types of sp ectral filters to capture the full spatial frequency . In Graph Signal Pro cessing (GSP), the normalized graph Laplacian, defined as L sy m = I − ˆ A (where ˆ A = D − 1 / 2 AD − 1 / 2 is the symmetric normalized adjacency matrix and D is the degree matrix), serves as an op erator whose eigenv alues corresp ond to graph frequencies. In LUMINA, w e first formulate a Smo othing filter as L smooth = I + ˆ A . This op eration approximates a first-order low-pass filter on the graph spectral domain[12]. Second, we form ulate a Differential filter defined as L dif f = I − ˆ A . This acts as a high-pass filter that amplifies the differences b et w een connected no des. Applying these tw o filters to the previously created comp onen ts yields the follo wing four equations: L smooth pos = I + ˆ A pos , L dif f pos = I − ˆ A pos L smooth neg = I + ˆ A neg , L dif f neg = I − ˆ A neg (4) Consequen tly , this generates a set of quad-stream spatial priors, expressed as: L = { L smooth pos , L dif f pos , L smooth neg , L dif f neg } (5) where b oth p ositiv e/negative connection and high/low spatial frequency are conserv ed. NeuroGraphBlo c k and Final Classification The next stage of LUMINA consists of an initial em b edding la yer, stack ed NeuroGraph Blo c ks, and a final classification head. W e first employ a Multi-Scale Regional Mixer, using 1D con volutions with dilation rates of ( d = { 1 , 2 , 5 } ) to extract the regional context b et w een organized R OIs. Next, w e pro cess the no de features H through four parallel GCN streams, eac h guided by one of the maps in L from Eq. 5. The no de represen tation from the k -th prior ( k ∈ { 1 , . . . , 4 } ) in L is denoted as: Z k = L k H W k (6) where Z k ∈ R N × d out , L k ∈ R N × N , H ∈ R N × d in , and W k ∈ R d in × d out . LUMINA: Quad-Stream GCN f or Neurodevelopmen tal Diagnosis 5 Instead of a simple concatenation, w e introduce a View A ttention mechanism to w eight the importance of each view. The atten tion score e k for the k -th view is computed via a t wo-la yer neural net w ork: e k = tanh( Z k w v + b v ) w attn (7) where w v , w attn , and b v are learnable parameters with b v denoting a bias term shared across all N instances via broadcasting, and the resp ectiv e dimensions are e k ∈ R N × 1 , w v ∈ R d out × d hidden , b v ∈ R 1 × d hidden , and w attn ∈ R d hidden × 1 . The final atten tion weigh ts α k are obtained b y applying a softmax function across the four views: α k = exp( e k ) P 4 j =1 exp( e j ) (8) The represen tation is then computed as the weigh ted sum of the four views: H spatial = 4 X k =1 α k Z k (9) Finally , an Edge A tten tion P o oling lay er aggregates the no de-lev el features into a graph-lev el represen tation v ector, which go es through MLP for final classification. 3 Exp erimen ts and Results 3.1 Exp erimen tal Setup Datasets. F or ev aluation, w e used rs-fMRI data from t w o public rep ositories: the Autis m Brain Imaging Data Exchange (ABIDE) and the ADHD-200. W e emplo yed the prepro cessed data of Harv ard-Oxford (HO) atlas generated by the Configurable Pip eline for the Analysis of Connectomes (ABIDE), or the Athena pip eline (ADHD-200). Each of the 5-fold dataset was adjusted to main tain an balanced ratio in b oth labels(1:1) and data sources. The final cohort consisted of N=579 (ABIDE) and N=144 (ADHD-200) sub jects. Baseline Mo dels for Comparison. F or general graph-based baselines, w e emplo yed Graph Conv olutional Net works (GCN) and Graph Atten tion Netw orks (GA T). The input functional connectomes were transformed using absolute v alues ( | R | ). F or domain-sp ecific baselines designed for connectome analysis, w e employ ed BrainNetCNN and BrainGNN. Implemen tation Details. The hyperparameters for LUMINA w ere set as follo ws: d out = d in = d hidden = 48 , n um b er of la yers L = 3 , learning rate η = 2 e − 4 with A dam W optimizer, and weigh t deca y λ = 1 e − 2 . 6 M. Cha et al. T able 1. Classification p erformance of LUMINA and four baseline mo dels. The best results are highligh ted in b old. Dataset Mo del A ccuracy (%) A UC F1-Score ADHD-200 GCN 81 . 71 ± 3 . 50 0 . 819 ± . 058 0 . 796 ± . 016 GA T 83 . 04 ± 8 . 70 0 . 839 ± . 147 0 . 816 ± . 095 BrainNetCNN 78 . 44 ± 7 . 57 0 . 794 ± . 092 0 . 762 ± . 075 BrainGNN 74 . 23 ± 10 . 56 0 . 735 ± . 122 0 . 594 ± . 344 LUMINA(ours) 84 . 66 ± 9 . 53 0 . 861 ± . 097 0 . 849 ± . 103 ABIDE GCN 78 . 19 ± 3 . 80 0 . 839 ± . 040 0 . 775 ± . 046 GA T 83 . 91 ± 1 . 26 0 . 888 ± . 032 0 . 838 ± . 017 BrainNetCNN 82 . 00 ± 2 . 26 0 . 903 ± . 036 0 . 810 ± . 029 BrainGNN 62 . 30 ± 13 . 04 0 . 703 ± . 151 0 . 371 ± . 331 LUMINA(ours) 88 . 41 ± 1 . 57 0 . 936 ± . 018 0 . 885 ± . 016 3.2 P erformance Ev aluation T able 1 summarizes the p erformance comparison of LUMINA against 4 architec- tures. Our mo del ac hieved a mean classification accuracy of 84.66% and 88.41% in ADHD200 and ABIDE resp ectiv ely , outp erforming all baseline models. 3.3 Ablation Study W e p erformed an ablation study to ev aluate the individual contributions of LUMINA’s eac h comp onent(T able 2). W e first tried replacing bidirectional RELU with absolute v alues | R | ( w/o B/R ). The accuracy remained roughly the same in ABIDE, but decreased by 25.76% in ADHD200. The remov al of Dual-stream Lapla- cian( w/o D/L ) also led to similar result. The remo v al of NeuroGraphblock( w/o N/G ) led to decrease in p erformance in b oth datasets, by 21.96%(ADHD200) and 18.01% (ABIDE). The final remov al of all 3 key comp onen ts of LUMINA(Baseline) resulted in decrease b y 21.26%(ADHD200) and 18.81%(ABIDE) resp ectiv ely . 3.4 P ost-ho c analysis W e p erformed p ost-ho c analysis via In tegrated Gradien ts (IG) to identify the underlying factors contributing to the mo del’s decision[13]. W e extracted the 111 × 111 attribution map from the trained LUMINA framew ork in the b est fold of ADHD and ASD, and the results are shown in Fig. 2 and T able 3. In ADHD, all top 5 edges w ere hyperconnected, b elonging in either Somatosensory(SMN) or Cen tral Executive Net work(CEN). In ASD, some hypo connected edges w ere iden tified among the top 1% but not in top 5, which were from CEN, Limbic Net work(LN), and etc. P ost-ho c analysis rev eals that the primary biomarkers div erge b et ween the t w o disorders. The hea vy reliance on hy p erconnected edges within the SMN and CEN suggests that ADHD is strongly asso ciated with the failure to suppress those LUMINA: Quad-Stream GCN f or Neurodevelopmen tal Diagnosis 7 T able 2. Ablation study of LUMINA V arian t Comp onen ts Metrics B/R D/L N/G A cc (%) A UC F1 Dataset: ADHD-200 Baseline 63 . 4 ± 3 . 6 0 . 625 ± . 054 0 . 618 ± . 071 LUMINA w/o B/R ✓ ✓ 58 . 9 ± 4 . 8 0 . 584 ± . 053 0 . 585 ± . 045 LUMINA w/o D/L ✓ ✓ 60 . 9 ± 2 . 8 0 . 608 ± . 040 0 . 619 ± . 031 LUMINA w/o N/G ✓ ✓ 62 . 7 ± 4 . 9 0 . 622 ± . 048 0 . 602 ± . 064 LUMINA (full) ✓ ✓ ✓ 84 . 7 ± 9 . 5 0 . 861 ± . 097 0 . 849 ± . 103 Dataset: ABIDE Baseline 69 . 6 ± 0 . 8 0 . 724 ± . 016 0 . 698 ± . 029 LUMINA w/o B/R ✓ ✓ 88 . 4 ± 4 . 3 0 . 934 ± . 027 0 . 885 ± . 043 LUMINA w/o D/L ✓ ✓ 88 . 2 ± 3 . 9 0 . 932 ± . 034 0 . 884 ± . 040 LUMINA w/o N/G ✓ ✓ 70 . 4 ± 1 . 3 0 . 728 ± . 022 0 . 709 ± . 016 LUMINA (full) ✓ ✓ ✓ 88 . 4 ± 1 . 6 0 . 936 ± . 018 0 . 885 ± . 016 * B/R: Bidirectional ReLU, D/L: Dual-stream Laplacian, N/G: NeuroGraph Blo c k. net works, a conclusion consistent with established findings[14]. Meanwhile in ASD, the mixed presence of connections hint that a more heterogeneous disruption of so cio-emotional and cognitiv e in tegration may underlie. ADHD ASD top1 top2 top3 top4 top5 Fig. 2. P ost-hoc analysis of ADHD and ASD via the LUMINA framework. T op 1% ( ≈ 61 ) connections with highest IGs are sho wn as lines, with top 5 highlighted in distinct colors. The rest are visualized on a colorsc ale from blue ( − 1 ) to red ( +1 ). 4 Conclusion W e prop ose LUMINA, a quad-stream GCN-based framework for fMRI based clinical diagnosis that preserves the heterogeneous neural connection through unique pro cessing with bidirectional RELU and dual laplacian filtering. Compar- ison against baseline models demonstrates the stable p erformance of LUMINA 8 M. Cha et al. T able 3. T op 5 F unctional Connections for ADHD and ASD Groups Rank R IG No de A (Netw ork) No de B (Netw ork) T op 5 ADHD Conne ctions 1 0.67 0.0081 Right P arietal Op erculum Cortex (SomatoMotor B) Left Middle T emp oral Gyrus; temporo o ccipital part (Control C) 2 0.63 0.0056 Right Middle T emporal Gyrus; temporo o ccipital part (Control C) Left Middle T emp oral Gyrus; temporo o ccipital part (Control C) 3 0.53 0.0051 Right P arietal Op erculum Cortex (SomatoMotor B) Right Middle T emp oral Gyrus; temporo o ccipital part (Control C) 4 0.61 0.0051 Right Inferior T emporal Gyrus; posterior division (Control C) Left Middle T emp oral Gyrus; temporo o ccipital part (Control C) 5 0.75 0.0048 Right P ostcentral Gyrus (SomatoMotor A) Left Superior T emporal Gyrus; anterior division (T empPar) T op 5 ASD Conne ctions 1 0.58 0.0246 Left Supramarginal Gyrus; posterior division (V entral Atten tion) Right Middle T emp oral Gyrus; anterior division (T emp oroP arietal) 2 0.36 0.0157 Left F ron tal Pole (Limbic B) Left Middle F rontal Gyrus (Control B) 3 0.66 0.0150 Left F ron tal Orbital Cortex (Limbic B) Right F rontal Pole (Limbic B) 4 0.37 0.0140 Left Middle F rontal Gyrus (Control B) Right Middle T emp oral Gyrus; anterior division (T empPar) 5 0.50 0.0140 Left F ron tal Pole (Limbic B) Left Superior F ron tal Gyrus (Control A) * R: Correlation v alue, IG: In tegrated Gains. across subt yp es of neurodevelopmen tal disorders, and p ost-hoc analysis on the mo del’s performance iden tified the key net w orks and connections that aligned with established findings, suggesting the potential as an effectiv e, in terpretable diagnostic model. W e exp ect the proposed framework to act as an insight in to relativ ely unexplored neurological disorders in future research. References 1. Li, Q., et al.: Prev alence and trends of dev elopmental disabilities among US chil- dren and adolescents aged 3 to 17 years, 2018–2021. Sci. Rep. 13, 17254 (2023). h ttps://doi.org/10.1038/s41598-023-44472-1 2. Da wson, G., et al.: Randomized, controlled trial of an in terven tion for to ddlers with autism: the Early Start Den ver Mo del. Pediatrics 125(1), e17–e23 (2010). h ttps://doi.org/10.1542/p eds.2009-0958 3. Musullulu, H.: Ev aluating attention deficit and h yp eractivit y disorder (ADHD): a review of current metho ds and issues. F ron t. Psychol. 16, 1466088 (2025). h ttps://doi.org/10.3389/fpsyg.2025.1466088 4. Ev ans, J.A., et al.: What Y ou Are Hiding Could Be Hurting Y ou: Autistic Masking in Relation to Men tal Health, Interpersonal T rauma, Authenticit y , and Self-Esteem. Autism A dulthoo d 6(2), 229–240 (2024). h ttps://doi.org/10.1089/aut.2022.0115 LUMINA: Quad-Stream GCN f or Neurodevelopmen tal Diagnosis 9 5. F air, D.A., et al.: A typical Default Net work Dev elopment in A ttention- Deficit/Hyp eractivit y Disorder. Am. J. Psychiatry 167(10), 1218–1227 (2010). h ttps://doi.org/10.1176/appi.a jp.2010.09091379 6. Logothetis, N.K., et al.: Neurophysiological inv estigation of the basis of the fMRI signal. Na ture 412(6843), 150–157 (2001). https://doi.org/10.1038/35084005 7. Cross-Disorder Group of the Psychiatric Genomics Consortium, et al.: Shared and distinct genetic v arian ts for autism sp ectrum disorder and atten tion- deficit hyperactivity disorder. Mol. Psychiatry 19(11), 1150–1159 (2014). h ttps://doi.org/10.1038/mp.2013.78 8. Smith, S.M., et al.: Net work modelling methods for FMRI. NeuroImage 54(2), 875–891 (2011). h ttps://doi.org/10.1016/j.neuroimage.2010.08.063 9. Ch u, Y., et al.: Multi-Scale Graph Represen tation Learning for Autism Iden ti- fication With F unctional MRI. F ront. Neuroinform. vol. 15, pp. 802305 (2022). h ttps://doi.org/10.3389/fninf.2021.802305 10. Hammond, D.K., V andergheynst, P ., Grib on v al, R.: W a velets on graphs via sp ectral graph theory . Appl. Comput. Harmon. Anal. 30 (2), 129–150 (2011). h ttps://doi.org/10.1016/j.acha.2010.04.005 11. P arisot, S., et al.: Disease prediction using graph conv olutional netw orks: Application to Autism Spectrum Disorder and Alzheimer’s disease. Med. Image Anal. v ol. 48, pp. 117 –130 (2018). https://doi.org/10.1016/j.media.2018.06.001 12. Kipf, T.N., W elling, M.: Semi-supervised classification with graph conv olutional net works. In: In ternational Conference on Learning Representations (ICLR) (2017) 13. Sundarara jan, M., et al.: Axiomatic Attribution for Deep Netw orks. In: Pre- cup, D., T eh, Y.W. (eds.) ICML 2017, PMLR, vol. 70, pp. 3319–3328 (2017). h ttps://doi.org/10.48550/arXiv.1703.01365 14. Sripada, C., Kessler, D., F ang, Y., W elsh, R.C., Kumar, K.P ., Angstadt, M.: Disrupted net work arc hitecture of the resting brain in attention- deficit/h yp eractivit y disorder. Hum. Brain Mapp. 35(9), 4693–4705 (2014). h ttps://doi.org/10.1002/hbm.22504
Original Paper
Loading high-quality paper...
Comments & Academic Discussion
Loading comments...
Leave a Comment