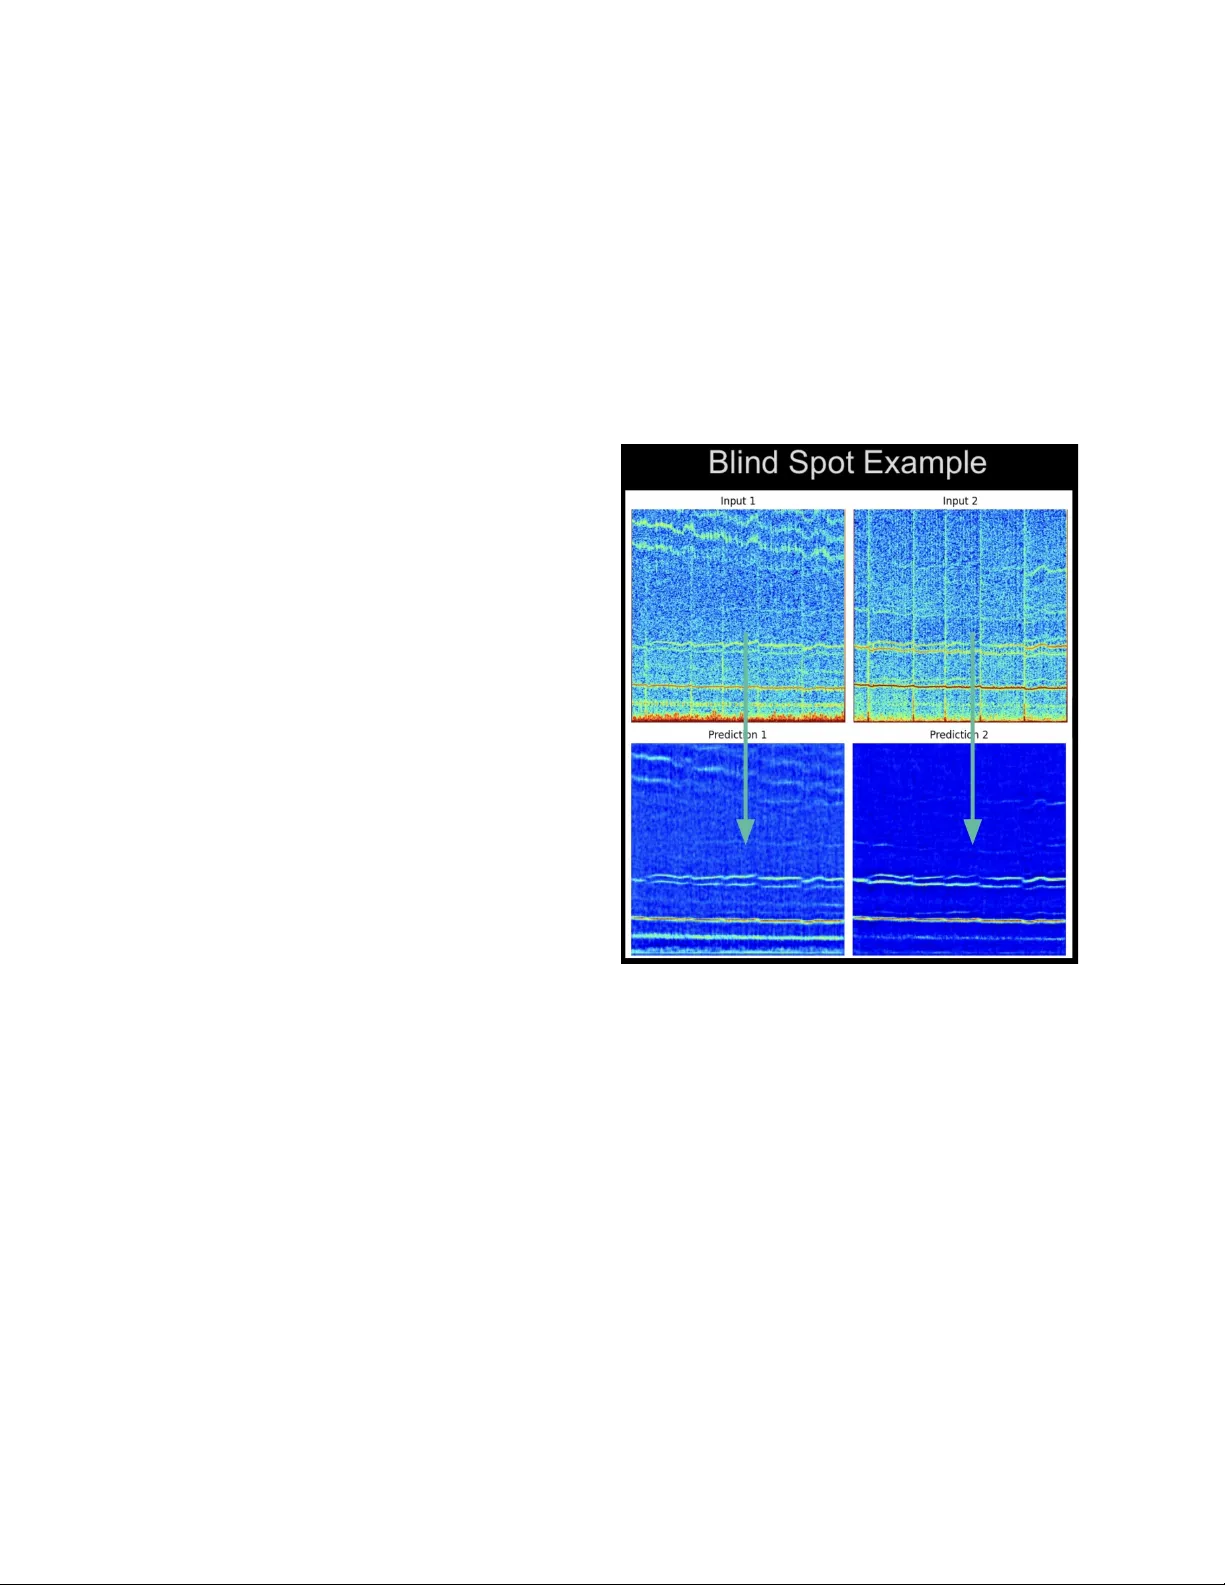
TokEye: Fast Signal Extraction for Fluctuating Time Series via Offline Self-Supervised Learning From Fusion Diagnostics to Bioacoustics
Next-generation fusion facilities like ITER face a "data deluge," generating petabytes of multi-diagnostic signals daily that challenge manual analysis. We present a "signals-first" self-supervised framework for the automated extraction of coherent a…
Authors: Nathaniel Chen, Kouroche Bouchiat, Peter Steiner
T okEy e: F ast Signal Extraction for Fluctuating Time Series via Offline Self-Sup ervised Learning F rom F usion Diagnostics to Bioacoustics Nathaniel Chen Kouro c he Bouc hiat Peter Steiner Andrew Rothstein Da vid Smith Max Austin Mik e v an Zeeland Azarakhsh Jalalv and Egemen Kolemen F ebruary 27, 2026 Abstract Next-generation fusion facilities lik e ITER face a ”data deluge,” generating p etabytes of m ulti- diagnostic signals daily that c hallenge manual anal- ysis. W e presen t a ”signals-first” self-sup ervised framew ork for the automated extraction of coheren t and transient modes from high-noise time-frequency data across a v ariet y of sensors. W e also develop a general-purp ose metho d and to ol for extracting coheren t, quasi-coherent, and transien t mo des for fluctuation measuremen ts in tok amaks by emplo ying non-linear optimal techniques in multic hannel signal pro cessing with a fast neural net work surrogate on fast magnetics, electron cyclotron emission, CO2 in- terferometers, and beam emission sp ectroscop y mea- suremen ts from DI I I-D. Results are tested on data from DI II-D, TJ-II, and non-fusion sp ectrograms. With an inference latency of 0.5 seconds, this frame- w ork enables real-time mo de iden tification and large- scale automated database generation for adv anced plasma control. 1 In tro duction Understanding the complex in ternal state of a tok a- mak relies on interpreting a v ast array of diagnos- tic signals. These signals can help scientists iden- tify the plasma’s op erational state, transient even ts, and p oten tially damaging disruptions. Key classes of these phenomena, including coherent mo des suc h as magnetohydrodynamic (MHD) instabilities and Alfv ´ en eigenmo des (AE), and transien t modes such as edge localized mo des (ELM) and neutral particle spik es, manifest as fluctuations, typically in frequen- cies ranging from 0 to 250kHz [1, 2, 3, 4]. These ev ents are b est analyzed in the time-frequency do- main, where their sp ectral signatures contain rich in- formation ab out the plasma’s state. Ho wev er, consistently extracting these signatures presen ts a formidable c hallenge. T ok amak measure- men ts can b e in undated with high levels of sto c hastic and integrated noise as well as ov erlapping transient burst ev ents that can obscure measuremen ts of coher- en t mo des. This often remov es faint but ph ysically significan t ev ents, rendering simple threshold-based iden tification metho ds ineffectiv e. Consequently , sci- en tists and engineers must rely on time-consuming man ual p ost-processing and color mapping or a set of filterbanks designed for each set of sp ecific diag- nostics to to iden tify even ts of in terest, scouring logs and large datasets for sp ecific shots. With so many metho ds of data processing, this analysis b ottlenec k not only slows the pace of physics disco very but can also restrict data lab eling in fusion, a critical prereq- uisite for training mo dern artificial intelligence (AI) mo dels as most efforts in time-frequency (TF) data annotation has fo cused on either broad lo cation an- 1 notation or annotation of very specific ev ents in small datasets without a unified annotation metho d. This c hallenge is becoming critical. As the fusion com- m unity progresses tow ards burning plasma regimes, data volume rapidly grows; facilities like ITER are pro jected to generate ov er a p etab yte of data daily [5]. AI has previously assisted in identifying plasma phenomena [6, 7]. Solutions for mo de identification ha ve explored prior-based mode segmen tation [8, 9] and a neural-netw ork based unsup ervised database creation from magnetic diagnostics [10]. How ever, these methods are often deploy ed on sensors that re- solv e stationary signals with little white noise. De- v eloping a metho d that w orks across m ultiple types of sensors is difficult. Alternatively , manually anno- tated and sim ulation-based datasets induce a bias to- w ards well-modeled phenomena and may fail to gen- eralize to no vel plasma scenarios or new diagnostics. In addition, these algorithms ma y b e computation- ally exp ensiv e, making them difficult for real-time analysis. The rest of the pap er is organized as follo ws: In Section 2.1, we dev elop a taxonom y of generally ob- serv ed signal t yp es. Next, w e use a self-sup ervised metho d to automatically create the lab eled dataset that surrogate mo del can train on across a wide range of different diagnostics. This includes incorp orat- ing an automated baseline iden tification for unified broadband turbulence and TF-impulse separation without explicit lab els in Section 2.3, a non-linear m ultichannel cross-sp ectrum inspired self-sup ervised signal enhancement in Section 2.4, robust threshold- ing for sp ectrograms in Section 2.5, and label correc- tion in Section 2.6. W e detail the dev elopment of this pro cess and demonstrate its capabilities by employ- ing surrogate machine learning mo dels for direct in- terpretable ev ent analysis. This is demonstrated on four represen tative case studies: electron cyclotron emission (ECE), Carb on Dioxide based interferome- ters (CO 2 ), Magnetics High Resolution (MHR), and b eam emission sp ectroscop y (BES) [11, 12, 13, 14]. 2 Metho ds W e approach this task with the goal of b eing able to cleanly separate p oten tial signals of interest directly from a background. In order to develop a general algorithm that w orks across a broad range of fluctu- ation measurements, a signals-first approach to data extraction is preferred since there can be a v ariet y of physically observed signals that are sparsely de- scrib ed throughout literature. Constructing a labeled fusion database requires distinguishing physical sig- nals from noise. How ever, fusion diagnostics can con- tain sup erpositions of many phenomena not limited to tearing modes (TM), AE, ELM, broadband turbu- lence, pow er injections, antenna scans, and thermal fluctuations whic h blur the b oundary betw een signal and noise [15]. In addition, some phenomena can only b e observ ed on sp ecialized diagnostics. There- fore, it is necessary to distinguish general classes of signals based on their characteristics and in a metho d as agnostic to the sensor-type as p ossible. 2.1 Defining a general taxonom y of signals T o our kno wledge, while it is widely known in the fusion comm unity , there has been no single formal- ized taxonom y of observ ed fusion-based signals y et that we can reference as a means of separating sig- nals into comp onents. Therefore, w e prop ose to de- v elop one based on the ph ysical b eha vior of nonsta- tionary time series and diagnostics. Time series can b e classified in to deterministic and random pro cesses, with deterministic pro cesses classified as p eriodic and non-p eriodic while random pro cesses can b e classi- fied as stochastic and non-sto chastic pro cesses [16]. F or the goal of sp ectrogram visualization, w e cate- gorize these signals in to five distinct classes: coher- en t, quasi-coherent, transient, broad, and sto c has- tic measurements, with coherent and quasicoherent mo des sharing a general category of coherent mea- suremen ts, transient and broad ev ents sharing a cat- egory of broadband measuremen ts, and sto c hastic measuremen ts in the cateogry of noise. A summary can b e found in Figure 1. Since deterministic p eriodic b eha vior arises from 2 Figure 1: Signal taxonomy with example mo des and sp ectra. resonance at sp ecific energy levels, w e can define these as having a well-defined frequency at a p oin t in time. This is often the principal signal measured in magnetic measurements, as they measure changes to the equlibirium state of the plasma. By doing so, it comes with the b enefit that the signal by default will giv e clean frequency bands. How ever, the frequency need not be the same o ver time. Changes in energy distribution can lead to chirping structures, which is well observed in man y fields. Therefore, we can relate this general class of signals to our understand- ing of coherent modes in fusion, where narrowband c haracteristics p ersist o v er a certain amoun t of time. These can include neoclassical tearing mo des (NTM), geo desic acoustic mo des (GAM) TM, AE, and kinks. Nonp eriodic deterministic behavior can b e de- scrib ed as deterministic c hanges in measurements, suc h as global c hanges in curren t or densit y o ver time as an exp eriment is run. Ho wev er, these are not pic ked up w ell b y fourier transforms since edge effects can cause a large amount of frequency conten tration in the low er frequencies that follow an inv erse p o w er la w. In certain cases, we can also mo del these as tran- sien t ev ents such as ELM, p ellet injections, sa wto oth crashes and disruptions. Interestingly , due to the im- pluse nature of an ELM, its time-frequency transform often app ears as a spike since it is a broadband sig- nature ov er a short p eriod of time. The spik es in fusion literature are often referred to as transients, since they are instantaneous even ts that can b e mo d- eled as deterministic changes to the plasma state. Random sto c hastic pro cesses hav e the prop ert y of noise b eing mean-centered. While man y mo dels tend to assume gaussian noise, real world signals can of- ten contain a m yriad of stochastic noise that is not purely gaussian. This can include laplacian and uni- form noise with ph ysical underpinnings ranging from thermal noise to electronics-induced noise. Nonstationary behavior is often defined by chaotic cascading ev ents or Bro wnian-like motion. This giv es it unique b ehavior around certain energy levels, but can often lead to a drop off in observed frequency that roughly follows Kolmogorov-t yp e cascades or more adv anced fractal patterns. This is often describ ed in turbulence literature, as they measure the nonsta- tionary b eha vior of the plasma using measurements of fractional changes to the plasma state [17]. In most literature, it is observ ed to follo w a 1 /f χ drop off where 0 < χ < 2 [18]. Here, w e also include inte- grated sto chastic b eha vior, also known as Bro wnian noise, since it can b e describ ed by a sto c hastic pro- cess with χ = 2. By characterizing 1 /f b eha vior gen- erally , we can now account for χ of any scale, ev en that which is measured to be greater than 2 [19]. This same frequency distribution follo ws that of determin- istic nonp erio dic signals. This is an imp ortan t p oint to note since separating deterministic mov ements and nonstationary drifts is not trivial, and th us motiv ates us to group these tw o together as broad modes, since they b oth create broad, spanning structures in b oth the time-frequency domain. Quasicoheren t mo des are a special class of mo des more unique to T ok amak literature [20]. This is b e- cause fusion can contain phenomena that can com- fortably exist b etw een these categories as defined ab o v e. So this can fall somewhere b et ween pure oscillation, c haotic b eha vior, and stochastic b ehav- ior, with modes of interest often exhibiting more coheren t-like resonan t structures. Coheren t and quasicoheren t mo des can b e though t of as sharing a general category since they b oth in- v olve analysis of a lo calized time-frequency signature just with added uncertaint y for quasicoherent struc- tures. T ransient and broad even ts can b e thought 3 of as another more general category where measure- men ts of interest span a wide range of frequencies, where transien ts are sp ecifically an instantaneous case without a different frequency profile; let us call these broadband measurements. Finally , stochastic measuremen ts can b e though t of as uncertain v ari- ance; note that this do es not include coherent noise suc h as an tenna scans, and suc h – but those require prior knowledge, so should b e treated as suc h after b eing classified as a generic measurement from the previous categories. Breaking this down into three main categories and fiv e sub categories allows us to isolate the op erations of diagnostic pro cessing while trying to sift through signals. Research in denoising often employs some sort of a veraging in coherent signals, be it on the direct signal, in b et ween signals, or within some la- ten t space. Ho wev er, it necessitates that all other measuremen ts that need to b e remov ed are stochas- tic. Since w e may ha ve a broadband class of coheren t signals, w e need to first isolate them b efore denois- ing at risk of broadband signals ov erp o wering faint, coheren t signals (such as in the case of AE mo des in integrated diagnostics). Therefore, our pro cessing pip eline will first isolate the broadband signals from coheren t signals, then denoise the coherent signals to extract high fidelity modes. 2.2 Time-F requency T ransformation While w av elet decomposition and Slepian-based m ul- titap er metho ds offer theoretical adv antages, esp e- cially with remo ving broadband and coherent noise resp ectiv ely , they come with interpretabilit y draw- bac ks and can also result in linear remov al of faint coheren t mo des. Therefore we utilize the short-time F ourier transform (STFT) for its computational ef- ficiency and compatibility with existing fusion w ork- flo ws e.g., MODESPEC [10, 21, 13]. First, to ensure replicabilit y , signals on all diagnostics used are resam- pled to 500 kHz (8th-order Cheb yshev T yp e I deci- mation with phase preserv ation) and processed using a Hann window ( N = 1024, ov erlap=87.5%) to bal- ance time-frequency resolution [22, 23]. All resulting sp ectrograms therefore span from 0 to 250kHz, which is often a go od upper limit at which AE mo des can b e observ ed [24]. Data is pro cessed via F usion Artifi- cial Intelligence and T o olkit Hub (F AITH), a Python pac k age and fusion database optimized for high p er- formance mac hine learning [25]. Crucially , our down- stream enhancement and extraction tec hniques are designed to b e agnostic to the specific time-frequency represen tation of a signal. The pro cessing pipeline is demonstrated in Figure 2 using an ECE channel from shot 178631. Here, w e ha ve a real-v alued time domain signal x ( t ) with its complex STFT representation Z ( t, f ) = STFT { x ( t ) } (1) and its log-p o wer represen tation P ( t, f ) = | Z ( t, f ) | 2 (2) w e also define its real and imaginary comp onenents R + j I = Re { Z } + j Im { Z } (3) Giv en the ab o v e class definitions, we can decom- p ose Z ( t, f ) in to three comp onen ts: Z ( t, f ) = M ( t, f ) + V ( t, f ) + η ( t, f ) (4) where M ( t, f ) are the coherent observ ations, V ( t, f ) are the broadband observ ations, and η ( t, f ) is the sto c hastic noise. 2.3 Separating Broadband Observ a- tions Sensors that measure nonp erio dic phenomena can b e dominated by strong measures of turbulence or other nonstationary mov ements. This can result in broadband high-amplitude, structured bac kground that can globally obscure faint coheren t mo des. Therefore, our goal here is to separate V ( t, f ) from Z ( t, f ). This problem resembles that of harmonic p ercussiv e separation (HPS) in which harmonics, or horizon tals, are distinct from p ercussive, or verticals in music [26]. How ev er, since this t yp e of measure- men t can b e a mix of chaotic or random even ts with up to infinite correlation, it is difficult to define a sin- gle digital filter that mo dels and extracts this based 4 (a) Raw spectrogram pro cessing with characteristic lo w- frequency bias. Direct thresholding obscures faint AE mo des. (b) Baseline remo v al: The estimated broadband baseline V ( t, f ) is subtracted to isolate coherent structures from the background, effectiv ely whitening the signal. (c) Multichannel denoising: The baseline-corrected sp ec- tra after self-supervised denoising reveals coherent mo de structures with sto chastic noise suppressed. Figure 2: Signal pro cessing pip eline for ECE shot 178631 demonstrating progressive separation of co- heren t mo des from broadband bac kground and sto c hastic noise. (left) Ra w STFT p o wer spectra. (cen ter) W elch p eriodogram, which is the time av- eraged sp ectrogram. (right) Thresholding on p o wer sp ectra. purely on the dynamics of the time series. Station- arizing a signal or clipping the direct current (DC) bin, or that of the first order fast F ourier transform (FFT) can theoretically remov e the first order trend, whic h helps with fit stability , but since the frequency bins follo w the p ow er law, it often has very little ef- fect. So sp ectral analysis of highly dynamic diagnos- tics suc h as CO 2 often include clipping a full segmen t of lo w-frequency bins, up to a certain point such as 40kHz where the bac kground slope becomes less ex- treme [27]. How ever, this functions at the exp ense of p ossibly losing low-frequency mode information. Therefore, a more robust metho d is needed in whic h w e directly fit a filter to the energy cascade. T urning to sp ectroscop y , methods hav e b een adapted previously to address this in the purely fre- quency domain, mo deling this background curv ature as a ”baseline” with signals of interest as p eaks on top of the general sp ectral background. T o isolate V ( t, f ), we can adopt robust baseline remov al tech- niques [28, 29]. The core of this approach is to es- timate the baseline V ( f , t ) of eac h FFT sample and subtract this, then divide it by the v ariance b et ween the residual using an asymmetric optimizer or wa velet decomp osition. This is based on even t-related sp ec- tral p erturbation (ERSP) whic h is widely used in electro encephalograph y (EEG) signal pro cessing for ev ent isolation in brains which sho w similar drifting b eha vior [30]. Removing the baseline effectively flat- tens the signal such that broadband structures are an indep enden t set of measuremen ts while coheren t mo des and stochastic noise are preserv ed. In other w ords, since the color of the signal is remo ved, the residual signal is a ”whitened” form of the original signal. The baseline can b e estimated b y solving the follo wing optimization problem: min V X t,f w ( t, f )( P ( t, f ) − V ( t, f )) 2 + λ X t,f |∇ 2 V ( t, f ) | (5) where P ( t, f ) is the observ ed p o wer sp ectrogram, V ( t, f ) is the estimated baseline, w ( t, f ) is an asym- metric weigh t function defined as w ( t, f ) = ( p if P ( t, f ) > V ( t, f ) 1 − p if P ( t, f ) ≤ V ( t, f ) (6) 5 with p typically set to 0 . 001 to p enalize p ositiv e resid- uals more hea vily , and λ is the smo othness parame- ter con trolling the second-order deriv ativ e regulariza- tion term ∇ 2 V ( t, f ). W e use the standard v alue of λ = 10 6 for asymmetric least squares, whic h balances fitting fidelity with smo othness constraints to accu- rately capture the broadband baseline structure while preserving sharp coherent mo de features. T o distinguish broadband and transien t even ts, we simply turn to the definition of transient even t and note that it demarks a transition. These broadband measuremen ts can then be separately pro cessed out b y measuring the av erage impulse of time-slices in the filtered measurement if needed. An imp ortan t note is that this metho d is not p er- fect, and may contain strong edge effects on certain sensors which causes fitting error to propagate down the line. W e hav e observed this to extend to 4kHz on our 250kHz sp ectra. In order to mitigate this effect, a pre-emphasis filter which follows the equation P ′ ( t, f ) = P ( t, f ) · f α (7) and assumes a first order inv erse p o wer law where α = 1 is first used [31]. 2.4 Separating Coheren t Signals from Sto c hastic Noise F ollowing the whitening of Z , the coheren t mo de sp ectrogram C ( f , t ) = M ( f , t ) + η ( f , t ) remains cor- rupted by sto c hastic white noise, η which can b e comprised of v arious types of white noise including gaussian noise, laplacian noise, and uniform noise due to physical phenomena suc h as thermal noise. While numerous metho ds exist to mitigate noise, they present critical limitations for this sp ecific ap- plication. Linear filters (e.g., Gaussian/Wiener fil- ters, BM3D) tend to av erage out the fain t, transien t, and non-stationary signals we aim to preserve [32]. Con versely , sparse transforms (e.g., w av elet, curv elet) rely on strong priors regarding signal morphology , while mo dal decomposition techniques [e.g., empiri- cal mo de decomposition (EMD), v ariational mo de de- comp osition (VMD)] are computationally prohibitiv e for large-scale database generation or quick intershot analysis [33]. Multic hannel methods are often used, particularly in tok amaks where it is the standard sig- nal enhancing metho d b efore physics analysis is con- ducted. Ho wev er, classical extensions suc h as singu- lar sp ectrum analysis (SSA) or MUSIC scale exp o- nen tially with c hannel count, limiting decomp osition to small time slices and also creating a strong v ari- ance tradeoff betw een c hannels that ma y not b e com- pletely linearly correlated [34, 35]. T o address the bias-v ariance tradeoff, hardw are approaches to de- noising implements closely spaced sensors such as cor- relation electron cyclotron emission (CECE) which effectiv ely provides tw o measures of the same phe- nomena [36]. Ho wev er, this is not alwa ys feasible due to budget or engineering constraints. And in future fusion plan ts, these diagnostics may not b e planned suc h as in SP AR C or ITER [37, 38]. T o address these limitations, we extend m ultichan- nel correlation—similar to the classical cross-p o wer sp ectrum (CPS) using a non-linear deep learning es- timator. The CPS betw een t w o signals, x ( t ) and y ( t ), is defined as the exp ected v alue of the raw cross- p eriodogram: M xy ( f ) = E { M x ( f ) M y ( f ) ∗ } (8) where M x ( f ) and M y ( f ) are the STFT of t wo given signals [16]. The noise reduction in this metho d arises from the complex conjugate multiplication M x M ∗ y , follo wed b y the exp ectation op erator E {·} . Explicitly , the pro duct is: M x M ∗ y = ( R x R y + I x I y ) + i ( I x R y − R x I y ) (9) where R is the real part of M and I is the imagi- nary part. Under the exp ectation E {·} , incoheren t random phase relationships in the noise terms cancel out, lea ving only components with coheren t phase re- lationships. Ho wev er, this acts as a blind linear filter. If a transient signal even t is presen t in only a small fraction of segments, the av eraging process suppresses it by a factor of 1 / M , with added measurements. T o address this, we can reframe this problem as finding the optimal predictor for one signal comp onent giv en all others, in which the cosine comp onen t of the dot pro duct acutally represen ts a distance pseudo-metric, whic h can simply be replaced with an y distance func- tion we wan t. This demonstration of information 6 transfer for diagnostic reconstruction has b een previ- ously demonstrated [39, 40]. T o do so, w e construct a neural-netw ork F θ that approximates X : X ′ N = E [ X N | X 1 , . . . , X k ] (10) The input is a multic hannel tensor comp osed of the separated real and imaginary parts of the STFT from k input signals: X in ( t m , f ) = [Re { X 1 } , Im { X 1 } , . . . , Re { X k } , Im { X k } ] (11) The U-Net F θ maps this 2 k -channel tensor to the 2-c hannel real and imaginary comp onen ts of a target signal X N : X pred ( t m , f ) = F θ ( X in ( t m , f )) = [Re { X ′ N } , Im { X ′ N } ] (12) The netw ork is optimized by minimizing the mean absolute error (MAE) betw een the prediction and the target for robustness [41]: L ( θ ) = M X m =1 X f ∥ X pred ( t m , f ) − X target ( t m , f ) ∥ (13) This loss forces the U-Net to learn optimal non- linear com binations of the input comp onen ts to re- construct the coheren t target. Effectiv ely , the net- w ork learns complex relationships across the T-F plane analogous to R x R y + I x I y . This also allo ws our result to be easily interpreted as the minimal distance to each input spectra giv en the information presen t in all other sp ectra. Conceptually , w e can see the b en- efit of this compared to classical metho ds in Figure 3. A critical concern is whether a netw ork trained on this may learn the noise. Ho wev er, developmen ts in self-sup ervised denoising ha ve demonstrated that a netw ork trained to predict a noisy target from a noisy input can quickly result in a signal, pro vided the noise is zero-mean and indep enden t [42]. The op- timal function f ( · ) which minimizes the L 1 loss is the conditional exp ectation f ( x ′ ) = E [ y ′ | x ′ ]. Assuming the target y ′ = x + n 2 and input x ′ = x + n 1 , where n 1 and n 2 are indep enden t noise realizations: E [ y ′ | x ′ ] = E [ x + n 2 | x ′ ] = E [ x | x ′ ] + E [ n 2 | x ′ ] (14) Figure 3: (left) Averaging signals can introduce a bias that remov es information ab out eac h individual signal. (right) Reconstructing each channel with the information from all other channels leads to a b etter estimate of the true signal. Since we can safely assume the noise n 2 is inde- p enden t of the input state due to existing use of the CPS, then E [ n 2 | x ′ ] → 0. Note that channel pre- diction is p erformed indep enden tly for Re( X ) and Im( X ), as applying this to the real s pectra will cause significan tly w orse results due to a loss in complex in- formation. This metho d also differs from past results whic h hav e denoised sp ectrograms with a cross-phase in teraction, since it is observed that joint denoising can in tro duce sp ectral artifacts in a similar vein as real sp ectrum denoising. Another question that arises is that if we can em- plo y this theory from self-sup ervised denoising, why can’t w e directly just use existing self-sup ervised image denoising algorithms on the sp ectra? F rom our tests, in tro ducing auto correlation-based mea- sures seems to degrade qualit y . Standard single- image metho ds (e.g., blind-spot net works) often as- sume pixel-wise indep endence. How ever this as- sumption is violated in sparse non-linear sp ectra where measurement correlations span the en tire time- frequency domain [43]. Metho ds such as AP-BSN, whic h uses v ariable kernel sizes has b een tested, but has not giv en sufficiently goo d results, as sparse bac kground noise measurements are observed to just c hange radius of correlated noise while removing ad- jacen t signals [44]. An example can b e seen in figure 4. An explanation for this can b e that sp ectral signals 7 can b e extremely sparse so there is not enough adja- cen t information to directly reconstruct clean signals. F urthermore, existing auto correlation-based self- sup ervised signal denoisers op erating in the time do- main can suffer from subsampling information loss with unsatisfactory denoising results for direct ex- traction of mo des [45]. How ever, in the case that a diagnostic is highly ov ersampled compared to the frequency range of interest, this may b e a go o d al- ternativ e. A strong approac h to this metho d is pre- sen ted in whic h the auto correlation of subsampled time series can b egin p erforming on a similar level to the denoising p o wer of a cross-spectrum with decima- tion levels greater than 4x for CECE [46]. Therefore, there is no reason to b eliev e that the iterativ e method in this section can not b e applied to this case. How- ev er, since the measurements DII I-D has on hand are 500kHz for ECE and 1MHz for CO 2 with sp ectral re- gions of interest extending up to 250kHz, w e do not ha ve sufficien t bandwidth to apply this. One more point to note is that the iterative metho d presen ted is not p erfect as we do not hav e infinite noisy realizations of a single signal as in the theoret- ically p erfect scenario. Thus, residual noise could b e learned after a long amount of training with many parameters. T o prev ent this, we emplo yed a total v ariation (TV) stopping criterion to act as a strong pro xy for noise conten t measurement [47]. 2.5 Coheren t and T ransien t Thresh- olding Next w e aim to separate physical even ts from the bac kground to provide a candidate mo de lab elset. Standard image thresholding metho ds suc h as Otsu are designed for bimo dal distributions and fail on sp ectrograms, whic h are characterized by sparse, high-in tensity signals with dense, low-in tensity back- ground [48]. While approximate quantile selection is common practice in fusion signal extraction, it is au- tomatic. But to build on this heuristic, w e can note that the reason a high p ercentage v alue is often cho- sen is b ecause coherent and transient observ ations are essen tially an impulse, or anomaly in a sparse time- frequency domain. Therefore, w e can frame this as an anomaly detection problem using the knee p oin t Figure 4: Blind-sp ot denoising example with A T- BSN, a more efficient form of AP-BSN. (top) Original sp ectra with small k ernel. (b ottom) denoised sp ectra with large kernel. Although noise is reduced in both cases, the small k ernel method still retains largely ob- serv able measuremen ts of noise, while the large k ernel metho d remov es fluctuations esp ecially at the top. 8 Figure 5: (T op) Original denoised sp ectra. (Middle) CDF with threshold set at corner. (Bottom) Thresh- olded sp ectra. of the sp ectrograms cumulativ e distribution function (CDF) [49]. The algorithm pro ceeds as follows: W e first recog- nize that all data of in terest resides in the upp er half of the p ow er sp ectrogram. T o handle the long tail of the noise distribution, all v alues b elo w the sp ec- trograms mean are set to the mean. This fixes any p ossible pro cessing step that could introduce discon- tin uities to the image histogram suc h as thresholding. Next, the CDF of the resulting in tensity distribution is computed and normalized. Then, the knee p oin t of this distribution is calculated b y connecting the CDF endp oin ts, interpolated such that b oth x and y axes on the CDF are equal. Then the maximum distance from the curve to the line is considered the optimal p oin t. An example demonstration can be seen in Fig- ure 5. This metho d is parameter-free, sav e the level of in- terp olation detail w anted for tracing the CDF, and can b e applied to any sp ectrogram, as it relies on the shap e of the in tensity distribution rather than abso- lute v alues. While the authors ha ve not found this exact form ulation of thresholding for sp ectrograms, the result is inspired by bioacoustic vocalization con- tour extraction where it was noticed that most of the p oin ts that meet the true p ositiv e requirement are ab o v e the cumulativ e distribution function [50]. An- other p oin t to address is that this is preferred due to b eing a global threshold, as it reduces parameter- ization compared to lo cal metho ds. One dra wback is that knee point detection necessitates the presence of a signal in a sp ectra. If a sp ectra do es not contain an y signal, the knee p oin t will simply select random p oin ts in the background distribution that happ en to be slightly higher than the rest. Ho wev er, we do not encounter this issue as all the sp ectrograms we pro cess in this pap er contain at least one mo de. 2.6 Detection Refinement The automated segmen tation pro cess yields a large database of high quality candidate even t masks. Ho wev er, these signals may contain false negatives since c hannel-wise predictions may fail to predict in- formation that is only presen t on one c hannel devoid of information on other channels. So, to capture these edge effects, w e employ mul- tiple robust segmentation refinement techniques to impro ve the lab eled dataset. W e train a U-Net on 5- fold randomized single channel measuremen ts of sig- nals using a symmetric binary cross-entrop y (BCE) approac h [51]. W e also employ data augmentations including flips and elastic deformation, treating this as an image segmentation problem [52]. A subset of high entrop y measuremen ts from the resulting av er- age is added to the predicted signal to improv e the determined space of signals. The final result of this pip eline is a database of segmen ted plasma even ts. This leav es us a large set of ab out 40,000 sp ectrogram fragmen ts w e can map measuremen ts to without any manual lab eling. 9 Figure 6: The automated data extraction pip eline and surrogate model training pro cess. F or real-time usage, the surrogate model can automatically extract v ertical and coherent observ ations from signals. 2.7 Surrogate Mo del Finally , a surrogate model is trained on the pro cessed results. F or the time b eing, we simply train a U-Net on the coheren t and transien t portions of the spectra, this time using more sp ectrogram-targeted augmen- tations, sp ecifically Sp ecAug [53]. In order to main- tain the same pip eline across c hannels, w e find the cum ulative mean and standard deviation p er diagnos- tic, and perform normalization. Then we clip sp ec- trograms to their 0.1 and 99.9 p ercen tile with robust scaling [54]. T o deal with parameter uncertaint y , w e also employ multi-perio d multi-scale surrogate train- ing on bicubic resampled lab els, randomly sampling from the range of windo w sizes [256 , 2048] and hop sizes [64 , 512], lo osely inspired by the training regime for self-sup ervised wa v eform syn thesis [55]. This im- pro ves performance robustness across a v ariety of sig- nal parameter settings. Without this, the segmenta- tions are observed to b e highly sensitiv e to windo w size and ov erlap. The final pro cess can b e summarized in Figure 6. 2.8 Mo del Architecture In this pap er, we ha ve used a U-Net three separate times. While the training regiment is different each time, the architecture remains the same. The U- Net used is a modified architecture of the original Figure 7: U-Net architecture used for all three mo d- els in this pap er. F or self-sup ervised training, the input and output are multic hannel dep ending on the n umber of samples used. F or robust lab el expansion, the input and output is one single channel. F or sur- rogate model training, the input is single channel and the output is tw o channel for binary segmentation. U-Net [52]. In upsampling, a con v olutional transp ose has b een replaced with an upsample double conv olu- tion to prev ent chec k erb oard artifacts [56]. T raining w as done using binary floating-p oint (BF)-16 preci- sion. The mo del is shown in figure 7. While higher p erforming mo dels exist no w, the U-Net provides a strong baseline. 3 Results 3.1 In v estigating DI I ID Sp ectro- grams Visualizing magnetic coil measurements in Figure 8, w e see it giv es clean mo de identifications onto which w e can pro ject mo de num b ers do wn the line. F rom these segmentations, we can obtain direct amplitude measuremen ts 1. Next, we c heck results on CO 2 , sho wn in Figure 9. Despite the strong low frequency amplitudes we are able to cleanly extract b oth high and low frequency structures. W e also c heck ECE. An interesting case study w e can in vestigate are tw o shots, 199597 and 199607, from a tearing mode con trol exp erimen ts at DII I-D, in which 199597 exhibits tearing instability , shown in Figure 10, while 199607 is electron cyclotron cur- ren t drive (ECCD) supressed, sho wn in Figure 11 [57]. Since tearing mo des often o ccur around the 10 Figure 8: (top) example magnetic sp ectrogram for shot 170008 with only coheren t mo de extraction. (middle) individually extracted even ts using a mo del threshold. (b ottom) gated sp ectrogram, whic h cap- tures amplitudes of interest. transien t even ts here can b e filtered out, allo wing direct coherent mode extrac- tion. T able 1: Database of detected signal regions. Lbl f min f max t min t max Amp. (kHz) (kHz) (ms) (ms) (dB) 1 7 68 183 4096 5335 3 28 96 376 2358 546 21 99 172 1295 1796 42 4 32 95 2318 2988 1026 46 264 301 1137 1316 32 . . . 12 47 58 3747 3781 2098 48 279 295 1075 1098 58 11 47 55 3648 3686 1794 70 361 379 3977 3989 129 92 442 504 376 379 215 Figure 9: (top) example CO 2 densit y spectrogram for shot 185781. (middle) the individually extracted ev ents using a mo del threshold. (b ottom) gated spec- trogram, which captures amplitudes of interest. Dif- feren t even ts including alfven-lik e and low frequency mo des can b e captured, along with very fine chirping structures. 50kHz range, w e can do a general split measure- men t of mo de amplitudes at this range and higher freqeuency mo des. W e w e can immediatley iden- tify a higher amount of sustained high frequency Alfv en-like modes during tearing mo de supression in addition to the up ward mov ement of low fre- quency mo des. In addition, we can compare this to the Shap ely v alue-given probabilites of influence [57]. Shap ely v alues indicate that core measurements are muc h more likely than edge to predict a tearing mo de. If we lo ok at edge ECE measurements, w e do not observe this mo de b eha vior, but w e can observe this in the core. 3.2 Benc hmarking on TJ-I I Sp ectro- grams T o test the mo del’s ability to generalize to other fu- sion devices, we deplo y it on ECE sp ectrograms from the TJ-I I stellarator in Spain. These sp ectrograms ha ve different noise c haracteristics and even t struc- tures compared to DI I I-D, making them a go od test for generalizability . W e obtain a recall of 0.825 on exp ert lab eled TJ-I I sp ectrograms, indicating strong p erformance ev en without retraining. One consistent 11 Figure 10: (top) ECE sp ectrogram segmen tation in a tearing mo de shot 199597. (middle) individually extracted even ts using a model threshold. (b ottom) gated sp ectrogram, which captures amplitudes of in- terest. high frequency modes app ear starting at 2 seconds, rapidly ending near 3.4 seconds when tear- ing mo de o ccurs. Figure 11: (top) ECE sp ectrogram segmen tation in a tearing-suppressed shot 199607. (middle) individu- ally extracted ev ents using a mo del threshold. (b ot- tom) gated sp ectrogram, which captures amplitudes of interest. high frequency modes app ear starting at 2 seconds, and do not diminish as tearing mo de is suppressed. Figure 12: Example of TJ-I I ECE sp ectrogram with exp ert annotations and model output. The threshold used here is the recommended 50% threshold. issue is that the mo del measures the cutoff frequency at around 100kHz. How ever, this is a man ual bias that can be corrected for in post processing similar to scan lines. Additionally , the mo del is able to pic k up structures not annotated by the original annotation and iden tify well areas with no mode activity . An ex- ample is sho wn in Figure 12. Ov erall, this shows the mo del can generalize well to different fusion devices. 3.3 Benc hmarking on Non-F usion Datasets T o test the extent of this mo del’s generalizability , w e deploy it on sp ectrograms from other domains in science. W e test this on a well known Detec- tion, Classification, Denisty Esimation, and Lo cal- ization of Marine Mammals Using Passiv e Acoustics (DCLDE) 2011 Oco don te dataset since it is a widely kno wn b enc hmark for lo calized time frequency anno- tations in the presence of broadband ev ents, in this case snapping shrimp instead of ELMs [58]. W e ob- 12 Figure 13: Example of DCLDE 2011 dolphin call sp ectrogram with exp ert annotations (top) and mo del output (bottom) at the recommended 50% threshold. tain a recall of 0.7708 on Delphinus cap ensis and 0.7953 on Delphin us delphis which is strong for a zero-shot task. This mo del seems to p erform w ell in most cases, except when pitc h rapidly drops and when annotations are at the low est frequency bins. While precision is lo w, this is likely due to annota- tions b eing strongly lo calized to 1 pixel while the mo del marks a wider region. Since mo des in tok a- maks also tend to ha ve v arying widths, this is not m uch of a concern for man y of our application. In ad- dition, annotations can sometimes mark the far edge of a dolphin call while the detection at the center, giving both false negativ e and false positive v alues. F or this reason, skeletonization w as not employ ed as this ma y cause the mo del to conv erge to a single pixel that ma y not ov erlap with the annotated signal at all, whic h may lead to markedly w orse results. Examples can b e found in Figure 13 and Figure 14. With fine-tuning on the dataset, w e exp ect muc h stronger alignment with standard b enc hmark goals. Figure 14: Example of DCLDE 2011 with missed o verlap. While the general segmen tation region is in the correct vicinity , there are only three pixels of o verlap be t ween annotation and mo del output. This sho ws that the resulting mo del can b e general- izable to domains b eyond fusion for analysis. 3.4 P erformance With the given starting HDF5 Dataset format, cre- ating a database of 5000 ready for training takes roughly 5 hours on a single Nvidia A100 graphics pro cessing unit (GPU) and 64 core in tel central pro- cessing unit (CPU). T raining a high quality surrogate seman tic segmen- tation mo del with full 5 fold v alidation takes around 12 hours. When running inference, it takes approximately 0.5s to pro cess a full shot on GPU, making it suit- able for active plasma monitoring. And roughly 5-10 seconds on CPU dep ending on the num b er of sp ectra b eing pro cessed in parallel. 4 Discussion and F uture Goals W e ha ve presented a self-sup ervised pip eline for au- tomated extraction of ev ents from time-frequency sp ectrograms. The method combines baseline re- mo v al to separate broadband turbulence from coher- en t mo des, U-Net-based m ultichannel denoising to suppress sto c hastic noise, thresholding for a minimal parameter segmen tation pro cedure, and a surrogate neural netw ork. Results show strong p erformance across DI I I-D diagnostics (ECE, CO 2 , MHR, BES), automatically reveals Alfv ´ en-lik e activity during tear- ing mo de suppression. The surrogate mo del general- izes w ell to TJ-II stellarator data and bioacoustic sig- 13 nals without retraining, with inference times of 0.5- 10 seconds p er shot suitable for tok amak inter-shot analysis. T o improv e p erformance of the denoising run, we can com bine this with a scheme closer to Self-inspired Noise2Noise for full co verage [59]. W e can also im- pro ve the denoising regiment to b e more architectu- ally efficien t, follo wing a similar blind sp ot metho d instead of predicting single channels at one time [60]. This can allo w us to use man y more c hannels without a large memory ov erhead. W e plan to also include information on phase and turbulence in future additions. Finally , we can ex- tend this to extract the inheren t correlation b et ween diagnostics in one pass, as the curren t setup is limited to extraction of only one view at a time. While surrogate mo de extraction p erforms quickly on a GPU, its p erformance on v ariable size input sp ectra for CPUs can b e significantly slo wer. W e can in vestigate quantization and pruning for deploymen t on CPU systems in the future. 5 Ac kno wledgmen ts This material is based up on w ork supp orted b y the U.S. Departmen t of Energy , Office of Science, Office of F usion Energy Sciences, using the DI II-D National F usion F acility , a DOE Office of Science user facil- it y , under Award(s) DE-F C02-04ER54698 and DE- SC0024527. The authors also gratefully ackno wledge financial supp ort from the Princeton Lab oratory for Artificial Intelligence under Award 2025-97. Sp ecial thanks to Marie Ro c h for providing ac- cess to the DCLDE dataset and annotations, An- dres Bustos and Enrique Zapata-Cornejo for provid- ing access to the TJ-II dataset. Thanks to Jalal Butt, Sangky eun Kim, Ricardo Shousha, and F rederik Si- mons. Disclaimer: This rep ort was prepared as an ac- coun t of work sp onsored by an agency of the United States Go vernmen t. Neither the United States Gov- ernmen t nor any agency thereof, nor any of their em- plo yees, makes an y warran ty , express or implied, or assumes any legal liability or responsibility for the accuracy , completeness, or usefulness of any infor- mation, apparatus, pro duct, or pro cess disclosed, or represen ts that its use would not infringe priv ately o wned rights. Reference herein to any sp ecific com- mercial pro duct, pro cess, or service by trade name, trademark, manufacturer, or otherwise do es not nec- essarily constitute or imply its endorsemen t, recom- mendation, or fav oring by the United States Gov ern- men t or any agency thereof. The views and opinions of authors expressed herein do not necessarily state or reflect those of the United States Gov ernment or an y agency thereof. References [1] J. S. Kim, D. H. Edgell, J. M. Greene, E. J. Strait, and M. S. Chance. MHD mode iden ti- fication of tok amak plasmas from Mirnov sig- nals. Plasma Physics and Contr ol le d F usion , 41(11):1399, Nov ember 1999. [2] Liu Chen and F ulvio Zonca. Physics of Alfv \ ’en w av es and energetic particles in burning plas- mas. R eviews of Mo dern Physics , 88(1):015008, Marc h 2016. [3] G. F ederici, P . Andrew, P . Barabasc hi, J. Bro oks, R. Do erner, A. Geier, A. Herrmann, G. Janesc hitz, K. Krieger, A. Kukushkin, A. Loarte, R. Neu, G. Saib ene, M. Shimada, G. Strohmay er, and M. Sugihara. Key ITER plasma edge and plasma–material interaction is- sues. Journal of Nucle ar Materials , 313-316:11– 22, March 2003. [4] A. W. Leonard. Edge-localized-mo des in tok a- maksa). Physics of Plasmas , 21(9):090501, Septem b er 2014. [5] R. M. Churc hill, C. S. Chang, J. Choi, R. W ang, S. Klasky , R. Kub e, H. Park, M. J. Choi, J. S. P ark, M. W olf, R. Hager, S. Ku, S. Kampel, T. Carroll, K. Silb er, E. Dart, and B. S. Cho. A F ramework for In ternational Collab oration on ITER Using Large-Scale Data T ransfer to Enable Near- Real-Time Analysis. F usion Scienc e and T e ch- 14 nolo gy , 77(2):98–108, F ebruary 2021. eprin t: h ttps://doi.org/10.1080/15361055.2020.1851073. [6] Jaemin Seo, Rory Conlin, Andrew Rothstein, SangKy eun Kim, Joseph Abbate, Azarakhsh Jalalv and, and Egemen Kolemen. Multimo dal Prediction of T earing Instabilities in a T ok amak. In 2023 International Joint Confer enc e on Neu- r al Networks (IJCNN) , pages 1–8, June 2023. ISSN: 2161-4407. [7] Nathaniel Chen, CheolSik Byun, Azarakhsh Jalalv and, SangKyeun Kim, Andrew Rothstein, Filipp o Scotti, Steve L Allen, Da vid Eldon, Keith Erickson, and Egemen Kolemen. Regula- tion complian t AI for fusion: Explainable image- based feedbac k con trol of divertor detac hment in DI II-D tok amak. Nucle ar F usion , 2026. [8] A Bustos, E Ascas ´ ıbar, A Cappa, and R May o- Garc ´ ıa. Automatic iden tification of MHD mo des in magnetic fluctuation sp ectrograms using deep learning techniques. Plasma Physics and Con- tr ol le d F usion , 63(9):095001, July 2021. [9] E d D Zapata-Cornejo, D Zarzoso, S D Pinc hes, S E Sharap ov, and M Fitzgerald. Segmen tation of MHD mo des using F ourier transform, wa velets and computer vision algo- rithms. Plasma Physics and Contr ol le d F usion , 66(9):095016, August 2024. [10] E.d.D. Zapata-Cornejo, D. Zarzoso, S.D. Pinc hes, A. Bustos, A. Cappa, and E. Ascasi- bar. A nov el unsup ervised machine learning al- gorithm for automatic Alfv ´ enic activity detec- tion in the TJ-I I stellarator. Nucle ar F usion , 64(12):126057, Octob er 2024. [11] M. E. Austin and J. Lohr. Electron cyclotron emission radiometer upgrade on the DII I-D tok amak. R eview of Scientific Instruments , 74(3):1457–1459, March 2003. [12] R. E. Slusher and C. M. Surko. Study of density fluctuations in plasmas b y small-angle CO2 laser scattering. The Physics of Fluids , 23(3):472–490, Marc h 1980. [13] E. J. Strait. Magnetic diagnostic system of the DI II-D tok amak. R eview of Scientific Instru- ments , 77(2):023502, F ebruary 2006. [14] G. McKee, R. Ashley , R. Durst, R. F onck, M. Jakub o wski, K. T ritz, K. Burrell, C. Green- field, and J. Robinson. The b eam emission spec- troscop y diagnostic on the DI I I-D tok amak. R e- view of Scientific Instruments , 70(1 I I):913–916, Jan uary 1999. [15] D. R. McCarthy . Edge harmonic oscillations pro- duced by toroidal v elo cit y shear. Physics of Plas- mas , 9(6):2451–2454, June 2002. [16] J. S. Bendat and A. G. Piersol. Random Data Analysis and Measurement Pro cedures. Me a- sur ement Scienc e and T e chnolo gy , 11(12):1825, Decem b er 2000. [17] V. P . Budaev, Y. Kikuchi, M. T oy o da, Y. Ue- sugi, and S. T ak amura. Effect of rotating helical magnetic field on the turbulence fractal struc- ture and transp ort in the tok amak edge. Journal of Nucle ar Materials , 313-316:1309–1313, March 2003. [18] Edoardo Milotti. 1/f noise: a p edagogical re- view, April 2002. arXiv:ph ysics/0204033. [19] Manfred Schroeder. F r actals, Chaos, Power L aws: Minutes fr om an Infinite Par adise . Dov er Publications, August 2009. [20] A. Mazurenko, M. P orkolab, D. Mosses- sian, J. A. Snip es, X. Q. Xu, and W. M. Nevins. Exp erimen tal and Theoretical Study of Quasicoherent Fluctuations in Enhanced $ { D } {\ ensuremath {\ alpha }} $ Plasmas in the Alcator C-Mo d T ok amak. Physic al R eview L et- ters , 89(22):225004, Nov ember 2002. [21] Marie F arge, Kai Schneider, and P ascal De- vync k. Extraction of coheren t bursts from tur- bulen t edge plasma in magnetic fusion devices using orthogonal w av elets. Physics of Plasmas , 13(4):042304, April 2006. 15 [22] Pauli Virtanen, Ralf Gommers, T ravis E. Oliphan t, Matt Hab erland, T yler Reddy , David Cournap eau, Evgeni Buro vski, P earu Peterson, W arren W eck esser, Jonathan Brigh t, St ´ efan J. v an der W alt, Matthew Brett, Joshua Wilson, K. Jarro d Millman, Nikola y May orov, Andrew R. J. Nelson, Eric Jones, Rob ert Kern, Eric Lar- son, C. J. Carey , ˙ Ilhan Polat, Y u F eng, Eric W. Mo ore, Jak e V anderPlas, Denis Laxalde, Josef P erktold, Robert Cimrman, Ian Henriksen, E. A. Quin tero, Charles R. Harris, Anne M. Arc hibald, An tˆ onio H. Ribeiro, F abian Pedregosa, and P aul v an Mulbregt. SciPy 1.0: fundamental algo- rithms for scien tific computing in Python. Na- tur e Metho ds , 17(3):261–272, March 2020. [23] F.J. Harris. On the use of windows for har- monic analysis with the discrete F ourier trans- form. Pr o c e e dings of the IEEE , 66(1):51–83, Jan- uary 1978. [24] C.E. Shannon. Communication in the Presence of Noise. Pr o c e e dings of the IRE , 37(1):10–21, Jan uary 1949. [25] PlasmaControl/F usionAIHub: A centralized platform for fusion-related machine learning w orkflows. [26] Derry FitzGerald. Harmonic/Percussiv e Separa- tion Using Median Filtering. 2010. [27] M.A. V an Zeeland, E. Bass, X.D. Du, W.W. Hei- dbrink, C. Chrystal, C. Crock er, G. DeGrand- c hamp, S. Haskey , D. Liu, J. Gonzalez-Martin, K.E. Thome, G. Y u, and Y. Zh u. Isotope im- pact on Alfv´ en eigenmodes and fast ion trans- p ort in DI II-D. Nucle ar F usion , 64(5):056033, April 2024. [28] J. Carlos Cobas, Michael A. Bernstein, Man uel Mart ´ ın-P astor, and Pablo Garc ´ ıa T aho ces. A new general-purp ose fully automatic baseline- correction pro cedure for 1D and 2D NMR data. Journal of Magnetic R esonanc e , 183(1):145–151, No vem b er 2006. [29] Sung-June Baek, Aaron Park, Y oung-Jin Ahn, and Jaebum Cho o. Baseline correction us- ing asymmetrically reweigh ted penalized least squares smoothing. Analyst , 140(1):250–257, Decem b er 2014. [30] Romain Grandchamp and Arnaud Delorme. Single-T rial Normalization for Ev en t-Related Sp ectral Decomp osition Reduces Sensitivit y to Noisy T rials. F r ontiers in Psycholo gy , 2:236, Septem b er 2011. [31] B S Atal and Suzanne L Hanauer. Sp eec h Anal- ysis and Synthesis b y Linear Prediction of the Sp eec h W av e. [32] Kostadin Dab o v, Alessandro F oi, Vladimir Katk ovnik, and Karen Egiazarian. Image De- noising by Sparse 3-D T ransform-Domain Col- lab orativ e Filtering. IEEE T r ansactions on Im- age Pr o c essing , 16(8):2080–2095, August 2007. [33] Konstantin Dragomiretskiy and Dominique Zosso. V ariational Mode Decomp osition. IEEE T r ansactions on Signal Pr o c essing , 62(3):531– 544, F ebruary 2014. [34] Andreas Groth. Multiv ariate singular sp ectrum analysis and the road to phase synchronization. Physic al R eview E , 84(3), 2011. [35] K E J Olofsson, J M Hanson, D Shiraki, F A V olp e, D A Humphreys, R J La Ha ye, M J Lanc- tot, E J Strait, A S W elander, E Kolemen, and M Ok abay ashi. Arra y magnetics mo dal analysis for the DI II-D tok amak based on lo calized time- series modelling. Plasma Physics and Contr ol le d F usion , 56(9):095012, July 2014. [36] A. E. White, L. Sc hmitz, W. A. Peebles, T. A. Carter, T. L. Rhodes, E. J. Doyle, P . A. Gour- dain, J. C. Hillesheim, G. W ang, C. Holland, G. R. T ynan, M. E. Austin, G. R. McKee, M. W. Shafer, K. H. Burrell, J. Candy , J. C. DeBo o, R. Prater, G. M. Staebler, R. E. W altz, and M. A. Mako wski. A correlation electron cyclotron emission diagnostic and the impor- tance of multifield fluctuation measurements for 16 testing nonlinear gyrokinetic turbulence sim- ulationsa). R eview of Scientific Instruments , 79(10):103505, Octob er 2008. [37] M. L. Reink e, I. Abramovic, A. Alb ert, K. Asai, J. Ball, J. Batko, J. Brettingen, D. Brun- ner, M. Cario, J. Carmic hael, C. Chrobak, A. Creely , D. Cykman, M. Dalla Rosa, E. Dubas, C. Do wney , A. F errera, J. F renje, E. F ox- Widdo ws, R. Go c ht, G. Gorini, R. Granetz, M. Green wald, A. Griev e, M. Hanson, J. Hawk e, T. Henderson, S. Hic ks, J. Hillesheim, A. Hoff- mann, I. Holmes, N. How ard, A. Hubbard, J. W. Hughes, J. Ilagan, J. Irby , M. Jean, G. Kaur, R. Kennedy , E. Ko walski, A. Q. Kuang, R. Kulch y , M. LaCapra, C. Lafleur, M. Lagieski, R. Li, Y. Lin, T. Lo ob y , R. Zu- bieta Lup o, S. Mac kie, E. Marmar, S. McK- anas, A. Moncada, R. Mumgaard, C. E. My- ers, V. Nikolaev a, M. Nocente, S. Normile, C. Nov oa, S. Ouellet, E. P anontin, C. Paz- Soldan, J. Pen tecost, C. P erks, M. P etruzzo, M. Quinn, J. Raimond, P . Ra j, M. Rebai, V. Ric- cardo, D. Rigamonti, J. E. Rice, A. Rosen- thal, M. Safabakhsh, A. Saltos, J. Shanahan, M. Silv a Sa, I. Song, J. Souza, B. Stein- Lubrano, I. G. Stewart, R. Sweeney , M. T ar- do cc hi, A. Tinguely , D. V ezinet, X. W ang, and J. Witham. Overview of the early campaign diagnostics for the SP ARC tok amak (in vited). R eview of Scientific Instruments , 95(10):103518, Octob er 2024. [38] W. Biel, R. Albanese, R. Ambrosino, M. Ari- ola, M. V. Berk el, I. Bolshako v a, K. J. Brun- ner, R. Ca v azzana, M. Cecconello, S. Con- ro y , A. Dinklage, I. Duran, R. Dux, T. Eade, S. En tler, G. Ericsson, E. F able, D. F arina, L. Figini, C. Finotti, Th. F ranke, L. Giacomelli, L. Giannone, W. Gonzalez, A. Hjalmarsson, M. Hron, F. Janky , A. Kallenbac h, J. Kogo j, R. K¨ onig, O. Kudlacek, R. Luis, A. Malaquias, O. March uk, G. Marc hiori, M. Mattei, F. Ma v- iglia, G. De Masi, D. Mazon, H. Meister, K. Meyer, D. Micheletti, S. No wak, Ch. Piron, A. Pironti, N. Risp oli, V. Rohde, G. Sergienko, S. El Shawish, M. Siccinio, A. Silv a, F. da Silv a, C. Sozzi, M. T ardo cchi, M. T ok ar, W. T reut- terer, and H. Zohm. Diagnostics for plasma con- trol – F rom ITER to DEMO. F usion Engine ering and Design , 146:465–472, September 2019. [39] Azarakhsh Jalalv and, Max Curie, SangKyeun Kim, P eter Steiner, Jaemin Seo, Qiming Hu, An- drew Oakleigh Nelson, and Egemen Kolemen. Diag2Diag: Multimodal sup er-resolution diag- nostics for ph ysics discov ery with application to fusion, May 2024. arXiv:2405.05908 [physics] v ersion: 2. [40] CheolSik Byun, Azarakhsh Jalalv and, Nathaniel Chen, SangKy eun Kim, Filipp o Scotti, Stev en L. Allen, Seungtae Oh, Y o onseong Han, Andrew Rothstein, Keith Erickson, David Eldon, H. H. Lee, and Egemen Kolemen. Real-Time F eedbac k Con trol of Radiation F ront-Based Detac hment Enabled by Machine Learning on DI II-D and KST AR. No vem b er 2025. [41] Y eong Il Jang, Keun tek Lee, Gu Y ong P ark, Seyun Kim, and Nam Ik Cho. Self-sup ervised Image Denoising with Downsampled Inv ariance Loss and Conditional Blind-Spot Netw ork. In 2023 IEEE/CVF International Confer enc e on Computer Vision (ICCV) , pages 12162–12171, P aris, F rance, Octob er 2023. IEEE. [42] Jaakko Lehtinen, Jacob Munkb erg, Jon Hassel- gren, Samuli Laine, T ero Karras, Miik a Aittala, and Timo Aila. Noise2Noise: Learning Image Restoration without Clean Data, Octob er 2018. arXiv:1803.04189 [cs]. [43] Hamadi Chihaoui and Paolo F av aro. Masked and Shuffled Blind Spot Denoising for Real- W orld Images. In 2024 IEEE/CVF Confer enc e on Computer Vision and Pattern R e c o gnition (CVPR) , pages 3025–3034, June 2024. [44] Shiyan Chen, Jiyuan Zhang, Zhaofei Y u, and Tiejun Huang. Exploring Efficient Asymmet- ric Blind-Sp ots for Self-Sup ervised De noising in Real-W orld Scenarios. In 2024 IEEE/CVF Con- fer enc e on Computer Vision and Pattern R e c o g- nition (CVPR) , pages 2814–2823, June 2024. 17 [45] Jiasong W u, Qingch un Li, Guan yu Y ang, Lei Li, Lotfi Senhadji, and Huazhong Shu. Self- Sup ervised Sp eech Denoising Using Only Noisy Audio Signals, January 2023. [eess]. [46] Christian Y o o, Garrard D. Conw ay , Jacob Sc hellpfeffer, Rac hel Biela jew, Klara Hoefler, Diego J. Cruz-Zabala, David Cusick, William Burk e, Brank a V anov ac, Anne E. White, and the ASDEX Upgrade T eam. A nov el metho d for thermal noise reduction, enabling measurements of broadband, low-amplitude electron temp er- ature fluctuations using individual radiometer c hannels, December 2025. [ph ysics]. [47] Leonid I. Rudin, Stanley Osher, and Emad F atemi. Nonlinear total v ariation based noise remo v al algorithms. Physic a D: Nonline ar Phe- nomena , 60(1):259–268, Nov ember 1992. [48] Nobuyuki Otsu. A Threshold Selection Metho d from Gra y-Level Histograms. IEEE T r ans- actions on Systems, Man, and Cyb ernetics , 9(1):62–66, January 1979. [49] Ville Satopaa, Jeannie Albrec ht, David Irwin, and Barath Raghav an. Finding a ”Kneedle” in a Ha ystack: Detecting Knee Poin ts in System Beha vior. In 2011 31st International Confer- enc e on Distribute d Computing Systems Work- shops , pages 166–171, Minneap olis, MN, USA, June 2011. IEEE. [50] Florian Dadouc hi, Cedric Gerv aise, Cornel Ioana, Julien Huillery , and Jerome I. Mars. Au- tomated segmentation of linear time-frequency represen tations of marine-mammal sounds. Journal of the A c oustic al So ciety of A meric a , 134(3):2546–2555, May 2013. [51] Yisen W ang, Xing jun Ma, Zaiyi Chen, Y uan Luo, Jinfeng Yi, and James Bailey . Symmetric Cross Entrop y for Robust Learning with Noisy Lab els, August 2019. arXiv:1908.06112 [cs]. [52] Olaf Ronneb erger, Philipp Fischer, and Thomas Bro x. U-Net: Con volutional Net works for Biomedical Image Segmen tation, May 2015. arXiv:1505.04597 [cs]. [53] Daniel S. Park, William Chan, Y u Zhang, Ch ung-Cheng Chiu, Barret Zoph, Ekin D. Cubuk, and Quo c V. Le. Sp ecAugmen t: A Sim- ple Data Augmentation Metho d for Automatic Sp eec h Recognition. In Intersp e e ch 2019 , pages 2613–2617, September 2019. [eess]. [54] Ricardo A. Maronna, R. Douglas Martin, Vic- tor J. Y ohai, and Mat ´ ıas Salibi´ an-Barrera. R o- bust Statistics: The ory and Metho ds (with R) . John Wiley & Sons, Jan uary 2019. Go ogle- Bo oks-ID: K5RxDwAAQBAJ. [55] Kundan Kumar, Rithesh Kumar, Thibault de Boissiere, Lucas Gestin, W ei Zhen T eoh, Jose Sotelo, Alexandre de Brebisson, Y oshua Ben- gio, and Aaron Courville. MelGAN: Generative Adv ersarial Netw orks for Conditional W av eform Syn thesis, December 2019. [eess]. [56] Augustus Odena, Vincen t Dumoulin, and Chris Olah. Deconv olution and Chec kerboard Arti- facts. Distil l , 1(10):e3, Octob er 2016. [57] Hiro J. F arre-Kaga, Andrew Rothstein, Ro- hit Sonker, SangKyeun Kim, Ricardo Shousha, Minseok Kim, Keith Erickson, Jeff Schneider, and Egemen Kolemen. Interpreting AI for F u- sion: an application to Plasma Profile Anal- ysis for T earing Mo de Stabilit y , July 2025. arXiv:2502.20294 [physics]. [58] Marie A. Ro ch, T. Scott Brandes, Bha vesh P atel, Yvonne Barkley , Simone Baumann- Pic kering, and Melissa S. Soldevilla. Automated extraction of o don to cete whistle con tours. The Journal of the A c oustic al So ciety of A meric a , 130(4):2212–2223, Octob er 2011. [59] W eisong Zhao. W eisongZhao/SN2N, No vem b er 2025. original-date: 2023-12-23T13:23:08Z. 18 [60] Samuli Laine, T ero Karras, Jaakko Lehti- nen, and Timo Aila. High-Quality Self- Sup ervised Deep Image Denoising, Octob er 2019. arXiv:1901.10277 [cs]. 19
Original Paper
Loading high-quality paper...
Comments & Academic Discussion
Loading comments...
Leave a Comment