Confidence in confidence distributions!
The recent article `Satellite conjunction analysis and the false confidence theorem' (Balch, Martin, and Ferson, 2019, Proceedings of the Royal Society, Series A) points to certain difficulties with Bayesian analysis when used for models for satellit…
Authors: Céline Cunen, Nils Lid Hjort, Tore Schweder
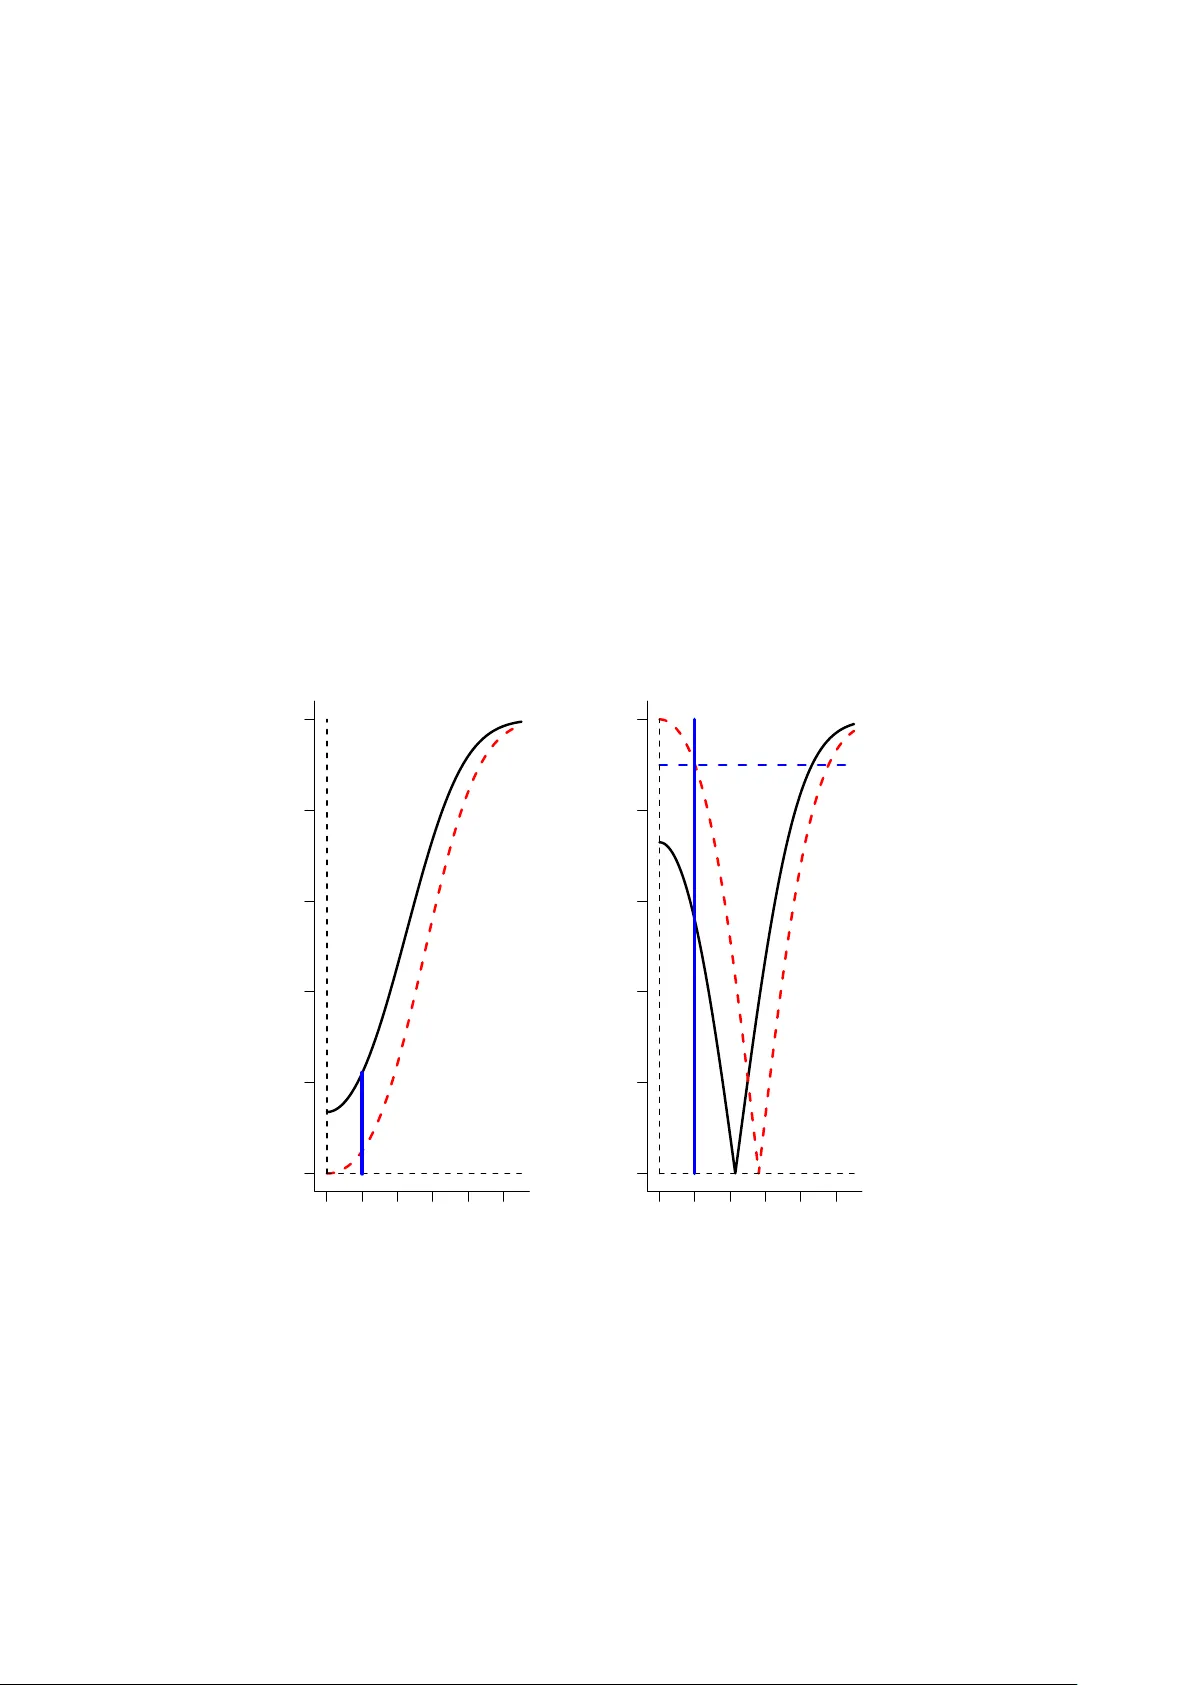
Confidence in confidence distributions! F ebruary 2020 C´ eline Cunen 1 , Nils Lid Hjort 1 , T ore Sch w eder 2 1 Departmen t of Mathematics, Univ ersity of Oslo 2 Departmen t of Economics, Univ ersity of Oslo Abstract The recent article ‘Satellite conjunction analysis and the false confidence theorem’ (Balch, Martin, and F erson, 2019, this journal) p oin ts to certain difficulties with Bay esian analysis when used for models for satellite conjuntion and ensuing operative decisions. Here w e supple- men t these previous analyses and findings with further insights, uncov ering what we perceive of a s being the crucial p oin ts, explained in a protot yp e setup where exact analysis is attainab le. W e also sho w that a different and frequen tist method, inv olving confidence distributions, is free of the false confidence syndrome. Key wor ds: confidence distributions; false confidence; inference for lengths; satellite conjunction probabilities Ba yesian analysis is often employ ed to calculate the collision probability of satellites based on noisy measuremen t of their p osition and sp eed. Balc h, Martin, F erson (2019), b elow referred to as BMF, hav e demonstrated that these analyses can b e highly misleading, and they argue that this is an instance of a more general phenomenon, which they call false c onfidenc e . BMF find that the confidence in the even t of no collision tends to get larger with noisier data ev en when the satellites actually are on a collision course. Such unfortunate prop erties are known to be presen t in some Ba yesian analyses, cf. Sch wed er and Hjort (2016, e.g. Chapters 14, 15). W e argue that suc h probability dilution is av oided when frequen tist analysis by wa y of confidence distributions is emplo yed. W e demonstrate this b elo w by revisiting the satellite collision problem. The purpose of this note is also to make clearer what ‘the heart of the matter’ is: in certain setups, ev en a sound-lo oking Ba yesian analysis might ha ve seriously unfortunate frequentist properties. Suc h consequences are particularly drastic when the metho ds are put to rep eated use, as for monitoring of satellite collision probabilities. Confidence distributions (CDs) are a type of inferen tial summary whose outw ard app earance is similar to a Bay esian p osterior distribution. Just like a p osterior for some parameter of interest δ , after having observed data y , a CD C ( δ | y ) defines a probabilit y distribu tion on the space of p ossible δ v alues. The function C ( δ | y ) is a data-dep endent cum ulative distribution function. Unlik e a p osterior, how ev er, a CD is required to hav e correct frequentist cov erage, i.e. C ( δ 0 | y ) is uniformly distributed when data are regarded as sto c hastic and δ 0 is the true v alue of the parameter. 1 The full confidence curve C ( δ | y ) is a practical summary of the uncertain ty asso ciated with the estimated parameter; for more on CDs see Sch weder and Hjort (2016), Hjort and Sch weder (2018). CDs and the related concept confidence curves are strongly related to confidence in terv als. Since properly calibrated confidence interv als hav e guaranteed co verage, they are free of false confidence, and so are CDs, at least with resp ect to all in terv al statemen ts, including confidence interv als and p-v alues. After these brief general p oints we proceed to present an analysis of a simplified version of BMF’s satellite example. This simplification allows explicit expressions of the functions inv olved, but retains what w e see as the heart of the matter, a cru cial and problemati c asp ect of the Ba yesian solution. Note that sophisticated satellite conjunction risk assessors are a ware of the false confi- dence phenomenon, and the related issue of probabilit y dilution, whic h affects the Ba yesian calcu- lation of collision probabilit y . In practice, they therefore use this calculation not as a guarantee of safety but rather as a w ay to iden tify conjunctions that are likely to b e dangerous. Their null h yp othesis is that a collision will not o ccur and when the estimated collision probabilit y is high the conjunction is iden tified as ‘dangerous’. See Hejduk, Snow, Newman (2019) for an extended treatmen t of these issues. F ollowing Martin (2019), assuming that the t wo satellites ha ve constant and iden tical sp eed w e can reduce the problem to t wo dimensions, with θ = ( θ 1 , θ 2 ) b eing the true differences b etw een the unkno wn p ositions of the satellites along each axis on a plane. The interest lies in inference on the distance b etw een the satellites, i.e. δ = || θ || = ( θ 2 1 + θ 2 2 ) 1 / 2 . W e observe a single pair y = ( y 1 , y 2 ) and assume that these tw o are independent and normal with means ( θ 1 , θ 2 ) and equal kno wn v ariances σ 2 . BFM presen t a Ba yesian framework with flat priors, and in this simplified setup w e get the simple posterior distribution where θ i | y i is a normal N( y i , σ 2 ) for the t wo comp onents. F rom this p osterior one can obtain a p osterior for δ by integration, which is most con venien tly presented in the form of a cumulativ e distribution function on the space of δ , B ( δ | y 1 , y 2 ) = Γ 2 δ 2 σ 2 , || y || 2 σ 2 , (0.1) writing Γ 2 ( · , ν ) for the cumulativ e distribution function of a non-cen tral χ 2 with tw o degrees of freedom and noncentralit y parameter ν . The comp onent p osterior noted ab ov e is also the natural CD for θ 1 , θ 2 separately , but one cannot deriv e the confidence distribution of δ by manipulating the joint CD based on these t wo indep endent CDs. Instead, the CD of δ is found by considering the sampling distribution of b δ = ( y 2 1 + y 2 2 ) 1 / 2 , which is a sufficient statistic for δ . One finds C ( δ | y 1 , y 2 ) = 1 − Γ 2 || y || 2 σ 2 , δ 2 σ 2 . (0.2) Inciden tally , this agrees with the b elief in [0 , δ ], found by the Inferential Mo del metho ds of Martin and Liu (2015), for this situation. Note also that the marginalisation to δ is carried out in the the observ ation space and not in the ep istemic probability space (whic h is what is done in th e Bay esian analysis). Let us briefly inv estigate the non-collision probabilities that these tw o metho ds pro duce. Col- lision is defined as the even t that δ is smaller than R , the com bined radius of the t wo satellites. W e set R = 2 . 00 and δ = 1 . 99 – a setup where the satellites really are on a collision course, but just barely so. F or each of a set of v alues of σ w e sim ulate 10 5 realisations of normal pairs ( y 1 , y 2 ). F or each such dataset we then calculate the probability of non-collision, according to each 2 0 1 2 3 4 5 0.5 0.6 0.7 0.8 0.9 1.0 σ mean of Pr(noncollision) 0 1 2 3 4 5 0.0 0.1 0.2 0.3 0.4 0.5 0.6 0.7 σ frequency of high Pr(noncollision) Figure 0.1: F or each v alue of σ , we hav e computed the distribution of non-collision probabilities 1 − B (2 . 00 | y 1 , y 2 ) and 1 − C (2 . 00 | y 1 , y 2 ), with the Bay esian (slanted, red curves) and frequentist CD (full, blac k curves) methods. This is for a setup with R = 2 . 00 the threshold for collision and true v alue δ = 1 . 99. Left panel: the means of these probabilities; right panel: the frequency of high probabilities, those ab o ve 0.95. method, i.e. P ( δ > 2 . 00 | y 1 , y 2 ), which is equal to 1 − B (2 . 00 | y 1 , y 2 ) for the Bay esian metho d, and 1 − C (2 . 00 | y 1 , y 2 ) for the CD. Figure 0.1 displays frequent ist properties of the Bay esian and the frequen tist CD curves for tw o aspects of these non-collision probabilities; the left panel shows their mean non-collision probabilities, the right panel the frequency of high v alues, ab o ve 0.95. Exact calculations are incidentally also p ossible here. The misleading behaviour of the Bay esian solution is apparen t: as the observ ation noise in- creases, the Bay esian metho d rep orts higher and higher confidence in non-collision. In particular, the Bay esian method is biase d in repeated use. The CD, on the other hand, rep orts probabilities that are correctly calibrated, in the sense that it wrongly indicates a high confidence in non-collision for only 5% of the datasets. A mean probability of non-collision of around 50% might seem high, but keep in mind that the data are drawn from a setup where the true distance is suc h that the satellites barely collide. When the observ ation error is high there is a high chance of observing data that (wrongly) indicate a large estimated distance. This misleading property of the Bay esian probabilit y of the satellites to not collide w as identifi ed by BMF and called false confidence. The frequentist confidence 1 − C ( R | y 1 , y 2 ) is free of such false confidence. More formally we actually hav e that 1 − C ( R | y 1 , y 2 ) is uniformly distributed if the true minimal distance is R , i.e. if 3 δ = R . If how ever δ < R the distribution of 1 − C ( R | y 1 , y 2 ) will b e shifted to the left of the uniform, and tow ards larger v alues if δ > R . Note furthermore that C ( R | y 1 , y 2 ) is the confidence w e hav e in δ ∈ [0 , R ], i.e. in collision, after ha ving observed our data; also, 1 − C ( R | y 1 , y 2 ) is the p-v alue for testing the null h yp othesis that there will b e no collision (see Sch weder, 2018). Again the frequen tist CD is fully calibrated, whereas the Bay esian mac hine provides misleading answers, the more so for increasing noise level. It is also illuminating to see how the Bay esian cum ulative B ( δ | y 1 , y 2 ) and frequen tist C ( δ | y 1 , y 2 ) of (0.1) and (0.2) pan out in practice. In Figure 0.2 w e display these cum ulativ es (left panel), in a situation with observed length ∥ y ∥ = 5 . 00, with assumed σ = 2 . 50. The right panel then shows the useful Ba y esian and confidence curv es, | 1 − 2 B ( δ | y 1 , y 2 ) | and | 1 − 2 C ( δ | y 1 , y 2 ) | . These are con venien t data summaries, for the most p ertinen t parameter, the δ . They ‘p oint’ to the median confidence estimates, 4.29 for the CD and 5.61 for Bay es, and also mak e it easy to read off con- fidence interv als. Here, with co v erage lev el 0.90, the Bay esian interv al [2 . 01 , 9 . 57] is unfortunate, in that it misses the true v alue δ = 1 . 99; the cc( δ | y 1 , y 2 ) fares rather better with its [0 . 00 , 8 . 63] in terv al. 0 2 4 6 8 10 0.0 0.2 0.4 0.6 0.8 1.0 δ cumulativ e B and C giv en data 0 2 4 6 8 10 0.0 0.2 0.4 0.6 0.8 1.0 δ B and C cur v es given data Figure 0.2: Left panel: the CD (black curve) and the Bay esian p osterior cumulativ e for δ , after having observed ∥ y ∥ = 5 . 00, with assumed σ = 2 . 50; the critical v alue is R = 2 . 00 (marked blue), where we read off the confidence 0.222 in [0 , R ]. Right panel: the corresp onding confidence curve cc( δ | y 1 , y 2 ) = | 1 − 2 C ( δ | y 1 , y 2 ) | (black) and the Bay esian credibilit y curv e | 1 − 2 B ( δ | y 1 , y 2 ) | (red). Reading off 90% confidence and credibility interv als yields [0 . 00 , 8 . 63] and [2 . 01 , 9 . 57], respectively . The true δ = 1 . 99 behind the generation of ∥ y ∥ here is indicated b y the vertical blue line. 4 The frequentist prop erties, also for a Ba y esian statistical metho d, are of interest in con texts lik e the satellite collision problem, where p otential collision even ts o ccur frequently . When the mo del parameter is given a v ague prior, as there, but the basic parameter of interest is a nonlinear function of this underlying mo del parameter, problems like false confidence and bias migh t b e presen t. When confidence can b e measured in the frequentist spirit of Fisher and Neyman, as laid out in Sc hw eder and Hjort (2016), there will never b e any false confidence, and w e can trust the obtained confidence! Ac knowledgemen ts. W e are grateful for commen ts from both Ry an Martin and from anony- mous referees, whic h hav e cont ributed to a clearer presentation. References Balc h, M.S., Martin, R., and F erson, S. (2019). Satellite conjunction analysis and the false confi- dence theorem. Pro ceedings of the Ro yal So ciet y , A , 475, issue 2227. Hejduk, M.D., Snow, D.E., and Newman, L.K. (2019). Satellite conjunction assessment risk anal- ysis for ‘dilution region’ even ts: issues and op erational approaches. In Space T raffic Managemen t Conference 28 , Austin, TX, F ebruary . commons.erau.edu/cgi/viewcontent.cgi?article=1294 &context=stm Hjort, N.L. and Sch weder, T. (2018). Confidence distributions and related themes. [General in tro duction article to a Special Issue, dedicated to this topic.] Journal of Statistical Planning and Inference 195 , 1–13. Martin, R. (2019). F alse confidence, non-additiv e beliefs, and v alid statistical inference. Interna- tional Journal of Approximate Reasoning , 113, 39–73. Martin, R. and Liu, C. (2015). Inferential Mo dels: Reasoning with Uncertaint y . CRS Press, New Y ork. Sc hw eder, T. (2018). Confidence is epistemic probability for empirical science. Journal of Statistical Planning and Inference 195 , 116–125. Sc hw eder, T. and Hjort, N.L. (2016). Confidence, Likelihoo d, Probabilit y: Statistical Inference with Confidence Distributions. Cambridge Universit y Press. 5
Original Paper
Loading high-quality paper...
Comments & Academic Discussion
Loading comments...
Leave a Comment