Using Feasible Action-Space Reduction by Groups to fill Causal Responsibility Gaps in Spatial Interactions
Heralding the advent of autonomous vehicles and mobile robots that interact with humans, responsibility in spatial interaction is burgeoning as a research topic. Even though metrics of responsibility tailored to spatial interactions have been propose…
Authors: Vassil Guenov, Ashwin George, Arkady Zgonnikov
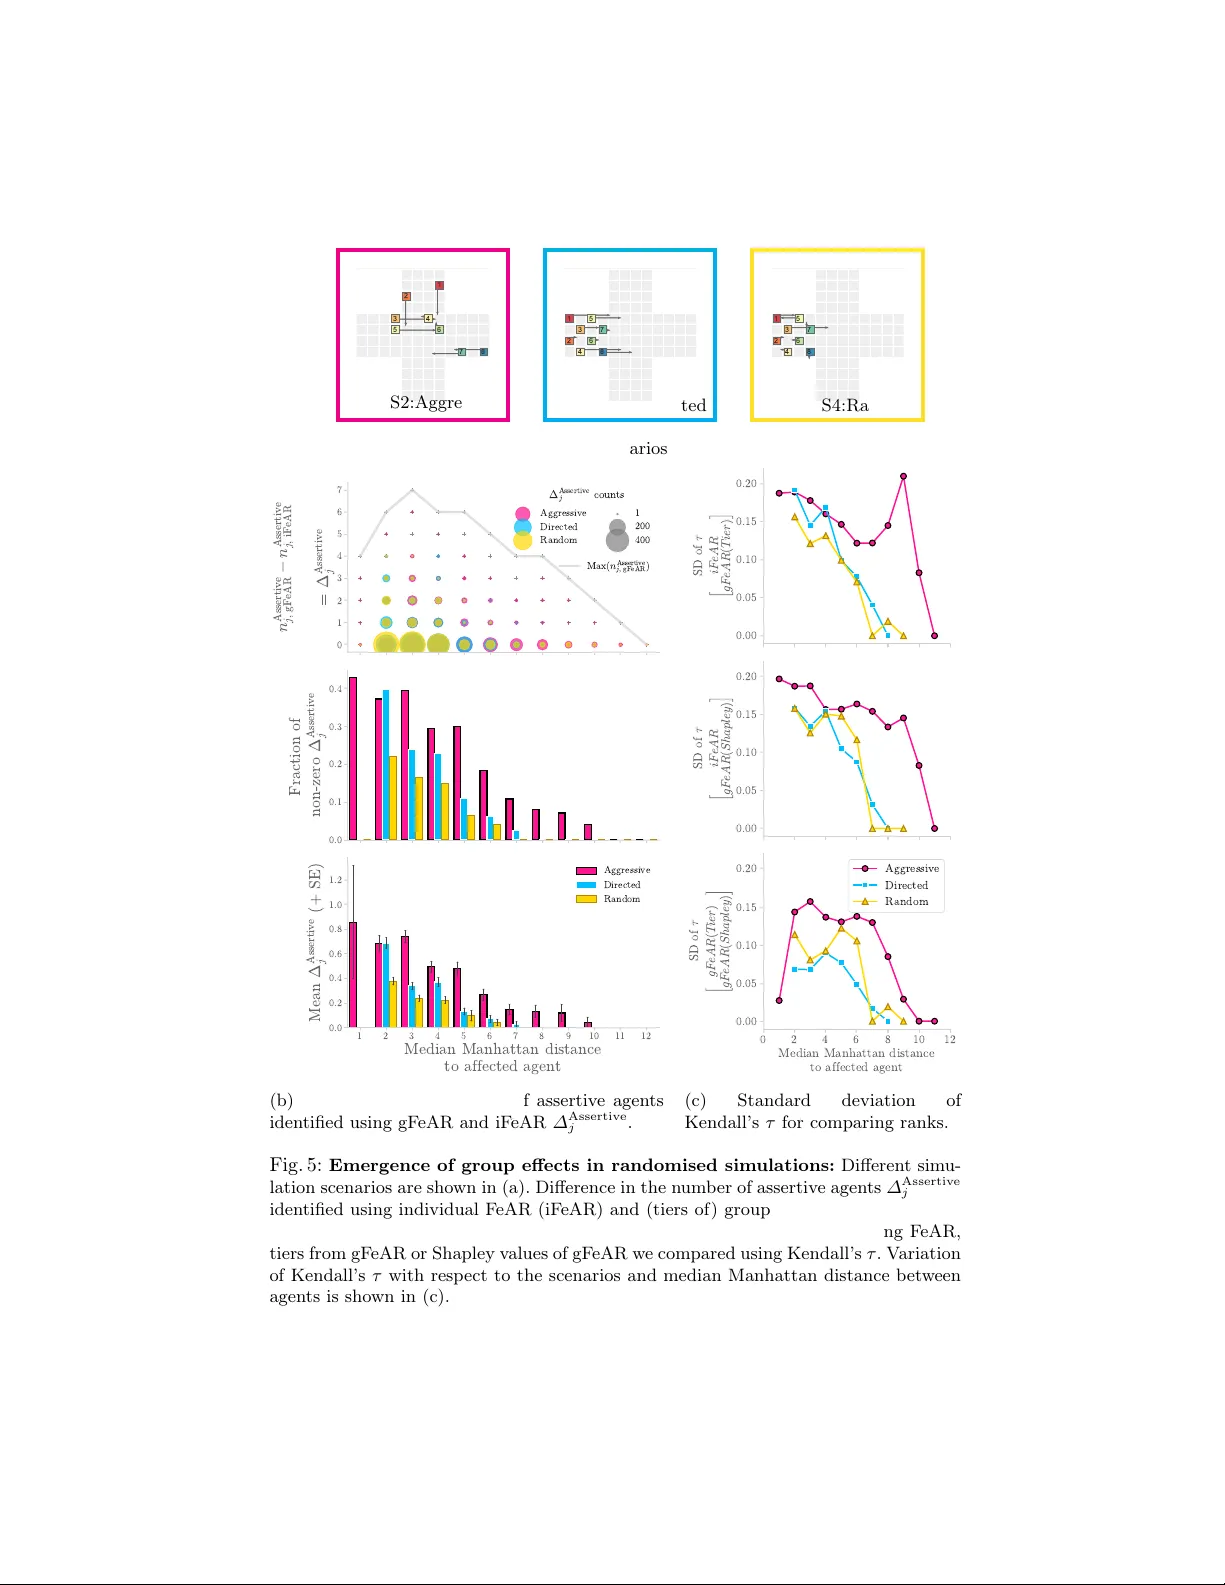
Using F easible A ction-Space Reduction b y Groups to fill Causal Resp onsibilit y Gaps in Spatial In teractions V assil Gueno v* 1 [0009 − 0001 − 8287 − 9199] , Ash win George* 1 , 2 [0009 − 0007 − 7655 − 0737] , Ark ady Zgonnik ov 1 , 2 [0000 − 0002 − 6593 − 6948] , Da vid A. Abbink 1 , 2 [0000 − 0001 − 7778 − 0090] , and Luciano Ca v alcante Sieb ert 1 , 2 [0000 − 0002 − 7531 − 3154] 1 Delft Univ ersit y of T echnology , The Netherlands 2 Cen tre for Meaningful Human Con trol Abstract. Heralding the adv ent of autonomous vehicles and mobile rob ots that interact with h umans, resp onsibilit y in spatial interaction is burgeoning as a researc h topic. Even though metrics of resp onsibilit y tailored to spatial interactions ha ve been prop osed, they are mostly fo- cused on the responsibi lit y of individual agen ts. Metrics of causal resp on- sibilit y fo cusing on individuals fail in cases of causal ov erdeterminism — when man y actors sim ultaneously cause an outcome. T o fi ll the gaps in causal responsibility left b y individual-focused metrics, w e form ulate a metric for the causal resp onsibilit y of groups. T o identify assertiv e agents that are causally resp onsible for the tra jectory of an affected agent, w e further formalise the types of assertive influences and prop ose a tiering algorithm for systematically identifying assertive agents. Finally , we use scenario-based sim ulations to illustrate the benefits of considering groups and ho w the emergence of group effects v ary with interaction dynamics and the pro ximity of agen ts. Keyw ords: Responsibility · Causal Resp onsibilit y · Multi-Agent Sys- tems · Spatial Interactions · Ethics of AI · Emergence 1 In tro duction Na vigation of mobile rob ots and self-driving cars among humans, especially in m ulti-agent settings, faces many challenges owing to the complexit y of multi- agen t in teractions [ 26 , 34 ]. In these safety-critical in teractions, to make agen ts act resp onsibly and to attribute resp onsibilit y in case of accidents, w e need models of resp onsibilit y [ 29 , 5 ]. Research related to spatial in teractions has fo cused on ’resp onsible’ or ’resp onsibilit y-aw are’ navigation based on ho w agen ts yield to other agents [ 30 , 6 , 12 , 36 , 37 ]. While these metho ds are not based on the formal definition of “resp onsibilit y”, a more formal model of causal responsibility in spatial in teractions was proposed based on ho w individual agents restrict the feasible action space of other agents [ 14 , 15 ]. How ev er, all of these approaches only fo cus on the resp onsibility of individual agents. 2 V. Guenov et al. 1 2 3 4 5 6 7 8 (a) Rob ot crossing (b) Grid w orld scenario (c) Effect of 1 on 2 (d) Effect of 5 on 2 (e) Effect of {5,7} on 2 Fig. 1: F easible action space reduction [ 14 ]: F or the rob ot crossing (a) represented in the grid world (b), the feasible action space reduction (F eAR) imp osed by actors on affected agen ts are computed based on the feasible actions of the affected when actors follow their Move de Riguer (MdR) (represented by ) and how man y of these are rendered infeasible by the actual actions of actors (represented by é ). F or affected agen t 2, (c) shows how agent 1 reduces the feasible action space by tw o, (d) shows ho w 5 on its o wn has no influence, and (e) sho ws ho w the group { 5 , 7 } reduces the feasible action space b y tw o. F ormal mo dels of group resp onsibility hav e dealt with the distributing the resp onsibilit y of collective outcomes to individual agents in more abstract sce- narios with few er actions, which do not scale to complex spatial in teraction [ 3 , 1 , 41 , 43 , 25 ]. Understanding group responsibility is important because the ac- tions of individuals might ha ve sup eradditiv e influence on the outcome when acting together [ 11 ], which complicates the tracing of resp onsibility to individ- uals. This is even more problematic in cases of causal o verdetermination, where man y agents simultaneously cause an outcome and no individual agent can b e deemed causally resp onsible in isolation [ 3 ]. Consider the scenario in Fig. 1 of a robot crossing some p edestrians, which w as analysed with the F easible Action-Space Reduction (F eAR) metric [ 14 ]. Ac- cording to this metric, agen ts that restrict the feasible action space of another agen t are causally resp onsible for the tra jectory of the latter. If we represent this in teraction using a grid w orld (as in [ 14 ]), where the actions of agents corresp ond to their sp eed (Fig. 1b ), we can see that the action of pedestrian 1 is restricting the feasible actions of agen t 2, compared to the case when agent 1 would ha ve sta yed Fig. 1c . Ev en though this insight helps us, individual F eAR fails in some cases. F or example, if you lo ok at ho w agent 2 is affected b y 5 and 7. Both agents 5 and 7 sim ultaneously restrict the same actions, and even if one of them were to stay , the feasible action space of agent 2 would not c hange (Fig. 1d ). But when we consider them as a group, we can see ho w they are collectiv ely reduc- ing the feasible action space of agen t 2 (Fig. 1e ). Since individual F eAR fails in cases of causal o verdetermination, relying on individual F eAR to ascrib e re- sp onsibilit y can lead to responsibility gaps [ 11 ]. Responsibility gaps o ccur when F eAR by Groups 3 a group of agents ha ve collective resp onsibilit y , but no individual agen t can b e held resp onsible [ 11 ]. T o prev ent suc h resp onsibilit y gaps, w e reformulate the F easible Action-Space Reduction (F eAR) metric for quan tifying the causal resp onsibilit y of groups on the tra jectory of an affected agen t (Section 2.3 ). F or quantifying the contribu- tions of individuals to group outcomes (as in [ 41 , 42 ]), we formally categorise differen t t yp es of assertiv e influences (Section 2.4 ) and use these categorisations to rank the assertive influence of different agen ts into tiers (Section 2.5 ). These tiers w ere further used to explore the emergence of group effects in different scenarios (Section 3.2 ). The main contributions of this pap er are: (a) a form ulation of the feasible action-space reduction (F eAR) metric to quantify the causal resp onsibilit y of groups on the tra jectory of other agen ts in spatial interactions, (b) a formal categorisation of the t ypes of assertive influences, (c) a tiering algorithm for ranking the assertiv e influence of agents on an affected agen t, and (d) scenario- based simulations showing ho w the emergence of group effects are dep enden t on the dynamics of the interaction and pro ximity of the affected agen t to other agen ts. Rest of the work is organised as definitions (Section 2 ), case studies (Sec- tion 3 ), results (Section 4 ), discussion (Section 5 ), and conclusion (Section 6 ). 2 Definitions After some preliminary notations (Section 2.1 ) and the definition of the F easible A ction-Space Reduction (F eAR) metric for individual actors [ 14 ] (Section 2.2 ), w e present our form ulation of F eAR for groups (Section 2.3 ). Then we formally categorise the types of assertiv e influence (Section 2.4 ) and prop ose a tiering algorithm for ranking the assertiv e influences of agents (Section 2.5 ). 2.1 Preliminaries As prop osed by [ 14 ], w e mo del spatial interactions among a set of k agen ts K using a grid w orld where s represen ts the state of the grid w orld encompassing information about spatial constrain ts and the locations of agen ts. Each agent i ∈ K , c ho oses an action a i whic h corresp onds to the sp eed with which they mo ve for the time windo w in consideration. Eac h agen t i has an action space of 17 actions, A i = {S0, U1, U2, U3, U4, D1, D2, D3, D4, L1, L2, L3, L4, R1, R2, R3, R4} — where the first c haracter indicates the direction (Stay , Up, Down, Left or Right) and the second character indicates the sp eed in steps mov ed p er time windo w. A = ( a i ) i ∈K represen ts the joint action of all the agen ts. W e compare the actions of agents a i against their Move de R igueur (MdR) µ i whic h represents exp ectations of how agents would act in a given state s . Ideally , if all agents follow the joint MdR, µ = ( µ i ) i ∈K , there w ould not b e an y crashes. In this pap er, w e consider that the MdR is staying (S0) for all the 4 V. Guenov et al. agen ts in all scenarios. The interv en tion of replacing the actual action with MdR is represen ted as follows: [ A G ← µ G ] = ( a ′ i ) i ∈K where, a ′ i = ( µ i ∈ µ, if i ∈ G a i ∈ A, if i / ∈ G (1) and, [ A i ← µ i ] = A { i } ← µ { i } represen ts the interv ention of replacing the ac- tion of a single agen t i with its MdR. Finally , n j s, A giv es the num b er of feasible mo ves a v ailable to agen t j for a given state s and joint action A . 2.2 Individual F eAR Based on the idea that agents that restrict the feasible action space of other agen ts are causally resp onsible for the tra jectory of the affected agen t, the F ea- sible Action-Space Reduction (F eAR) metric was defined for individual actors as follo ws: Definition 1 (F eAR [ 14 ]). The F e asible A ction-Sp ac e R e duction (F eAR) imp ose d by actor i on affe cte d agent j is define d as: F eAR i,j ( s, A ) = Z n j s, [ A i ← µ i ] − n j s,A n j s, [ A i ← µ i ] + ϵ ! , if i = j , Z n i s,A n i s, [ A ¬ i ← µ ¬ i ] + ϵ ! , if i = j, (2) wher e ¬ i = K \ { i } , Z ( x ) = min ( − 1 , max( x, 1)) , and 0 < ϵ ≪ 1 . The function Z ( x ) clips the v alues of F eAR to [ − 1 , 1] to aid in terpretability of F eAR v alues and ϵ in the denominator ensures that F eAR is defined when n j s, [ A i ← µ i ] = 0 . P ositive v alues of F eAR i,j indicate that actor i is being assertiv e tow ards the affected agen t j and is hence causally resp onsible for j ’s tra jectory . F or example, in the scenario shown in Fig. 2 , agent 1 decreases the feasible action space of agent 2 by one (Fig. 2b ) and hence F eAR 1 , 2 > 0 (Fig. 2c ). 2.3 Group F eAR T o b etter capture causal resp onsibility in cases of causal ov erdeterminism, we prop ose the F eAR metric for groups (gF eAR) as follows: Definition 2 (Group F eAR). The F e asible A ction-Sp ac e R e duction (F eAR) imp ose d by by a non-empty gr oup G ⊆ ¬ j on an affe cte d agent j , is define d as: F eAR G,j ( s, A ) = n j s, [ A G ← µ G ] − n j s, A n j s, [ A G ← µ G ] + ϵ . (3) F eAR by Groups 5 (a) Scenario (b) Counterfactuals with MdRs for different groups. (c) iF eAR 3 ↼ ? 2 ↼ 1 1 ↼ 2 Influences (d) gF eAR 3 ⇐ 1 , 2 2 ↼ 1 3 1 ↼ 3 (1 ↼ 2) Influences 1 2 2 1 (1 ↼ 2 , 2 ↼ 1) (e) Solo influences 1 2 3 2 1 3 (2 ↼ 1 3) (f ) Mediated influence 3 2 1 (3 ⇐ { 1 , 2 } ) (g) Coupled influence Fig. 2: Types of assertiv e influence based on group F eAR: F or the illustrative scenario (a) where three agents are moving tow ards eac h other, we show how coun- terfactuals based on the MdR of actors (b) are used to compute iF eAR v alues (c) for individual actors and gF eAR v alues for group actors (d). While iF eAR can only identify solo influences ( 1 ↼ 2 and 2 ↼ 1 ) (e), analysing gF eAR can reveal additional me diate d ( 2 ↼ 1 3 ) (f ) and c ouple d ( 3 ⇐ { 1 , 2 } ) (g) influences. Even though F eAR 3 , 3 < 1 reflects the reduction in feasible action space of 3, iF eAR cannot identify the assertive actors; whic h are rev ealed b y gF eAR ( 3 ⇐ { 1 , 2 } ). Also note that agent 3 has no influence on agen t 1 as F eAR 2 , 1 = F eAR { 2 , 3 } , 1 . Lo oking at Fig. 2 again, the group { 1 , 3 } acting together is reduces the feasi- ble action space of 2 by 2 Fig. 2b . This is captured by the definition of F eAR for groups and F eAR { 1 , 3 } , 2 > F eAR 1 , 2 > 0 sho ws that the group of actors { 1 , 3 } has more influence on agen t 2 than just the individual actor 1. F urthermore, when considering the effect on agent 3, F eAR 1 , 3 = F eAR 2 , 3 = 0 , fails to capture any influence of other agents. But F eAR { 1 , 2 } , 3 > 0 shows that collectively { 1 , 2 } is b eha ving assertively tow ards agent 3 and is hence collectiv ely causally resp onsi- ble for the tra jectory of agent 3. Thus, gF eAR can quan tify casual resp onsibilit y in cases of causal o verdetermination. As seen ab o ve, agents can ha ve different influences on an affected agen t when considered to b e acting individually or as part of a group. The follo wing section categorises these t yp es of influences. 6 V. Guenov et al. 2.4 T yp es of assertiv e influence Based on whether agents hav e assertive influence on their own or as part of groups, we hav e identified 3 fundamen tal t yp es of assertiv e influence: solo in- fluenc e , me diate d influenc e and c ouple d influenc e , and a fourth derived type of influence me diate d c ouple d influenc e . These four t yp es of influence defined be- lo w span the whole sp ectrum of assertive influences and helps us compare the assertiv eness of different agen ts. Definition 3 (Solo influence j ↼ i ). A gent i has solo influenc e on agent j if F eAR i,j > 0 Definition 4 (Mediated influence j ↼ G i ). A gent i has a me diate d influenc e on agent j if F eAR i,j = 0 , and ∃ G ⊂ ¬ j \ { i } , G = ∅ such that F eAR G ∪{ i } ,j > F eAR G,j > 0 . Definition 5 (Coupled influence j ⇐ G ). A l l agents in gr oup G ⊂ ¬ j \ { i } , G = ∅ have c ouple d influenc e on agent j if F eAR i,j = 0 ∀ i ∈ G and F eAR G,j > 0 . There can also b e cases where a group of agents hav e coupled influence that is mediated b y another group of agents. Therefore a more general definition of mediated coupled influence is as follo ws: Definition 6 (Mediated coupled influence j ⇐ G ′ G ). Gr oup G has a c ouple d influenc e on agent j which is me diate d by another gr oup G ′ if F eAR i,j = F eAR G ′ ,j ∀ i ∈ G and F eAR G ′ ∪ G,j > F eAR G ′ ,j In the example shown in Fig. 2 , agents 1 and 2 hav e solo influences on each other ( 1 ↼ 2 , 2 ↼ 1 ), agent 3 has an influenc e on agent 2 which is mediated b y agent 1 ( 2 ↼ 1 3 ), and agents 1 and 2 ha ve a coupled influence on agen t 3 ( 3 ⇐ { 1 , 2 } ). Figs. 2e to 2g show how these influences are pictorially represented. Fig. 3 shows a more complicated scenario with more intricate influences. F or example, the group { 5 , 7 } has a mediated coupled influence on agent 1 1 ⇐ { 2 , 3 , 4 , 6 } { 5 , 7 } (Fig. 3d ). F or systematically unrav elling these intricate dep en- dencies of influence b y iden tifying minimal groups that are causally resp onsible, w e prop ose a tiering algorithm for ranking the assertive influences on eac h af- fected agen t. 2.5 Ranking agents based on influence In cases of agents having mediated influence, their influence is conditional to the actions of the mediating agen t. Thus, based on the in tuition that the assertive influence of agents with mediated influence should b e rank ed lo w er than the assertiv e influence of those agen ts that mediate these mediated influences, we prop ose a tiering algorithm for ranking the influence of different agents into tiers (Algorithm 1 ) 3 . 3 Detailed implemen tation of the algorithm can b e found at gith ub.com/ D AI- Lab- HERALD/F eAR. F eAR by Groups 7 Algorithm 1 Tiering the assertive influence of agents ϕ j ← { i : F eAR i,j < 0 } Find courteous agents ϕ j . κ j ← ¬ j \ ϕ j Remov e ϕ j from candidate agents κ j . R 0 ← ∅ R n — Assertive agents until T j,n . for n = 1 , 2 , · · · : F or each tier, T j,n ← ∅ for k = 1 , . . . , | κ j | : starting with k=1, for all G ⊆ κ j , | G | = k : lo op through groups with k agents, if F eAR R n − 1 ∪ G,j > F eAR R n − 1 ,j : identify assertive groups, T j,n ← T j,n ∪ { G } , add them to tiers, and κ j ← κ j \ G remov e them from candidate agents. if T j,n = ∅ : break R n ← R n − 1 ∪ S G ∈ T j,n G (a) Scenario (b) iF eAR (c) Assertive influences on agent 1. T 1 , 1 T 1 , 2 T 1 , 3 1 6 2 3 4 5 7 (d) Tiers affecting agent 1 Fig. 3: Ranking the assertiv eness of agen ts in to tiers T j,n : In this illustrative scenario (a), when considering agen t 1 as the affected, iF eAR only show agent 6 as b eing the assertive (b). How ev er, counterfactuals with groups (c) reveal more assertive influences on agen t 1 whic h are systematically ranked into tiers T 1 ,n (d). T o represent how higher tiers hav e more influence on the affected agent j , w e use the ≻ op erator : T j,n ≻ T j,n +1 . Consider ho w different actors influence agent 1 for the example in Fig. 3a . Fig. 3c shows the assertive influence of groups of actors { 6 } , { 2 , 3 } , { 2 , 3 , 4 , 6 } and { 2 , 3 , 4 , 5 , 6 , 7 } . Based on these assertiv e influences, the algorithm systematically iden tifies the solo influence of agen t 6 ( 1 ↼ 6 ), the coupled influence of group { 2 , 3 } ( 1 ⇐ { 2 , 3 } ), the mediated influence of agent 4 ( 1 ↼ { 2 , 3 , 6 } 4 ) and the mediated coupled influence of group { 5 , 7 } ( 1 ⇐ { 2 , 3 , 4 , 6 } { 5 , 7 } ), and sorts these assertiv e influences into three tiers 6 ∼ 2 ∼ 3 ≻ 4 ≻ 5 ∼ 7 as shown in Fig. 3d . Th us, the tiers provide richer information ab out assertiv e influences than the assertiv e influences found from the p ositiv e v alues of individual F eAR (Fig. 3b ). 8 V. Guenov et al. 3 Scenario-based simulations W e used scenario-based simulations to demonstrate the b enefits of considering the assertive influences of groups. W e defined metrics to quantify how group F eAR can uncov er more information about an interaction than individual F eAR (Section 3.1 ). Using these metrics, we explored group effects in differen t scenar- ios( Section 3.2 ). 3.1 Metrics Since the goal of group F eAR and the tiering algorithm is to id en tify assertiv e agen ts and to rank their assertiveness, we consider tw o metrics for comparing F eAR and group F eAR, 1) based on the num ber of assertive agen ts and 2) based on the alignment of rankings of assertiveness using Kendall’s τ . T o b etter understand the relationship of these metrics to the proximit y of agen ts, w e plot these against the median Manhattan distance to the affected agent. Difference in the num ber of assertive agen ts: F or an affected agent j , the num b er of assertive agents identified with individual F eAR is the num b er of actors i with F eAR i,j > 0 , and the n umber of assertiv e agents identified group F eAR is the num b er of actors in tiers T j,n . Since, the num b er of assertive agents v ary with scenarios, w e use the difference in the n umber of assertive agents iden tified using group F eAR and individual F eAR to provide a consistent metric across scenarios: ∆ Assertive j = n Assertive j, gF eAR − n Assertive j, iF eAR = |∪ n T j,n | − |{ i : F eAR i,j > 0 }| . (4) Kendall’s tau for rankings: F or each affected agent, we can rank the assertive- ness of other agents in three wa ys: 1) iF eAR ranks: by sorting the p ositive v alues of individual F eAR, 2) gF eAR-Tier ranks: based on the tiers generated b y the tiering algorithm based on group F eAR, and 3) gF eAR-Shapley ranks: based on ranking p ositiv e Shap ely v alues [ 38 ] generated from all the group F eAR v alues for that affected agen t. W e compare iF eAR and gF eAR-Tier ranks against baseline of gF eAR-Shapley deriv ed from Shap ely v alues which are the state of the art when computing individual contributions to groups [ 9 , 38 , 42 ]. Shapley v alues are calculated based on the marginal changes in group F eAR v alue when an actor is added to a group of actors [ 38 ]. The main difference b etw een gF eAR-Shapley ranks and gF eAR-Tier ranks is that shap ely v alues consider all p ossible wa ys to assem bling groups while tiers are constructed in a more systematic manner starting from solo and coupled influences and then mo ving onto mediated influences. F or each affected agent in each case, we compare tw o rankings of assertiveness using Kendall’s tau [ 23 ] which returns τ = +1 if all pairs of actors hav e the same relativ e ranks in the b oth rankings. When creating the arrays of ranks for comparisons, non-assertiv e agents are given a rank of k + 1 where k is the total n umber of agents in that scenario. The rankings of assertive influences, as in the case of the num b er of assertive agen ts, are dependent on the scenarios. T o b etter understand the relationship F eAR by Groups 9 b et w een sp ecific scenarios and these metrics we plot them against a metric for the pro ximity of agen ts. Median Manhattan Distance: All the scenarios for the randomised simula- tions (Section 3.2 ) had the same num b er of agents, and we used the median Manhattan distance b et ween agen ts to indicate the proximit y of agents in each case. Cases where agents are closer together would ha ve lo wer median Manhat- tan distances. By plotting the differences in num b er of assertive agen ts identified and Kendall’s τ comparing ranks for differen t median Manhattan distances, we can see ho w group effects are related to proximit y of agents. 3.2 Scenarios W e start by analysing a particular scenario (S1) in detail to illustrate how the metrics capture group effects. Later, we use these metrics to explore group effects in pseudo-randomised sim ulations of three different scenarios (S2, S3, S4). S1:Rob ot crossing p edestrians: F or the detailed scenario, w e consider the description in the introduction where a rob ot (agent 5) is crossing the path of some p edestrians Fig. 1 and crashing into pedestrians 2, 3, 4 and 7. S2-4:Randomised simulations: W e consider three scenarios S2:A ggr essive , S3:Dir e cte d and S4:R andom for the pseudo-randomised sim ulations (see Fig. 5a ). F or A ggr essive , agents spawn in random locations and the p olicy makes agents tak e random actions to aggressively cross the intersection. F or Dir e cte d , agents spa wn in fixed lo cations to the left of the intersection and then the p olicy makes them randomly choose actions to gen tly cross to the righ t and slow down after crossing the intersection. F or R andom , agents spawn in the same lo cation as Di- r e cte d , but then take completely random actions in all directions. 50 simulations of each scenario were run with 5 iterations p er sim ulation. Th us, in total there w ere 250 separate cases for each scenario with eigh t agents. 4 Results Groups effects in four scenarios w ere analysed with resp ect to the difference in the n umber of assertive agen ts identified and Kendall’s 4.1 Num b er of assertiv e agen ts from individual and group F eAR The tiers for scenario S1 sho wn in T able 1 sho w how the rob ot (agent 5) is affected by the solo influence of p edestrian 4 ( 5 ↼ 4 ) and coupled influence of p edestrians 2 and 7 ( 5 ⇐ { 2 , 7 } ), and how it affects all the p edestrians either through solo ( 3 ↼ 5 , 4 ↼ 5 , 6 ↼ 5 ) or coupled influence ( 1 ⇐ { 5 , 7 } , 2 ⇐ { 5 , 7 } , 7 ⇐ { 2 , 5 } , 8 ⇐ { 2 , 5 } ). Besides these influences in volving agent 5, the algorithm also identifies mediated influences ( 4 ↼ T 4 , 1 2 , 7 ↼ T 7 , 1 6 ) and mediated coupled influence ( 6 ⇐ T 6 , 1 { 2 , 7 } ) which are mediated by tiers T j, 1 of affected agen ts j . 10 V. Guenov et al. (a) Rob ot (5) crossing pedestri- ans (1, 2, 3, 4, 6, 7 and 8) (b) iF eAR (c) Shapley v alues T 1 , 1 1 5 7 T 2 , 1 2 1 5 7 T 3 , 1 3 5 T 4 , 1 T 4 , 2 4 5 3 2 T 5 , 1 5 4 2 7 T 6 , 1 T 6 , 2 6 5 4 2 7 T 7 , 1 T 7 , 2 7 8 2 5 6 T 8 , 1 8 2 5 (d) Tiers affecting different agents from group F eAR. Fig. 4: S1: Uncov ering group effects with group F eAR: F or the robot crossing scenario from Fig. 1 , represented in the grid world as in (a), compared to just using iF eAR (b), we are able to uncov er more assertive influences using gF eAR, either through the Shapley v alues (c) or tiers (d). F or example, while iF eAR only sho ws the assertive influence of the robot 5 on pedestrians 3, 4 and 6, both Shapl ey v alues and tiers show that 5 is assertive tow ards all the p edestrians. Th us, by identifying coupled and mediated influences, group F eAR iden- tifies more agents which are being assertiv e to wards an affected agen t, than w ould b e p ossible just by using individual F eAR (as shown by the v alues of ∆ Assertive j = n Assertive j, gF eAR − n Assertive j, iF eAR in T able 1 ). Since iF eAR can only iden tify solo influences, it can never identify more assertiv e agents than the tiers from gF eAR; so n Assertive j, gF eAR ≥ n Assertive j, iF eAR and ∆ Assertive j ≥ 0 . In S1, the v alue of ∆ Assertive j has a maximum of three for affected agent 7. F or agent 7, in addition to the solo influence of agent 8 ( 8 ↼ 7 ), the tiers reveal the coupled influence of agen ts 2 and 5 ( { 2 , 5 } ⇐ 7 ), and the mediated influence of agen t 6 ( 6 ↼ { 2 , 5 , 8 } 7 ). F urthermore, agents 6 and 7 hav e the maximum num ber of assertive agen ts ( n Assertive j, gF eAR = 4 ) follow ed b y agents 2, 4 and 5 ( n Assertive j, gF eAR = 3 ). These agents are F eAR by Groups 11 T able 1: Ranks of assertiv e influence in S1: Ranking of assertiv e influence calcu- lated using F eAR, tiers from group F eAR and Shapley v alues of group F eAR. ‘ ■ ’ show affected agents which are not considered in the rankings. (a) Ranking’s of assertiveness and ∆ Assertive j . Affected: 1 ∆ Assertive j = 2 iF eAR ranks : ■ . . . . . . . gF eAR (Tier) ranks : ■ . . . 1 . 1 . gF eAR (Shapley) ranks : ■ . . . 1 . 1 . Affected: 2 ∆ Assertive j = 2 iF eAR ranks : 1 ■ . . . . . . gF eAR (Tier) ranks : 1 ■ . . 1 . 1 . gF eAR (Shapley) ranks : 1 ■ . . 2 . 2 . Affected: 3 ∆ Assertive j = 0 iF eAR ranks : . . ■ . 1 . . . gF eAR (Tier) ranks : . . ■ . 1 . . . gF eAR (Shapley) ranks : . . ■ . 1 . . . Affected: 4 ∆ Assertive j = 1 iF eAR ranks : . . 1 ■ 1 . . . gF eAR (Tier) ranks : . 3 1 ■ 1 . . . gF eAR (Shapley) ranks : . 3 1 ■ 2 . . . Affected: 5 ∆ Assertive j = 2 iF eAR ranks : . . . 1 ■ . . . gF eAR (Tier) ranks : . 1 . 1 ■ . 1 . gF eAR (Shapley) ranks : . 1 . 3 ■ . 1 . Affected: 6 ∆ Assertive j = 2 iF eAR ranks : . . . 1 1 ■ . . gF eAR (Tier) ranks : . 3 . 1 1 ■ 3 . gF eAR (Shapley) ranks : . 3 . 1 1 ■ 3 . Affected: 7 ∆ Assertive j = 3 iF eAR ranks : . . . . . . ■ 1 gF eAR (Tier) ranks : . 1 . . 1 4 ■ 1 gF eAR (Shapley) ranks : . 2 . . 2 4 ■ 1 Affected: 8 ∆ Assertive j = 2 iF eAR ranks : . . . . . . . ■ gF eAR (Tier) ranks : . 1 . . 1 . . ■ gF eAR (Shapley) ranks : . 1 . . 1 . . ■ (b) Kendall’s τ comparing rankings. τ close to 1 indicate similar rankings. Affected 1 2 3 4 5 6 7 8 τ (iF eAR, gF eAR-(Tier)) - 0.47 1.00 0.85 0.47 0.79 0.42 - τ (iF eAR, gF eAR-(Shapley)) - 0.65 1.00 0.82 0.22 0.79 0.59 - τ (gF eAR-(Tier), gF eAR-(Shapley)) 1.00 0.93 1.00 0.97 0.93 1.00 0.94 1.00 in the cen tre of the in teraction and their pro ximity to other agents might b e a con tributing factor for the group effects on them. T o further explore the effect of proximit y on group effects in th e randomised sim ulations, we plot ∆ Assertive j v ersus median Manhattan distance of other agents to the affected agent (Fig. 5b ). Low v alues of the median Manhattan distance w ould imply that other agen ts w ere more proximal to the affected agen t. It should be noted that the median Manhattan distance to affected agen t is a meaningful metric only because all the scenarios considered here ha ve the same map and num ber of agents. As the median Manhattan distance increases b ey ond a threshold, the maxim um n Assertive j, gF eAR line sho w how the num b er of assertive agents start to drop. Counts of instances of ∆ Assertive j for different scenarios also show mirror this trend of decreasing group effects as the affected agen ts gets farther from other agents. T o better understand the trends in group effects w e also plot the fraction of non-zero ∆ Assertive j and mean ∆ Assertive j for each scenario in 12 V. Guenov et al. Fig. 5b . Both of these show how group effects decrease as the proximit y of the affected agen t to others decrease. Another k ey finding is how group effects v ary across differen t sim ulation scenarios. The fraction of non-zero ∆ Assertive j and mean ∆ Assertive j for each mean Manhattan distance sho w ho w group effects are generally the largest in case of the A ggr essive scenario where all the agen ts are aggressiv ely crossing the in tersection. Also, for larger distances from the affected agen t, group effects are still presen t for Assertive , while they die off for Dir e cte d and R andom . Of the three scenarios, R andom has the low est v alues of ∆ Assertive j while Dir e cte d has in termediate v alues. In summary , the v alues of ∆ Assertive j sho w that group effects are strongest in Assertive and weak est in R andom . 4.2 Comparing rankings of assertiveness So far, we ha ve explored the difference in the num ber of assertive agen ts identified using individual F eAR and group F eAR. Besides just identifying assertive agents, our algorithm ranks assertive influences in to tiers. Here, we will compare these gF eAR-Tier ranks against iF eAR ranks generated from individual F eAR v alues and gF eAR-Shapley ranks generated from Shapley v alues based in group F eAR. The rankings for the rob ot crossing scenario (CS1) are summarised in T able 1 in terms of ranks. So for affected agen t 7, the gF eAR-Tier ranks of (1 , 1 , 1 , 4) for agen ts 2, 5, 8 and 6 represent the ranking 2 ∼ 5 ∼ 8 ≻ 6 and the gF eAR-Shapley ranks of (1 , 2 , 2 , 4) for agen ts 8, 2, 5 and 6, represent the ranking 8 ≻ 2 ∼ 5 ≻ 6 . Apart from fewer assertiv e agen ts iden tified using iF eAR, most of the other rankings are in agreement with eac h other. One difference b et w een gF eAR-Tier and gF eAR-Shapley ranks concerns the ranking of coupled influences. Coupled influences are consistently rank ed along solo influences in iF eAR ranks, while the gF eAR-Shapley ranks for coupled influences is higher than the solo influence for affected agent 5, and low er than solo influences for agen ts 2 and 7. Another difference b et ween gF eAR-Shapley and gF eAR-Tier ranks is in the ranks of solo influence — agen ts with solo influence alwa ys hav e rank 1 in gF eAR-Tier , whereas gF eAR-Shapley ranks for agents with solo influence can b e different. F or example, in the gF eAR-Shapley ranks for affected agent 4, the ranks of agents 3 and 5 are 1 and 2 resp ectiv ely , whereas b oth of them hav e gF eAR-Tier of 1. The difference among these rankings were quan tified using Kendall’s τ which had v alues in the range [ − 1 , 1] and complete agreement among rankings had τ = 1 . Based on the difference of τ ( iF eAR , gF eAR-Tier ) from 1, the difference b et w een iF eAR and gF eAR-Tier ranks was largest for agent 7 and smallest for agen t 3 ( 7 > 2 ∼ 5 > 6 > 4 > 3 ). It m ust b e noted that even though agents 1 and 8 exp erience group effects due to coupled influences, the lac k of iF eAR makes computing τ ( iF eAR , gF eAR-Tier ) impossible. Ev en with this ca veat, the v alues of τ ( iF eAR , gF eAR-Tier ) give a go od indication for the o verall presence of group effects in the scenario. Th us, the v alues of τ ( iF eAR , gF eAR-Tier ) show how group effects are stronger on cen tral agen ts that are more proximal to other agen ts. Similarly , the v alues of τ ( iF eAR , gF eAR-Shapley ) whic h represen t the difference b et w een the iF eAR and gF eAR-Shapley , also highlight the prev alence of groups F eAR by Groups 13 S2:Aggressiv e S3:Directed S4:Random (a) Scenarios 0 1 2 3 4 5 6 7 n A s s e r t i v e j , g F e A R − n A s s e r t i v e j , i F e A R = ∆ A s s e r t i v e j ∆ A s s e r t i v e j c o u n t s Aggressive Directed Random 1 200 400 M a x ( n A s s e r t i v e j , g F e A R ) 0.0 0.1 0.2 0.3 0.4 Fraction of n o n - z e r o ∆ A s s e r t i v e j 1 2 3 4 5 6 7 8 9 10 11 12 Median Manhattan distance to affected agent 0.0 0.2 0.4 0.6 0.8 1.0 1.2 M e a n ∆ A s s e r t i v e j ( + S E ) Aggressive Directed Random (b) Difference in the n umber of assertive agents iden tified using gF eAR and iF eAR ∆ Assertive j . 0.00 0.05 0.10 0.15 0.20 S D o f τ h i F e A R g F e A R ( T i e r ) i 0.00 0.05 0.10 0.15 0.20 S D o f τ h i F e A R g F e A R ( S h a p l e y ) i 0 2 4 6 8 10 12 Median Manhattan distance to affected agent 0.00 0.05 0.10 0.15 0.20 S D o f τ " g F e A R ( T i e r ) g F e A R ( S h a p l e y ) # Aggressive Directed Random (c) Standard deviation of Kendall’s τ for comparing ranks. Fig. 5: Emergence of group effects in randomised simulations: Different simu- lation scenarios are shown in (a). Difference in the num b er of assertive agents ∆ Assertive j iden tified using individual F eAR (iF eAR) and (tiers of ) group F eAR (gF eAR) for dif- feren t pro ximity to the affected agent are shown in (b). Rankings made using F eAR, tiers from gF eAR or Shapley v alues of gF eAR we compared using Kendall’s τ . V ariation of Kendall’s τ with respect to the scenarios and median Manhattan distance b et ween agen ts is shown in (c). 14 V. Guenov et al. effects on central agents — with 1 − τ v alues for different affected agents ranked as 5 > 7 > 2 > 6 > 4 > 3 . In addition to comparing iF eAR and gF eAR using τ ( iF eAR , gF eAR-Tier ) , we can use τ ( gF eAR-Tier , gF eAR-Shapley ) to compare the tw o rankings generated from gF eAR. All the v alues of τ ( gF eAR-Tier , gF eAR-Shapley ) < 0 . 9 indicate strong agree- men t b et w een gF eAR-Tier and gF eAR-Shapley ranks. Again the v alues of 1 − τ for different affected agents ( 2 ∼ 5 > 7 > 4 > 1 ∼ 3 ∼ 6 ∼ 8 ) indicate greater differences in cen tral agents. Th us, since the group effects on an affected agent migh t b e related to its cen trality and proximit y to other agen ts, quantified pro ximity to other agents using the median Manhattan distance and explored how taus were related to this distance in differen t scenarios. we are interested in the spread of τ v alues and hence plot the standard deviation (SD) of τ in different scenarios for different median Manhattan distance (Fig. 5c ). F or b oth τ ( iF eAR , gF eAR-Tier ) and τ ( iF eAR , gF eAR-Shapley ) comparing iF eAR and gF eAR, we can see that the SD in τ drops as the median Manhattan distance to the affected agent increases. F urthermore, w e can see that the SD in τ is mcuh greater for A ggr essive than for Dir e cte d or R andom . Regarding the v alues of τ ( gF eAR-Tier , gF eAR-Shapley ) , the spread of the SDs indicate differences b et w een gF eAR-Tier and gF eAR-Shapley , but these differences are smaller than their difference with iF eAR ranks. 5 Discussion Here, we will discuss the imp ortance of these rankings of assertiv eness for filling gaps in causal resp onsibilit y (Section 5.1 ) and for detecting emergence in multi- agen t spatial interactions (Section 5.2 ). 5.1 Filling causal resp onsibilit y gaps with Group F eAR One of the main challenges with AI agents and collective actions is the p ossibilit y of resp onsibilit y v oids [ 27 , 4 , 33 , 17 , 40 ]. Resp onsibilit y voids o ccur when no one can b e held resp onsible for an outcome that resulted from collective action [ 4 , 10 ]. When a group of agents can b e held resp onsible, but no individual can be held resp onsible, this is called a resp onsibilit y gap [ 11 ]. The discourse on resp onsibilit y v oids and resp onsibilit y gaps revolv e around moral resp onsibilit y , which dep ends on conditions lik e inten tion, kno wledge, and wrong-doing on top of causally con tributing to the outcome. In this pap er, w e skip the all other conditions and fo cus on causal resp onsibility and thereby on causal responsibility gaps. W e define that causal resp onsibility gaps occur when a group of agents hav e collectiv e causal resp onsibilit y , but none of the individuals on their o wn can be ascrib ed causal resp onsibility . Such causal resp onsibilit y gaps can o ccur if we solely rely on the F eAR v alues for individual agen ts [ 14 , 16 ]. According to the definition of iF eAR as in Eq. ( 2 ), the causal resp onsibilit y of an agent for it’s own tra jectory is determined as the complement of the F eAR imp osed on it by all F eAR by Groups 15 other agen ts (F eAR j,j = 1 − F eAR ¬ j,j ) . Th us, cases of coupled influence can lead to F eAR i,j = 0 ∀ i ∈ K , where no individual agen t is causally resp onsible, but ¬ j as a collective has assertiv e influence on j . If w e were to blindly hold all agen ts in ¬ j resp onsible, this would lead to resp onsibilit y gluts “where to o many agents are held responsible” [ 11 ]. T o prev ent b oth causal responsibility gaps and gluts, our tiering algorithm for sorting assertive influences, systematically prob es the assertiv eness of individual agents and groups to iden tify minimal groups with assertiv e influence. Minimalit y of the sufficiency set is an imp ortant criteria when inferring causalit y , i.e., all elemen ts muc h be necessary to cause the outcome [ 39 , 20 , 3 ]. Instead of fo cussing on a particular outcome, we are interested in a group’s de- gree of causal influence on the tra jectory of an affected agent, which can increase with the num b er of agents within the group. Using systematic and incremental in terven tions grounded on the actual joint action of agents, the tiering algorithm is able to unra vel the structure of causal influence on affected agen ts. Shapley v alues hav e been widely used to compute the contributions of in- dividual agents to collective rewards or costs [ 38 ]. T o compute Shap ely v alues of group F eAR for k agents on an affected agen t, we need to consider 2 k coun- terfactual scenarios. By eliminating courteous agen ts (with F eAR i,j < 0 ) and grouping agents in higher tiers, the tiering algorithm potentially sav es on com- putation cost. In this paper, w e compute causal resp onsibilit y based on feasible action- space reduction (F eAR) which simply lo oks at how actions of agen ts reduce the feasible action-space of others by causing collisions. There are other mo dels of re- sp onsibilit y that are base on game -theoretic formulations, logical formulations of abilit y and obligations, and probabilistic mo dels of causation — some even con- sider epistemics states like knowledge and in tentions to prop erly ascrib e moral resp onsibilit y . Compared to these mo dels of resp onsibilit y , F eAR provides a sim- plistic and mo del-agnostic metric for causal resp onsibilit y , that can b e applied to a particular time window of spatial in teraction. These simplifications make it an ideal candidate for parsing causal resp onsibilit y in large datasets of spa- tial in teractions. Short-listed scenarios with (problematic) causal resp onsibilit y ascriptions can b e further sub jected to more rigorous scrutin y with regard to epistemic, probabilistic and motiv ational c haracteristics. 5.2 Metric for emergence in spatial interactions In our simulations there was little ro om for emergence as agen ts did not learn or in teract with eac h other. But b y prescribing top-do wn p olicies we were hoping to generate “emergence-like” b eha viour. In doing so, we ha v e stumbled on some metrics that might b e useful in flagging p oten tial emergent b eha viours in spatial in teractions. Emergence can b e defined as “the appearance of patterns, prop erties and b e- ha viours within a system that are not evident in individual comp onen ts [ 19 ].” Based on the relationship b et ween the macroscopic prop ert y and microscopic factors that cause it, emergence has b een classified into nominal , we ak and 16 V. Guenov et al. str ong emergence [ 2 , 35 , 44 ]. T raditionally , w eak emergence has b een quantified using information-theoretic metrics p ertaining to the causal relationship b et w een macroscopic prop erties and microscopic factors [ 7 , 35 , 21 , 32 , 19 , 31 ], whic h rely on probabilistic mo dels of how systems evolv e ov er time. Group F eAR, on the other hand, pro vides a measure of causal responsibility of groups of agen ts without needing probabilistic or prediction mo dels. More assertiv eness from other agents mean that the tra jectory of the affected agen t is less dep enden t on it’s own actions and more dep enden t on the collective actions of others — which necessitates co ordination among agents. Unlike the case of weak emergence where prop erties emerge at macroscopic scales [ 22 , 21 ], the assertiv eness of groups of agen ts act on the tra jectories of an affected agent on the same scale which obviates the need to iden tify the scale at which emer- gence o ccurs. The standard deviation of Kendall’s τ betw een the rankings of assertiv eness from iF eAR and gF eAR are indicative of the sup eradditivit y of assertiv e influences in a scenario. The results from the randomised sim ulations (Section 4.2 ) sho wing more group effects for A ggr essive than R andom , agree with the intuition that complexit y is maximum in the space b etw een complete order and complete chaos [ 18 , 8 , 24 , 28 , 13 ]. Thus, the standard deviation in Kendall’s τ comparing the ranks of assertiv eness provides a model-agnostic metric for de- tecting the emergence of complexit y in spatial interactions. 5.3 Applications Group F eAR along with the tiering algorithm can b e used to ascrib e bac kward- lo oking causal resp onsibilit y in spatial in teractions. F uture researc h could use the contin uous version of F eAR [ 16 ] to explore group effects in real-life spatial in teractions, where actions of agents are reactiv e to other agents. As group effects necessitate more co ordination b etw een agents, in a decen- tralised setting, group effects should b e minimised. The presence of group effects migh t warran t interv en tions in the form of infrastructural changes (barricades, roundab outs, lanes), active monitoring and p olicing (crowd con trol, traffic sig- nals), or through training and testing h umans (driver’s license). F urthermore, if we kno w that a group of agents can communicate or co ordi- nate amongst themselves, then group F eAR can use to generate collective actions that maximise courteousness to other agen ts by minimising group F eAR. 6 Conclusion W e presen ted a reformulation of the feasible action-space reduction (F eAR) met- ric to quantify the causal resp onsibilit y of groups on the tra jectory of an affected agen t. Based on marginal c hanges in F eAR, we identified four t yp es of assertive influences - ‘solo’, ‘mediated’, ‘coupled’ and ‘mediated coupled’. Base on these as- sertiv e influences, we proposed a tiering algorithm for ranking the assertiveness of agents. F urthermore, through scenario-based simulations, we demonstrated ho w group F eAR along with the tiering algorithm can be used to identify the emergence of group effects in m ulti-agent spatial in teractions. F eAR by Groups 17 References 1. Alec hina, N., Halp ern, J.Y., Logan, B.: Causality , Responsibility and Blame in T eam Plans. In: Proceedings of the 16th Conference on Autonomous Agents and MultiAgen t Systems. pp. 1091–1099 (2017) 2. Bedau, M.A.: W eak Emergence. Noûs 31 (s11), 375–399 (Jan 1997). https://doi. org/10.1111/0029- 4624.31.s11.17 3. Braham, M., V an Hees, M.: Degrees of Causation. Erkenn tnis 71 (3), 323–344 (Nov 2009). https://doi.org/10.1007/s10670- 009- 9184- 8 4. Braham, M., V an Hees, M.: V oids or F ragmen tation: Moral Responsibility F or Collectiv e Outcomes. The Economic Journal 128 (612), F95–F113 (Jul 2018). h ttps: //doi.org/10.1111/eco j.12507 5. Calv ert, S.C., Johnsen, S.O., George, A.: Designing automated vehicle and traffic systems to wards meaningful human control. In: Research Handb o ok on Meaningful Human Control of Artificial Intelligence Systems. Edward Elgar Publishing, United Kingdom (2023 (A ccepted)). https://doi.org/10.48550/arXiv.2303.05091 6. Cosner, R.K., Chen, Y., Leung, K., Pa v one, M.: Learning responsibi lit y allo cations for safe h uman-rob ot in teraction with applications to autonomous driving. In: Proc. IEEE Conf. on Rob otics and Automation (2023) 7. Crutc hfield, J.P .: The calculi of emergence: Computation, dynamics and induction. Ph ysica D: Nonlinear Phenomena 75 (1-3), 11–54 (Aug 1994). https://doi.org/10. 1016/0167- 2789(94)90273- 9 8. Crutc hfield, J.P ., Y oung, K.: Inferring statistical complexity . Physical Review Let- ters 63 (2), 105–108 (Jul 1989). h ttps://doi.org/10.1103/PhysRevLett.63.105 9. Dobzinski, S., Mehta, A., Roughgarden, T., Sundarara jan, M.: Is Shapley cost sharing optimal? Games and Economic Behavior 108 , 130–138 (Mar 2018). https: //doi.org/10.1016/j.geb.2017.03.008 10. Duijf, H.: Resp onsibilit y V oids and Co operation. Philosophy of the So cial Sciences 48 (4), 434–460 (Jul 2018). https://doi.org/10.1177/0048393118767084 11. Duijf, H.: A Logical Study of Moral Resp onsibilit y. Erk enntnis (Sep 2023). https: //doi.org/10.1007/s10670- 023- 00730- 2 12. Geisslinger, M., Poszler, F., Lienk amp, M.: An ethical tra jectory planning algo- rithm for autonomous v ehicles. Nature Mac hine Intelligence 5 (2), 137–144 (F eb 2023). https://doi.org/10.1038/s42256- 022- 00607- z 13. Gell-Mann, M., Lloyd, S.: Information measures, effectiv e complexity , and total information. Complexity 2 (1), 44–52 (Sep 1996). https://doi.org/10.1002/(SICI) 1099- 0526(199609/10)2:1< 44::AID- CPLX10> 3.0.CO;2- X 14. George, A., Cav alcante Sieb ert, L., Abbink, D., Zgonniko v, A.: F easible Action- Space Reduction as a Metric of Causal Resp onsibility in Multi-Agent Spatial In teractions. In: Gal, K., Nowé, A., Nalepa, G.J., F airstein, R., Rădulescu, R. (eds.) F rontiers in Artificial Intelligence and Applications, F rontiers in Artifi- cial Intelligence and Applications, v ol. 372, pp. 819–826. IOS Press (Sep 2023). h ttps://doi.org/10.3233/F AIA230349 15. George, A., Sieb ert, L.C., Abbink, D., Zgonniko v, A.: F easible Action-Space Re- duction as a Metric of Causal Responsibility in Multi-Agent Spatial Interactions (2023 (ECAI 2023 Accepted)) 16. George, A., Sieb ert, L.C., Abbink, D.A., Zgonniko v, A.: F easible Action Space Re- duction for Quantifying Causal Responsibility in Contin uous Spatial Interactions (Ma y 2025). https://doi.org/10.48550/arXiv.2505.17739 18 V. Guenov et al. 17. Go etze, T.S.: Mind the Gap: Autonomous Systems, the Resp onsibility Gap, and Moral Entanglemen t. In: 2022 ACM Conference on F airness A ccountabilit y and T ransparency. pp. 390–400. A CM, Seoul Republic of K orea (Jun 2022). h ttps: //doi.org/10.1145/3531146.3533106 18. Grassb erger, P .: T o ward a quan titative theory of self-generated complexit y . In- ternational Journal of Theoretical Ph ysics 25 (9), 907–938 (Sep 1986). https: //doi.org/10.1007/BF00668821 19. Green, D.G.: Emergence in complex netw orks of simple agents. Journal of Economic In teraction and Co ordination 18 (3), 419–462 (Jul 2023). https://doi.org/10.1007/ s11403- 023- 00385- w 20. Halp ern, J.Y.: A modification of the halpern-p earl definition of causality . In: Pro- ceedings of the 24th International Conference on Artificial Intelligence. pp. 3022– 3033. IJCAI’15, AAAI Press, Buenos Aires, Argentina (2015) 21. Ho el, E.: When the Map Is Better Than the T erritory. En tropy 19 (5), 188 (Apr 2017). https://doi.org/10.3390/e19050188 22. Ho el, E.P ., Albantakis, L., T ononi, G.: Quan tifying causal emergence sho ws that macro can b eat micro. Pro ceedings of the National A cademy of Sciences 110 (49), 19790–19795 (Dec 2013). https://doi.org/10.1073/pnas.1314922110 23. Kendall, M.G.: A New Measure of Rank Correlation. Biometrik a 30 (1/2), 81 (Jun 1938). https://doi.org/10.2307/2332226 24. Langton, C.G.: Computation at the edge of chaos: Phase transitions and emergent computation. Physica D: Nonlinear Phenomena 42 (1-3), 12–37 (Jun 1990). h ttps: //doi.org/10.1016/0167- 2789(90)90064- V 25. Lorini, E., Longin, D., May or, E.: A logical analysis of resp onsibilit y attribution: Emotions, individuals and collectives. Journal of Logic and Computation 24 (6), 1313–1339 (Dec 2014). https://doi.org/10.1093/logcom/ext072 26. Markkula, G., Madigan, R., Nathanael, D., Portouli, E., Lee, Y.M., Dietric h, A., Billington, J., Sc hieb en, A., Merat, N.: Defining in teractions: A conceptual framew ork for understanding in teractive b eha viour in human and automated road traffic. Theoretical Issues in Ergonomics Science 21 (6), 728–752 (No v 2020). h ttps://doi.org/10.1080/1463922X.2020.1736686 27. Matthias, A.: The resp onsibilit y gap: Ascribing resp onsibilit y for the actions of learning automata. Ethics and Information T echnology 6 (3), 175–183 (2004). https: //doi.org/10.1007/s10676- 004- 3422- 1 28. Mitc hell, M., Crutchfield, J.P ., Hrab er, P .T.: Ev olving cellular automata to p erform computations: Mechanisms and imp edimen ts. Physica D: Nonlin ear Phenomena 75 (1-3), 361–391 (Aug 1994). https://doi.org/10.1016/0167- 2789(94)90293- 3 29. P apadimitriou, E., F arah, H., v an de Kaa, G., San toni de Sio, F., Hagenzieker, M., v an Gelder, P .: T ow ards common ethical and safe ‘b eha viour’ standards for automated v ehicles. Acciden t Analysis & Preven tion 174 , 106724 (Sep 2022). h ttps: //doi.org/10.1016/j.aap.2022.106724 30. Rem y , I., F rido vich-Keil, D., Leung, K.: Learning resp onsibilit y allo cations for m ulti-agent interactions: A differentiable optimization approac h with control bar- rier functions (Oct 2024) 31. Ro dríguez-F alcón, S., Stucchi, L.: Quantifying Emergen t Behaviors in Agent-Based Mo dels using Mean Information Gain (Oct 2025). https://doi.org/10.48550/arXiv. 2510.10381 32. Rosas, F.E., Mediano, P .A.M., Jensen, H.J., Seth, A.K., Barrett, A.B., Carhart- Harris, R.L., Bor, D.: Reconciling emergences: An information-theoretic approach to iden tify causal emergence in m ultiv ariate data. PLOS Computational Biology 16 (12), e1008289 (Dec 2020). https://doi.org/10.1371/journal.pcbi.1008289 F eAR by Groups 19 33. San toni De Sio, F., Mecacci, G.: F our Resp onsibilit y Gaps with Artificial In tel- ligence: Why they Matter and How to Address them. Philosophy & T echnology 34 (4), 1057–1084 (Dec 2021). https://doi.org/10.1007/s13347- 021- 00450- x 34. Sc hw arting, W., Pierson, A., Alonso-Mora, J., Karaman, S., Rus, D.: So cial b e- ha vior for autonomous v ehicles. Proceedings of the National Academ y of Sciences 116 (50), 24972–24978 (Dec 2019). https://doi.org/10.1073/pnas.1820676116 35. Seth, A.K.: Measuring Autonomy and Emergence via Granger Causality. Artificial Life 16 (2), 179–196 (Apr 2010). h ttps://doi.org/10.1162/artl.2010.16.2.16204 36. Shalev-Sh wartz, S., Shammah, S., Shashua, A.: On a F ormal Model of Safe and Scalable Self-driving Cars (Oct 2018) 37. Shalev-Sh wartz, S., Shammah, S., Shashua, A.: Vision Zero: On a Prov able Metho d for Eliminating Roadwa y A cciden ts without Compromising T raffic Throughput (Jan 2019) 38. Shapley , L.S.: A V alue for n-Person Games. In: Kuhn, H.W., T uck er, A.W. (eds.) Con tributions to the Theory of Games (AM-28), V olume I I, pp. 307–318. Princeton Univ ersity Press (Dec 1953). https://doi.org/10.1515/9781400881970- 018 39. T riantafyllou, S., Singla, A., Radanovic, G.: A ctual Causalit y and Responsibil- it y Attribution in Decentralized P artially Observ able Mark ov Decision Pro cesses. In: Pro ceedings of the 2022 AAAI/ACM Conference on AI, Ethics, and So ciet y . pp. 739–752. A CM, Oxford United Kingdom (Jul 2022). https://doi.org/10.1145/ 3514094.3534133 40. V eluw enk amp, H.: What resp onsibilit y gaps are and what they should b e. Ethics and Information T echnology 27 (1), 14 (Mar 2025). https://doi.org/10.1007/ s10676- 025- 09823- 8 41. Y azdanpanah, V., Dastani, M.: Distant Group Resp onsibilit y in Multi-agen t Sys- tems. In: Baldoni, M., Chopra, A.K., Son, T.C., Hiray ama, K., T orroni, P . (eds.) PRIMA 2016: Princiles and Practice of Multi-Agen t Systems, v ol. 9862, pp. 261– 278. Springer In ternational Publishing, Cham (2016). https://doi.org/10.1007/ 978- 3- 319- 44832- 9_16 42. Y azdanpanah, V., Dastani, M., Jamroga, W., Alechina, N., Logan, B.: Strategic Resp onsibilit y Under Imperfect Information (2019) 43. Y azdanpanah, V., Stein, S., Gerding, E.H., Jennings, N.R.: Applying strategic reasoning for accountabilit y ascription in m ultiagent teams. In: Espinoza, H., Mc- Dermid, J.A., Huang, X., Castillo-Effen, M., Chen, X.C., Hernández-Orallo, J., hÉigeartaigh, S.Ó., Mallah, R., P edroza, G. (eds.) Pro ceedings of the W orkshop on Artificial Intelligence Safety 2021 Co-Lo cated with the Thirtieth International Join t Conference on Artificial In telligence (IJCAI 2021), Virtual, August, 2021. CEUR W orkshop Proceedings, v ol. 2916. CEUR-WS.org (2021) 44. Y uan, B., Zhang, J., Lyu, A., W u, J., W ang, Z., Y ang, M., Liu, K., Mou, M., Cui, P .: Emergence and Causality in Complex Systems: A Survey of Causal Emergence and Related Quantitativ e Studies. Entrop y 26 (2), 108 (Jan 2024). https://doi. org/10.3390/e26020108
Original Paper
Loading high-quality paper...
Comments & Academic Discussion
Loading comments...
Leave a Comment