Disease Progression and Subtype Modeling for Combined Discrete and Continuous Input Data
Disease progression modeling provides a robust framework to identify long-term disease trajectories from short-term biomarker data. It is a valuable tool to gain a deeper understanding of diseases with a long disease trajectory, such as Alzheimer's d…
Authors: Sterre de Jonge, Elisabeth J. Vinke, Meike W. Vernooij
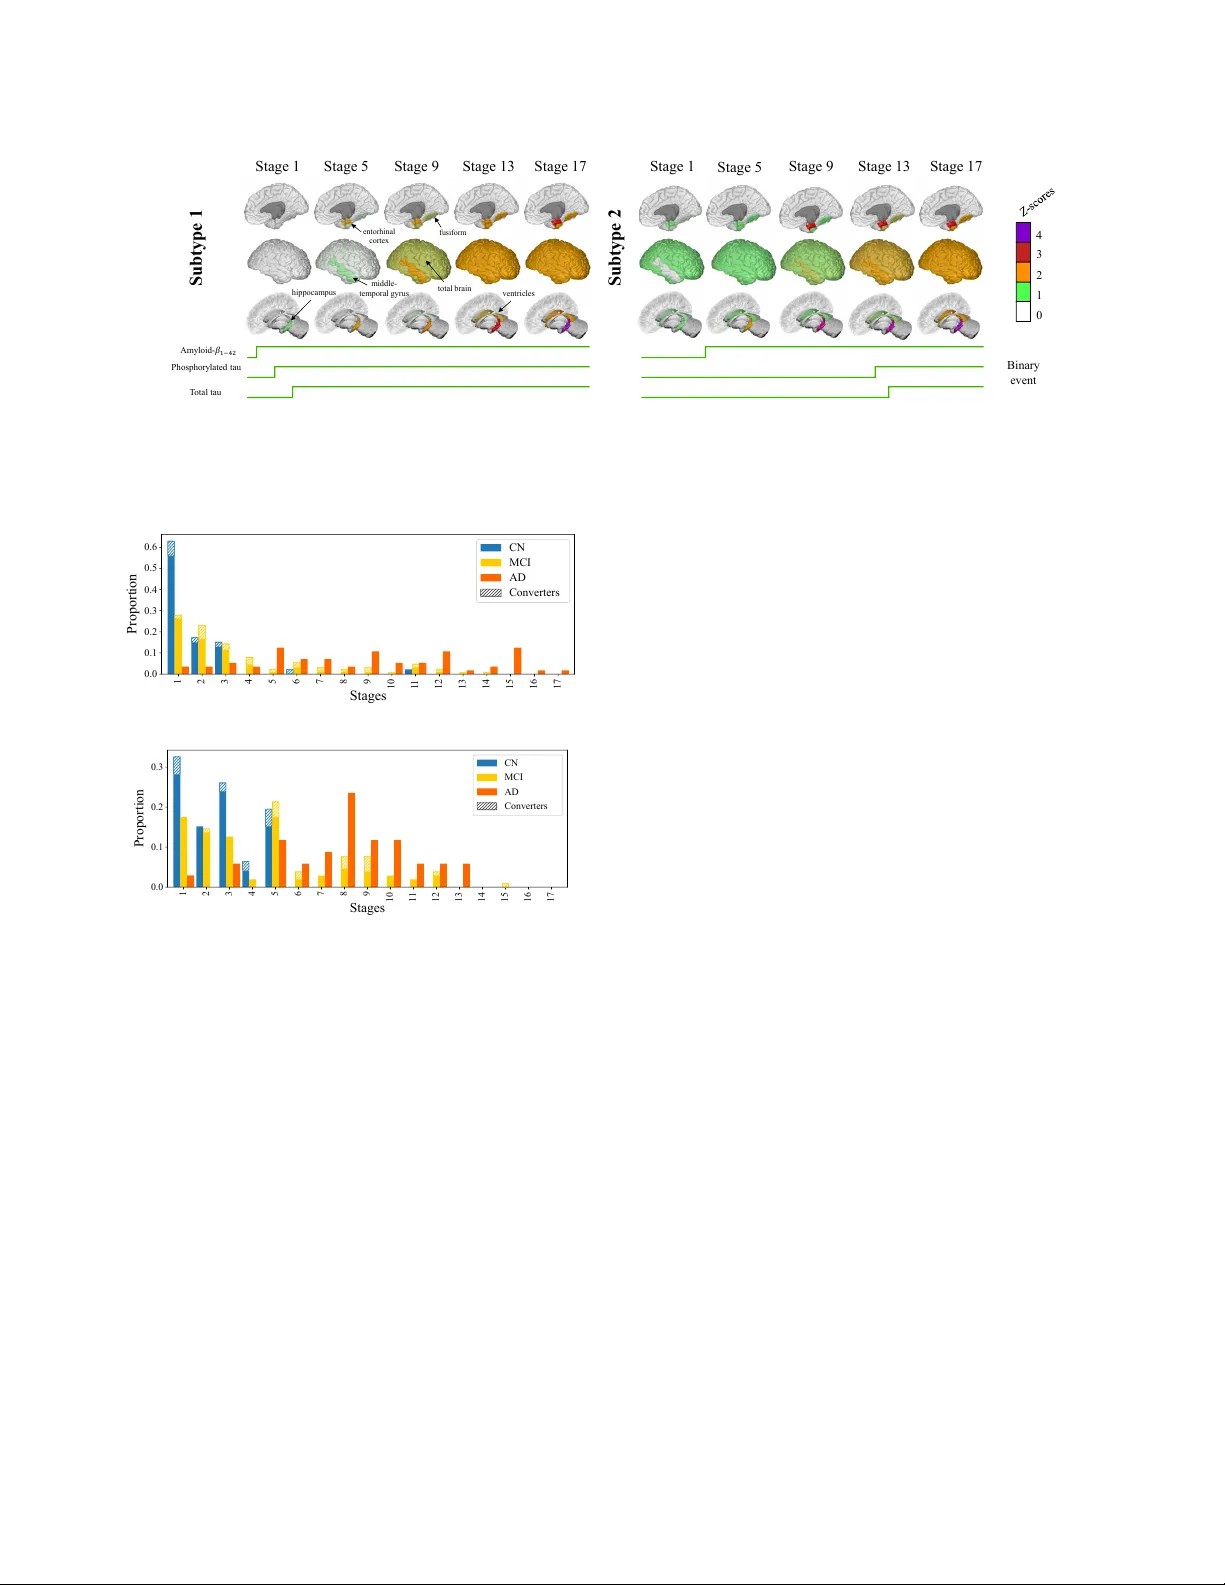
IEEE Copyright Notice ©2026 IEEE. Personal use of this material is permitted. Permission from IEEE must be obtained for all other uses, in any current or future media, including reprinting/republishing this material for advertising or promotional purposes, creating ne w collecti ve w orks, for resale or redistrib ution to servers or lists, or reuse of any cop yrighted component of this work in other works. Accepted for publication, 2026 IEEE 23r d International Symposium on Biomedical Imaging (ISBI), April 2026, London, United Kingdom. DOI: to appear . DISEASE PR OGRESSION AND SUBTYPE MODELING FOR COMBINED DISCRETE AND CONTINUOUS INPUT D A T A Sterr e de Jonge 1 , Elisabeth J . V inke 1 , 2 , Meike W . V ernooij 1 , 2 , Daniel C. Alexander 3 , Alexandr a L. Y oung 3 ∗ and Esther E. Br on 1 ∗ 1 Department of Radiology and Nuclear Medicine, Erasmus MC, Rotterdam, The Netherlands 2 Department of Epidemiology , Erasmus MC, Rotterdam, The Netherlands 3 Hawkes Institute, Department of Computer Science, Uni versity College London, London, United Kingdom ABSTRA CT Disease progression modeling provides a robust frame work to iden- tify long-term disease trajectories from short-term biomarker data. It is a valuable tool to gain a deeper understanding of diseases with a long disease trajectory , such as Alzheimer’ s disease. A key lim- itation of most disease progression models is that they are specific to a single data type (e.g., continuous data), thereby limiting their applicability to heterogeneous, real-world datasets. T o address this limitation, we propose the Mixed Events model, a nov el disease progression model that handles both discrete and continuous data types. This model is implemented within the Subtype and Stage In- ference (SuStaIn) framework, resulting in Mixed-SuStaIn, enabling subtype and progression modeling. W e demonstrate the effecti ve- ness of Mixed-SuStaIn through simulation experiments and real- world data from the Alzheimer’ s Disease Neuroimaging Initiative, showing that it performs well on mixed datasets. The code is avail- able at: https://github.com/ucl-pond/pySuStaIn. Index T erms — Disease Progression Modeling, Mixed Input Data, Alzheimer’ s Disease 1. INTRODUCTION Disease progression modeling provides a robust frame work to iden- tify long-term disease trajectories from short-term biomarker data [1, 2]. This is particularly valuable for neurodegenerati ve disor- ders, such as Alzheimer’ s disease (AD), where progression remains poorly understood, but the disease trajectory has a long preclinical course. Insights into disease trajectories are crucial for the dev el- opment of tar geted interventions for specific patient subpopulations. V arious progression models have been applied to neurodegenerati ve disorders to gain a deeper understanding of underlying biological heterogeneity [3, 4, 5, 6, 7, 8]. One of the earliest disease progression models is the e vent-based model (EBM), which conceptualizes disease progression as a series of events. In EBM, biomarker values transition from a normal to an abnormal value, and the model estimates the most likely ordering of these transitions (i.e., e vents) [9, 10, 6]. Biomarkers are expected to follow a bimodal distribution, distinguishing disease from reference populations. Other disease progression models hav e been de veloped to accommodate ordinal input data [11, 12] or continuous input data [3]. While early models focused on a single disease trajectory , recent ∗ Authors contributed equally . approaches estimate multiple trajectories to account for phenotypic heterogeneity , in addition to temporal heterogeneity [3, 7, 8]. A k ey limitation of these disease progression models is that they model a fixed trajectory shape. This restricts the types of data to which they can be applied and limits their applicability across di- verse datasets. T able 1 summarizes the existing models that can be embedded in Subtype and Stage Inference (SuStaIn) [3], illustrating the different suitable input data types corresponding to the underly- ing biomarker trajectory . Integration of multiple data types, howev er , could offer a more complete vie w of disease trajectories. W ithin the context of AD, this may provide additional insights across changes in structural imaging, clinical scores, or visual ratings. W e therefore propose the Mixed Events model, a no vel disease progression model that handles discrete and continuous input data types. The key innovation is a novel formulation of the likelihood function that enables integration of the likelihoods of the piecewise linear z -score model, the e vent-based model, and the scored e vents model into a single objecti ve function for estimating the ev ent order- ing. W e integrate this model into SuStaIn, leading to Mixed-SuStaIn, enabling subtype and progression modeling for mixed datasets. W e validate our approach through experiments using synthetic data and data from the Alzheimer’ s Disease Neuroimaging Initiative (ADNI), demonstrating its effecti veness in obtaining characteristic orderings across div erse biomarker data types. T able 1: Existing disease progression models embedded in SuStaIn. Model Biomarker T rajectory Input Data T ype Event-based model Biomarkers transition from a normal to an abnormal value re- flecting an instantaneous switch in disease progression Biomarker values transformed to probabilities based on a bimodal data distribution (normal vs. ab- normal) Scored events model Biomarkers transition from a normal score (e.g., value zero) to higher scores, reflecting an in- stantaneous switch between lev- els of disease sev erity Ordinal biomarker scores trans- formed to probabilities, where each biomarker v alue in each in- dividual is assigned a probability for each possible score Piecewise linear z -score model Biomarkers linearly increase from one z -score to another Biomarker values transformed to z -scores based on a Gaussian ref- erence distribution 2. METHODS 2.1. Mathematical Model for Mixed Data The Mix ed Ev ents model is a generalized disease progression model for mixed data that describes disease progression as a sequence of binary (normal to abnormal), ordinal and z -score ev ents. At each model stage, a biomarker transitions from one le vel to another ac- cording to the chosen model type for that biomarker . T o illustrate the dif ferent biomarker trajectories given a sequence, we visualized example trajectories in Figure 1, where z -scored biomarkers (red) follow a piece wise linear trajectory , and binary (green) and ordinal (yellow) biomark ers follow a step-wise trajectory . Fig. 1: Example biomarker trajectory . Z -scored biomarkers (red) reach abnormality at z -scores 1–3 and accumulate at z -max = 4. The ordinal biomarker (yellow) reaches abnormality at scores 1–3, while the binary biomark er (green) transitions once, resulting in ten e vents. The likelihood of the data given a sequence of biomarker ev ents, where each e vent represents a particular biomarker reaching a new lev el or score, can be described by P ( X j | S ) = K X k =0 P ( k ) I Y i =1 P ( x i,j | S, k , M ( i )) (1) where X j represents the vector of data points x i,j for biomarkers i = 1 ...I for each subject j = 1 ...J , S is the sequence of biomark er ev ents, k is the stage along the sequence S , and M ( i ) is the chosen model for biomarker i . The model M ( i ) can be binary ( B ), ordinal ( O ), or z -score ( Z ). The code is av ailable at: https://github .com/ ucl- pond/pySuStaIn. Binary (event-based) model likelihood The binary (event-based) model and the ordinal (scored events) model share the assumption that a biomarker transitions in discrete steps to reflect disease pro- gression. In the binary model [9], each biomarker shifts from a nor- mal to an abnormal value at a specific disease stage. If the ev ent has not yet occurred at a given stage k , the likelihood is giv en by p ( x |¬ E i ) , whereas if the ev ent has occurred, the likelihood is given by p ( x | E i ) . The probabilities for the normal distribution and the abnormal distribution are typically estimated using Gaussian mix- ture modeling [9, 10] or kernel density estimation [13], although any probability distribution can be used. The likelihood for the binary model ( B ), can be written as P ( x i,j | S, k , M ( i ) = B ) = ( P ( x i,j | E i ) for s ( i ) ≤ k P ( x i,j |¬ E i ) for s ( i ) > k (2) where s ( i ) describes the stage at which biomarker i becomes abnor- mal in the sequence S . Ordinal (scored-events) model likelihood In the ordinal (scored ev ents) model [11], ordinal biomarkers transition to a progressiv ely higher score. The probability that score w is reached by biomarker i at stage k can be modeled by any probability distrib ution defined by the user , e.g., a cate gorical distribution [11] or a Gaussian distribu- tion. The likelihood for the ordinal model ( O ) is formulated as P ( x i,j | S, k , M ( i ) = O ) = P ( x i,j | E s ( i,w ) ) (3) where s ( i, w ) describes the biomarker i and score w that are reached at stage k . The binary model can also be described in this form by setting the scores w to w = ( normal , abnormal ) , and so the ordinal model is a generalization of the binary model. Z-score (piecewise linear) model lik elihood In the z-score (piece- wise linear) model [3], the ordering of ev ents is described as the linear accumulation of biomarkers increasing from one z-score to another . The likelihood for z-scored ( Z ) biomarkers, is giv en by P ( x i,j | S, k , M ( i ) = Z ) = NormPDF ( x i,j , g s ( i,w ) ( k ) , σ i ) (4) where the input data x ij are provided as z -scores which need to be transformed to probabilities to compute the likelihood for a given sequence. The data value is compared to the point estimate of the piecewise linear trajectory for z -score z at stage k [14]. Originally , it was compared to the inte gral ov er the piecewise linear trajectory , but it was found that the point estimate, which is more efficient, sho wed similar results [3, 14]. The z -scores accumulate at z -max at stage k + 1 , both z -values and z -max are defined by the user . 2.2. Subtyping The previous sections described fitting a single disease progression trajectory . In SuStaIn, multiple subtypes C are fitted with distinct trajectories. The likelihood for Mixed-SuStaIn can be written as P ( X | S ) = J Y j =1 C X c =1 P ( c ) P ( X j | S c ) (5) with P ( X j | S c ) the Mixed Event likelihood function from Eq. 1. W e determined the optimal number of subtypes C with fiv e-fold cross- validation [3]. 2.3. Simulation Experiments W e ev aluated the stability of the proposed method under different simulation settings. Synthetic data for each input type were gener- ated using pre viously described methods ( z -scored: [3], ordinal: [11] and binary: [9]). Different configurations were tested, e valuating the number of subjects (250, 500 ⋆ , 1000), number of subtypes (1, 3 ⋆ , 5), number of biomarkers (2+1+1, 4+2+2 ⋆ , 6+3+3) ( z -scored + ordinal + binary biomarkers) and two settings for biomarkers v alues (ev ents) (1: [1,2,3] + [1,2,3] + [1] ⋆ , 2: [1,3,5] + [1,3,5] + [1]) ( z -score + ordi- nal + binary v alues). Default parameters ( ⋆ ) were used for the other variables. Each experiment was repeated ten times for different ran- domly chosen subtype progression patterns and simulated datasets. Performance was assessed using K endall’ s rank correlation. 2.4. Real-W orld Data V alidation For validation on real-world data, we used the Alzheimer’s Disease Neuroimaging Initiati ve (ADNI) database 1 . ADNI is an open-access database containing imaging, clinical, and biomarker data from sub- jects diagnosed with AD, mild cognitive impairment (MCI), and cognitiv ely normal (CN) individuals (reference group). Data The ADNIMERGE dataset was downloaded on Feb 3, 2025. W e included all participants with baseline 3T MRI and cerebrospinal 1 http://adni.loni.usc.edu, http://www .adni- info.org fluid (CSF) data, resulting in 641 subjects (209 CN, 341 MCI, 91 AD). Clinical diagnosis 24 months after baseline served as an out- come measure. T otal brain, ventricles, hippocampus, entorhinal cortex, middle temporal gyrus, and fusiform gyrus (extracted with FreeSurfer v5.1) were included as continuous biomarkers in the Mixed Events model. V olumes were z -scored using CN participants as the reference group and corrected for age and intracranial vol- ume, and log-transformed for ventricles. The z -values and z -max were derived from the data by defining the z -values as the set of integers up to the 95% quantile and z -max as the 99% quantile rounded to the nearest inte ger . The CSF measures amyloid- β 1 − 42 , phosphorylated tau (p-tau) and total tau (t-tau) were included as binary biomarkers in the model, as these measures exhibit relativ ely well-defined thresholds that separate normal from abnormal v alues. The CSF measures were log-transformed, follo wed by estimation of the probabilities belonging to the normal ( p ( x |¬ E i ) ) and abnormal ( p ( x | E i ) ) distribution with Gaussian mixture modeling [10]. Comparison Analysis W e benchmark ed the performance of Mix ed- SuStaIn against EBM-SuStaIn, which is the only pre viously- dev eloped disease progression model that can include both discrete and continuous biomarkers. EBM-SuStaIn achieves this by limiting the modeled trajectory shapes to normal and abnormal transitions and treating the input data as binary (B) events. For both methods, the same number of subtypes was used. T o compare methods, we first ev aluated predicti ve performance for subjects con verting from CN to MCI and from MCI to AD, using A UC-ROC. Baseline patient staging (Figure 4; also depicting con- verters by stage) was used to predict con version within 24 months. Additionally , we ev aluated the relationship between SuStaIn stage and cognition by correlating stage with Mini-Mental Stage Exami- nation (MMSE), stratified by subtype, using Pearson’ s correlation. 3. RESUL TS 3.1. Simulation Experiments Simulation experiment results are shown in Figure 2. All settings achiev ed a Kendall rank correlation in the range of 0.6-1, indicating that Mixed-SuStaIn was able to recov er the ground truth subtype patterns well. Increasing number of subtypes C , reduced the K endall rank correlation, as there are fe wer subjects per subtype. Decreasing number of biomarkers I also reduced the Kendall rank correlation, which may be explained by the fact that subtype trajectories are more strongly defined and separated by larger number of biomark ers. J=250 *J=500 J=1000 C=1 *C=3 C=5 I=2-1-1 *I=4-2-2 I=6-3-3 *V=1 V=2 0.0 0.2 0.4 0.6 0.8 1.0 Kendall Rank Correlation Fig. 2: Accuracy of Mixed-SuStaIn in recovering the ground truth subtype patterns on synthetic data. Error bars indicate standard de vi- ation. Experiments settings: number of subjects ( J , green), subtypes ( C , purple), biomarkers ( I , yellow) and values ( V , red). ⋆ indicates default v alues. 3.2. Real-W orld Data V alidation Study subject demographics and input biomarker characteristics are summarized in T able 2. Brain regions were modeled with the fol- lowing z -score ranges ( z -max in parentheses): hippocampus, 1–4 (5); entorhinal cortex, 1–3 (5); total brain, middle temporal gyrus and fusiform, 1–2 (4); and ventricles, 1-2 (3). The optimal num- ber of subtypes was identified as two. The disease progression pat- terns for the subtypes are shown in Figure 3. Subtype 1 (n=352) followed a typical AD progression, with amyloid- β 1 – 42 , p-tau, and t-tau becoming abnormal first. Subtype 2 (n=289) was character- ized by early atroph y in the hippocampus, total brain, and entorhinal cortex, followed by amyloid- β 1 - 42 and late tau pathology . This sub- type appears to capture subjects who deviate from the typical AD progression pattern seen in subtype 1. A similar ’cortical subtype’ was reported by Estarellas et al. [15]. The subject staging for both subtypes shows that CN and MCI subjects were generally assigned lower disease stages than AD patients (Figure 4). Conv erters (within 24 months) were proportionally assigned higher stages, indicating a correspondence between disease stage and clinical progression. T able 2: Baseline demographics, likelihood of belonging to the ab- normal distribution, and re gional brain z -socres for included subjects grouped by diagnostic category: cogniti vely normal (CN), mild cog- nitiv e impairment (MCI), and Alzheimer’ s disease (AD). Characteristic CN (n=209) MCI (n=341) AD (n=91) Demographics Female sex (%) 54.2 44.7 42.1 Age (years), µ ± SD 72.8 ± 5.8 71.2 ± 7.2 73.8 ± 8.5 Likelihood, µ ± SD Amyloid- β 1 – 42 0.28 ± 0.35 0.47 ± 0.38 0.81 ± 0.26 T otal tau 0.12 ± 0.19 0.19 ± 0.27 0.43 ± 0.31 Phosphorylated tau 0.25 ± 0.27 0.35 ± 0.34 0.68 ± 0.30 Z-scor es, µ ± SD T otal Brain 0.0 ± 1.0 0.32 ± 1.11 1.34 ± 1.15 V entricles 0.0 ± 1.0 0.30 ± 1.11 0.83 ± 1.10 Hippocampus 0.0 ± 1.0 0.94 ± 1.45 2.40 ± 1.11 Middle temporal gyrus 0.0 ± 1.0 0.30 ± 1.10 1.60 ± 1.17 Entorhinal cortex 0.0 ± 1.0 0.58 ± 1.33 1.98 ± 1.19 Fusiform 0.0 ± 1.0 0.27 ± 1.09 1.27 ± 0.97 The disease progression patterns identified by EBM-SuStaIn are described belo w . For the two subtypes, subtype one (n=458) showed typical AD progression, with the following ordering of events: amyloid- β 1 − 42 , p-tau and t-tau, hippocampus, entorhinal cortex, middle temporal gyrus, fusiform, total brain and v entricles. The sec- ond subtype (n=183) follo wed the ordering: hippocampus, entorhi- nal cortex, amyloid- β 1 − 42 , ventricles / total brain (same position), middle temporal gyrus, fusiform and lastly , p-tau and total-tau. In CN subjects, 158 remained stable within 24 months and 16 con verted to MCI. In MCI subjects at baseline, 209 remained stable and 52 con verted to AD. In prediction of con version from CN to MCI, Mixed-SuStaIn achieved an A UC of 0.724 compared to 0.723 for EBM-SuStaIn. For con version from MCI to AD, Mix ed-SuStaIn achiev ed an A UC of 0.828 compared to 0.825 for EBM-SuStaIn. Overall, both methods had a similar performance in the prediction tasks. For subtype 1, the correlation between SuStaIn stage and cog- nition was r = -0.69 for Mixed-SuStaIn and r = -0.63 for EBM- SuStaIn. For subtype 2, the correlations were r = -0.43 (Mixed- SuStaIn) and r = -0.41 (EBM-SuStaIn). In both models, the cor- relation was stronger in subtype 1, which reflects the dominant AD atrophy pattern, and weaker in subtype 2. Overall, the correlations were similar . Amy loi d - 𝛽 1 − 42 Stage 1 Stage 5 Stage 9 Stage 13 Stage 17 hi ppoca m pus m i ddl e - t em por al g y r us ent or hi nal cor t ex f usi f or m 0 1 2 3 4 Stage 1 Sta ge 5 Stage 9 Stage 13 Stage 17 Bin ary ev en t Sub type 1 Sub type 2 P hosphory late d tau T otal tau v ent r i cl es to t al br ai n Fig. 3: Disease progression patterns of subtype 1 (n=458) and subtype 2 (n=183) identified by Mixed-SuStaIn. The top ro ws sho w cortical regions becoming increasingly abnormal (higher z -scores) across disease stages. The “total brain” biomark er reflects global brain change, but is visualized only on cortical areas for clarity . Bottom rows depict binary progression of cerebrospinal fluid biomarkers. 1 2 3 4 5 6 7 8 9 10 1 1 12 13 14 15 16 17 Stages 0.0 0.1 0.2 0.3 0.4 0.5 0.6 Proportion CN MCI AD Converters (a) subtype 1 1 2 3 4 5 6 7 8 9 10 1 1 12 13 14 15 16 17 Stages 0.0 0.1 0.2 0.3 Proportion CN MCI AD Converters (b) subtype 2 Fig. 4: The probability that subjects from each diagnostic cate- gory , including the proportion of con verters, belong to each Mixed- SuStaIn stage for subtype 1 (a) and subtype 2 (b). Conv erters in the CN bars represent CN-to-MCI con version, con verters in the MCI bars represent MCI-to-AD con version. AD=Alzheimer’ s Disease, CN=cognitiv ely normal, MCI=mild cognitiv e impairment. 4. CONCLUSION In this paper , we introduced the Mixed Events model, a novel disease progression model that integrates z -score, ordinal and binary mod- els into a single objectiv e for estimating ev ent orderings in mixed datasets. Embedded within SuStaIn, the model successfully recov- ered meaningful ev ent orderings across mixed data types in real- world ADNI data. Mixed-SuStaIn demonstrated equal predictiv e performance and also showed similar correlations to cognition to the benchmark method. The ke y added value of the proposed approach, howe ver , is the increased modeling flexibility for mixed datasets, for which no current alternativ e exists. In the comparison analysis, we only included biomarkers compatible with both models to enable a direct comparison, necessarily excluding ordinal biomarkers. This may ha ve limited performance gains. In future work, we will apply Mixed-SuStaIn to heterogeneous, population-based data, including a broader range of biomarkers, to further ev aluate its generalizability and demonstrate its ability to uncov er progression patterns beyond the scope of single data-type models. 5. REFERENCES [1] A. L. Y oung et al. , “Data-driven modelling of neurodegenerativ e dis- ease progression: thinking outside the black box, ” Nat Rev Neurosci , vol. 25, pp. 111–130, 2024. [2] H. Y oshioka et al. , “Disease progression modeling with temporal re- alignment: An emerging approach to deepen knowledge on chronic diseases, ” Pharmacol Ther , vol. 259, p. 108655, 2024. [3] A. L. Y oung et al. , “Uncovering the heterogeneity and temporal com- plexity of neurodegenerati ve diseases with Subtype and Stage Infer- ence, ” Nat Commun , vol. 9, p. 4273, 2018. [4] J. W . V ogel et al. , “Four distinct trajectories of tau deposition identified in Alzheimer’ s disease, ” Nat Med , vol. 27, pp. 871–881, 2021. [5] G. Salvad ´ o et al. , “Disease staging of Alzheimer’ s disease using a CSF- based biomarker model, ” Nat Aging , pp. 1–15, 2024. [6] V . V enkatraghavan et al. , “Disease progression timeline estimation for Alzheimer’ s disease using discriminative e vent based modeling, ” Neu- r oImage , v ol. 186, pp. 518–532, 2019. [7] V . V enkatraghavan et al. , “ A large-scale multi-centre study character- ising atrophy heterogeneity in Alzheimer’ s disease, ” NeuroImag e , vol. 318, p. 121381, 2025. [8] I. Kov al et al. , “AD Course Map charts Alzheimer’ s disease progres- sion, ” Sci Rep , vol. 11, p. 8020, 2021. [9] H. M. Fonteijn et al. , “ An event-based model for disease progression and its application in familial Alzheimer’ s disease and Huntington’ s disease, ” Neur oImage , vol. 60, pp. 1880–1889, 2012. [10] A. L. Y oung et al. , “A data-driv en model of biomarker changes in spo- radic Alzheimer’ s disease, ” Brain , v ol. 137, pp. 2564–2577, 2014. [11] A. L. Y oung et al. , “Ordinal SuStaIn: Subtype and Stage Inference for clinical scores, visual ratings, and other ordinal data, ” F ront Artif Intell , vol. 4, 2021. [12] P .-E. Poulet and S. Durrleman, “Multiv ariate disease progression mod- eling with longitudinal ordinal data, ” Stat Med , vol. 42, pp. 3164–3183, 2023. [13] N. C. Firth et al. , “Sequences of cognitiv e decline in typical Alzheimer’ s disease and posterior cortical atrophy estimated using a novel event-based model of disease progression, ” Alzheimers Dement , vol. 16, pp. 965–973, 2020. [14] L. M. Aksman et al. , “pySuStaIn: A Python implementation of the Subtype and Stage Inference algorithm, ” SoftwareX , vol. 16, p. 100811, 2021. [15] M. Estarellas et al. , “Multimodal subtypes identified in Alzheimer’ s Disease Neuroimaging Initiati ve participants by missing-data-enabled subtype and stage inference, ” Brain Commun , v ol. 6, p. fcae219, Aug. 2024.
Original Paper
Loading high-quality paper...
Comments & Academic Discussion
Loading comments...
Leave a Comment