Spatial Degrees of Freedom in Near Field MIMO: Experimental Validation of Beamspace Perspective
Conventional far-field multiple-input multiple-output (MIMO) channels are limited to a single spatial degree of freedom (DoF) under a line-of-sight (LoS) condition. In contrast, the radiative near field (NF) supports multiple spatial DoF, enabled by …
Authors: Ahmed Hussain, Asmaa Abdallah, Ahmed Nasser
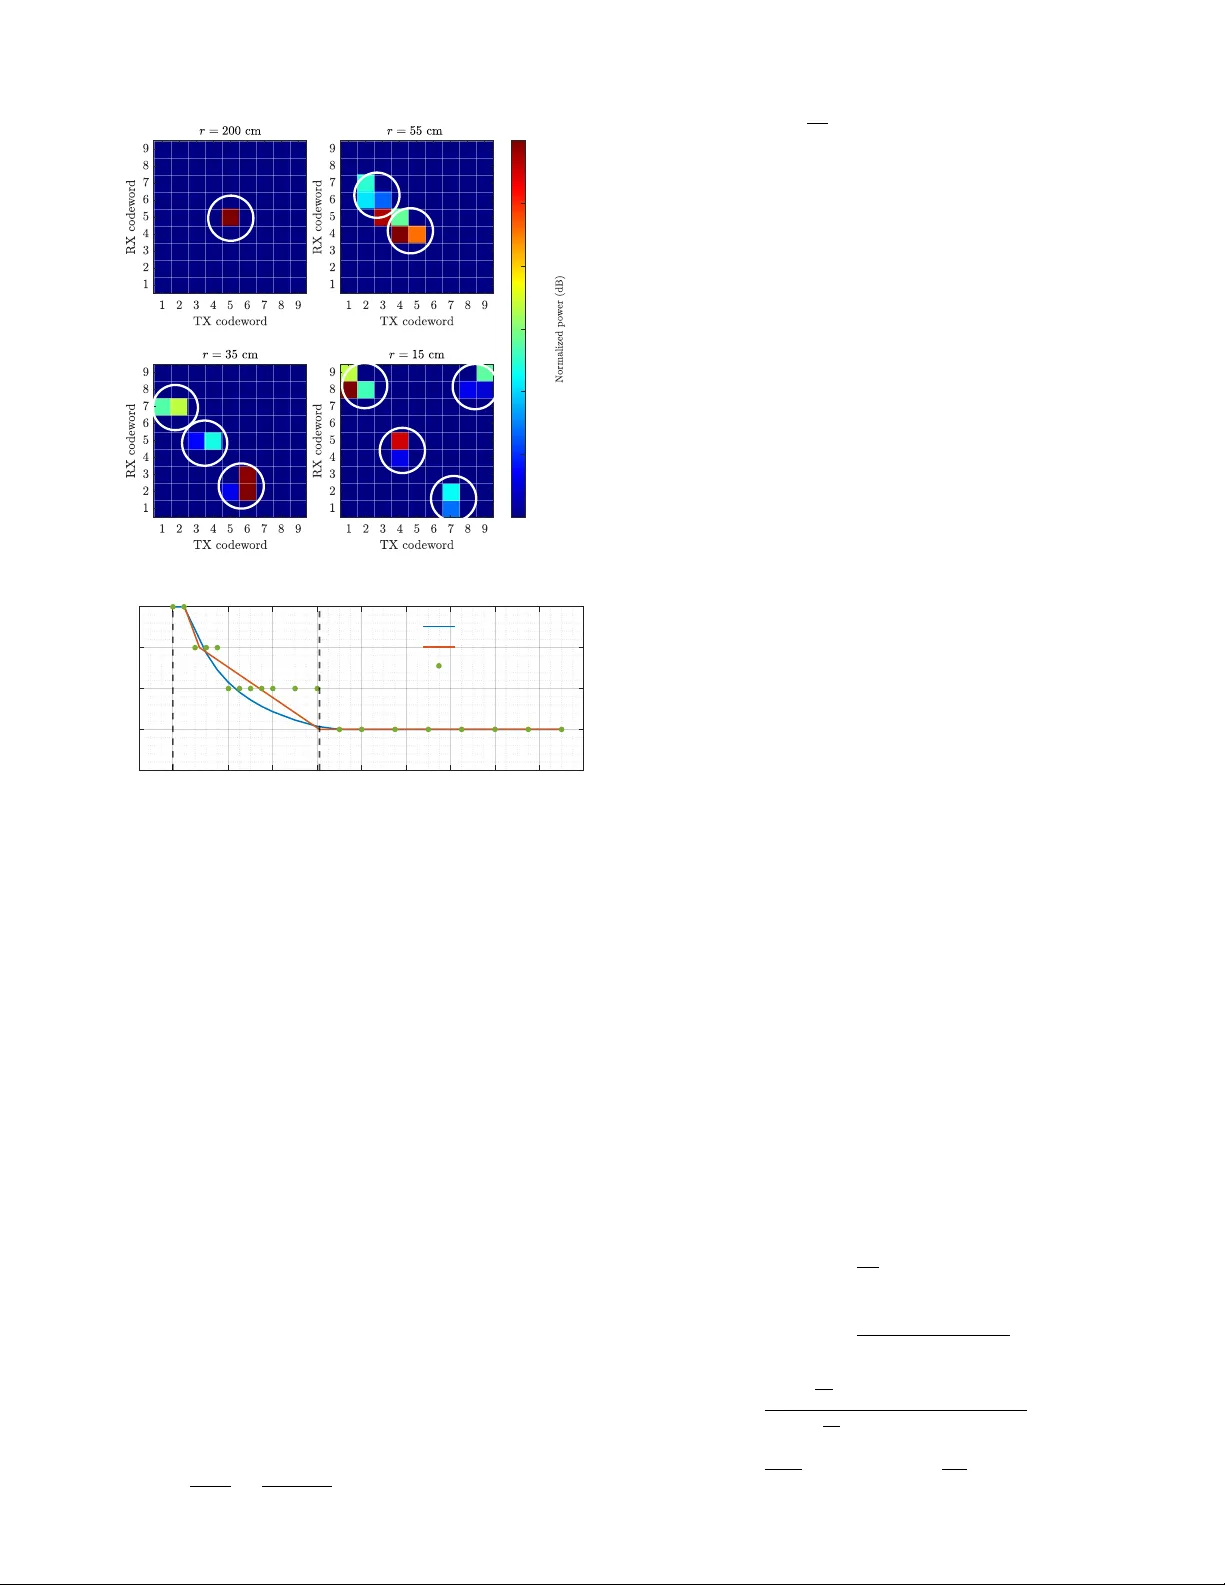
1 Spatial De grees of Freedom in Near Field MIMO: Experimental V alidation of Beamspace Perspecti v e Ahmed Hussain, Asmaa Abdallah, Senior Member , IEEE , Ahmed Nasser , Senior Member , IEEE , Abdulkadir Celik, Senior Member , IEEE , and Ahmed M. Eltawil, Senior Member , IEEE Abstract —Con ventional far -field multiple-input multiple-output (MIMO) channels are limited to a single spatial degr ee of freedom (DoF) under a line-of-sight (LoS) condition. In contrast, the radiative near field (NF) supports multiple spatial DoF , enabled by spherical wav efronts and the reduced spatial f ootprint at short ranges. While recent research indicates that the effective DoF (EDoF) increases in NF , experimental validation and clear identification of the transition distances remain limited. In this letter , we develop an intuitiv e framework for characterizing the EDoF of a ULA-based MIMO system and derive tw o complementary analytical expressions: a closed-form formulation that relates the EDoF to the physical transmit beamwidth and recei ve aperture, and a discrete formulation based on the discrete Fourier transform (DFT) domain angular decomposition of the NF spherical wavefr ont, which is well suited for experimental evaluation. W e further introduce the effective MIMO Rayleigh distance (EMRD) and the maximum spatial multiplexing distance (MSMD), which mark the distances where the EDoF reduces to one and attains its maximum, respecti vely . Experimental measurements using widely spaced phased arrays closely match the theoretical EDoF trends and validate the proposed distance metrics. Index T erms —Near field, spatial degrees of freedom, MIMO, DFT , and effective MIMO Rayleigh distance. I . I N T R O D U C T I O N F UTURE wireless networks employing large antenna arrays at high frequencies are expected to operate in the radiative near-field ( NF ), where spherical wavefronts enhance both single-user and multi-user capacity [ 1 ]. In the NF , the finite beamdepth enables spatial separation of user equipments ( UE s) along the range dimension, thereby improving multiuser capacity [ 2 ]. In the far-field ( FF ), a line-of-sight ( LoS ) multiple- input multiple-output ( MIMO ) channel is typically rank one, supporting only a single data stream. In contrast, the radiativ e NF , with its inherent spherical wavefronts, offers enriched spatial degrees of freedom ( DoF ) [ 3 ], enabling multiple data streams even in LoS case. Spatial DoF represent the parallel communication modes determined by the propagation environment and array geom- etry [ 4 ]. While the array geometry imposes an upper bound on the achie vable DoF , the usable DoF are limited by the minimum of the transmit and recei ve antenna counts. The spatial DoF also vary with the angular extent of the radiated Ahmed Hussain, Asmaa Abdallah, Ahmed Nasser, and Ahmed M. Eltawil are with the Computer, Electrical, and Mathematical Sciences and Engineering (CEMSE) Division, King Abdullah Univ ersity of Science and T echnology (KA UST), Thuwal 23955-6900, Saudi Arabia. Abdulkadir Celik is with School of Electronics and Computer Science, University of Southampton, SO17 1BJ UK. BS N F U E FF UE DFT Beams Multiple DoF Single DoF range angle Spatial footprint (cross range resolution) Beamwidth remains same in NF or FF . However , the spatial footprint (cross-range resolution) improves in the NF due to the shorter distances. Fig. 1: Multiple EDoF in NF communication. field, set by the transmit beamwidth, and the physical size of the receiving aperture. Although the angular beamwidth is in v ariant with distance, the spatial footprint expands linearly with range as shown in Fig. 1 (left). Consequently , capturing multiple angular beams in the FF requires prohibitively large receiv e apertures; for instance, spatial footprint corresponding to a beamwidth of 3 ◦ spans 0 . 52 m at a distance of 10 m , but expands to 52 m at 1 km . Furthermore, beamfocusing-based NF beams inherently comprise multiple angular components due to the spherical wa vefront being a superposition of plane wa ves [ 1 ]. As illustrated in Fig. 1 (right), the reduced spatial footprint and inherent curvature of spherical wav efronts in the NF may potentially unlock higher spatial DoF. The spatial DoF are quantified through the singular values of the MIMO channel, which typically exhibit a step-like distribution, indicating that the corresponding subchannels are not of equal quality [ 5 ]. Only the singular values exceeding a certain threshold ef fectiv ely contribute to capacity , gi ving rise to the concept of ef fectiv e degrees of freedom ( EDoF ). In the NF , higher EDoF can be achieved either by enlarging the aperture or by increasing the carrier frequency . The latter, ho we ver , introduces severe cov erage limitations, whereas expanding the aperture requires a very lar ge number of antennas, leading to prohibitive hardware and signal-processing complexity . Although theory suggests that the EDoF effecti vely reduces to one in the FF and increases in the NF [ 4 ], experimental validation remains limited. Moreov er , the exact distance at which the EDoF first exceeds one, and the distance at which it reaches its maximum, has not been clearly established. T o address these gaps, we dev elop an intuitive framew ork for characterizing the EDoF and validate it through experimental measurements. Specifically , we deriv e two complementary ana- lytical expressions for the EDoF in uniform linear array ( ULA )- based MIMO systems. The first is a closed-form expression that relates the EDoF to the physical transmit beamwidth and receiv e aperture, providing insight into its distance-dependent 2 behavior . The second is a discrete formulation based on discrete Fourier transform ( DFT ), which captures the angular decomposition of the spherical wa vefront. W e further introduce the effecti ve MIMO Rayleigh distance ( EMRD ), defined as the distance at which the EDoF reduces to one, and the maximum spatial multiplexing distance ( MSMD ), which denotes the distance at which the maximum EDoF is attained. Experimental measurements closely follow the theoretical analysis and validate the proposed distance metrics. I I . S Y S T E M M O D E L W e consider a point-to-point LoS MIMO system, as illus- trated in Fig. 2 . The base station ( BS ) and UE are equipped with ULA s comprising M transmit and N receiv e antennas, respectiv ely . The inter-element spacing is set to d = λ/ 2 , yielding approximate aperture lengths of D t ≈ M d at the BS and D r ≈ N d at the UE . The UE is located at a distance r from the BS . The ULA s at the BS and UE are oriented at angles φ t and φ r , respectively , with respect to their local coordinate systems. The channel coef ficient of the MIMO channel H ∈ C M × N between the m th transmit and n th recei ve antenna elements is giv en by h m,n = √ g m,n e − j 2 π λ ( r m,n − r ) , (1) where g m,n = λ 2 (4 π ) 2 ( r m,n ) 2 , denotes the free-space pathloss and r m,n denote the distance between the m th transmit and n th receiv e elements, approximated as r m,n = q r + md sin φ t − nd sin φ r 2 + md cos φ t − nd cos φ r 2 , ≈ r + md sin φ t − nd sin φ r + md cos φ t − nd cos φ r 2 2 r . (2) Giv en a MIMO channel H ∈ C M × N , the spatial DoF represent the number of independent sub-channels that support parallel transmission modes. Mathematically , this corresponds to the number of non-zero singular values obtained from the singular value decomposition ( SVD ) of H , or equiv alently , the rank of the Gramian matrix R = H H H . While the channel rank determines the potential number of parallel streams, the actual channel capacity also depends on the distribution of eigen values. Hence, the EDoF is often used to quantify the number of effecti ve parallel channels at high signal-to-noise ratio ( SNR ). The eigen values µ i exhibit step-like behavior , remaining approximately equal up to a certain index EDoF , beyond which they decay sharply to zero. Assuming EDoF equal eigen v alues ( µ 1 = µ 2 = · · · = µ EDoF = µ ) , the sum of all eigen values equals the trace of the Gramian P min( M ,N ) i =1 µ i = tr( HH H ) = M N . Thus, with only EDoF non-zero eigenv alues, we hav e EDoF µ = M N ⇒ µ = M N EDoF . (3) Diagonalizing H yields EDoF parallel channels, each with an equal gain µ . W ith equal eigen values, the optimal po wer allocation is uniform, i.e., P i = P / EDoF , leading to the single- user capacity expression as C = EDoF X i =1 log 2 1 + P i µ σ 2 = EDoF log 2 1 + P µ EDoF σ 2 , (4) C = EDoF log 2 1 + ρ EDoF 2 , ρ = P M N σ 2 , (5) Fig. 2: A MIMO system model with ULA at the BS and UE. The final simplified form is obtained by substituting µ from ( 3 ) , and σ 2 denotes the noise power . At high SNR, the capacity scales approximately as C ≈ EDoF log 2 ( ρ/ EDoF 2 ) , increasing almost linearly with EDoF . I I I . E FF E C T I V E S PA T I A L D E G R E E S O F F R E E D O M As illustrated in Fig. 1 , the reduced spatial footprint and the spherical wav efronts in the NF enable higher spatial DoF . In this section, we derive two complementary analytical expres- sions for the EDoF . The first is a closed-form expression based on the physical beamwidth, which varies continuously with distance and provides theoretical insight into the spatial scaling behavior . The second is based on an angular decomposition of the spherical wav efront, leading to a discrete formulation that is more suitable for experimental evaluation. A. Electr omagnetic P erspective The spatial DoF denote the number of linearly independent columns in the channel matrix H , whereas the EDoF represent the subset of mutually orthogonal columns. From an electromag- netic standpoint, the EDoF represents the number of transmit beams that remain distinguishable at the receiver . It can be approximated as the ratio between the receiv e aperture length D r and the spatial footprint of the transmit beam [ 5 ]. This ratio indicates how many transmit beams illuminate the receiv er aperture with minimal mutual interference. The spatial footprint referred to as the cross-range resolution ∆ CR is determined by the transmit beamwidth θ 3 dB . For a ULA with transmit aperture D t , the cross-range resolution and beamwidth are ∆ CR = r θ 3 dB and θ 3 dB ≈ λ D t cos φ t , (6) respectiv ely , leading to the following closed-form expression for the EDoF: EDoF 1 ≈ D r cos φ r ∆ CR = D r D t λr cos φ t cos φ r . (7) Although the angular beamwidth θ 3 dB remains in variant across the NF and FF , the cross-range resolution ∆ CR improv es as the transmitter–recei ver separation r decreases. As a result, the NF yields a higher EDoF due to its finer cross-range discrimination. Beyond the reduced spatial footprint, spherical wav e propa- gation further enhances the EDoF . Unlike planar wa vefronts, which induce a linear phase profile across the array and support a single dominant spatial mode, spherical wa vefronts introduce phase curvature across the aperture, thereby exciting multiple orthogonal spatial modes. In the following section, we present a DFT -based decomposition of NF beams to analyze the resulting EDoF. 3 0.05 r RD ra n g e 0.02 r RD 0.01 r RD 0 : 14 r RD r RD -40 : = 2 -30 -20 gain [dB] a n g l e 0 -10 0 - : = 2 Fig. 3: Angular spread (EDoF) at different ranges. - : = 2 - : = 3 - : = 6 0 : = 6 : = 3 : = 2 angle : 14 r RD : 13 r RD : 11 r RD .10 r RD .08 r RD .07 r RD .05 r RD .04 r RD .02 r RD 2 D t ra ng e 12 27 11 18 12 26 1 1 1 1 1 1 1 1 1 1 1 1 1 1 1 1 1 1 3 5 1 1 1 3 3 3 4 6 1 3 3 3 3 5 7 57 1 1 1 2 3 3 4 6 1 1 1 1 1 1 1 1 3 5 1 1 1 1 1 1 1 1 1 1 10 20 30 40 50 EDoF Fig. 4: EDoF for the transmitter at different ranges and angles. W e set M = 256 , f c = 29 GHz , D t = 1 . 3 m , r RD = 336 m . B. Repr esentation of NF Signal Using DFT Beams A BS equipped with M antennas can transmit up to M spatially orthogonal beams, each associated with a discrete angular direction sin( θ m ) ∈ [ − 1 , 1] , represented by the columns of a DFT codebook. For a FF UE , the correlation a H ( θ ) a ( θ m ) is maximized only when the user’ s direction θ matches θ m , and ideally becomes negligible for all θ m = θ . In the NF , howe ver , a UE exhibits non-negligible correlation with multiple adjacent DFT beams, re vealing the presence of additional spatial DoF . This behavior arises because far - field propagation is gov erned by planar wav efronts, whereas near-field propagation results in spherical wavefronts that can be expressed as a superposition of multiple angular (planar) components. Motiv ated by this observation, we model a NF beam as a weighted combination of DFT beams. The number of DFT beams with high gain reflects the av ailable spatial DoF. The EDoF of a MIMO system may also be interpreted as the number of transmit beams that can be uniquely mapped to distinct receive beams. The number of such unique pairs is upper bounded by the smaller of the numbers of transmit and receiv e beams. In principle, one could decompose the beams at both the transmitter and receiver to explicitly count these unique beam pairs. Howe ver , identifying the number of unique pairs is a complex task. T o simplify the analysis, we project only the transmit-side NF channel onto the angular domain using the DFT . The number of DFT beams e xhibiting high gain in this domain provides an estimate of the transmit-side EDoF . The overall MIMO EDoF is then computed by scaling this transmit-side estimate with the effecti ve aperture length D r at the receiv er . W e consider a NF transmit beam focused at the location ( θ , r ) . The NF array response vector approximated based on Fresnel approximation is [ 2 ] b m ( θ , r ) ≈ 1 √ M e − j 2 π λ md sin( θ ) − m 2 d 2 cos 2 ( θ ) 2 r , (8) while the FF steering vector is obtained by omitting the quadratic phase term as a m ( θ ) ≈ 1 √ M e − j 2 π λ md sin( θ ) . (9) In the following, we deriv e the DFT coef ficients corresponding to the transmit-side NF array response vector in ( 8 ) . The resulting gain G observed at the NF UE from each DFT beam directed toward θ m is expressed as G ( θ, r ; θ m ) = b H ( θ , r ) a ( θ m ) 2 , sin( θ m ) ∈ [ − 1 , 1] ≈ 1 M 2 M / 2 X − M / 2 e j 2 π λ { md sin( θ ) − 1 2 r m 2 d 2 cos 2 ( θ ) }− j 2 πmd sin θ m λ 2 , ( c 1 ) = 1 M 2 M X − M / 2 e − j π { m 2 ( d cos 2 θ 2 r ) − m (sin θ − sin θ m ) } 2 , (10) where ( c 1 ) is simplified assuming d = λ/ 2 . W e further simplify the array gain function in ( 10 ) in terms of Fresnel functions C ( · ) and S ( · ) , whose arguments depend on the UE location ( θ , r ) and DFT beam angle θ m . Accordingly , the gain function observed at the NF UE under illumination from orthogonal DFT beams can be approximated as [ 6 ] G ( θ , r ; θ m ) ≈ C ( γ 1 , γ 2 ) + j S ( γ 1 , γ 2 ) 2 γ 2 2 , (11) C ( γ 1 , γ 2 ) ≡ C ( γ 1 + γ 2 ) − C ( γ 1 − γ 2 ) and S ( γ 1 , γ 2 ) ≡ S ( γ 1 + γ 2 ) − S ( γ 1 − γ 2 ) , where γ 1 = p r d cos 2 θ (sin θ m − sin θ ) and γ 2 = M 2 q d cos 2 θ r . T o characterize the EDoF , we adopt the 3 dB threshold criterion. W e count the angular directions θ m with the normalized gain abov e 0 . 5 and term it as the EDoF for the transmitter giv en by EDoF 2 ( θ , r ) = X m 1 G ( θ , r ; θ m ) ≥ 1 2 . (12) where 1 ( · ) denotes the indicator function. W e use the above expression to ev aluate the EDoF in our measurements. T o gain further insight, we plot the gain in ( 11 ) across dif ferent ranges, as illustrated in Fig. 3 . At the Rayleigh distance for multiple-input single-output ( MISO ) given by r RD = 2 D 2 t λ , which represents the classical boundary between the NF and FF regions, ( 11 ) yields a single peak v alue for G . In contrast, at shorter ranges, multiple peaks emerge around the UE angle forming an angular spread, indicating an increased EDoF . It is important to highlight that Fig. 3 can also be obtained by applying the FFT to the NF channel in ( 8 ) and plotting the resulting spectrum. Fig. 4 presents the EDoF computed via ( 12 ) at various range and angle values. The maximum EDoF is achieved at the boresight direction and at a range equal to 2 D t , where it reaches a value of 57 . This maximum EDoF is significantly smaller than the total number of antenna elements, which is M = 256 . Moreo ver , the minimum EDoF of 1 is observed for r < r RD cos 2 θ 7 [ 2 ], which corresponds to the beam- focusing limit of a ULA . This limit is se ven times smaller than the Rayleigh distance at boresight. Additionally , for a fixed range, the EDoF attains its maximum at boresight and 4 gradually decrease toward the endfire directions. The EDoF in ( 12 ) represents the spatial DoF s of fered solely by the transmit aperture, without accounting for the receiv er . In a point-to-point MIMO system, the net EDoF is additionally influenced by the receiv e aperture. T o incorporate the receiv e aperture length D r , we combine ( 7 ) and ( 12 ) to obtain the following scaled distance: ˆ r = D r D t λ EDoF 2 cos φ t cos φ r . (13) In recent studies, the Rayleigh distance for MIMO systems has been defined based on the maximum allow able phase error (typically π 8 ) across the antenna aperture when approximating a spherical wa ve as a planar wav e. Howe ver , this definition does not directly capture the system’ s ability to support independent spatial streams. As a result, the conv entional Rayleigh distance does not reliably separate NF and FF regions. T o address this limitation, we propose an alternativ e metric EMRD that defines NF boundaries in terms of EDoF . Specifically , we define the EMRD , denoted by r EMRD , as the distance at which the EDoF drops to one in a MIMO system. By setting EDoF 2 = 1 in ( 13 ), this metric can be expressed as r EMRD = D r D t λ cos φ t cos φ r . (14) It is also desirable to deriv e a closed-form expression for the distance at which the spatial multiplexing is maximized, i.e., when the EDoF attains its lar gest v alue. W e refer to this distance as MSMD . This metric is obtained by replacing EDoF 2 in ( 13 ) with V = max { M , N } , yielding r MSMD = D r D t λ V cos φ t cos φ r , V = max { M , N } (15) = D r 2 cos φ t cos φ r , M > N , (16) where ( 16 ) follows by assuming M > N , substituting the aperture length D t ≈ M d , and applying the half-wa velength spacing condition d = λ/ 2 into ( 15 ) . Furthermore, ( 16 ) can also be deri ved by computing the inner product between the columns of H and enforcing orthogonality . Please refer to Appendix A for the deriv ation, which is inspired by [ 7 ]. I V . E X P E R I M E N TA L S E T U P A N D R E S U LT S In this section, we describe the experimental setup shown in Fig. 5 and compare the measured results with the theoretical EDoF to validate the analysis. The corresponding experimental parameters are summarized in T able I . A. Measur ement Equipment and Configuration 1) BS: W e employ the EVK02004 phased-array , which incorporates a 4 × 4 uniform square array ( USA ) of integrated patch elements. It features an in-built up/down-con version stage that accepts intermediate ( IF ) signals in the FR1 band and upcon verts them to the 24 – 29 . 5 GHz millimeter wa ve ( mmW ave ) band. It supports two-dimensional electronic beam steering over ± 40 ◦ in both azimuth and elev ation, with a beamwidth of 20 ◦ in each dimension. In our experimental setup, we steer beams only along the azimuth axis and model the USA as a ULA . W e integrate three phased arrays to extend the NF communication distance. The aperture length of a single USB Hub CCU Host PC USRP B200 Signal Generator UE BS Data RF IF IF TX Codewords RX Codewords r Fig. 5: Experimental setup for measuring the EDoF in the NF region. T ABLE I: Experimental Parameters Parameter V alue Parameter V alue Carrier Frequency 29 GHz IF Frequency 5 GHz T ransmit Aperture ( D t ) 2.75 cm Receive Aperture ( D r ) 30 cm Beamwidth ( θ 3 dB ) 20 ◦ Tx/Rx codewords 9 array along azimuth is 2 . 75 cm , and it increases to D r = 30 cm for the integrated array configuration. The radio frequency ( RF ) outputs of the three arrays are combined using an RF power combiner and subsequently fed into the recei ver port of a USRP B200. 2) UE: The UE is equipped with a single EVK02004 phased-array module, which serves as the transmitter . A signal generator supplies a IF tone at 5 GHz to the module, which then upcon verts the signal to carrier frequency of f c = 29 GHz. 3) Central Contr ol Unit (CCU): W e interface with the EVK modules using two separate host computers, each connected to its corresponding EVK unit via a USB. The host computer on the UE side functions as the central control unit ( CCU ) and communicates with the main host PC via wireless TCP/IP and Bluetooth links. The CCU serves as the central controller of the testbed, coordinating all hardware components, managing control signaling, and ensuring system-wide synchronization and signal processing. 4) DFT Codebook: Each antenna element of the phased array is equipped with a 2-bit phase shifter , enabling dynamic control of the beam pattern. Both the BS and UE are configured with identical DFT codebooks that scan the azimuth angle from − 40 ◦ to 40 ◦ in steps of 10 ◦ . Since the beamwidth is 20 ◦ , this results in an oversampled DFT codebook consisting of nine code words. The UE sequentially transmits nine beams for each receiv e codeword at the BS . For every Tx–Rx beam pair , we record the receiv ed signal strength indicator ( RSSI ) using the USRP and forward the measurements to the host computer . B. Results W e align the BS and UE along the boresight direction ( φ t = φ r = 0 ◦ ) and v ary the separation distance r from 200 cm do wn to 15 cm. Fig. 6 presents the RSSI heatmaps for selected distance values. For each Rx codew ord, the Tx sequentially scans all nine Rx codewords before switching to the next Tx code word. Repeating this ov er all nine Tx codew ords produces a 9 × 9 RSSI matrix for every measured distance. The receiv ed 5 -3 -2.5 -2 -1.5 -1 -0.5 0 Fig. 6: Heatmap of the RSSI matrix for selected range values. Propagati on di stance [m] 0.15 0.40 0.60 0.80 1.00 1.20 1.40 1.60 1.80 2.00 EDoF 1 2 3 4 r EMR D r M SMD Theoretical EDoF 1 Theoretical EDoF 2 Measured EDoF Fig. 7: Comparison of theoretical and experimental EDoF. po wer v alues are then normalized and clipped to a 3 dB dynamic range, consistent with ( 12 ) . At r = 200 cm , a single dominant peak appears, indicating an EDoF of one. As the distance decreases, multiple peaks progressively emerge in the RSSI maps, revealing the onset of NF effects. For example, at r = 55 cm , the Tx code words span four bins (bins 2 – 5 ) and the Rx code words span four bins (bins 4 – 7 ). Since the DFT codebook is ov ersampled by a factor of two, these peaks form two clear clusters, corresponding to an EDoF of two. At r = 35 cm , three clusters are observed, while at r = 15 cm , four clusters appear , yielding EDoF s of three and four , respectively . Furthermore, the inter-cluster separation increases as r decreases, indicating reduced overlap and stronger orthogonality . Based on these measurements, we design heuristic rules to estimate the EDoF directly from the raw RSSI matrices. Peak locations are first extracted using a 3 dB threshold. Clusters are then formed using two criteria: (i) peaks in the same row or column are grouped together , and (ii) peaks separated by only a single ro w or column are mer ged into one cluster . Each cluster is subsequently represented by the rounded centroid of its peak coordinates, and the EDoF is obtained as the number of resulting clusters. W e plot the resulting EDoF obtained from measurements as a function of distance in Fig. 7 . These results are compared against the theoretical expressions derived in Section III . For the giv en aperture sizes D t and D r , the EMRD based on ( 14 ) is r EMRD = D t D r λ = 0 . 30 × 0 . 02 0 . 0075 = 0 . 81 m . Similarly , the MSMD from ( 16 ) is r MSMD = D r 2 = 0 . 15 m . As shown in Fig. 7 , the measured EDoF reaches its maximum value at r = 15 cm , which agrees with the predicted r MSMD . As the link distance increases, the EDoF decrease and eventually reduces to one as the distance approaches the r EMRD . Achieving practical EMRD values requires very large trans- mit and receive apertures, which can be costly in hardware. A feasible alternativ e is to deploy widely spaced subarrays at the BS , effecti vely enlarging the aperture. In our measurements, the distributed phased arrays emulate a large effecti ve aperture while reducing hardware complexity . The results confirm that higher EDoF can be realized in LoS scenarios using such widely spaced subarrays. V . C O N C L U S I O N In this letter , we developed a framew ork to characterize the EDoF in ULA -based MIMO systems. Analytical expressions and experimental measurements using modular phased arrays demonstrate that the NF can support significantly higher EDoF compared to the FF . These results provide valuable insights for designing high-capacity , low-complexity MIMO systems in the radiativ e NF. R E F E R E N C E S [1] A. Hussain, A. Abdallah, A. Celik, and A. M. Eltawil, “Near-field ISAC: Synergy of dual-purpose codebooks and space-time adaptive processing, ” IEEE W ir eless Communs. , vol. 32, no. 4, pp. 64–70, 2025. [2] A. Abdallah, A. Hussain, A. Celik, and A. M. Eltawil, “Exploring frontiers of polar-domain codebooks for near-field channel estimation and beam training: A comprehensive analysis, case studies, and implications for 6G, ” IEEE Signal Process. Mag . , vol. 42, no. 1, pp. 45–59, 2025. [3] C. Ouyang, Y . Liu, X. Zhang, and L. Hanzo, “Near-field communications: A degree-of-freedom perspective, ” arXiv preprint , 2023. [4] A. Kosasih, ¨ O. T . Demir , N. Kolomv akis, and E. Bj ¨ ornson, “Spatial fre- quencies and de grees of freedom: Their roles in near -field communications, ” IEEE Sig. Pr ocess. Mag. , vol. 42, no. 1, pp. 33–44, 2025. [5] A. Hussain, A. Abdallah, A. Celik, E. Bj ¨ ornson, and A. M. Eltawil, “ Analyzing URA geometry for enhanced near-field beamfocusing and spatial degrees of freedom, ” Submitted to IEEE T rans. Commun. , 2024. [Online]. A vailable: https://repository .kaust.edu.sa/handle/10754/706379 [6] A. Hussain, A. Abdallah, A. Celik, and A. M. Eltawil, “Near-field beam prediction using far-field codebooks in ultra-massive MIMO systems, ” in Pr oc. IEEE Int. Conf. Commun. (ICC) , 2025, pp. 1712–1717. [7] F . Bohagen, P . Orten, and G. Oien, “Construction and capacity analysis of high-rank line-of-sight MIMO channels, ” in Proc. IEEE W ireless Commun. and Net. Conf. , vol. 1, 2005, pp. 432–437. A P P E N D I X T o deriv e the MSMD from the orthogonality condition of H , we compute the inner product between the recei ved vectors corresponding to two distinct transmit antennas, using the channel coefficients in ( 1 ) , and enforce this inner product to be zero: ⟨ h k,n , h l,n ⟩ = N − 1 X n =0 exp j 2 π λ ( r k,n − r l,n ) = N − 1 X n =0 exp j 2 π d 2 cos φ r cos φ t λr ( k − l ) n = sin π d 2 λr cos θ r cos φ t ( k − l ) N sin π d 2 λr cos φ r cos φ t ( k − l ) = 0 , ⇒ r = N d 2 λ cos φ r cos φ t = D r 2 cos φ r cos φ t (17)
Original Paper
Loading high-quality paper...
Comments & Academic Discussion
Loading comments...
Leave a Comment