Fast-Response Balancing Capacity of Alkaline Electrolyzers
The energy transition requires flexible technologies to maintain grid stability, and electrolyzers are playing an increasingly important role in meeting this need. While previous studies often question the dynamic capabilities of large-scale alkaline…
Authors: Marvin Dorn, Julian Hoffmann, André Weber
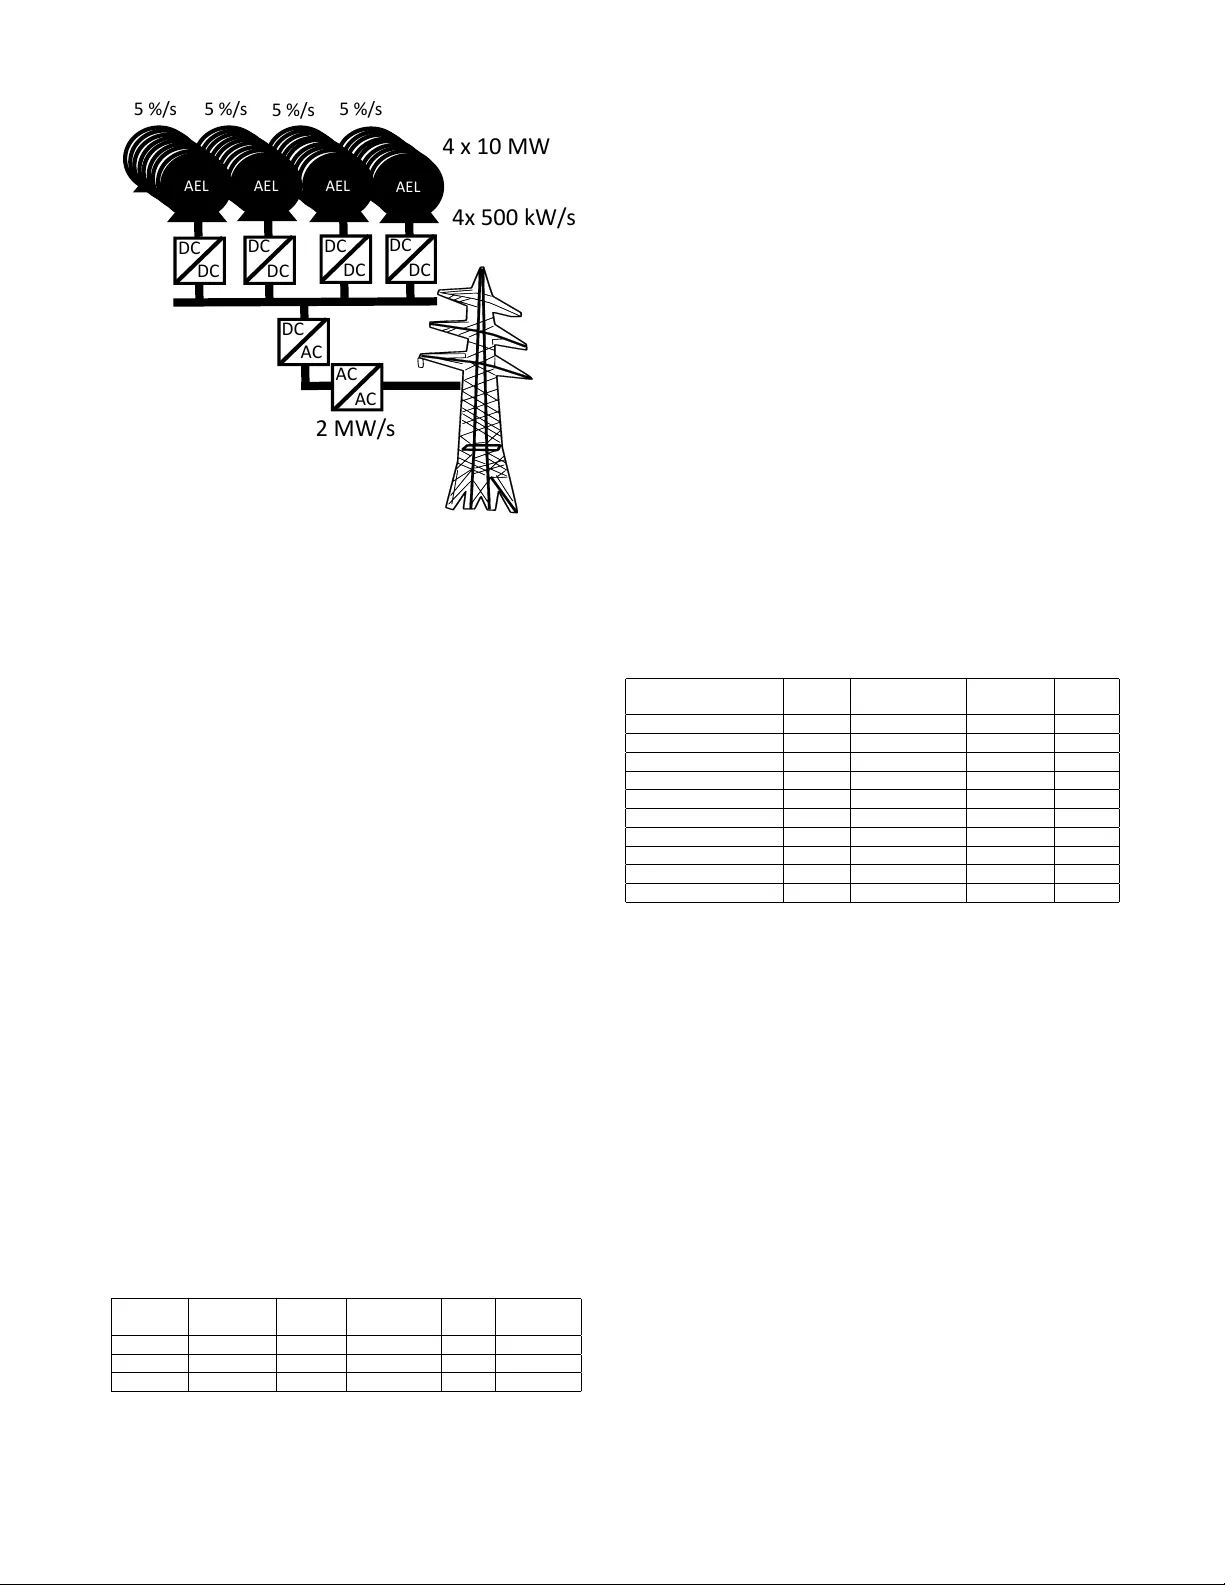
F ast-Response Balancing Capacity of Alkaline Electrolyzers 1 st Marvin Dorn 1 0009-0005-1885-7031 2 nd Julian Hof fmann 1 0000-0002-4105-4123 3 rd André W eber 2 0000-0003-1744-3732 4 th V eit Hagenmeyer 1 0000-0002-3572-9083 1 Karlsruhe Institute of T echnolo gy , Institute for A utomation and Applied Informatics (IAI), Karlsruhe, Germany 2 Karlsruhe Institute of T echnolo gy , I. for Applied Materials - Electr oc hemical T echnolo gies (IAM-ET), Karlsruhe, Germany Abstract —The energy transition r equires flexible technologies to maintain grid stability , and electr olyzers are playing an increasingly important role in meeting this need. While pre vious studies often question the dynamic capabilities of large-scale alkaline electrolyzer systems, we assess their potential to pro vide balancing ser vices using real manufactur er data. Unlike common approaches, we propose the decoupling between the total elec- trolyzer power and a smaller fractions of power actually offered on balancing markets. Adapting an existing methodology , we analyze alkaline electrolyzer systems and extend the assessment to Germany and Europe. Our r esults show that large-scale electrolyzers are technically capable of delivering fast-response balancing services, with significantly lower dynamic r equirements than previously assumed. The planned electrolyzers in Germany could cover the entire balancing capacity market, potentially saving around 13 % of their electricity costs, excluding energy balancing rev enues. The decoupling also resolves part of the trade-off for electrolyzer manufacturers, enabling the design of less dynamic but more stable systems. Index T erms —Alkaline Electrolyzer , Frequency Containment Reserve (FCR), A utomatic Frequency Restoration Reserve (aFRR), Grid Ancillary Services, Demand-Side Flexibility I . I N T RO D U C T I O N The global ener gy transition calls for scalable, low-carbon solutions. Hydrogen is increasingly seen as a cornerstone of future ener gy systems—particularly when produced via electrolysis using renewable electricity . The phase-out of con- ventional power plants with controllable generation and high rotational inertia is af fecting grid stability and diminishing the av ailability of balancing services. W ind and solar power , while crucial for decarbonization, can currently provide these ser- vices only to a limited extent [1]. Consequently , electrolyzers are increasingly being considered for grid support [2], par- ticularly for the provision of Frequency Containment Reserve (FCR), automatic Frequency Restoration Reserve (aFRR) and manual Frequency Restoration Reserve (mFRR) [3]. K opp et al. demonstrated in a real world setting at Energypark Mainz that electrolyzers can provide balancing capacity [4]. Heynen et al. [5] demonstrate in their revie w study the current state of research regarding the potential of large-scale electrolysis to reduce the rate of change of frequency and the maximum frequency deviation. Studies repeatedly state that alkaline electrolysis is too slow to participate in aFRR or FCR due to its insufficient dynamics [6][7]. In contrast, Eichman et al. [8] show , based on real systems, that changes in output can already be observed after just 0.2 seconds in both Proton Exchange Membrane (PEM) and Alkaline Electrolysis (AEL) systems. They hav e already demonstrated that both PEM and AEL are sufficiently dynamic in operation to provide grid services. Gu et al. [9] state that they require approximately 145 seconds for hot start-up in a 250 kW stack. This corresponds to a ramp rate of ≈ 0.68 % / s. They sho w that from a technical point of view , electrolyzers possess suf ficient fle xibility to participate in all of the aforementioned electricity markets. In a few seconds, these systems can adapt and provide power adjustments. Howe ver , most conclusions are typically drawn from small-scale test stacks or simulation models. In such cases, the electrolyzer is often varied from its minimum to 100% of its power , hence the full allowed range of the system. Cammann et al. [10] demonstrate in their study that FCR through AEL can lead to cost reductions. W e examine large-scale electrolyzer systems using manufac- turer data to assess their potential for participating in grid services. Unlike other approaches, we focus on systems that allocate only a small part of their capacity to such services. Studies and data indicate that the balancing capacity market is relativ ely small [11]. The difference compared to other studies lies in the fact that, for large-scale electrolyzers, the dynamic response (in %/s) refers to the system’ s total power , whereas balancing services are traded in fixed 1 MW increments [12]. W e aim to raise awareness of this decoupling. Figure 1 illustrates why larger systems tend to exhibit a higher dynamic response per mega watt. Figure 1 sho ws a configuration of four parallel alkaline electrolyzers connected to the high-voltage grid. W e apply our approach to large-scale electrolyzer [13], highlighting its limitations. In addition, we extend the analysis to Germany and Europe to examine ho w the comparativ ely low share of po wer dedicated to balancing services affects the overall potential. Our findings indicate that AEL can technically provide fast- response balancing services, thereby reducing the main oper- ating cost — electricity — of electrolyzers by up to 13 %. Our results show that only a small share of the planned electrolyzer power is needed to participate in the balancing market. This, in turn indicates that electrolyzers require significantly less dynamic operation than previously assumed. W e also show AEL AEL DC DC DC DC DC DC DC DC AEL AEL DC A C A C A C 4 x 10 MW 5 %/ s 5 %/ s 5 %/ s 5 %/ s 4x 500 kW/ s 2 MW/ s Fig. 1. Schematic representation of four 10 MW alkaline electrolyzers with a ramp rate of 5%/s, which together can offer 2 MW/s change to the grid. that the decoupling helps manufacturers resolve the trade-of f in electrolyzer design. The findings provide a solid foundation for discussion. The structure of the present paper is as follows: First, we provide an overvie w of the state of the art in Sec. II. Then Sec. III outlines the methodology . In the ev aluation sec. IV, the approach is applied to different scenarios, including Germany and the EU. Finally , the Conclusion and Outlook in Sec. V summarize the key findings and suggest future works. I I . S T A T E O F T H E A RT This section outlines the relev ant parameters, system char- acteristics, and physical relationships that form the foundation of the subsequent calculations. The section begins with an ov erview of the control power requirements, followed by a market analysis of exemplary manufacturers and their corre- sponding systems, including key technical parameters. Sub- sequently , the most relev ant system limitations and boundary conditions are examined. Finally , the efficienc y in the partial load range is described. A. Contr ol power r equir ements T able I summarizes the requirements for the different types of balancing capacity . This includes the necessary ramp rates. The table lists the type of balancing capacity and the minimum T ABLE I D I FFE R E N T B AL A N C IN G C A P AC I T Y M E C H AN I S M S [ 1 3 ] [1 4 ] . Power min. Size A vaila. Symmetry Dur . Gradient Control [MW] [sec.] [h] [kW/s] FCR 1 30 sym. 4 33.34 aFRR 1 300 asym. 4 3.34 mFRR 1 750 asym. 4 1.34 tradable power . It also specifies the av ailability , i.e., the latest point in time by which the sold power must be fully provided. Symmetry indicates whether the control reserve is of fered symmetrically (in both directions) or separately for upward and downw ard regulation. Durability describes the period for which the balancing capacity must be maintained. The gradient is calculated by dividing the pro vided power by the a v ailability time. B. Market A vailability of Industrial-Scale Electr olyzers Selected market players are discussed to provide context for MW -scale electrolyzer dynamics: Ke y participants in the Chinese market include SANY Hydrogen Energy Co. Ltd. [15] and Trina Green Hydrogen [16], both of which currently offer AEL systems. In the American market, companies such as PlugPower Inc. and Cummins Inc. can be found, although not all dynamic performance data are av ailable in their data sheets. In Europe, there is a wide range of companies of fering AEL, Anion Exchange Membrane (AEM), solid oxide electrolyzer cell (SOEC), and PEM electrolysis. A summary of the data on the dynamics can be found in T able II, where necessary parameters can be obtained. T ABLE II E L EC T RO LYZ E R M AR K E T D YN AM I C S O V ERV I EW . Name Power Po wer Range Dynamic T ype [MW] [%] [% / sec.] Ecolyzer [17] 3 10-100 0.5* AEL Sunfire [18] 10 25-100 0.61 AEL Sunfire [19] 10 50-100 0.16 SOEC McPhy [20] 16 10-100 5 AEL ThyssenKrupp [21] 20 10-100 3* AEL T rina [16] 15 30-110 5 AEL QuestOne [22] 10 10-100 3* PEM Elyzer [23] 17.5 40-100 10 PEM Neptun ITM [24] 2 25-100 10 PEM Enapter [25] 2.5 1-100 0.73 AEM ∗ Discussions with manufacturers or calculated C. P articipation of Electr olyzers in the balancing capacity Market In general, electrolyzers participate in the balancing capacity market in the same way as other units. For FCR, it is im- portant to of fer symmetrical balancing capacity . For example, a product like NEG_POS_00_04 covers a four-hour window between midnight and 4 a.m. The electrolyzer must therefore operate at a setpoint from which it can increase or decrease power output equally . For instance, a 100 MW plant operates at 95% of its power and of fers 5 MW as balancing capacity . The operator receiv es compensation for providing this 5 MW . Unlike with aFRR, there is no additional payment for actual activ ation—only for being available [14]. FCR responds automatically and decentrally based on the frequency profile. In contrast, aFRR responds to a control signal from the transmission system operator (TSO) and can be offered asymmetrically . An electrolyzer could, for example, run at 100 % capacity and offer only downward regulation. In this case, the operator receiv es additional compensation, ev en if the power is nev er called upon. W e do not consider mFRR balancing market here, as it plays an increasingly minor role [14]. T o simplify the analysis, the balancing energy mark et is omitted here also, with the focus directed exclusi vely to ward the balancing capacity market. D. Lower P ower Limit The first crucial parameters for planning the operating strategy are the power limits [13], expressed in percentages. The upper limit is typically set at 100 %, ev en though some systems can operate at temporary overloads [17][18][21]. V ari- ous parameters in cell design are subject to trade-offs. Thinner membranes, for example, result in lower internal resistance and therefore reduced losses, but they also lead to increased hydrogen crossover [26]. Additionally , factors such as cell area, current density , electrolyte, membrane material, pressure, and temperature can be optimized to fav or one aspect over another [27][28][29][30]. The trade-off typically occurs be- tween degradation (lifetime), costs, power , efficienc y , and the dynamic behavior [31]. In electrolysis systems, the Hydrogen to Oxygen (HTO) parameter is often specified. This indicates the proportion of hydrogen found in the oxygen stream. It plays a particularly important role during the minimum power of AEL systems [26]. If the ratio becomes too high, explosi ve gas mixtures can form. This poses a safety risk and must therefore be av oided. Trink e et al. [28] inv estigate crossov er phenomena in PEM and AEL electrolyis. At lo w production rates, the proportion of crossover becomes too large relative to the oxygen generation, leading to an increase in the HTO. For this reason, large-scale electrolyzers typically specify a minimum operating po wer between 10 % and 50% (T able II). E. P ower Gradient The other important parameter for grid-friendly operation is the gradient, which describes how quickly the electrolyzer can ramp up or down. Some manufacturers dif ferentiate be- tween ramp-up and ramp-down, with ramp-do wn typically being significantly faster . Therefore, T able II only shows the ramp-up values. Electrochemistry in the stack reacts very quickly [8]. Large electrolyzers are more complex and require attention to more factors. High pressure helps the release of gases and allows higher ramp rates than at atmospheric pres- sure [32]. T emperature and pressure affect how electrolyzers work. Ogumerem and Pistikopoulos [33] state that temperature mostly controls the dynamic behavior of the electrolyzer . Operators limit the ramp rate to keep the gas volume inside the cells within safe limits and to ensure proper gas vent- ing [32]. The studies [32] and [34] explain that the slo west variables—pressure, gas venting, and temperature—together with the control system, set the ramp rate limits. In discussions with AEL manufacturers (Ecoclean GmbH), it was noted that the dynamics of the stack are limited by the gas discharge. A gas flow rate that is too high may damage the thin electrode plate, which must be strictly a voided. During ramp-down, less heat and gas are produced, allowing electrolyzers to shut down quickly . Thus the electrical part of the stack does not cause these limits. F . P artial Load Behavior of Electr olysis - Efficiency Sev eral studies demonstrate the improv ed part-load beha vior of electrolyzers within the approved operating ranges for common types of electrolyzers [35][36][37]. T ypical efficienc y curves of electrolysis stacks initially show a steep increase up to a maximum point. After reaching this peak, they gradually decline in an almost linear fashion [4]. The ov erall efficienc y , or stack efficiency , is obtained by mul- tiplying the Faradaic efficienc y and the voltage efficienc y [29]. The low efficienc y at low power levels results from the high share of acti vation polarization, which is represented in the models via the voltage efficiency term [29]. Ohmic and diffusion losses play a less significant role in this operating range [29]. When operating within the datasheet-specified range [18], the power curve is approximately linear , and efficienc y decreases linearly with increasing balancing capac- ity [35]. At higher current densities, the characteristic curve leaves the linear region, and dif fusion polarization becomes dominant due to insufficient mass transport [29]. This region is also av oided as an operating point, since the efficiency drops sharply here as well—similar to the region where acti vation polarization dominates. I I I . M E T H OD O L O G Y This section introduces the concept of decoupling. The previously defined parameters and constraints from the state of the art are then used to ev aluate system performance within the method. A. Conceptual framework - The Decoupling The decoupling between the offered balancing capacity and the electrolyzer power becomes clear with a 100 MW electrolyzer that changes its po wer at a rate ∆ el of 1% per second. It takes 40 seconds to ramp from 60 % to 100 % po wer (hot ramp-up). Therefore, offering 40 MW of symmetrical FCR is not feasible (T able I [14]). If only 5 MW of symmetric FCR is provided, the required load change can be achiev ed within just 5 seconds—well below the 30-second response time threshold—making the system eligible for FCR, with the same system. The required ramp rate depends on the electrolyzer power . This concept applies only to large-scale electrolyzers, as small units do not provide enough power to join the power balancing market [14]. The minimum size is calculated in [13] and ranges between 1 MW and 4 MW , depending on the electrolyzer, its parameters and the type of balancing capacity provided. This also applies to large-scale electrolyzer installations consisting of several independent electrolyzer units, because for the grid, it makes no dif ference whether a 100 MW electrolyzer ramps up and down or ten 10 MW electrolyzers are controlled together . B. Calculation Method T o determine size of an electrolyzer for participation in grid services Equation (1) is used [13]: ∆ P ∆ t = P el · (1 − u ) · ∆ el P anc P ts (1) where: • P el is the rated power of the electrolyzer , • u is the lo wer threshold of the electrolyzer in %, • ∆ el is the ramp rate of the electrolyzer (in % per second), • P anc is the amount of balancing capacity to be provided, • P ts is the trading size, defined by grid code regulations. Equation (1) describes the po wer gradient that an elec- trolyzer must be able to achiev e in order to deliver a certain amount of additional service power . The numerator reflects the technical capability of the electrolyzer , taking into account the rated power , the operational flexibility range, and the ramping behavior . The denominator accounts for market requirements by normalizing the desired balancing capacity P anc with the minimum tradable unit P ts . I V . E V A L U A T I O N A N D D I S C U S S I O N In this section, we analyze a large-scale electrolyzer project to assess the technical limits of the decoupling. Then, we apply the decoupling concept to Germany and estimate the potential income through balancing services. W e do this for both FCR and aFRR. Finally , we take a brief look at the situation in Europe. Lastly , we discuss the advantages of decoupling in relation to the design trade-off faced by electrolyzer manufac- turers. A. Demo4Grid Pr oject In the EU project "Demo4Grid" a 4 MW Sunfire AEL was installed and operated in a grid-supportive manner [38]. Based on T able II, it can be observed that the ramp rate is 0.61 % per second and that the lower operating limit is 25 % of the nominal power . For a 4 MW electrolyzer, this means that 3 MW (i.e., the range do wn to 25 % load) can theoretically be made av ailable for grid services. FCR must be offered symmetrically , only half of this range—1.5 MW—can be considered. Howe ver , FCR can only be offered in whole mega watts, which means that only 1 MW of FCR can actually be provided. This implies that the AEL would operate at 3 MW and be capable of providing FCR in the range between 2 MW and 4 MW—assuming the required ramping can be achiev ed within 30 seconds. Howe ver , the Sunfire electrolyzer has a ramp rate of 0.61 % per second. T o reach the full 25 % change in output, it w ould therefore require approximately 41 seconds, exceeding the FCR requirement. As a result, this specific unit cannot participate in FCR. Providing aFRR is feasible as can be seen in T able I. By calculating backwards from the FCR requirement, the minimum power of the electrolyzer can be deri ved: Giv en a ramp rate of 0.61 %/s over 30 seconds, the allowed power range change would be limited to 18.3 % of the power . Referring this to the required 25 % load shift for 1 MW of FCR, this would mean that the total installed power would need to be approximately 5.5 MW . In other words, if the electrolyzer had a nominal power of 5.5 MW , it would just be able to of fer 1 MW of FCR within the 30-second window . This example calculation illustrates ho w to determine whether lar ge-scale electrolyzers are eligible to participate in balancing services. Relativ ely small electrolyzer , such as the one used in the Demo4Grid project, quickly reach their dynamic limitations in this context. B. German Use Case Between January 2022 and January 2024, approximately ±500 MW FCR and ±2000 MW of aFRR was needed for Germany [39]. Considering expansion targets with 10 GW electrolyzer power [40], it becomes e vident that ev en partial provision of po wer from these systems should be suf ficient to help maintain grid stability . If these 10 GW electrolyzers were to provide only 5% (symmetrical: 90%-100% - standard load point 95%) of their capacity for the FCR, the 500 MW would already be covered. Equation (1) applied to 10 GW with a range of ± 500 MW leads to the minimum gradient ∆ el, min. . P anc = 2 GW , P el = 10 GW , P ts = 2 MW ( symmetric ) First the ∆ P ∆ t is calculated: ∆ P ∆ t = 1 MW 30 s = 34 kW/s = 0 . 034 MW/s The lo wer threshold u can be determined based on the required control energy . W ith 10 GW of installed capacity and a symmetric need of 500 MW , the usable range is 1 GW . This results in: 10 GW − 1 GW = 9 GW ⇒ u = 9 GW 10 GW = 0 . 9 After substituting all values and rearranging the equation for ∆ el , the gradient is obtained. ∆ el = 0 . 0945% / s This means that if the a verage ramp rate of the electrolyzers in Germany reaches 0.0945 %/s, they can fully provide the currently required FCR. All electrolyzers listed in T able II can handle this, at least in theory , even the SOEC, although it probably does not initially serve this purpose. If the re- maining 9 GW is used for the ± 2GW aFRR with u=0.56 and the minimum gradient for aFRR (0.0034 MW/s), a ∆ el. of 0.086 %/s results. Electrolyzers can also handle this. In summary , the planned expansion of the electrolyzer capacity in Germany by 2030 allo ws electrolyzers to provide the entire balancing capacity for FCR and aFRR as of today . This shows a decoupling between the balancing capacity an electrolyzer provides and its full po wer, which allows the use of any electrolysis technology . C. Example calculation F requency Containment Reserve T o approximate additional revenue using FCR for electrol- ysis, data from the TSO is used [39]. Between July 16 and July 22, 2025, prices range from 15 C/MW at night to 120 C/MW at midday . The weekly sum is 2,350 C/MW/week. This so-called capacity price is publicly av ailable for previous years. In 2025, capacity prices range between 1,300 and 5,877 C/MW/week. In the future, more providers are expected to enter the market. This trend could push prices down. Rapid expansion of large-scale batteries, virtual power plants, heat pumps, and electrolyzer capacity drives this development [41]. For now , we base our calculation on the prices from July 17, 2025, as shown in T able III, which represents a typical weekday and is used here for illustrative purposes only . An T ABLE III F C R C A PAC IT Y P R IC E S F O R D I FF ER E N T TI M E B LO C K S ( 17 . 0 7 .2 0 2 5 ). Time Block Price [ C/MW] NEGPOS_00_04 14.71 NEGPOS_04_08 21.92 NEGPOS_08_12 62.00 NEGPOS_12_16 78.00 NEGPOS_16_20 51.00 NEGPOS_20_24 36.00 electrolyzer with a capacity of 100 MW , operating continu- ously at 95 % load and of fering 5 MW of FCR, could hav e earned an additional 1,318.15 C in FCR compensation on July 17, 2025, based on the applicable time-block prices. Ac- cording to [13], the ov ernight Capital expenditures (CAPEX) for an AEL is between 40–83 million C for a 100 MW electrolyzer . Ho wev er , the primary cost factor in electrolysis is electricity [42], which is why we compare the revenues from balancing services directly to electricity expenses. Using German electricity prices from 2024 [43], and considering only the hours when the wholesale electricity price is below 85 C/MWh—in order to ensure more than 5,000 operating hours per year—we arrive at an av erage market price of 50 C/MWh. Electrolyzers are ex empt from electricity tax [44]. They are also ex empt from grid fees only if the electricity is later fed back into the electricity grid [45]. W e assume the hydrogen produced will be used in the chemical industry and not re- injected, we include grid charges in our estimate. Assuming grid fees at 30 %, an electricity price of 65 C/MWh results. For a set point of 95 MW running 24 hours per day , corresponds to electricity price of: 95 MW · 24 h · 65 C/MWh = 150 , 000 C Providing FCR can reduce these electricity costs by around 1 %, and additionally , FCR NEG ef fectiv ely provides free energy to the electrolyzer during activ ation periods. D. Example calculation automatic F r equency Restoration Re- serve For an electrolyzer , it usually makes more sense to offer positiv e aFRR, since the unit can operate at 100 % power and only needs to reduce load when instructed. If no activ ation occurs, the operator still receiv es the basic capacity marked payment without delivering balancing energy . The capacity price for awarded aFRR contracts typically ranges from a fe w euro cents up to around 100 C/MW per hour . For estimation purposes, we assume an average of 20 C/MW/h. One key advantage of providing positive aFRR is that electrolyzers are typically capable of ex ecuting a rapid hot ramp-down reliably and quickly at any time. This allows them to offer flexibility across their full operational range. Assuming 5 MW (symmetrical) of a 100 MW AEL are reserved for FCR, and a minimum load of 50 % is allowed, then up to 40 MW remain available for FCR. For a full day , this results in the following rev enue: 40 MW · 24 h · 20 C/MW = 19 , 200 C/day This corresponds to approximately 12 % of the electricity costs calculated in the previous section. In addition, the provider receiv es compensation for the actual acti vated energy , which can significantly increase total income. The activ ation price (i.e. the price for actually deliv ered energy) for aFRR POS often v aries between 30 and 15,000 C/MWh, the latter being a predefined price cap. These prices are highly dependent on time of day and market conditions, so the values mentioned here should only be seen as approximate benchmarks. For a calculation, an average activ ation price of 1,000 C/MWh in addition to the capacity price could be applied in a more in- depth work. Howe ver , this data is anonymized and therefore not included in the calculation. The aFRR participation also comes with a trade-off: Elec- trolyzers are primarily intended to produce hydrogen. Frequent participation in aFRR POS leads to reduced full-load hours per year , lowering ov erall hydrogen output. E. Eur opean Use Case The Central European FCR Cooperation currently requires 1500 MW of FCR [14], while the Nordics and the rest of Europe need an additional 1500 MW . This results in a total demand of 3000 MW of balancing capacity . The EU plans to utilize 80 GW of electrolysis capacity by 2030, with 40 GW to be installed within the EU and another 40 GW outside its borders [46]. This implies that only about 15 % (7.5 % symmetrical) of the planned electrolysis capacity would be required to provide the entire FCR. The ratio between required balancing capacity and Europe’ s electrolyzer expansion targets is lo wer , but a significant share can still be provided this way . F . T rade-of f in electr olyzer design The design of electrolyzers is a comple x topic. Entire studies and academic works are dedicated to it, as can be seen in section III [27][30][31]. Therefore, this work aims only to provide a brief overvie w , of the key aspects. Figure 2 tries to illustrate the different design objectiv es that can guide the dev elopment of an electrolyzer . These objectiv es help explain why the electrolyzers listed in T able II differ so significantly in their technical param- eters. One example is the membrane thickness: choosing a thicker membrane increases internal resistance but reduces gas crossov er [26][28]. While this may negati vely impact efficienc y , it can enable operation at lower partial loads, allow for higher operating pressures (which can improve BoP efficiency), and increase system safety . Howe ver , these Cos ts Dynamic E ffi ciency Lif e Span P ar � al Load (Sa f e ty) PEM 1 SOE C AEL 1 AEL 2 Fig. 2. Schematic representation of the trade-off in electrolyzer design. advantages may come at the cost of higher system complexity and expense. Giv en that safety is a parameter that must be met, it is indicated in parentheses in the figure. Similarly , increasing system dynamics may lead to more gas bubble formation within the stack, which in turn requires addi- tional measures to remov e these bubbles and maintain low dif- fusion polarization—again resulting in higher costs [27][29]. Such trade-of fs influence many of the degrees of freedom in electrolyzer design, and are the reason for the wide variation among different systems. Additional influential parameters include electrode thickness, flow field design (channel geom- etry), electrolyte composition, and others [26][28][31][47]. The decoupling between the offered control power and the actual electrolyzer power , as discussed in this work, enables manufacturers to eliminate certain design constraints and opti- mize for other advantages. For instance, if there is no longer a need to operate at very lo w partial loads—because the system only runs between 90 % and 100 % of nominal capacity—the membrane can be made thinner, potentially increasing overall efficienc y [47]. Additionally , the required ramp rate (gradient) for large-scale systems becomes significantly less demanding, allowing systems with lower gradients to still participate in FCR markets. G. Competing balancing capacity participants The list of awarded bids for FCR is anonymized, which makes it difficult to trace the underlying technologies [39]. Based on the regulatory framework, it can be inferred that primarily conv entional po wer plants participate in FCR bal- ancing [14]. Since a guaranteed duration of 4 hours (T able I is required, not every battery system can participate; large-scale Batteries are particularly well suited. These are generally lim- ited by the amount of energy they can absorb or deliv er . Ad- ditionally , pumped-storage power plants, hydropo wer plants, biogas plants, and waste-to-energy facilities can participate in the tenders. Large industrial plants are also well suited for load shedding and load increase. Increasingly , virtual power plants and large heat pumps are entering this market [41]. As con ventional po wer plants are gradually phased out from continuous operation, there is a growing need for ne w actors to fill this gap. Electrolyzers can increasingly play an important role for this, even though they will face competition from many existing market participants. In times when renew able energy is scarce, electrolyzers may , therefore, be completely shut down and cannot support the grid stability . Gas-fired power plants (capable of hydrogen comb ustion) are currently planned for these times. V . C O N C L U S I O N S A N D O U T L O O K In this work, we discuss the use of electrolyzers for providing Frequency Containment Reserve (FCR) and automatic Frequency Restoration Reserve (aFRR). W e show that Alkaline Electrolyzers (AEL) can operate dynamically to deliver balancing capacity in a con ventional way . The key point is the decoupling between the power of the electrolyzer and the offered balancing capacity . This implies that most systems can provide balancing capacity by reserving only a small part of their upper power range. The key parameters for the calculations are the hot ramp-up gradient, the minimum partial load, and the nominal po wer of the electrolyzer . These parameters in volv e a trade-off in electrolyzer design, which can be mitigated by decoupling the offered flexibility from the installed nominal capacity . This approach can be used to improv e both lifetime and efficienc y and to be sufficiently dynamic. W e discuss the limits of decoupling: In particular , we show that AEL can participate in balancing capacity marked. The German government’ s target for electrolyzer expansion is compared with the total balancing capacity required. Because the need for balancing capacity is relati vely low , electrolyzers could completely co ver the balancing capacity need. This could lead to lower prices for FCR and aFRR as the number of electrolyzers increases. In the EU, 15 % of the electrolysis capacity would be sufficient to cov er FCR. The main cost component of electrolysis is the electricity requirement. The study shows that participation in the balancing capacity marked could save 13 % of electricity costs, when the re venues from FCR and aFRR are combined. Electrolyzers can react quickly to changes and will prob- ably expand significantly across Europe. The decoupling we describe in this work also applies to inertia provision. Other relev ant research areas for large-scale electrolyzers include voltage regulation, reactiv e power support, and grid-forming load behavior . R E F E R E N C E S [1] Kaleem Ullah et al. “Ancillary services from wind and solar energy in modern power grids: A comprehensiv e revie w and simulation study”. In: Journal of Renewable and Sustainable Ener gy 16.3 (2024). [2] Arash E Samani et al. “Grid balancing with a large- scale electrolyser providing primary reserve”. In: IET Renewable P ower Generation 14.16 (2020), pp. 3070– 3078. [3] Raff aello Cozzolino and Gino Bella. “A revie w of electrolyzer-based systems providing grid ancillary ser- vices: current status, market, challenges and future directions”. In: F r ontiers in energy r esearc h 12 (2024), p. 1358333. [4] K opp et al. “Energiepark Mainz: T echnical and eco- nomic analysis of the worldwide largest Po wer-to-Gas plant with PEM electrolysis”. In: Int. J. of Hydr ogen Ener gy 42.19 (2017). Special Issue on The 21st W orld Hydrogen Energy Conference (WHEC 2016), 13-16 June 2016, Zaragoza, Spain, pp. 13311–13320. I S S N : 0360-3199. D O I : 10.1016/j.ijhydene.2016.12.145. [5] Thomas Heynen et al. “Systematic revie w on fast frequency ancillary services provided by large-scale hydrogen electrolyzer plants”. In: 23rd W ind & Solar Inte gration W orkshop (WIW 2024) . V ol. 2024. IET. 2024, pp. 341–348. [6] Manuel Agredano-T orres et al. “Dynamic power allo- cation control for frequenc y re gulation using hybrid electrolyzer systems”. In: 2023 IEEE Applied P ower Electr onics Confer ence and Exposition (APEC) . IEEE. 2023, pp. 2991–2998. [7] Oliv er Schmidt et al. “Future cost and performance of water electrolysis: An expert elicitation study”. In: International journal of hydr ogen energy 42.52 (2017), pp. 30470–30492. [8] J Eichman, K Harrison, and Michael Peters. Novel electr olyzer applications: pr oviding mor e than just hydr ogen . T ech. rep. National Renew able Energy Lab .(NREL), Golden, CO (United States), 2014. [9] Junjie Gu et al. “Experimental studies on dynamic performance of 250-kW alkaline electrolytic system”. In: Journal of P ower Sources 592 (2024), p. 233920. [10] Lucas Cammann, Erick F Alves, and Johannes Jäschke. “Dynamic minimum loads for FCR market participation of alkaline water electrolyzers”. In: IECON 2024-50th Annual Conference of the IEEE Industrial Electr onics Society . IEEE. 2024, pp. 1–6. [11] 50Hertz, Amprion, T enneT , TransnetBW. Dimension- ierung Re gelr eservebedarf . https:/ /www.regelleistung .n et/ de- de /Marktinformationen/ Dimensionierung- Regelre servebedarf. Zugriff am 7. Juli 2025. 2025. [12] regelleistung.net. What T ypes of F r equency Contr ol Re- serves Exist? Accessed July 11, 2025. 2025. [13] Marvin Dorn et al. “Design of Large-Scale Hybrid, Hydrogen and Battery , and Energy Storage Systems for Grid Applications”. In: IEEE Open Access Journal of P ower and Ener gy 12 (2025), pp. 341–352. D O I : 10.11 09/OAJPE.2025.3572590. [14] TSO Germany. F r equency Containment Reserve . 2024. U R L : https :/ / www. regelleistung. net/ de- de /Allgemeine - Infos/ Arten- der- Regelreserve/ Frequency- Containment- Reserve. [15] SANY Hydrogen Energy Co., Ltd. E-1200: 1200 Nm³/h Alkaline W ater Electr olyser . https : / / www . sanyhydroge nenergy.com /alkaline- water - electrolysis/1200- alkaline- water- electrolysis- hydrogen.html. 2025. [16] T rina Green Hydrogen. The-One Series Alkaline Elec- tr olyzer (A WE 1000 / A WE 2000) . https : / / www . trinah ydrogen . com / en / product _ 100 . html. Zugriff am 8. Juli 2025. 2025. [17] Ecoclean GmbH. Alkalische Elektr olyseur e A300 | A600 | P200 | P400 . 2023. U R L : www.ecoclyzer.com. [18] Sunfire SE. Sunfire-HyLink Alkaline Pr essurized Alka- line Electr olyzers (AEL) . 2024. [19] Sunfire SE. Sunfire-HyLink SOEC – High-T emperatur e Electr olyzer . 2025. [20] McPhy Energy S.A. MCLYZER PR ODUCT LINE - Pr essurized alkaline electrolysis . 2023. U R L : https : // m cphy.com/de/. [21] thyssenkrupp nucera. Industrial-Scale W ater Electr oly- sis for Gr een Hydr ogen Pr oduction . 2024. [22] Quest One GmbH. Quest One MHP Datasheet . In German. 2024. [23] Siemens Energy . Electr olyzer Br ochur e – Hydro gen P ower-to-X . Accessed: July 9, 2025. 2024. [24] ITM Po wer. Neptune II Specification Sheet . Accessed: July 9, 2025. 2024. [25] Enapter. AEM Nexus 2500 Datasheet . Accessed: July 9, 2025. 2025. [26] Matheus T De Groot, Joost Kraakman, and Rodrigo Lira Garcia Barros. “Optimal operating parameters for advanced alkaline water electrolysis”. In: international journal of hydr ogen ener gy 47.82 (2022), pp. 34773– 34783. [27] Subramani Krishnan et al. “Present and future cost of alkaline and PEM electrolyser stacks”. In: International Journal of Hydr ogen Energy 48.83 (2023), pp. 32313– 32330. I S S N : 0360-3199. D O I : https://doi.org/10 .1016/j .ijhydene .2023.05 .031. U R L : https:/ /www. sciencedirect .com/science/article/pii/S0360319923022590. [28] P T rinke et al. “Hydrogen crossover in PEM and alka- line water electrolysis: mechanisms, direct comparison and mitigation strategies”. In: Journal of The Electro- chemical Society 165.7 (2018), F502. [29] Peter Kurzweil and Otto K Dietlmeier . Elektr ochemis- che Speicher . Springer, 2018. [30] Danji Huang et al. “Size design strategy for scaling up alkaline water electrolysis stack integrated with renew able energy source: A multiphysics modeling ap- proach”. In: Energy Con version and Management 300 (2024), p. 117955. [31] Ruomei Qi et al. “Channel design optimization of alkaline electrolysis stacks considering the trade-off be- tween current efficienc y and pressure drop”. In: J ournal of P ower Sour ces 579 (2023), p. 233222. [32] V .A. Martinez Lopez et al. “Dynamic operation of w ater electrolyzers: A revie w for applications in photov oltaic systems integration”. In: Rene wable and Sustainable Ener gy Revie ws 182 (2023), p. 113407. I S S N : 1364- 0321. D O I : https://doi.org/10.1016/j.rser.2023.113407. [33] Gerald S. Ogumerem and Efstratios N. Pistikopoulos. “Dynamic Modeling and Explicit Control of a PEM W ater Electrolysis Process”. In: Smart and Sustainable Manufacturing Systems 2.2 (Aug. 2018), pp. 25–43. I S S N : 2520-6478. D O I : 10.1520/SSMS20180017. [34] Mahdi Kiaee et al. “Demonstration of the operation and performance of a pressurised alkaline electrolyser operating in the hydrogen fuelling station in Porsgrunn, Norway”. In: Energy Con version and Management 94 (2015), pp. 40–50. I S S N : 0196-8904. D O I : https://doi .o rg/10.1016/j.enconman.2015.01.070. [35] Haoran Cheng, Y anghong Xia, and W ei W ei. “Hydrogen production efficienc y enhancement for alkaline water electrolyzers operating at varying temperature via an adaptiv e multi-mode control”. In: International J ournal of Hydr ogen Ener gy 93 (2024), pp. 430–440. [36] Mahdi Kiaee et al. “Demonstration of the operation and performance of a pressurised alkaline electrolyser operating in the hydrogen fuelling station in Porsgrunn, Norway”. In: Energy Con version and Management 94 (2015), pp. 40–50. [37] D. Klotz et al. “Electrochemical model for SOFC and SOEC mode predicting performance and ef ficiency”. In: International J ournal of Hydr ogen Ener gy 39.35 (2014), pp. 20844–20849. I S S N : 0360-3199. D O I : https://doi.or g/10.1016/j.ijhydene.2014.08.139. [38] European Commission. Demo4Grid – Demonstration of 4MW Pressurized Alkaline Electr olyser for Grid Balancing . https : / / cordis . europa . eu / project / id / 736351. Accessed: 2025-07-18. 2020. [39] regelleistung.net. Datacenter: T enders for Balancing Capacity and Ener gy (PRL, SRL, MRL, ABLA) . Ac- cessed July 11, 2025. July 2025. U R L : https : / / www .regelleistung.net/apps/datacenter/tenders. [40] Bundesministerium für Wirtschaft und Klimaschutz (BMWK). W asserstoffstr ate gie – Nationale W asserstof f- strate gie . Zugriff am 7. Juli 2025. 2024. [41] Next Kraftwerke GmbH. next-kraftwerk e . 2025. U R L : https: // www. next- kraftwerke .de /virtuelles - kraftwerk/ re gelenergie. [42] Markus Felgenhauer and Thomas Hamacher. “State-of- the-art of commercial electrolyzers and on-site hydro- gen generation for logistic vehicles in South Carolina”. In: International Journal of Hydr ogen Energy 40.5 (2015), pp. 2084–2090. [43] SMARD – Strommarktdaten. SMARD – Str ommarkt- Datenportal . Of fizielles Portal für Stromerzeugung, Handel und V erbrauch in Deutschland; abgerufen am 6. August 2025. 2025. U R L : https://www.smard.de/home. [44] Stromsteuergesetz (StromStG). §9aStr omStG – Er- lass, Erstattung oder V er gütung der Steuer für bestimmte Pr ozesse und V erfahr en. Online-V ersion „Gesetze im Internet“ . Zuletzt geändert durch Art.13G v .22.Dezember2023, in Kraft seit1.Januar2023. 2023. U R L : https : / / www . xn - - gesetzeiminternet - f02jc . de / st romstg/__9a.html. [45] Energie wirtschaftsgesetz (EnWG). §118EnWG – Über- gangsr e gelungen. Online-V ersion „Gesetze im Inter- net“ . Fassung 7.Juli2005 (BGBl.I S.1970); zuletzt geän- dert (z.B. Art.EnWRAnpG u.a.) 2005. U R L : https://ww w. xn- - gesetzeiminternet- f02jc. de/ enwg_2005 /_ _118. ht ml. [46] European Hydrogen Observ atory . EU Hydr ogen Strat- e gy under the EU Green Deal . July 2025. [47] Lei Zhang et al. Electr ochemical water electr olysis: fundamentals and technologies . CRC Press, 2020.
Original Paper
Loading high-quality paper...
Comments & Academic Discussion
Loading comments...
Leave a Comment