Geometric Analysis of Speech Representation Spaces: Topological Disentanglement and Confound Detection
Speech-based clinical tools are increasingly deployed in multilingual settings, yet whether pathological speech markers remain geometrically separable from accent variation remains unclear. Systems may misclassify healthy non-native speakers or miss …
Authors: Bipasha Kashyap, Pubudu N. Pathirana
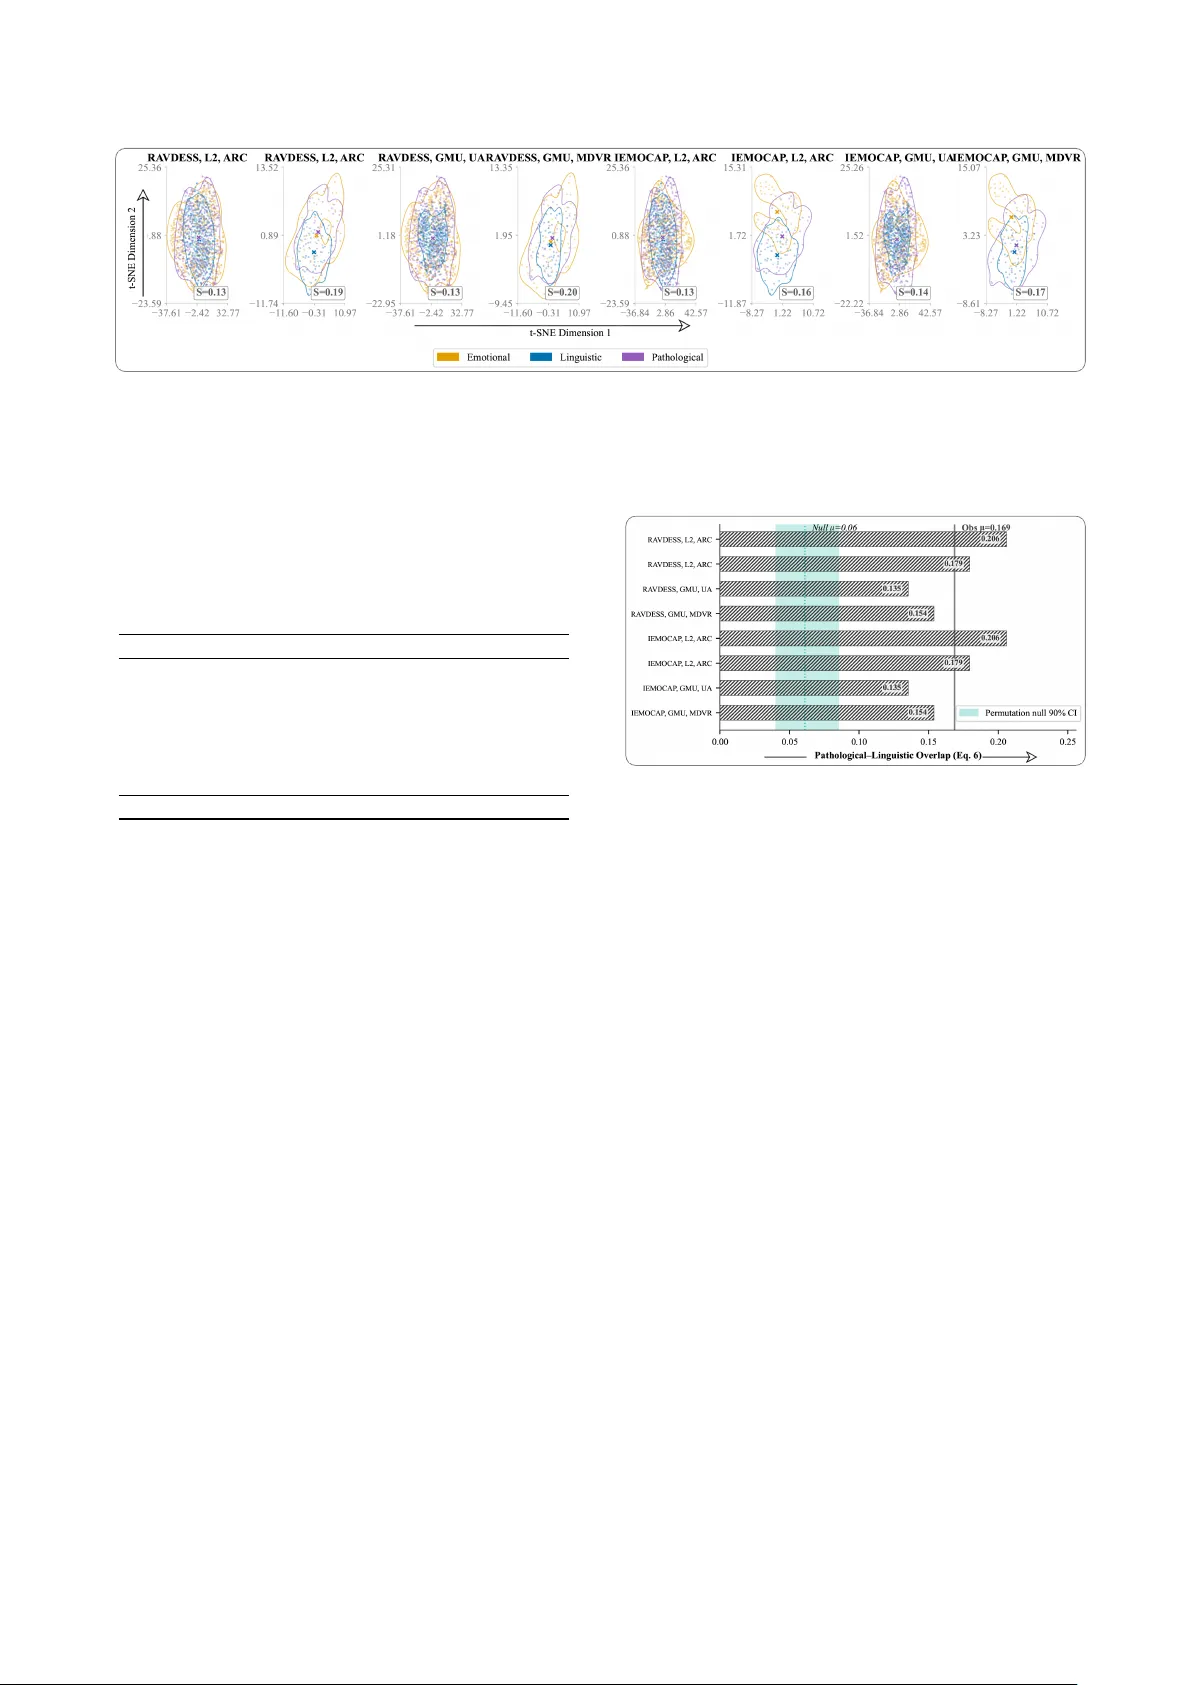
Geometric Analysis of Speech Repr esentation Spaces: T opological Disentanglement and Conf ound Detection Bipasha Kashyap 1 , Pubudu N. P athirana 1 1 Networked Sensing & Biomedical Engineering (NSBE) Research lab, School of Engineering, Deakin Uni versity , Australia b.kashyap@deakin.edu.au, pubudu@deakin.edu.au Abstract Speech-based clinical tools are increasingly deployed in multi- lingual settings, yet whether pathological speech markers remain geometrically separable from accent v ariation remains unclear . Systems may misclassify healthy non-native speakers or miss pathology in multilingual patients. W e propose a four-metric clustering framew ork to e v aluate geometric disentanglement of emotional, linguistic, and pathological speech features across six corpora and eight dataset combinations. A consistent hi- erarchy emerges: emotional features form the tightest clusters (Silhouette 0.250), followed by pathological (0.141) and linguis- tic (0.077). Confound analysis shows pathological–linguistic ov erlap remains belo w 0.21, which is abov e the permutation null but bounded for clinical deployment. Trustworthiness analysis confirms embedding fidelity and robustness of the geometric conclusions. Our frame work provides actionable guidelines for equitable and reliable speech health systems across diverse pop- ulations. Index T erms : disentangled representations, mutual informa- tion estimation, speech dimensions, source-filter model, MINE, CLUB 1. Introduction The human voice simultaneously encodes emotional state, lin- guistic identity , and physiological health within a single acous- tic signal. Separating these co-occurring information streams, a problem kno wn as speech disentanglement , is fundamental to clinical speech assessment [ 1 ], voice con version [ 2 ], and speaker v erification [ 3 ]. While self-supervised models such as wa v2vec 2.0 [ 4 ] and HuBER T [ 5 ] yield impressiv e task per- formance, they produce opaque embeddings whose geometric structure remains poorly understood [6]. Understanding whether speech features occupy geometri- cally separable regions of representation space remains an open problem. A diagnostic model requires that pathological and linguistic features reside in distinct manifold regions that sup- port reliable decision boundaries, not merely that they capture different aspects of speech in aggre gate. Without geometric char - acterisation, there is no guarantee that clinical features remain separable from accent-related variation across diverse popula- tions. The clinical urgency is concrete. Speech-based screening tools for Parkinson’ s disease and dysarthria are entering health- care systems that serve linguistically di verse populations [ 7 , 8 ]. Both Parkinson’ s hypokinetic speech and non-nativ e accents can produce reduced articulatory precision and imprecise consonant production [ 9 ]. If clinical features also respond to accent-related Submitted to INTERSPEECH 2026. variation, healthy non-nati ve speakers may be falsely flagged for neurological referral, while genuine pathology may be dismissed as accent v ariation in multilingual patients. Automated speech recognition systems already sho w significantly higher error rates for non-nativ e speakers [ 10 ], and recent work on fairness in paralinguistic analysis [ 11 ] underscores the broader pattern of demographic bias in speech AI. W e address this gap using four complementary clustering metrics applied to t-SNE embeddings of hand-crafted acoustic features. Our frame work characterises wher e speech dimensions reside in representation space and whether they form separable structures. Specifically , we: 1. Propose a four-metric clustering frame work (Silhouette, Davies–Bouldin, Calinski–Harabasz, Bootstrap Stability) for ev aluating geometric disentanglement; 2. Establish a manifold quality hierarch y (emotional > patholog- ical > linguistic) consistent across eight corpus combinations; 3. Demonstrate that hand-crafted clinical features maintain bounded geometric separation from accent features (o verlap < 0 . 21 ), with confound sev erity quantified against a permuta- tion null baseline; 4. V alidate embedding fidelity through trustworthiness analysis. 2. Related W ork 2.1. Speech Representation Disentanglement Self-supervised speech models learn powerful but entangled representations [ 4 , 5 ]. Recent w ork has addressed pairwise sep- aration: Cho et al. [ 12 ] achie ve cross-speak er emotion transfer through disentangled representations; Li et al. [ 3 ] apply MI- based decoupling for speaker verification; and Qian et al. [ 2 ] propose content–style factorisation for v oice con version. Pasad et al. [ 6 ] provide a layer-wise analysis of what speech SSL mod- els encode, rev ealing that different layers capture dif ferent infor- mation types. W agner et al. [ 13 ] survey transformer -era emotion recognition and note that dimensional confounds remain poorly characterised. Despite this progress, systematic geometric analy- sis of three-way dimensional structure (emotional × linguistic × pathological) remains an open problem. 2.2. Clustering Quality Assessment Evaluating unsupervised cluster structure requires complemen- tary metrics. The Silhouette Score [ 14 ] measures the sample- wise cohesion-to-separation ratio. The Davies–Bouldin In- dex [ 15 ] quantifies worst-case cluster overlap. The Calin- ski–Harabasz Index [ 16 ] captures between-to-within variance ratios. Bootstrap stability via the Adjusted Rand Index [ 17 ] as- sesses robustness to subsampling. V on Luxbur g [ 18 ] establishes 1 6 Figure 1: T opological analysis frame work. Overview: multi-dimensional featur es (emotional R 28 , linguistic R 33 , pathological R 16 ) under go t-SNE embedding, followed by thr ee branches: (A) clustering quality via four metrics, (B) bootstr ap stability ( B = 20 , 80% subsampling), and (C) confound detection via 2 σ overlap with a permutation null in shar ed PCA space. that no single metric suffices; we therefore combine all four . 2.3. Clinical Speech Assessment in Multilingual Settings Automated assessment of Parkinson’ s disease [ 7 ] and dysarthria [ 19 ] has shown clinical promise, but confounds with non-nativ e accents ha ve recei ved limited attention [ 8 ]. Fle ge’ s Speech Learning Model [ 9 ] predicts that non-nativ e speakers produce articulatory patterns intermediate between L1 and L2 targets—patterns that may o verlap with motor speech disorders. K oenecke et al. [ 10 ] document systematic bias in speech AI across demographic groups, motiv ating rigorous confound anal- ysis. 3. Methodology 3.1. Featur e Extraction W e extract three structured feature sets grounded in the source–filter model of speech production [ 20 ], using Praat [ 21 ] and librosa [22]. Source features characterise glottal excitation dynamics: fun- damental frequency (F0) statistics (mean, standard deviation, range, median, Q1, Q3), jitter , shimmer, and harmonic-to-noise ratio (HNR). These primarily reflect laryngeal vibration prop- erties modulated by emotional state and vocal health [ 23 , 24 ]. Filter features represent vocal tract resonance characteristics: formant frequencies and bandwidths (F1–F3, B1–B3) estimated via Burg LPC, together with 13 MFCCs and their first-order temporal derivati ves [ 25 ]. These capture articulatory shaping driv en by linguistic content and motor control. Emotional fea- tures e ∈ R 28 extend source descriptors with ener gy contours (RMS mean, standard de viation, maximum) and spectral statis- tics (centroid, flux, roll-off), consistent with the eGeMAPS framew ork [ 26 ]. Linguistic featur es l ∈ R 33 augment filter descriptors with delta–delta MFCCs and rhythm-related param- eters (tempo, duration), reflecting phonetic and prosodic struc- ture [ 27 ]. Pathological features p ∈ R 16 target clinically rele- vant markers, including perturbation measures (jitter , shimmer , HNR), formant stability (F1–F3 coefficient of variation), and F2 transition velocity [7, 28, 29]. All features are z-score normalised within each corpus com- bination to mitigate cross-dataset scale dif ferences. 3.2. Manifold Learning via t-SNE W e employ t-SNE [30] to project high-dimensional feature v ec- tors { x i } N i =1 ⊂ R d into two dimensions { y i } N i =1 ⊂ R 2 by minimising the Kullback–Leibler di vergence between pairwise similarity distributions: min Y KL( P ∥ Q ) = N X i =1 N X j =1 j = i p ij log p ij q ij . (1) X i = j p ij = 1 , X i = j q ij = 1 , (2) where Y = [ y 1 , . . . , y N ] denotes the low-dimensional em- bedding. P and Q are joint probability distrib utions over sample pairs in the high- and low-dimensional spaces, respecti vely: p ij is computed using a Gaussian kernel, while q ij is computed using a Student- t kernel with one degree of freedom. t-SNE is selected ov er PCA due to the nonlinear manifold structure of speech features, and over UMAP due to its stronger emphasis on local neighbourhood preservation, aligning with our objectiv e of assessing cluster separability . Parameters: perplexity = 30, learning rate = auto, 1000 iterations, PCA initialisation. 3.3. Clustering Quality Metrics Cluster separability is quantified using three complementary indices. Silhouette Score [ 14 ] ev aluates per-sample assignment quality: s ( i ) = b ( i ) − a ( i ) max( a ( i ) , b ( i )) , (3) where a ( i ) is the mean intra-cluster distance and b ( i ) is the mean distance to the nearest neighbouring cluster . s ( i ) ∈ [ − 1 , 1] , with higher values indicating stronger separation. Davies–Bouldin Index [ 15 ] measures av erage cluster similarity: DB = 1 k k X i =1 max j = i σ i + σ j d ( c i , c j ) , (4) where k is the number of clusters, σ i denotes within-cluster scatter , and d ( c i , c j ) is the Euclidean distance between centroids. Lower v alues indicate improved separation. Calinski–Harabasz Index [ 16 ] ev aluates global cluster struc- ture: CH = S S B / ( k − 1) S S W / ( n − k ) , (5) where S S B and S S W denote between- and within-cluster sums of squares, respectiv ely; k is the number of clusters, and n is the total number of samples. Higher values indicate more compact and well-separated clusters. Bootstrap Stability [ 17 ] assesses robustness to data perturba- tion: Stability = 1 B B X b =1 ARI ( C full , C b ) (6) where B is the number of bootstrap iterations, C full is the clus- tering obtained from all samples, C b is the clustering from boot- strap sample b , and ARI is the Adjusted Rand Index measuring agreement between two partitions. W e use B = 20 with 80% subsampling. For all metrics, we use KMeans with k = 3 clusters, match- ing the three semantic dimensions. 3.4. Confound Detection T o quantify pathological–linguistic geometric o verlap, we com- pute: Overlap ( P i , L j ) = |{ x ∈ P i : d ( x , µ L j ) < 2 σ L j }| | P i | (7) where P i is the set of pathological samples, L j is linguistic cluster j , µ L j is the centroid of L j , σ L j is the mean standard de- viation across dimensions within L j , and d ( · , · ) is the Euclidean distance. Because pathological ( R 16 ) and linguistic ( R 33 ) fea- tures differ in dimensionality , both are first projected into a shared PCA subspace of d = min( d path , d ling , 10) dimensions. T o interpret o verlap magnitude, we compute a permutation null [ 32 ] by pooling both feature sets, randomly reassigning labels ( n perm = 200 ), and recomputing Eq. 6. The 5th–95th percentile of this null distribution pro vides an empirical baseline for distinguishing genuine confound from chance proximity . 4. Experimental Setup 4.1. Datasets W e e v aluate across six corpora. Abbre viations are used through- out tables and figures: Emotional: RA VDESS [ 33 ] ( RA V ; 1,440 utterances, 24 actors) and IEMOCAP [ 34 ] ( IEM ; 10,039 utterances). Lin- guistic: L2-ARCTIC [ 35 ] ( L2A ; 24 non-nati ve speakers, 6 L1 backgrounds) and GMU Speech Accent Archi ve ( GMU ; 2,140 speakers, 177 L1 backgrounds). P athological: U A-Speech [ 19 ] ( U AS ; 15 dysarthric speakers) and MD VR-KCL ( MD V ; Parkin- son’ s, mobile recordings). W e analyse all 8 combinations ( 2 × 2 × 2 ) to ensure cross- corpus generalisability . T able 1: P er-dimension clustering quality (mean ± SD acr oss 8 combinations). Higher Silhouette and CH values indicate better clustering; lower DB values indicate better separation. F eature overlap acr oss sets is by design (e.g., formants in both linguistic and pathological sets) and contributes to moderate absolute Silhouette values. Dimension Silhouette ↑ DB Index ↓ CH Index ↑ Emotional ( R 28 ) 0 . 250 ± 0 . 057 1 . 448 ± 0 . 161 91 ± 70 Pathological ( R 16 ) 0 . 141 ± 0 . 012 1 . 859 ± 0 . 212 44 ± 32 Linguistic ( R 33 ) 0 . 077 ± 0 . 016 2 . 665 ± 0 . 364 22 ± 17 4.2. Implementation Features are z-score normalised per combination before t-SNE projection. Clustering uses scikit-learn [ 36 ] KMeans ( k = 3 , n init = 10 ). Bootstrap: B = 20 , 80% subsampling. Confound ov erlap: 2 σ in shared PCA space. T rustworthiness [ 37 ] is com- puted with k = 15 neighbours to verify embedding fidelity . 5. Results and Discussion 5.1. Per -Dimension Clustering Quality T able 1 presents clustering metrics aggregated across all eight combinations. A consistent hierarchy emerges: emotional fea- tures achiev e the highest Silhouette Score ( 0 . 250 ± 0 . 057 ), fol- lowed by pathological ( 0 . 141 ± 0 . 012 ) and linguistic ( 0 . 077 ± 0 . 016 ). All three metrics corroborate this ordering. Figure 2 visualises the manifold structure. Emotional fea- tures tend to form more compact clusters, whereas linguistic features exhibit comparativ ely more diffuse distributions. Per- panel Silhouette badges confirm cross-corpus consistency . Each badge represents the mean Silhouette score across all a v ailable dimensions within that subplot’ s combination (Emotional, Lin- guistic, and Pathological). The moderate absolute v alues ( < 0 . 30 ) reflect the fact that feature sets share components by design (e.g., formants appear in both linguistic and pathological sets). The r elative ordering, rather than the absolute magnitude, constitutes the principal scientific finding. This consistent hierarchy (emotional > patho- logical > linguistic) has direct implications for system design: tight emotional clustering supports categorical classification; pathological features occupy an intermediate position, consistent with motor speech severity existing on a continuum [ 28 ], sug- gesting regression-based architectures for clinical assessment; diffuse linguistic structure aligns with the combinatorial nature of phonetic variation across di verse language backgrounds. 5.2. Bootstrap Stability and Robustness Emotional clusters achiev e the highest bootstrap stability (ARI: 0 . 82 ± 0 . 08 ), followed by pathological ( 0 . 64 ± 0 . 18 ) and lin- guistic ( 0 . 51 ± 0 . 20 ), mirroring the Silhouette hierarchy . The Pearson correlation between Silhouette and stability is r = 0 . 74 ( p < 0 . 001 ), confirming that better-separated clusters are also more robust to subsampling. T able 2 presents t-SNE trustworthiness. All values exceed 0.79, with emotional embeddings highest ( 0 . 912 ± 0 . 043 ), fol- lowed by pathological ( 0 . 876 ± 0 . 050 ) and linguistic ( 0 . 809 ± 0 . 007 ). The uniformly high trustworthiness confirms that cluster- ing metrics computed on t-SNE embeddings reflect genuine high- dimensional structure rather than projection artefacts. T ogether , high trustworthiness and the Silhouette–stability correlation pro- vide independent confirmation that geometric conclusions are Figure 2: t-SNE embeddings ( R 2 , perplexity = 30) acr oss all eight combinations. P er-dimension Gaussian kernel density contour [ 31 ] (bandwidth=0.4, 30% maximum density isoline) highlight manifold extent; filled r e gions show core density . Silhouette score badges (lower right) quantify per-panel clustering quality . The emotional-dominant hierar chy is consistent acr oss all combinations, with pathological featur es forming intermediate clusters and linguistic features showing the most dif fuse structure . T able 2: t-SNE trustworthiness ( k = 15 ) per dimension and combination. V alues indicate the proportion of high-dimensional neighbours pr eserved in 2D. All values exceed 0.79. The mean follows the Silhouette hier ar chy: Emotional ( 0 . 912 ) > P atholog- ical ( 0 . 876 ) > Linguistic ( 0 . 809 ). Combination Emotional Linguistic Pathological RA V –L2A–U AS 0.964 0.814 0.926 RA V –L2A–MD V 0.888 0.799 0.826 RA V –GMU–U AS 0.964 0.811 0.926 RA V –GMU–MD V 0.888 0.812 0.826 IEM–L2A–U AS 0.949 0.814 0.926 IEM–L2A–MD V 0.848 0.799 0.826 IEM–GMU–U AS 0.949 0.811 0.926 IEM–GMU–MD V 0.848 0.812 0.826 Mean ± SD 0 . 912 ± 0 . 043 0 . 809 ± 0 . 007 0 . 876 ± 0 . 050 reliable. 5.3. Confound Analysis and Featur e Interaction Figure 3 presents pathological–linguistic ov erlap with permuta- tion null comparison. Overlap ranges from 0 . 135 (GMU pair- ings) to 0 . 206 (L2A pairings). The permutation null baseline ( µ null ≈ 0 . 06 ) confirms that the observed ov erlap reflects gen- uine shared acoustic structure (e.g., formant components present in both feature sets) rather than chance proximity . Crucially , ov erlap remains bounded ( < 0 . 21 ) despite intentional feature sharing. The L2A–GMU dif ference (0.179–0.206 vs. 0.135–0.154) indicates that training data diversity itself functions as a con- found mitigation strategy: the smaller L2A corpus concentrates accent variation near pathological feature space, whereas GMU distributes it more broadly . Overlap is identical across RA V and IEM pairings for matched linguistic–pathological combinations, confirming that the confound arises from linguistic–pathological feature interaction rather than emotional feature effects. 5.4. Limitations The moderate absolute Silhouette v alues ( < 0 . 30 ) indicate that none of the feature sets achieves suf ficiently clean separation for reliable unsupervised classification. Although the relativ e hier - archy is robust, o verall cluster separation remains partial rather than well-defined. The pathological datasets are comparativ ely small (U AS: 15 speakers; MD V : mobile recordings), and the nar - row confidence interv als ( ± 0 . 012 ) may therefore reflect limited within-class variability rather than strong structural stability . Figure 3: P athological–linguistic overlap (Eq. 6) across eight combinations, ver sus permutation null. The shaded r egion marks the 90% confidence interval of the permutation null [ 32 ] ( µ null ≈ 0 . 06 , dotted). All observed values e xceed the null baseline, con- firming genuine shar ed structure, yet r emain bounded ( < 0 . 21 ). The solid line denotes the observed mean ( µ obs = 0 . 169 ). L2A pairings show higher overlap than GMU pairings, suggesting that accent diversity impr oves separation. Feature definitions follow established conv entions [ 1 , 26 ], but the y were not explicitly optimised for geometric separability . Future work should assess whether learned representations [ 4 , 5 ] yield stronger separation. Finally , the PCA-based confound measure captures only linear structure and may overlook non- linear interactions; kernel-based alternatives could offer more sensitiv e detection of subtle dependencies. 6. Conclusion Speech-based clinical tools require geometric separability of pathological features from accent variation. W e presented a four-metric clustering frame work ev aluated across six cor- pora and eight combinations, establishing a consistent hierar- chy: emotional features form the tightest clusters (Silhouette: 0 . 250 ± 0 . 057 ), followed by pathological ( 0 . 141 ± 0 . 012 ) and linguistic ( 0 . 077 ± 0 . 016 ). Confound analysis sho ws that patho- logical–linguistic overlap remains belo w 0.21, abov e the permu- tation null but bounded for clinical deployment. Trustworthiness analysis ( > 0 . 80 ) confirms embedding fidelity . Our frame work provides actionable guidelines for equitable speech health sys- tems. Future work will extend this analysis to learned neural representations and broader clinical populations. 7. References [1] B. W . Schuller, “Speech emotion recognition: T wo decades in a nutshell, benchmarks, and ongoing trends, ” IEEE T ransactions on Affective Computing , v ol. 9, no. 1, pp. 1–20, 2018. [2] Y . Zhou, C. Song, X. Li, L. Zhang, Z. W u, Y . Bian, D. Su, and H. Meng, “Content-Dependent Fine-Grained Speaker Embedding for Zero-Shot Speaker Adaptation in T ext-to-Speech Synthesis, ” pp. 2573–2577, 2022. [3] J. Li, T . Jiang, L. Li, Q. Hong, and B. Xia, “Mutual information- based embedding decoupling for domain generalization in speaker verification, ” in Pr oc. Interspeech , 2023, pp. 3147–3151. [4] A. Baevski, Y . Zhou, A. Mohamed, and M. Auli, “wav2vec 2.0: A framew ork for self-supervised learning of speech representations, ” Advances in neural information processing systems , vol. 33, pp. 12 449–12 460, 2020. [5] W .-N. Hsu, B. Bolte, Y .-H. H. Tsai, K. Lakhotia, R. Salakhutdinov , and A. Mohamed, “Hubert: Self-supervised speech representation learning by masked prediction of hidden units, ” IEEE/ACM tr ans- actions on audio, speech, and language pr ocessing , vol. 29, pp. 3451–3460, 2021. [6] A. Pasad, J.-C. Chou, and K. Livescu, “Layer -wise analysis of a self-supervised speech representation model, ” in 2021 IEEE Auto- matic Speech Recognition and Under standing W orkshop (ASRU) . IEEE, 2021, pp. 914–921. [7] J. Rusz, T . T ykalov a, L. O. Ramig, and E. T ripoliti, “Guidelines for speech recording and acoustic analyses in dysarthrias of mo vement disorders, ” Movement Disor ders , vol. 36, no. 4, pp. 803–814, 2021. [8] J. R. Duffy , Motor Speech Disorders: Substrates, Differ ential Diagnosis, and Management , 4th ed. Elsevier , 2019. [9] J. E. Flege, “Second language speech learning: Theory , findings, and problems, ” Speec h perception and linguistic experience: Issues in cr oss-languag e r esear ch , v ol. 92, no. 1, pp. 233–277, 1995. [10] A. K oenecke, A. Nam, E. Lake, J. Nudell, M. Quarte y , Z. Menge- sha, C. T oups, J. R. Rickford, D. Jurafsky , and S. Goel, “Racial disparities in automated speech recognition, ” Pr oceedings of the national academy of sciences , v ol. 117, no. 14, pp. 7684–7689, 2020. [11] C. Gorrostieta, R. Lotfian, K. T aylor, R. Brutti, and J. Kane, “Gen- der De-Biasing in Speech Emotion Recognition, ” in Interspeech 2019 , 2019, pp. 2823–2827. [12] D. H. Cho, H. S. Oh, S. B. Kim, and S. W . Lee, “Diemo-tts: Disen- tangled emotion representations via self-supervised distillation for cross-speaker emotion transfer in text-to-speech, ” in Pr oc. Inter- speech , 2025, pp. 4373–4377. [13] J. W agner, A. Triantafyllopoulos, H. W ierstorf, M. Schmitt, F . Burkhardt, F . Eyben, and B. W . Schuller, “Dawn of the trans- former era in speech emotion recognition: closing the valence gap, ” IEEE T ransactions on P attern Analysis and Machine Intelligence , vol. 45, no. 9, pp. 10 745–10 759, 2023. [14] P . J. Rousseeuw , “Silhouettes: a graphical aid to the interpretation and validation of cluster analysis, ” Journal of computational and applied mathematics , vol. 20, pp. 53–65, 1987. [15] D. L. Davies and D. W . Bouldin, “ A cluster separation measure, ” IEEE T ransactions on P attern Analysis and Machine Intelligence , vol. 1, no. 2, pp. 224–227, 1979. [16] T . Cali ´ nski and J. Harabasz, “ A dendrite method for cluster anal- ysis, ” Communications in Statistics-theory and Methods , vol. 3, no. 1, pp. 1–27, 1974. [17] C. Hennig, “Cluster-wise assessment of cluster stability , ” Compu- tational Statistics & Data Analysis , vol. 52, no. 1, pp. 258–271, 2007. [18] U. von Luxb urg, “Clustering stability: an overview . found trends mach learn 2 (3): 235–274, ” 2010. [19] H. Kim, M. Hasega wa-Johnson, A. Perlman, J. R. Gunderson, T . S. Huang, K. L. W atkin, S. Frame et al. , “Dysarthric speech database for univ ersal access research. ” in Interspeech , v ol. 2008, 2008, pp. 1741–1744. [20] G. F ant, Acoustic Theory of Speec h Production . The Hague: Mouton, 1970. [21] P . Boersma, “Praat: Doing phonetics by computer, ” http://www . praat.org/, 2001. [22] B. McFee, C. Raffel, D. Liang, D. P . W . Ellis, M. McV icar , E. Bat- tenberg, and O. Nieto, “librosa: Audio and music signal analysis in python, ” in Pr oceedings of the 14th Python in Science Conference (SciPy) , 2015, pp. 18–24. [23] J. P . T eixeira, C. Oliveira, and C. Lopes, “V ocal acoustic analysis– jitter , shimmer and hnr parameters, ” Pr ocedia technology , v ol. 9, pp. 1112–1122, 2013. [24] K. R. Scherer, “V ocal communication of emotion: A revie w of research paradigms, ” Speech communication , v ol. 40, no. 1-2, pp. 99–120, 2003. [25] S. Davis and P . Mermelstein, “Comparison of parametric represen- tations for monosyllabic word recognition in continuously spoken sentences, ” IEEE transactions on acoustics, speec h, and signal pr ocessing , v ol. 28, no. 4, pp. 357–366, 1980. [26] F . Eyben, K. R. Scherer , B. W . Schuller, J. Sundberg, E. Andr ´ e, C. Busso, L. Y . De villers, J. Epps, P . Laukka, S. S. Narayanan et al. , “The gene va minimalistic acoustic parameter set (gemaps) for voice research and affecti ve computing, ” IEEE transactions on affective computing , v ol. 7, no. 2, pp. 190–202, 2016. [27] X. Huang, A. Acero, H.-W . Hon, and R. Reddy , Spoken Language Pr ocessing: A guide to theory , algorithm, and system development . Prentice hall PTR, 2001. [28] R. D. Kent, “Research on speech motor control and its disorders: A revie w and prospective, ” Journal of Communication disor ders , vol. 33, no. 5, pp. 391–428, 2000. [29] B. Kashyap, P . N. Pathirana, M. Horne, L. Power , and D. Sz- mulewicz, “Quantitati ve assessment of speech in cerebellar ataxia using magnitude and phase based cepstrum, ” Annals of biomedical engineering , vol. 48, no. 4, pp. 1322–1336, 2020. [30] L. V an der Maaten and G. Hinton, “V isualizing data using t-sne. ” Journal of mac hine learning r esear ch , vol. 9, no. 11, 2008. [31] B. W . Silv erman, Density estimation for statistics and data analysis . Chapman & Hall, 1986. [32] P . Good, P ermutation, parametric and bootstrap tests of hypotheses . Springer , 2005. [33] S. R. Livingstone and F . A. Russo, “The ryerson audio-visual database of emotional speech and song (ravdess): A dynamic, multimodal set of facial and v ocal expressions in north american english, ” PloS one , vol. 13, no. 5, p. e0196391, 2018. [34] C. Busso, M. Bulut, C.-C. Lee, A. Kazemzadeh, E. Mo wer , S. Kim, J. N. Chang, S. Lee, and S. S. Narayanan, “Iemocap: Interactiv e emotional dyadic motion capture database, ” Languag e r esources and evaluation , v ol. 42, no. 4, pp. 335–359, 2008. [35] G. Zhao, S. Sonsaat, J. Levis, E. Chukharev-Hudilainen, and R. Gutierrez-Osuna, “L2-arctic: A non-native english speech cor - pus, ” in Pr oc. Interspeech , 2018, pp. 2783–2787. [36] F . Pedregosa, G. V aroquaux, A. Gramfort, V . Michel, B. Thirion, O. Grisel, M. Blondel, P . Prettenhofer , R. W eiss, V . Dubourg et al. , “Scikit-learn: Machine learning in python, ” the Journal of mac hine Learning r esear ch , v ol. 12, pp. 2825–2830, 2011. [37] J. V enna and S. Kaski, “Local multidimensional scaling, ” Neural Networks , vol. 19, no. 6-7, pp. 889–899, 2006.
Original Paper
Loading high-quality paper...
Comments & Academic Discussion
Loading comments...
Leave a Comment