Targeted T2-FLAIR Dropout Training Improves Robustness of nnU-Net Glioblastoma Segmentation to Missing T2-FLAIR
Purpose: To determine whether targeted T2 fluid-attenuated inversion recovery (T2-FLAIR) dropout training improves glioblastoma MRI tumor segmentation robustness to missing T2-FLAIR without degrading performance when T2-FLAIR is available. Materials …
Authors: Marco Öchsner, Lena Kaiser, Robert Stahl
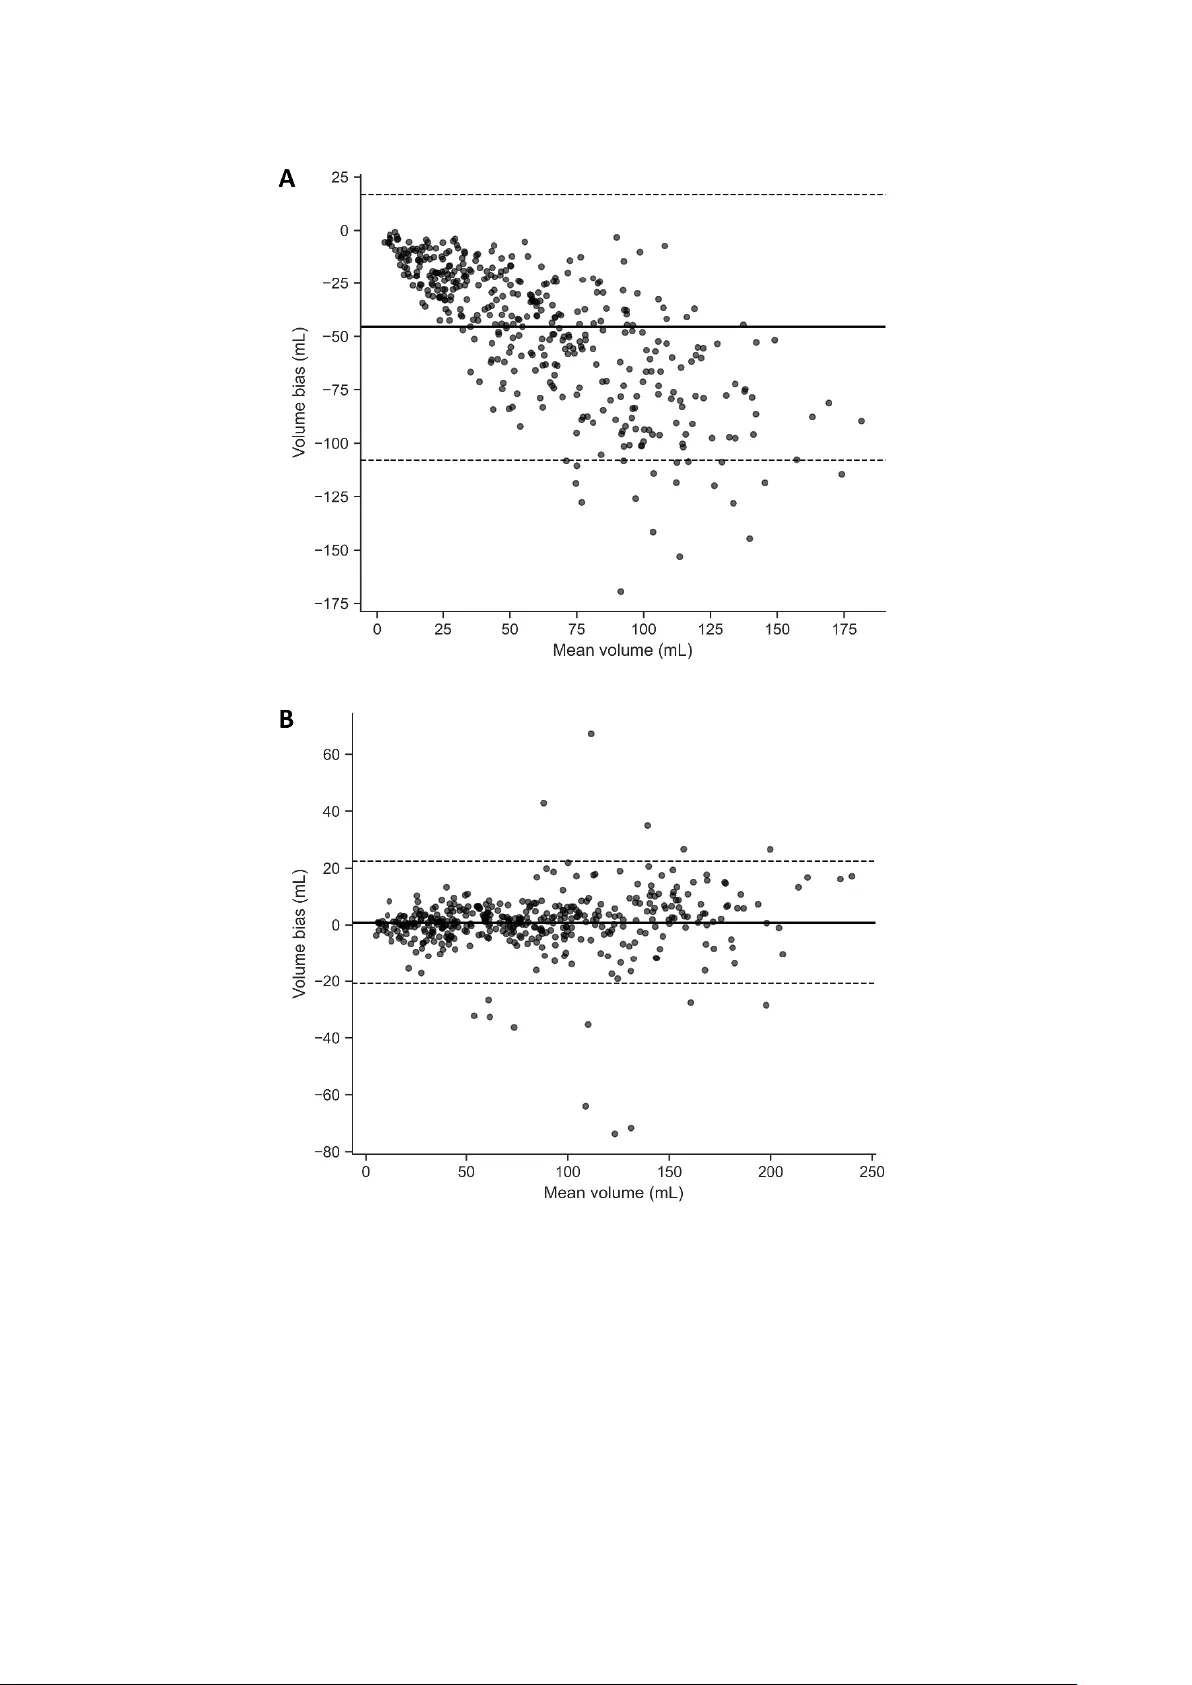
1 This work has been su bmitted to Radiology: Artificial Intelligence for possible pub lication. Copyright may be transferred without notice, after w hich this version may no longer be accessible. Targeted T2-FLAIR Drop out Training Improves Robus tness of nnU -Net Glioblastom a Segmentation to M issing T2 -FLAIR Marco Öchsner 1 , Lena Kaiser 2 , Robert Stahl 1 , Nathalie L. Albert 2,3,4 , Thomas Liebig 1 , Robert Forbrig 1 , Jonas Reis 1 1 Institute of Neuroradiology, LMU University Hospital, LMU Munich, Germany 2 Department of Nuclear Medicine, LMU University Hospital, LMU Munich, Germany 3 German Cancer Consortium (DKTK), Partner site Munich, Munich, Germa ny 4 Bavarian Cancer Research Center (BZKF), Munich, Germany Article type: Original research Summary Targeted T2 fluid-attenuated inversion recovery dropout preserved full -protocol glioblastoma MRI segmentation and improved Dice similar ity coefficient from 66.5% to 92.6% when fluid-attenuated inversion recovery was absent. Key points • With all four MRI sequences available, targeted T2 fluid-attenuated inversion recovery dropout preserved segmentation performance (median overall Dice similarity coefficient, 94.8% with dropout vs 95.0% without dropout). • With T2 fluid-attenuated inversion recove ry withheld at inference, dropout training prevented performance collapse (whole-tumor Dice similarity c oefficient, 60.4% vs 92.6% ; edema Dice similarity coefficient, 14.0% without dropout vs 87.0% with dropout ). 2 • With T2 fluid-attenuated inversion recovery withheld, d ropout training eliminated systematic whole-tumor volume underestima tion (Bland-Altman mean bias, -45.6 mL without dropout vs 0.83 mL with dropout). Abstract Purpose: To determine whether targeted T2 fluid-attenuated inversion recovery (T2-FLAIR) dropout training improves gliob lastoma MRI tumo r segmentation ro bustness to missing T2 ‑ FLAIR without degrading performance when T2 -FLAIR is available. Materials and Methods: This retrospective multi-dataset study d eveloped nnU ‑ Net mod els on BraTS 20 21 (n=848) and externally t ested them on UPenn ‑ GBM glioblastoma MRI (n=403; 2006 – 2018; ag e 18 – 89 y ears; 60% male). Models were trained w ith no dropout or targeted T2 -FLAIR dropout (probability rate (r)=0.35 or 0.50) by replacing only the T2 - FLAIR channel with zeros . Inference used T2 -FLAIR ‑ present and T2 -FLAIR ‑ absent scenarios ( T2 -FLAIR set to zero). The primary endpoint was Dice similarity coefficient (DSC), secondary endpoints were 95th p ercentile Hausdorff distance and Bland-Altman whole ‑ tumor volume bias . Equivalence was assessed with two one ‑ sided tests u sing ±1.5 Dice similarity coefficient percentage points , and noninferiority versus HD ‑ GLIO used a -1.5 ‑ point margin. Results: With T2 -FLAIR p resent, median overall DSC w as 94.8 % (interquartile range, 90 . 0% - 97.1 %) with dropout and 9 5.0% (interquartile range, 90.3%-97 .1%) without dropout (equivalence supported, p< 0.001). With T2 -FLAIR absent, median overall DSC improved from 81.0 % (interquartile ran ge, 75.1%-86.4 %) witho ut dro pout to 9 3.4 % (interquartile range, 89.1%-96.2 %) with dropout (r=0.3 5); edema D SC improved from 14.0% to 87.0% , edema 95th percentile Hau sdorff distance im proved from 22.4 4 mm to 2.45 mm and whole ‑ tumor volume bias improved from -45.6 mL to 0.83 mL. Dropout was noninferior to HD ‑ GLIO under T2 - FLAIR ‑ present (all p<0.001). Conclusion: Targeted T2 -FLAIR dropout preserved segmentation performa nce when T2-FLAIR was available and reduced segmentation error and whole-tumor volume bias when T2 -FLAIR was absent. Introduction Glioblastoma is the most common malignant primary brain tu mor in adults and requ ires assessment of contrast ‑ enhancing and non ‑ enhancing components f or treatment planning 3 and response assessment [1 , 2] . Because manual delineation of tumor compartments is time ‑ consuming and subject t o inter ‑ reader variability, autom ated MRI tumor segmentation has become a key tool for quantitative volumetry and radiomics [3]. Deep learning methods, particularly U ‑ Net-style architectures and self ‑ configuring frameworks such as nnU ‑ Net, have achieved strong performance and a re increasingly used as standard backbones for brai n tumor segmentation [4 , 5] . The Multimodal Brain Tumor Segmentation (BraTS) challenges have accelerated this progress by pro viding large, multi ‑ institutional datasets with st andardized annotations of tumo r sub compartments [6 , 7] . However, most h igh ‑ performing pipelines assume that a complete four ‑ sequence structural MRI pro tocol (T1 ‑ weighted, p ost-contrast T1 ‑ weighted (T1-CE), T2 ‑ weighted, and T2 -fluid-attenuated inversion recovery ( T2 -FLAIR)) is available both during training and deployment [4 , 8] . In routine p ractice and in retrospective cohorts, p rotocol comp leteness cannot be assumed . Sequences may be absent, non-diagnostic due to motion or other artefacts, or acquired w ith incompatible parameters, creating a common mismatch between model development conditions and dep loyment reality [9 , 10 , 11] . When models trained exclusively on complete four ‑ sequence inputs are applied to studies lacking a usable sequence, segmentation q uality can degrade substantially, potentially exclu ding patients from downstr eam analyses and introducing selection bias. Th is issue is p articularly consequential for T2 -FLAIR-dependent targets, including peritumoral edema and non ‑ enhancing tumor, which contrib ute to comprehensive disease burden assessment [2]. Several strategies have b een proposed to improve ro bustness to missing MRI modalities. One approach imputes missing se q uences, synthesizing the a bsent modality using generativ e adversarial networks [10, 12] , or variational autoencoders [13] , enabling inference with models that expect complete inputs. Other approaches lear n modality ‑ specific representations that can be combined from whichever inputs is available [14] , or they train multiple modality-subset-specific models and sel ect an ap propriate model at inference based on availab le sequences [11]. An altern ative is sequence (modality) d ropout train ing, in which selected modalities are replaced with a sentinel (commonly zeros) during training , so the network learns to tolerate missing sequences without architectural changes. Prior work demonstrates that sequence dropout can prese rve performance when all sequences are available while improving robustness when one or more sequences are missing [15 , 16 ,17]. However, most prio r sequence-dropout studies emphasize robustness across multiple 4 missing-sequence combinations and p rovide comparatively limited external testing on independent clinical cohorts. In contrast, o ur stu dy focuses on the clinical ly common scenario of absent or non-diagnostic T2-FLAIR and evaluates the deployment ‑ relevant trade ‑ off explicitly: no performance loss when T2 - FLAIR is availab le versus robust performance when T2 -FLAIR is absent . Therefore, th e purpose of this multi-dataset study was to d evelop and externally test an nnU ‑ Net-based gliob lastoma segmentation pipeline that is rob ust to missing T2 -FLAIR using a targeted T2 -FLAIR dropout training scheme at two fixed dropout probabilities. We hypothesized that (i) targeted FLAIR dropout training would maintain segmentation quality wh en T2 -FLAIR is present at inference, yielding Dice similarity comparable to a st andard f our ‑ sequence nnU ‑ Net, and (ii) in a prespecified T2 -FLAIR ‑ absent deployment scenario, dropout ‑ trained models w ould substantially outperform standard four-sequence models for T2 -FLAIR ‑ dependent targets on both b enchmark development data and an independent clinical external test cohort. Methods Study design and reporting This retrospective multi ‑ dataset study used only publicly available, de-identified imaging datasets. Accordingly, ethics approval and inform ed c onsent were n ot re quired, and the study involved no interaction with human part icipants. Report ing followed the Metrics Reloaded recommendations for image analysis validation, the Checklist for Arti ficial Intelligence in Medical Imaging (CLAIM) and its 2024 update; a completed c hecklist is provided in the Supplement [18 , 19 ,20]. Datasets and reference standard We used the RSNA ‑ ASNR ‑ MICCAI BraTS 2021 training dataset , excluding the University of Pennsylvania glioblastoma cohort (UPenn ‑ GBM ), for model development and internal testing [7 ,21]. Organizer-prepr ocessed a four s tructural s equence MRI (T1, contrast ‑ enhanced T 1 ‑ CE, T2, and T2 ‑ FLAIR, 1 mm resolution, all co -registered to the T1 image and skull-stripped), and expert t umor segmenta tions were used (BraTS n = 848 ). The d ata ar e acq uired a t vari ous si tes and utilize different protocols and scanners. External testing used the UPenn ‑ GBM cohort (n = 403) comprising baseline pre ‑ treatment MRI and expert ‑ revised tumor segmentations [21, 22 , 23] , formally part of the BraTS training dataset but excluded in our study from all model training, to serve as an external validation 5 dataset . We included cases w ith (i) an available st ructural MRI in cluding at least T1, T1 ‑ CE, and T2, and (ii) an availabl e reference s tandard segmentatio n, T2 -FLAIR was not required b ecause one prespecified test scenario assumes T2 -FLAIR is absent. Reference standard In both datasets, the reference standard segmentation comprises necrotic/non ‑ enhancing tumor (NCR/NET), peritumoral edema (ED), and enhan cing tumor (ET) prov ided by the d ataset creators [7 ,21]. No manual edits were performed. Output encodings and inference scenarios We evaluated t wo output encodings: label ‑ wise (NCR/NET, ED, ET; origin al BraTS label convention) and region ‑ wise as used in clinical reporting (whole tumor [ WT = NCR/NET ∪ ED ∪ ET ], tumor core [ TC = NCR/NET ∪ ET ], and ET). Two prespecified inference scenarios wer e evaluated: T2 -FLAIR ‑ present (T1, T1 ‑ CE, T2, T2 -FLAIR) and T2 -FLAIR ‑ absent, implemented by replacing the T2 -FLAIR channel w ith zeros after preprocessing/normalization and immediately prior to network inference. No synthetic T2 - FLAIR was generated. Model architecture and targeted T2 -FLAIR dropout training All models used the nnU ‑ Net framework in 3D full ‑ resolution [5]. We train ed six model configurations : {lab el-wise, region-wise} × { T2 -FLAIR dro pout probability rat e (r)=0 .0, 0.35, 0.50} . For the T2 -FLAIR dropout models, we imple mented t argeted sequence dropout: the T2 - FLAIR channel was replaced with z eros during training with p robability p per training samp le, while T1, T1 ‑ CE, and T2 were never dropped. Training, internal testing and external testing Models were trained o n BraTS 2021 using patient -level f ive-fold cross- validation (80% training / 20% validation within each fold ) with nn U ‑ Net default training settings with the default number of epochs p er fold (n= 1,000). The checkpoint with the h ighest mean foreground D SC on the validation set was selected per fold , and at inference the cross-validat ion ensemble was used for each configuration . External testing applied trained configuration to all UPenn ‑ GBM cases under both prespecified inference scenarios ( T2 -FLAIR ‑ present and T2 - FLAIR ‑ absent). No UPenn ‑ GBM data were used for training, parameter tuning, or model selection. Comparator tool (HD ‑ GLIO) 6 We ben chmarked the best ‑ performing dropout configuration against HD ‑ GLIO, an established nnU ‑ Net-based brain tumor segmentation t ool [8] , on UPenn-GBM under the T2 - FLAIR-present scenario using prespecified endpoint correspondences. Performance metrics and statistical analysis The primary endpoint was the D ice similarity coefficient (DSC) computed per patient and per target. Secondary endpoints included the 95th percen tile Hausdorff distance (HD95) and volume agreement. Volumetric agreement was assessed using Bland -Altman analysis (predicted − reference standard, mL). For inferential comparisons, equivalence of T2 - FLAIR-present performance w as assessed u sing two one -sided tests (TOST) with prespecified bounds of ±1.5 DSC percentage points, and non -inferiority versus HD-GLIO used th e same margin, as this represents a negligible d ifference for these types of volumetric analyses . 95% Confidence intervals were estimated by bootstrap re sampling over patients (2,00 0 replicates) . All analyses were conducted in Python (v3.12) using PyTor ch 2.8, NumPy 2.3.3, SciPy 1.16.2, and pandas 2.3.3. Results Results are reported as median [Q1-Q3] across pat ients. Region ‑ wise performance is summarized in Table 1, and label ‑ wise performance in Supplementary Table S1. Overall performance with T2 -FLAI R available In the T2 -FLAIR ‑ present scenario , t argeted T2 -FLAIR drop out traini ng did not measurably degrade segmentation performance re lative to standard four ‑ sequence training (Table 1 , Supplementary Tab le S1). For region ‑ w ise models, overall DSC was unchanged (r =0 : 95.0% [90.3-97.1], r=0.35: 94.8% [9 0.0-97.1]), with comparable boundary error (HD95 r=0: 1.61 mm [1.14-2.72], r=0.35: 1.55 mm [1.14- 2.74]). Class ‑ wise performance f or WT, TC, and ET was similarly sta ble across dropout set tings (Tabl e 1), an d t he label ‑ wise mo dels sho wed the same pattern across NCR/NET, ED, and ET (Supplementary Ta ble S1). E quivalence testing su pported equivalence of r=0.35 versus r=0.0 within ±1.5 DSC percentage points acro ss endpoints in the T2 -FLAIR ‑ present setting (TOST p<0.001 throughout , see Table 2 and Supplementary Table S2). Performance without T2 -FLAIR In the T2 -FLAIR ‑ absent scenario, standard four ‑ sequ ence models trained without dropout showed a pronoun ced performan ce collap se in t argets th at d epend strongly on T2 -FLAIR 7 signal, whereas d ropout ‑ trained models maintained h igh performance ( see Table 1 and Supplementary Ta ble S1). For region ‑ wise models, overall DSC decreased to 81.0% [75.1-86.4] without dropout but remained high with dropout (r=0 .35: 93.4% [89.1-96.2], r=0.5: 93.7% [89.1-96.2]). The larges t improvements were observed f or WT: WT DSC i ncreased from 60.4% [45.7-71.9] (r=0.0) to 92.6% [88.7-95.2] (r=0.35) (Table 1, Figures 1-2). The label ‑ wise models demon strated the same failure mode centered on ed ema (Supplementary Table S1). Wit hout dropout, edema DSC dropped t o 14.0% [3 .0 -28.0] with large boundary error (HD95 22.44 mm [16.43 -31.03]). With dropout, edema performance recovered t o 87.0% [78.0-92.0] (HD95 2.45 mm [1.73 -4.69]) at r=0.35 and 88 .0% [79.0 -92.0] (HD95 2.24 mm [1.73-4.64]) at r=0.5 (Supplementary Table S1). Consistent with these large shifts, equivalence was not supported for r=0.35 versu s r=0.0 in the T2 -FLAIR ‑ absent setting (TOST p≈1 across endpoints, Table 2 and Supplementary Tab le S2), reflecting differences far exceeding the ±1.5 percentage ‑ point equivalence margin. Sensitivity to dropout probability rate Differences between r= 0.35 an d r= 0.50 d ropout were small i n bo th inference scenarios. Median paired differences were minimal, and equivalence within ±1.5 DSC percentage points was supported across endpoints (TOST p<0.001 , Table 3 and Supplementary Table S3). Taken together, r=0.35 provided robust T2 -FLAIR ‑ absent performance while preserving T2 - FLAIR ‑ present accuracy. Volume bias and agreement Bland-Altman analysis of whole ‑ tumor volume in the T2 -FLAIR ‑ absent scenario d emonstrated pronounced systematic under ‑ segmentation for the no ‑ dropout region model, with mean volume bias (predicted - reference standard) o f -45.6 mL (95% bootstrap C I -48.8 to -42.6 mL) and wide limits of agreement (-108.0 to 16.8 mL). In contrast, dropout training largely eliminated t his bias: the r=0 .35 model showed a mean bias of 0.8 3 mL (95% CI -0.28 to 1.92 mL) with t ighter limits of agreement (-20.8 to 22.5 mL). A similar pattern was observed for r=0.5 (bias 0.36 mL, limits of agreement - 21.2 to 22 .0 mL). Bland- Altman plot s f or r=0.0 and r=0.35 are shown in Figure 3. Comparison to an established tool (HD ‑ GLIO) Under the T2 -FLAIR ‑ present scenario, we benchmarked the r=0.35 dropout models against HD ‑ GLIO using the pres pecified e ndpoint corr espondences (ET vs CE, edema vs NE , and WT vs NE+CE). Across all endpoints, the r=0.35 models were non ‑ inferior (all p<0.001 , Table 4) and 8 achieved higher median DSC: edema 91. 77% [84.91-95.55] versus 87.68% [78.30-92.30], enhancing tumor 93.96% [87.49-96.80] versus 90.31% [ 83.79-93.40], and whole t umor 95.65% [91.94-97.81] versus 91.01% [84.77-94.24] (Table 4). Discussion In t his multi-dataset study we evaluated a pragmatic application q uestion: can targeted T2 - FLAIR d ropout training improve robustness to missing or non-diagnostic T2 -FLAIR without degrading performance when T2 -FLAIR is available? Across both label ‑ and region ‑ wise nnU ‑ Net models, the results su pport an affirmative answer. When all f our sequences were provided, dropout ‑ trained models achieved segmentation performance that was st atistically equivalent to standard four ‑ sequence training within prespecified equivalence bounds, indicating no meas urable penalt y in the complete protocol setting. In contrast, when T2 -FLAIR was withheld at infer ence to emulate an in complete-protocol sc enario, con ventional four ‑ sequence models show ed a marked performan ce collapse for T2 -FLAIR ‑ dependent targets, most prominently edema and whole tumor, while T2 -FLAIR dropout models largely preserved accuracy. Im provements were reflected in boundary erro r and were clinically meaningful in volumetric terms, shifting w hole ‑ tumor volume bias from substantial underestimation tow ard near ‑ zero. Together, these findings p rovide evidence that a simp le, targeted training intervention can prevent catastr ophic f ailures when a key seq uence is absent while maintaining performance when it is present [5 ,7, 21] . Prior work has p roposed several strategies for handling missing MRI modalities includ ing modality comp letion (e.g., generative synthesis of missing sequences) [10 ,12], jo int completion ‑ segmentation approaches [24 , 25] and hetero ‑ modal representation learning [14]. Sequence/modality dropout is a compleme ntary strategy in w hich the seg mentation network is trained to tolerate absent inputs without architectural changes. Feng and colleagues demonstrated t hat se quence dropout can prese rve p erformance when all sequences a re available and improve ro bustness when s equences are missi ng i n BraTS - style tumor segmentation [17]. Our w ork is complementary bu t distinct i n its deploy ment orientation: w e (i) t arget the clinically common f ailure mode of missing or absent or non-diagnostic T2 -FLAIR rather than modeling arbitrary missingness patterns, (ii) externally val id ate our models on the UPenn-GBM data with expert reference standard segmentations, and (iii) quantify deployment consequences u sing equivalence testing (to est ablish preserved performance 9 when T2 -FLAIR is pres ent) an d B land-Altman volumetry (to measure systematic bias when T2 - FLAIR is absent). The observed error pattern in th e T2 - FLAIR-absent setting is mechanistically p lausible and clinically interpretable. Ed ema and non ‑ enhancing tumor components are typically characterized by T2/ T2 -FLAIR h yperintensity, a mo del trained exclusively on complete four ‑ sequence inputs can implicitly learn a reliance on T2 -FLAIR for t hese targets and fail to exploit complementary cues f rom T2 ‑ weighted imagin g alone. Targeted T2 - FLAIR dropout repeatedly exposes the n etwork to a mixture of complete and T2 -FLAIR-absent inputs durin g training, encouraging reliance on redundant i nformation in the remain ing contrasts and reducing sensitivity to a single missing channel . The relative stability of en hancing tumor segmentation across conditions is expected because it is driven primarily by the T1 ‑ CE signal [2 , 7] . Practically, t his matters for both retrospective multi ‑ center research and clinical pipelines : missing or u nusable T2 -FLAIR can reduce cohort size and introduce selection b ias, and systematic under-segmentation of whole tumor can compromise volu metry and derived biomarkers. The marked improvement in Bland-Altman whole-tumo r volume b ias in th e no ‑ T2 -FLAIR setting suggests that the benefit extends beyond voxel overlap and supports more reliable q uantitative volumetry, which is a central requirement for downs tream response assessment and radiomics. Performance was similar for 35% and 50% T2 -FLAIR dropout, suggesting that a singl e default dro pout (e .g., r=0.35) may be sufficient f or many pipelines and that robustness is driven primarily by exposure to missing T2 -FLAIR inputs rather than by fine calibration of the dropout probability rate. Benchmarking against an established tool (HD -GLIO) further suggests that the proposed approach is competitive u nder the T2 - FLAIR-present condition, although such com parisons are inherently sensitive to differences i n preprocessing, training dat a, and label conventions [8]. For these reasons, benchmarking is most informative as a practical performance reference rather than a definitive head ‑ to ‑ head determination. This study has several limitations. First , although UPenn ‑ GBM provides a large independent external test cohort, it represents a single center; multi ‑ site external testing would further strengthen evidence of generalizability across scanners, vendors, and acquisition protocols. Second, the “missing T2 - FLAIR” cond ition was implemented in a controlled and reproducible manner by replacing the T2 -FLAIR channel with zeros at inference for all participants. This 10 design does n ot fully capture failure modes such as motion ‑ degraded T2 -FLAIR, p artial coverage, intensity non -standardization, or mis ‑ registration, and as such requires identification of low-quality acquisitions. Third, we evaluated a targeted missingness pattern ( T2 -FLAIR), and robustness to other missin g sequences (e.g., T1 -CE) or combinations of missing/low-quality inputs may require different strategies and remains to be studied . Consequently, future work should evaluate the approach under more realistic missingnes s and degradation patterns, and across additional external cohorts with genuinely missing or non ‑ diagnostic T2 ‑ FLAIR. Given that abbreviated MRI protocols are som etimes used in time ‑ constrained or motion ‑ prone settings, future studies should also assess whether segmentation performance and volumetric agreement remain acceptable when T2 ‑ FLAIR is omitted for segmentati on ‑ driven endpoints (e.g., volu metry), while separately conf irming diagnostic adequacy for routine clinical interpretation . Direct c omparison against a de dicated three-sequence model tr ained without T2 -FLAIR would also help q uantify the p ractical benefit of a single robust model versus modality-specific deployment strategies. In conclusion, targeted T2 -FLAIR dropout training within an nnU ‑ Net segmentation pipeline provided a practical and ef fective strategy for robu st glioblastoma MRI segmentat ion in a common deployment scenario of missing or unusable T2 -FLAIR. This approach maintained performance when T2 -FLAIR was available and substantially mitigated performance collapse, boundary error, and volumetric bias when T2 -FLAIR was ab sent, without architectural changes or additional synthesis components. These results support targeted sequence dropout as a low ‑ friction default strategy for multi ‑ cen ter glioblastom a segmentation w orkflows and for retrospective cohorts where protocol completeness cannot be assumed . Acknowledgement s Generative ar tificial i n telligence (AI) w as used f or man uscript preparation only. ChatGPT (OpenAI; GPT-5.2) was used to improve clarity and scientific tone. The authors performed all study conceptualization, an alyses, interpretati on, and critical reasoning, and take full responsibility for the final man uscript. N o pa tient-identifiable or confidential in formation was entered into the AI tool. Data and Code sha ring stateme nt 11 Data availability: No new imaging data were generated for this study. The MRI data and reference standard segmentations used for model development and extern al testing are available from public repositories under their respective data use agreements (e.g., BraTS 2021 and UPenn ‑ GBM). The authors did not redistribute these datasets. Code availability: All code used for preprocessing, training, inference, and st atistical an alysis is stored in a GitHub repository and will be made available to readers as described b elow: GitHub repository: https://github.com/LMU-NRAD/FLAIR-dopout Release status: private during peer review, to be made public upon acceptance License: Apache-2.0 References 1. Weller, M ., et al., EANO guidelines on the diagnosis and treatment of diffu se gliomas of adulthood. N at Rev Clin Oncol, 2021. 18 (3): p. 170-186. doi: 10.10 38/s41571-020-00 447-z. 2. Wen, P .Y., et al., RANO 2.0: Update to the Response Ass ess ment in Neuro-Oncology Criteria for High- an d Low-Grade Gli omas in Adults. J Cli n On col, 2023. 41 (33): p. 51 87-5199. doi : 10.1200/JCO.23.0 1059. 3. Kruser, T.J., et al., NRG brain tumor specialists consensus guidelines for glioblastoma contouring. J Neuro oncol, 2019. 14 3 (1): p. 157-166. d oi: 10.1007 /s11060-019-03152-9. 4. Dorfner, F.J., et al., A revie w of deep learning fo r b r ain tumor analysis in MRI. NPJ Precis Oncol , 2025. 9 (1): p. 2. d oi: 10.1038/s41698-02 4-00789-2. 5. Isensee, F., et al., nnU -Net: a self-configuring method for deep learning-based biomedical image segmentation. N at Methods, 20 21. 18 (2): p. 203-211. doi : 10.1038 /s41592-020-01008- z. 6. Menze, B.H., et al., The Multimodal Brain Tumor Image Segmentation Benchmark (BRATS). IEEE Trans Med Imaging , 2015. 34 (10): p. 1993-2024. doi: 10.11 09/TMI.2014.2 377694. 7. Baid, U., et al., The RSNA-ASNR-MICCAI BraTS 2021 Bench mark on Brain Tumor Segmentation and Radiogeno mic Classifica tion. arXiv 2021. doi : 10.48550/arXiv.2 107.02314. 8. Kickingereder, P., e t al., Automated q uantitative tumour response assessment of MRI in neuro- oncology with ar tificial neural networks: a multicentre, retrospective study. Lancet Oncol, 2019. 20 (5) : p. 728-740. doi: 1 0.1016/S1470-20 45(19)3009 8-1. 9. Tajbakhsh, N., et al., Embracing imperfect datasets: A review of deep learning solutions for medical image segmentatio n. M ed Image Anal, 2020. 63 : p. 101693. doi: 10.1016/j.media.2 020.10169 3. 12 10. Moshe, Y.H., et al., Handling Missing MRI Data in Br ain Tumors Classification Tasks: Usage of Synthetic Image s vs. Dup licate Images and Em pty I mages. J Magn Res on Imaging, 2024. 60 (2): p. 561-573. doi: 1 0.1002/jmri.290 72. 11. Ruffle, J.K., et al., Brain tumour segmentation with incomplete imaging data. Brain Commun, 2023. 5 (2): p. fcad1 18. doi: 10.10 93/braincomms /fcad118. 12. Conte, G.M., et al., Genera tive Adversarial Networks to Synthesize Missing T1 and FLAIR M RI Sequences for Use in a Multisequence Brain Tumor Segmentation Model. Radiology, 2021. 299 (2): p. 313-323. doi: 10.1148 /radiol.202120 3786. 13. Hamghalam, M., et al. Modality Completion via Gaussian Process Prior Variational Autoencoders for Multi-modal Glioma Segmentation . in Medical Image Computing and Computer Assisted Interven tion – MICCA I 2021 . 202 1. Cham: Springer International Publishing. doi: 10.1007/978-3-0 30-87234-2_42. 14. Havaei, M., et al. HeMIS: Hetero-Modal Image Segment ation . in Medical Image Computing and Computer-Assisted Inte rvention – MICCAI 2016 . 2016. Cham: Springer International Publishing. doi: 10.1007/978-3-3 19-46723-8_54. 15. Xing, J. and J. Zhang, Segmentation of Br ain Tumors Using a Multi-Modal Segment Anything Model (MSAM) with Missing M odality Adaptation. Bioengineerin g (Basel), 2025. 12 (8). doi: 10.3390/bioeng ineering12 080871 . 16. Novosad, P., R.A.D. Carano, and A.P. Krishnan. A Task-Conditiona l Mixture- of -Experts Model for Missing Modali ty Segmentation . in M edical Imag e Computing and Computer Assis ted Intervention – MICCAI 2024 . 2024. Cham: Springer Nature Switzerland. doi: 10.1007/978-3- 031-72114-4. 17. Feng, X., et al., Brain Tumor S egmentation for Multi-Modal MRI with Missing Information. J Digit Imaging, 2 023. 36 (5): p. 2075-2087. d oi: 10.1007 /s10278-023-00 860-7. 18. Maier-Hein, L., et al., Metrics reloaded: recommend ations for image analysis valid ation. Nat Methods, 2024. 21 (2): p. 1 95-212. doi: 10.103 8/s41592-023-021 51-z. 19. Tejani, A.S., et al., Checklis t for Ar tificial Intelligence in M edical Imaging (CL AIM): 2024 Update. Radiol Artif Intell, 2024. 6 (4): p. e 240300. doi: 10.1 148/ryai.24 0300. 20. Mongan, J., L. Moy, and C.E. Kahn, Jr., Checklist for Artificial Intelligence in Medical Imaging (CLAIM): A Guide for Authors and Reviewers. Radiol Artif Intell, 2020. 2 (2): p. e200029. doi: 10.1148/ryai. 2020200029. 21. Bakas, S., et al., The University of Pennsylvania glioblastoma (UPenn-GBM) cohort: advanced MRI, clinical, genomics, & radiomics. Sci Data, 2022. 9 (1): p. 453. doi: 10.1038/s41597-022- 01560-7. 13 22. Clark, K., et al., The Cancer Imaging Archive ( TCIA): maintainin g and operatin g a public information repository. J Digit Imaging, 2013. 26 (6): p. 1045-57. doi: 10.1007/s102 78-013- 9622-7. 23. Bakas, S., et al., Multi-parametric magnetic resonance imaging (mpMRI) scans for de novo Glioblastoma (G BM) patien ts from the University of Pennsylva nia Health System (UPENN-GBM) (Version 2) [Data s et]. The Cancer I maging Archiv e., 2021. doi: 10.1038 /s41597-022-01560- 7. 24. Zhou, T., et al., Latent Correla tion Representation Learning for Brain Tumor Segmentation With Missing MRI Modalities. IEEE Transactions on Image Processing, 2021. 30 : p. 4263-4274. doi: 10.1109/TIP.202 1.3070752. 25. Dorent, R., et al. Hetero- Modal Variational Encoder-Decoder for Joint Modality Completion and Segmentation . in Medical Image Computing and Computer Assisted Interventi on – M ICCAI 2019 . 2019. Cham : Springer In ternational Publishin g. doi: 10.1007 /978-3-030-32245-8. 14 Tables Table 1: External testing on UPenn ‑ GBM (n=403): segmentation p erformance of region ‑ wise models with and without T2 -FLAIR at inference. Performance of region ‑ wise nnU ‑ Net models (WT, TC, ET ) trained on BraTS 2021 with targeted T2 -FLAIR d ropout probability p = 0.0, 0.35, 0.50 and evaluated under two prespecified inference scenarios: T2 -FLAIR ‑ present (all four sequences p rovided) and FLAIR ‑ absent ( T2 - FLAIR channel replaced with zer os). Values are median [Q1- Q3] across patients. Overall denotes th e unweighted macro ‑ average across WT, TC, and ET. Metrics/abbreviations: DSC = Dice similarity coefficient (report ed as %); HD95 = 95th ‑ percentile Hausdorff distance (mm); WT = w hole tumor; TC = tumor core; ET = enhancing tumor; FLAIR = fluid ‑ attenuated inversion recovery; r = dropout probability rate. Overall Whole Tumor Enhancing Tum or Tumor Cor e T2 -FLAIR drop for training DSC med [Q1-Q3] HD 95 med [Q1-Q3] DSC med [Q1-Q3] HD 95 med [Q1-Q3] DSC med [Q1-Q3] 95HD med [Q1-Q3] DSC med [Q1-Q3] HD 95 med [Q1-Q3] Segmentation with FL AIR input r =0 .0 95.0 [90.3- 97.1] 1.61 [1.14- 2.72] 95.5 [91.9- 97.8] 1.73 [1.00- 3.32] 94.1 [87.6- 96.8] 1.00 [1.00- 1.41] 96 .5 [ 92 .9- 98 .1] 1.41 [1.00- 2.45] r=0.35 94.8 [90.0- 97.1] 1.55 [1.14- 2.74] 95.6 [91.9- 97.8] 1.62 [1.00- 3.32] 94.0 [87.5- 96.8] 1.00 [1.00- 1.41] 96.4 [92.9- 98.0] 1.41 [1.00- 2.45] r=0.5 94.8 [90.2- 97.0] 1.61 [1.14- 2.71] 95.3 [91.9- 97.7] 1.73 [1.00- 3.46] 93.7 [87.4- 96.7] 1.00 [1.00- 1.41] 96.5 [92.8- 98.1] 1.41 [1.00- 2.45] Segmentation witho ut FLAIR input r =0 .0 81.0 [75.1- 86.4] 7.59 [5.31- 11.21] 60.4 [45.7- 71.9] 17.24 [11.66- 24.20] 92.4 [86.3- 95.6] 1.00 [1.00- 1.73] 94 .4 [ 89 .8- 96 .7] 2.45 [1.73- 4.58] r=0.35 93.4 [89.1- 96.2] 2.02 [1.41- 3.41] 92.6 [88.7- 95.2] 2.45 [1.73- 5.00] 93.5 [87.5- 96.4] 1.00 [1.00- 1.41] 96 . 2 [ 92 .4- 97 .8] 1.73 [1.00- 2.83] r=0.5 93.7 [89.1- 96.2] 2.03 [1.41- 3.46] 93.0 [89.4- 95.7] 2.24 [1.41- 4.64] 93.7 [87.4- 96.5] 1.00 [1.00- 1.41] 96.2 [ 92 .5- 97 .8] 1.73 [1.00- 2.83] 15 Table 2: External testing on UPenn ‑ GBM (n=403): equ ivalence testing (TOST) f or r=0 .35 vs r=0.0 across inference scenarios (region ‑ wise). Paired c omparison o f region ‑ wise mo dels trained with targeted T2 -FLAIR d ropout ( r=0.35) versu s no d ropout ( r=0.0) under T2 - FLAIR ‑ present and T2 -FLAIR ‑ absent i nference scenarios. Entries report the median paired DSC difference (r =0.35 − r=0.0) in DSC p ercentage points, with 95% bootstrap confidence intervals. TOST p ‑ values test equivalence within prespecified bounds of ±1.5 DSC percentage points (α=0.05). Abbreviations: TOST = two one ‑ sided tests; DSC = Dice similarity coefficient; WT = wh ole tumor; TC = tumor cor e; ET = enhancing tumor; FLAIR = fluid ‑ attenuated i n version recovery; r = dropout probability rate. Median DSC r(0.35) -r(0.0) [95%CI ] TOST p-Value Segmentation with T2 -FLAIR i nput Overall -0.0 17 [-0.0 46 , 0.0 14 ] <0.001 ET -0.04 [-0.094, -0.006 ] <0.001 TC -0.011 [-0.0 40 , 0. 015] <0.001 WT -0.005 [-0.029, 0.023 ] <0.001 Segmentation witho ut T2 -FLAIR input Overall 11.35 [ 10 . 63 , 12.21 ] 1 ET 0.75 [0.6 63 , 0.837] 0.98 TC 1.12 [0.97 , 1.29] 1 WT 31.1 [28.2, 33.48] 1 16 Table 3: External testing on UPenn ‑ GBM (n=403): equ ivalence testing (TOST) f or r=0 .35 vs r=0.50 across in ference scenario s (region ‑ wise). Pa ired comparison of region ‑ wise mo dels trained with targeted T2 -FLAIR dropout probabilities r=0.35 versus r=0.50, evaluated under T2 -FLAIR ‑ present an d FLAIR ‑ absent inference scenarios. En tries r ep ort th e med ian paired DSC difference (r =0.35 − r=0.50) in DSC p ercentage points, with 95% b ootstrap confidence intervals. TOST p ‑ values test equivalence within ±1.5 DSC percentage points (α=0.05). Abbreviations: TOST = two one ‑ sided tests; DSC = Dice similarity coefficient; WT = wh ole tumor; TC = tumor cor e; ET = enhancing tumor; FLAIR = fluid ‑ attenuated i n version recovery; r = dropout probability rate. Median DSC r(0.35) -r(0.50) [95%CI ] TOST p-Value Segmentation with T2 -FLAIR i nput Overall 0.0 75 [0.0 49 , 0. 093 ] <0.001 ET 0.034 [0.003, 0.066 ] <0.001 TC 0.0 49 [0.0 28 , 0. 067 ] <0.001 WT 0.075 [0.038, 0.108 ] <0.001 Segmentation witho ut T2 -FLAIR input Overall -0.1 13 [-0.1 46 , - 0. 076] <0.001 ET -0.061 [-0.10, -0.006 ] <0.001 TC - 0. 035 [- 0.054 , - 0. 018] <0.001 WT -0.201 [-0.233, -0.140] <0.001 17 Table 4: External testing on UPenn ‑ GBM (n=403): non ‑ inferiority of r=0.35 dropout models versus HD ‑ GLIO (FLAIR ‑ present scenario). Comparison of targeted T2 -FLAIR dropout models (r=0.35) with HD ‑ GLIO under the T2 -FLAIR ‑ present inference scenario. Endpoints were compared using the following p respecified correspondences: ET (BraTS) vs CE (HD ‑ GLIO); ED (BraTS label ‑ wise edema) vs NE (HD ‑ GLIO); and WT (BraTS region ‑ wise) vs N E+CE (HD ‑ GLIO). Values are median DSC (%) [Q1- Q3]. “Median ΔDSC” d enotes the paired med ian difference (model − HD ‑ GLIO) in DSC per centage points. Non ‑ inferiority p ‑ values correspond to a one ‑ sided test with a prespecified non ‑ inferiority margin of −1.5 DSC percentage points (α=0.05). Abbreviations: DSC = D ice similarity coefficient; ET = enhancin g tumor; ED = edema; WT = whole tumor; CE = contrast enhancing; NE = non ‑ enhancing; r = dropout probability rate. BraTS Label/Region HD -Glio Label r=0.35 Median DSC (%) [Q1-Q3] HD -GLIO Median DSC (%) [Q1-Q3] Median Δ DSC (%) (model - HD) Non-inferior p-Valu e Edema NE 91.77 [84.91-95.55] 87.68 [78.30-92.30] 3.158 [2.733, 3.792 ] <0.001 ET CE 93.96 [87.49-96.80] 90.31 [83.79-93.40] 3.026 [2.698, 3.262 ] <0.001 WT NE+CE 95.65 [91.94-97.81] 91.01 [84.77-94.24] 4.087 [3.702, 4.360 ] <0.001 18 Figure 1: Representative external test case (UPenn ‑ GBM). Qualitati ve comparison of predictions in t he T2 -FLAIR ‑ absent inference scenario ( T2 -FLAIR c hannel replaced with zeros). (A) T1 post- contrast and (B) T2-FLAIR for reference standard. (C) output of the region ‑ wise nnU ‑ Net trained without d ropout (r=0 .0) and T2 -FLAIR absent and (D) output of the region ‑ wise nn U ‑ Net trained with targeted T2 -FLAIR dropout (r=0 .35) and T2 -FLAIR absent , illustrating the failure mode of whole ‑ tumor u nder ‑ segmentation without dropout an d recovery with dropout. Abbreviations: FLAIR = fluid ‑ attenuated inversion recovery; r = dropout probability rate. 19 Figure 2: External testing on UPenn ‑ GBM (n=403): region ‑ wise model performance without T2 -FLAIR. Per ‑ pat ient Dice similarit y coefficients (DSC, reported as % ) for the region ‑ wise models in the T2 -FLAIR ‑ absent inference scenar io, comparing no ‑ dropout training (r =0.0) versus targeted T2 -FLAIR dropout training (r=0.35). Abbreviations: DSC = Dice similarity coe fficient ; FLAIR = fluid ‑ attenuated inversion recovery; r = dropout probability rate. 20 Figure 3: External testing on UPe nn ‑ GBM (n=403): Bland- Altman analysis of whole ‑ tumor volume without T2 -FLAIR. Bland -Altman plots of predicted minu s reference standard whole ‑ tumor volume (mL) in the T2 -FLAIR ‑ absent scenario for the region ‑ wise nnU ‑ Net trained (A) without dropout (r=0.0 ; Bias: -45.59 mL; Limits of Agreement: -107.96, 16.78 mL) and (B) with targeted T2 -FLAIR d ropout (r =0.35 ; Bias: 0.83 mL, Limits of Agreement: -20.83, 22.49 mL ). Solid lines indicate mean bias; dashed lines indicate 95% limits of agreement. Abbreviations: FLAIR = fluid ‑ attenuated inversion recovery; r = dropout probability rate. 21 Supplemental M aterials Supplementary Table S1: External t esting on UPenn ‑ GBM (n=403): segmentation performance of label ‑ wise models with and without FLAIR a t inference . Performance of label ‑ wise nnU ‑ Net models (NCR/NET, ED, ET) trained on BraTS 2021 w ith targeted T2 - FLAIR dropout probability r=0.0, 0.35, 0.50 and evaluated u nder two prespecified inference scenarios: T2 -FLAIR ‑ present and T2 -FLAIR ‑ abse nt ( T2 -FLAIR cha nnel r eplaced with zeros). Values are median [Q1 -Q3] across p atients. Overall denotes the unweighted macro ‑ average across NCR/NET, ED, and ET. Metrics/abbreviations: DSC = Dice similarity coeffi cient (reported as %); HD95 = 95th ‑ percentile Hausdorff distance (mm); NCR/NET = necrotic and non ‑ enhancing tumor; ED = edema; ET = enhancing tumor; FLAIR = fluid ‑ attenuated inversion recovery; r = dropout probability rate. Overall Enhancing Tum or Non -enhancing Tumor Edema T2 -FLAIR drop for training DSC med [Q1-Q3] HD 95 med [Q1-Q3] DSC med [Q1-Q3] HD 95 med [Q1-Q3] DSC med [Q1-Q3] HD 95 med [Q1-Q3] DSC med [Q1-Q3] HD 95 med [Q1-Q3] Segmentation with T2 -FLAIR i nput r=0.0 91.0 [82.0- 95.0] 2.01 [1.07- 3.46] 94.0 [88.0- 97.0] 1.00 [1.00- 1.41] 91.0 [79.0- 97.0] 1.41 [1.00- 4.12] 92.0 [85.0- 96.0] 1.73 [1.00- 3.46] r=0.35 91.0 [81.0- 95.0] 2.00 [1.14- 3.42] 94.0 [87.0- 97.0] 1.00 [1.00- 1.41] 92.0 [79.0- 97.0] 1.41 [1.00- 4.12] 92.0 [85.0- 96.0] 1.41 [1.00- 3.61] r=0.5 90.0 [81.0- 95.0] 2.04 [1.14- 3.58] 94.0 [87.0- 97.0] 1.00 [1.00- 1.41] 91.0 [79.0- 97.0] 1.41 [1.00- 4.24] 91.0 [85.0- 95.0] 1.72 [1.00- 3.61] Segmentation witho ut T2 -FLAIR input r=0.0 64.0 [55.0- 71.0] 9.17 [6.53- 13.06] 91.0 [84.0- 95.0] 1.41 [1.00- 2.24] 89.0 [72.0- 96.0] 2.24 [1.00- 5.20] 14.0 [3.0- 28.0] 22.44 [16.43- 31.03] r=0.35 89.0 [79.0- 93.0] 2.26 [1.41- 4.06] 94.0 [87.0- 96.0] 1.00 [1.00- 1.41] 92.0 [79.0- 97.0] 1.73 [1.00- 4.24] 87.0 [78.0- 92.0] 2.45 [1.73- 4.69] r=0.5 89.0 [79.0- 94.0] 2.30 [1.38- 4.17] 93.0 [87.0- 96.0] 1.00 [1.00- 1.41] 92.0 [76.0- 97.0] 1.73 [1.00- 4.36] 88.0 [79.0- 92.0] 2.24 [1.73- 4.64] 22 Supplementary Table S2: Supplementary Table S2. External testing on UPenn ‑ GBM (n=403): equivalence testing (TOST) for r=0.35 vs r=0.0 across inference scen arios (label ‑ w ise). Paired comparison of label ‑ wise models trained with targeted T2 -FLAIR dropout (r=0.35) versus no dropout (r=0.0) under T2 -FLAIR ‑ present and T2 -FLAIR ‑ absent inference scenario s. Entries report the med ian paired D SC difference ( r =0.35 − r=0.0) in DSC percentage points, with 95% bootstrap confidence intervals. TOST p ‑ values test equivalence w ithin ±1.5 D SC percentage points (α=0.05). Abbreviations: TOST = two one ‑ sided tests; DSC = D ice similarity coefficient; NCR/NET = necrotic and non ‑ en hancing tumor; ED = edema; ET = enhancing tumor ; r = dropout probability rate. Median DSC r(0.35) -r(0) [95%CI] TOST p-Value Segmentation with T2 -FLAIR in put Overall 0.0442 [0.002, 0.092] <0.001 ET -0.0071 [-0.056, 0.027] <0.001 NET 0.0320 [0.011, 0.074] <0.001 Edema -0.0417 [-0.078, 0.029] <0.001 Segmentation witho ut T2-FLAIR inp ut Overall 24.1974 [23.61 3, 24.685] 1 ET 1.075 [0.916, 1. 241] 1 NET 0.9508 [0.705, 1.213] 1 Edema 69.3675 [67.20 2, 70.926] 1 23 Supplementary Table S3: External t esting on U Penn ‑ GBM (n=403): equivalence testing (TOST) for r=0.35 vs r=0.50 across inference scenarios (label ‑ wise). Pa ired comparison of label ‑ wise models trained with targeted T2 - FLAIR d ropout probabilities r=0.35 versus r=0.50, evaluated under T2 -FLAIR ‑ present an d T2 -FLAIR ‑ absent inference scenarios. Entries report the median paired D SC difference (r =0.35 − r=0.50) in DSC p ercentage points, with 95% bootstrap confidence intervals. TOST p ‑ values test equivalence within ±1.5 DSC percentage points (α=0.05). Abbreviations: TOST = two one ‑ sided tests; DSC = D ice similarity coefficient; NCR/NET = necrotic and non ‑ en hancing tumor; ED = edema; ET = enhancing tumor ; r = dropout probability rate. Median DSC r(0.35) -r(0.50) [95%CI ] TOST p-Value Segmentation with T2 -FLAIR i nput Overall 0.247 [0.183, 0. 316] <0.001 ET 0.188 [0.118, 0. 233] <0.001 NET 0.256 [0.171, 0. 329] <0.001 Edema 0.172 [0.122, 0. 218] <0.001 Segmentation witho ut T2-FLAIR inp ut Overall -0.051 [-0.138, 0.0 13] <0.001 ET -0.007 [-0.067, 0.041] <0.001 NET 0.0484 [0.000, 0.136] <0.001 Edema -0.234 [-0.301, -0.1 72] <0.001 24 Supplementary File: CLAIM Ch ecklist (20 24 Update) CLAIM item Checklist requirement (paraphrased) Addressed Manuscript location Notes 1 Identify the work as an AI/ML study in the title/abstract. Yes Title; Abstract header and text 2 Provide a structured abstract that summarizes design, data, model, evaluation, and main results. Yes Abstract (Purpose/Materials and Methods/Results/Conclusion) 3 Describe clinical/scienti fic background and intended use/role of the AI tool. Yes Introduction 4 State study objective(s) and/or hypothesis(es). Yes End of Introduction (Purpose and hypotheses) 5 Specify whether the study is prospective or retrospective. Yes Methods – Study design and reporting 6 State study goal (e.g., model development, validation, noninferiority/equivalence, etc.). Yes Introduction , Methods 7 Describe data sources (origin, dataset name(s), public/private, recruitment). Yes Methods – Datasets and reference standard (BraTS 2021; UPenn ‑ GBM) 8 Define inclusion/exclusion criteria and study setting/time frame. Yes Methods – Datasets and reference standard 9 Describe preprocessing steps applied to the data. Yes Methods – Datasets and reference standard BraTS organizer preprocessing is described 10 Describe any selection of subsets/regions/patches/frames for model input. Yes Methods – Training and testing Extraction of UPenn GBM dataset for external validation dataset is described 11 Describe de-identification and privacy protection approach. Yes Methods – Study design and reporting Only public de ‑ identified datasets are used 12 Describe missing data and how it was handled. NA Methods Full public dataset was used, which only contains subjects with full four modality imaging set 13 Provide imaging acquisition protocol details (scanner, sequences, key parameters) or cite where available. Partial Methods BraTS is a heterogenous imaging dataset, parameters for each site are publicly available and referenced 14 Identify and justify the reference standard used. Yes Methods 15 Describe how reference annotations/labels were generated. Yes Methods 16 Define what constitutes a positive case / target definition(s). Yes Methods Tumor subcompartments and derived regions are defined 17 Describe reference standard quality assurance (expertise, blinding, adjudication). Yes Methods 25 CLAIM item Checklist requirement (paraphrased) Addressed Manuscript location Notes 18 Report inter- and/or intra-rater variability (and/or mitigation) for the reference standard. NA Ground truth segmentations obtained from BraTS dataset 19 Describe data partitioning for training/validation/testing (and sizes). Yes Methods 20 State the level of disjointness between partitions (e.g., patient-level). NA 21 Describe how sample size was determined (power/precision or rationale). Partial Methods No formal sample size calculation was performed, as all available data were used 22 Describe model architecture; cite prior architecture if used; describe modifications. Yes Methods nnU ‑ Net 3D full- resolution used , with region- and label-based training, with and without FLAIR- dropout at fixed proportions 23 Report software/frameworks and versions; provide access information when applicable. Yes Methods 24 Describe model parameter initialization (including randomness/seed control). 25 Describe training procedure and hyperparameters (optimizer, LR, epochs, augmentation, loss, early stopping). Partial Methods Epochs and use of nnU ‑ Net defaults are stated; consider adding a concise hyperparameter summary or nnU ‑ Net plan/config file in Supplementary Methods. 26 Describe how the final model/checkpoint was selected. Yes Methods 27 Describe any ensembling and how outputs were combined. Yes Methods 28 Specify evaluation metrics and rationale/clinical relevance. Yes Methods – Statistics 29 Describe statistical analysis and uncertainty estimation. Yes Methods – Statistics 30 Describe robustness/sensitivity analyses. Yes Methods - Statistics 31 Describe model explainability/interpretability methods (if used). NA 32 Report performance on internal data (training/validation/test as applicable). NA 33 Report performance on external data (if applicable). Yes Results; Supplementary 34 Provide clinical trial registration information (if applicable). NA Retrospective analysis of public de ‑ identified datasets; no 26 CLAIM item Checklist requirement (paraphrased) Addressed Manuscript location Notes registration expected. 35 Provide participant/data flow (numbers included/excluded) per cohort. Yes Methods 36 Report participant demographics/clinical characteristics (when available). Partial Methods BraTS demographics are briefly described and cited 37 Report performance metrics with measures of uncertainty (CI, IQR) and appropriate aggregation. Yes Results and Supplementary Medians/IQRs and bootstrap CIs for paired differences are provided. 38 Report subgroup analyses (if performed) and pre- specification. NA 39 Provide analysis of errors/failures (qualitative or quantitative). Yes Results/Discussion 40 Report interpretability outputs/results (if interpretability methods used). NA 41 Discuss limitations, biases, and generalizability. Yes Discussion – Limitations paragraph 42 Discuss clinical implications and future work. Yes Discussion; Conclusion 43 State availability of data, code, and/or trained model (or restrictions). No Data availability statement 44 Report funding sources and role of funders. Yes Funding statement .
Original Paper
Loading high-quality paper...
Comments & Academic Discussion
Loading comments...
Leave a Comment