Co-Optimization of Network Topology and Variable Impedance Devices under Dynamic Line Ratings in Power Transmission Systems
Power system operators are increasingly deploying Grid Enhancing Technologies (GETs) to mitigate operational challenges such as line and transformer congestion, and voltage violations. These technologies, including Network Topology Optimization (NTO)…
Authors: Junseon Park, Hyeongon Park, Rahul K. Gupta
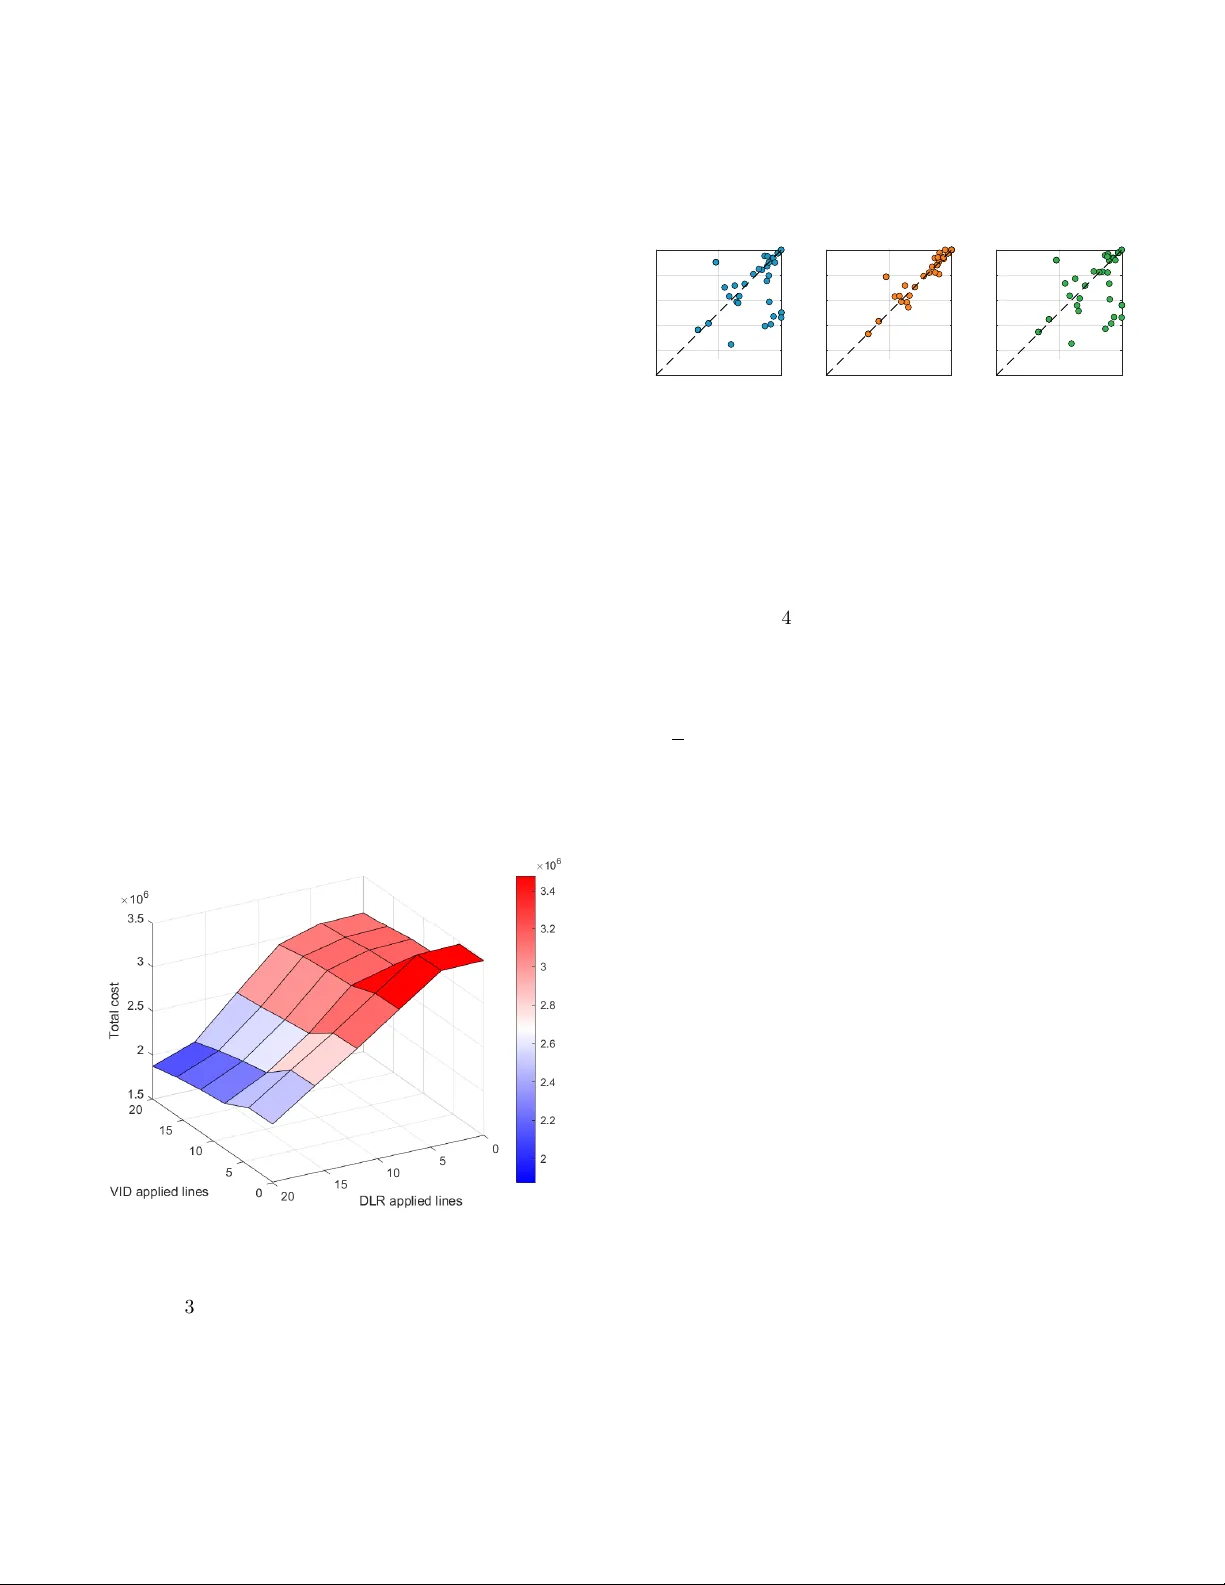
Co-Optimization of Net w ork T op ology and V ariable Imp edance Devices under Dynamic Line Ratings in P o w er T ransmission Systems Junseon P ark ∗ , § , Hy eongon P ark ∗ , Rah ul K. Gupta § ∗ Puky ong National Univ ersit y , Busan, South K orea, § W ashington State Univ ersit y , Pullman, W A, USA. Abstract—P ow er system op erators are increasingly deploy- ing Grid Enhancing T echnologies (GET s) to mitigate op er- ational c hallenges such as line and transformer congestion, and voltage violations. These tec hnologies, including Netw ork T op ology Optimization (NTO), V ariable Imp edance Devices (VIDs), and Dynamic Line Rating (DLR), enhance system exibilit y and enable b etter utilization of existing netw ork assets. How ev er, as the deploymen t of multiple GET s grows, eectiv e co ordination among them b ecomes essential to fully realize their p otential b enets. This pap er presents a co- optimization framew ork that models and co ordinates NTO, VID, and DLR within a unied optimization scheme to alle- viate net work congestion and minimize op erational costs. The NTO form ulation is dev elop ed using a no de-breaker mo del, oering ner switching granularit y and improv ed op erational exibilit y . The inclusion of VIDs introduces nonlinear and non-con vex relationships in the optimization problem. DLR tak es in to accoun t of weather conditions, primarily wind speed and ambien t temp erature, enabling adaptive utilization of transmission capacit y . The prop osed framew ork is v alidated on standard IEEE b enchmark test systems, demonstrating its eectiv eness under v arying num b ers and placements of imp edance con trollers. Index T erms—Grid enhancing technologies, Net work top ol- ogy optimization, Dynamic line rating, V ariable imp edance devices. Nomenclature Indices l Index for the lines e Index for the {from, to} end of the line e ∈ { f r , to } t Index for the times b Index for the substations g Index for the generators d Index for the load demands i Index for the busbar i ∈ { 1 , 2 } Sets G b Set of the generators in substation b D b Set of the loads in substation b Submitted to the 24th Po wer Systems Computation Conference (PSCC 2026). LF b Set of the transmission lines whose direc- tions of p ow er ow are from substation b LT b Set of the transmission lines whose direc- tions of p ow er ow are to substation b P arameters ¯ b l Nominal susceptance of the line l [S] T avg A v erage temp erature of conductor [°C] R ( T avg ) Conductor resistance at T avg [ Ω ] mC p T otal heat capacit y of conductor [J/(m · °C)] q c Con v ection heat loss rate p er unit length [W/m] q s Heat gain rate from sun [W/m] q r Radiated heat loss rate per unit length [W/m] α DLR DLR capacit y factor, dened as the ratio of current under DLR to that under SLR. θ max Maxim um allo wed voltage angle [rad] P min g Lo w er limits for p ow er generation of gen- erator g [MW] P max g Upp er limits for p ow er generation of gen- erator g [MW] P max d Maxim um amoun t of load demand d [MW] I Conductor line rating [A] M A sucien tly great n umber r Susceptance c hange rate c g, 2 /c g, 1 /c g, 0 Cost coecient of generator g N g Num b er of generators N b Num b er of buses V OLL V alue of Lost Load [ $ /MWh] Con tin uous V ariables P l P o w er o w on line l [MW] P g,i Generation p ow er connected to busbar i [MW] P d,i Load demand connected to busbar i [MW] P l,e,i Line p ow er ow on line l of which the end e is connected to busbar i [MW] θ l,e Angle of the voltage of line l at end e [rad] θ b,i Angle of the v oltage at busbar i in sub- station b [rad] θ l,e,i Angle of the voltage at busbar i associated with end e of transmission line l [rad] ∆ b l Susceptance c hange of the line l [S] C Gen T otal generation cost [ $ ] C LS Load shedding cost based on V O LL [ $ ] C Obj T otal op erating cost, i.e., C Gen + C LS [ $ ] Binary V ariables h b Binary v ariable indicating the connection status of the tw o busbars in substation b . (0: disconnected; 1: connected) h g Binary v ariable indicating the busbar con- nection status of the generator on line l . (0: Busbar 1; 1: Busbar 2) h d Binary v ariable indicating the busbar con- nection status of the load demand on line l . (0: Busbar 1; 1: Busbar 2) h l,e Binary v ariable indicating the busbar con- nection status of transmission line l ’s end e . (0: Busbar 1; 1: Busbar 2) h l Binary v ariable indicating the switching status of transmission line l . (0: op en; 1: closed) I. Introduction A. Motiv ation The bulk pow er system is undergoing a massive trans- formation driv en b y the large-scale integration of in- termitten t renewable energy resources (RERs), inv erter- based resources (IBRs) [ 1 ], and the rapid growth of data center loads [ 2 ]. These developmen ts introduce new op erational challenges suc h as pow er ow congestion, v oltage quality and stability issues [ 3 ], [ 4 ] and in tro duces new challenges to the pow er system utilities to ensure the reliabilit y of the p ow er system. Con v entional solutions to these c hallenges are to expand transmission capacity through new line construction or infrastructure upgrades [ 5 ], [ 6 ], deplo y energy storage systems (ESS) [7], [ 8 ], etc. How ev er, these approaches are often capital-intensiv e and time-consuming, requiring several y ears for planning, p ermitting, and commissioning. In recent y ears, several Grid Enhancing T ec hnologies (GET s) ha ve emerged as promising alternativ es to impro ve net w ork exibilit y and mitigate congestion issues [ 9 ], [10], [11]. These include Netw ork T op ology Optimization (NTO) [12], [13], [14], Dynamic Line Rating (DLR) [14], [15], and V ariable Imp edance Devices (VIDs), also referred to as Smart Wire Devices (SWDs) [16], [17]. NTO seeks to optimize both the net w ork top ology and the breaker congurations, often represen ted by the no de-breaker mo del, to enhance op erational exibility . Prior studies [14] ha v e sho wn that NTO can signican tly reduce op erational costs compared to xed-topology systems. Moreov er, DLR dynamically adjusts the thermal limits of transmission lines based on real-time ambien t weather conditions, allo wing op erators to utilize increased line capacit y during fa v orable co oling conditions such as low temp eratures and high wind sp eeds [15]. Mean while, VIDs (or SWDs) can mo dulate the line imp edance, eectively rerouting p ow er o ws from ov erloaded lines to underutilized ones [17]. Recognizing the p otential of these technologies, the U.S. Departmen t of Energy (DOE) has recently emphasized the importance of GET deploymen t to enhance grid reliabilit y and exibility [ 9 ]. Ho wev er, most existing meth- o ds address these technologies indep endently , without considering their in teractions or co ordination in congestion managemen t. T o address this gap, this work prop oses a co-optimization framework that join tly mo dels and co ordinates NTO, DLR, and distributed VIDs, enabling synergistic operation to alleviate transmission congestion and impro ve ov erall system eciency . B. Existing literature In the existing literature, the optimization of GET s across v arious op erational time horizons has b een widely in v estigated. Recen t studies ha v e examined the com bined application of Optimal T ransmission Switching (OTS) and DLR tec hnologies [18], [19]. These w orks hav e demon- strated that integrating OTS and DLR schemes can signican tly enhance renew able energy accommo dation and improv e ov erall system reliability . In [13], a DLR along with NTO framework, combining OTS and bus-bar splitting, was proposed, showing substan tial improv ements in system reliability and notable reductions in op erational costs. Moreo v er, incorporating VIDs in to op erational planning in tro duces additional nonlinearities in both the optimal p o w er o w (OPF) and switc hing problems, as VIDs are t ypically modeled through v ariable line impedance [17], [20]. The op eration of VIDs has b een inv estigated for sev eral ob jectives, including congestion managemen t [20], cost minimization, and wind pow er curtailment reduction [21]. In addition, [22], [23], [24] developed stochastic planning and operational frameworks for the deploymen t of VIDs under uncertain ty . Ov erall, the existing b ody of work has predominantly fo cused on the individual optimization of sp ecic GET s, with limited attention to their co ordinated or co-optimized op eration. F or instance, while [13] explored the in tegration of DLR within an NTO framework, and [22] considered VID deplo ymen t alongside generator dispatch sc heduling, the join t optimization of m ultiple GET s remains largely unexplored. Consequently , there is a clear research gap in developing unied frameworks that enable the co ordi- nated op eration of multiple GET s to fully lev erage their com bined exibilit y and enhance system p erformance. C. Problem Statemen t and Con tributions In this work, w e prop ose a co-optimization framework for the co ordinated operation of multiple GET s. While previous studies ha v e primarily fo cused on individual GET s in isolation, our framew ork simultaneously considers three complemen tary tec hnologies: NTO, DLR, and VIDs, to exploit their synergistic capabilities in improving pow er system exibilit y and operational eciency . First, the netw ork topology and bus-bar splitting are mo deled using the no de-break er representation, which enables detailed switching decisions while maintaining net w ork connectivity and operational feasibility . Second, VIDs are incorporated to provide additional exibility b y allo wing controlled adjustmen ts of line reactances within predened op erating limits, thereby redistributing p ow er o ws and alleviating congestion. Third, DLR is mo deled as functions of real-time or forecasted weather conditions, primarily wind sp eed and am bient temperature, enabling adaptiv e utilization of transmission capacity based on prev ailing environmen tal factors. The DC p ow er o w mo del is adopted to represen t p ow er ow ph ysics, extended to account for the v ariable line reactances introduced by the VIDs. The key contribution of this w ork lies in the develop- men t of a co-optimization scheme that join tly considers NTO, DLR, and VID tec hnologies within a single, in te- grated decision-making framework. This unied approach enables a systematic assessmen t of the interactions and com bined b enets of m ultiple GET s under diverse op erat- ing and w eather conditions. Through this framew ork, we can ev aluate ho w co ordinated con trol of these tec hnologies enhances netw ork exibilit y , increases renewable energy accommo dation, and improv es o verall system reliability , outcomes that are dicult to achiev e when each technol- ogy is optimized indep endently . The pap er is organized as follows. Section II presents the mo del of the grid and GET s. Section I I I presents the co-optimization framework for the co ordination of the multiple GET s. Section IV presents the sim ulation setup and results on tw o dierent IEEE testcases, and Finally , Section V concludes the main contribution of the presen ted w ork. I I. Mo deling Grid Enhancing T echnologies In the following, we describe the grid mo del and the mo dels of dierent GET s, whic h will b e used later for the co-optimization framew ork in Sec. I I I. A. T ransmission grid model W e model the transmission netw ork using the DC pow er o w appro ximation [25], whic h assumes that (i) the angle of the voltage dierence is small, (ii) the netw ork is reactiv e, and (iii) the v oltage magnitudes are close to 1 p er unit. Using the notations describ ed in nomenclature section, the DC p ow er o w is expressed as follows. P l = b l ( θ l,f r − θ l,to ) (1) Here, b l = ¯ b l , i.e., when imp edances are not controlled. B. Netw ork T op ology Optimization Mo del NTO inv olves optimizing the conguration of the p ow er net w ork through optimal transmission switching and by lev eraging existing switc hing elements within substations, suc h as circuit breakers (CBs). The substation CBs enable reconguration of substation connections to the rest of the p ow er system, thereb y inuencing the op erational exibilit y , reliabilit y , and security of the grid. Substa- tions can employ v arious bus congurations that require dieren t num b ers of circuit break ers and exhibit distinct reliabilit y characteristics. Among these, the breaker-and- a-half conguration is commonly used in high-voltage substations due to its fa vorable balance b etw een reliabilit y and operational exibility [26]. In this w ork, we assume that the no de-breaker (NB) mo del is adopted at each bus in the p ow er netw ork. Figure 1 sho ws the generalized breaker-and-half model with line switching. As sho wn in the gure, this mo del adds additional exibility that the p ow er system could b enet from, for example, using the NB model, the busbars of the “from” and “to” buses can b e either closed or op en, and also the connection to the loads and generators can b e connected to either of the busbars. 𝑮𝒆𝒏𝒆 𝒓𝒂𝒕𝒐 𝒓 𝒉 𝒈 𝑭𝒓𝒐 𝒎 𝑩𝒖𝒔 𝑩𝒖𝒔𝒃 𝒂 𝒓 𝟏 𝑩𝒖𝒔𝒃 𝒂 𝒓 𝟐 𝒉 𝒃 𝑻𝒐 𝑩𝒖𝒔 𝑩𝒖𝒔𝒃 𝒂 𝒓 𝟏 𝑩𝒖𝒔 𝒃 𝒂 𝒓 𝟐 𝒍𝒐𝒂 𝒅 𝒉 𝒅 𝒉 𝒃 𝒉 𝒍 , 𝒇𝒓 𝒉 𝒍 , 𝒕𝒐 𝒉 𝒍 Fig. 1. Generalized breaker-and-half mo del Considering the switching capability of the busbars and the lines, the NTO mo del can b e mathematically mo deled using busbar binary v ariables h b [13], [14]: − θ max (1 − h b ) ≤ θ b, 1 − θ b, 2 ≤ θ max (1 − h b ) ∀ b (2a) In (2a), when busbars are merged, the dierence in v oltage angle phase b etw een busbars must b e identical, and when split, it must not exceed the maximum angle phase. The generators connected at each busbars can be mo deled using binary v ariables h g , and can b e expressed as (1 − h g ) P min g ≤ P g, 1 ≤ (1 − h g ) P max g ∀ g (2b) h g P min g ≤ P g, 2 ≤ h g P max g ∀ g (2c) where, Eqs. (2b) and (2c) mo dels when a generator is connected to busbar 1 or at busbar 2, and vice v ersa. Similarly , the connection and con trollabilit y of the demand at each of the busbars are mo deled using binary v ariable h d using (2d) as 0 ≤ P d, 1 ≤ (1 − h d ) P max d ∀ d (2d) 0 ≤ P d, 2 ≤ h d P max d ∀ d (2e) The limit on the p ow er-ow for each line and the switc hing of the lines are expressed as − (1 − h l,e ) P max l ≤ P l,e, 1 ≤ (1 − h l,e ) P max l ∀ l, e (2f ) − h l,e P max l ≤ P l,e, 2 ≤ h l,e P max l ∀ l, e (2g) − h l P max l ≤ P l,e, 1 ≤ h l P max l ∀ l, e (2h) h l,e ≤ h l ∀ l, e (2i) P l = P l,e, 1 + P l,e, 2 ∀ l, e (2j) where, Eqs. (2f) and (2g) dene the transmission line constrain ts: when a line is connected to busbar 1, the p o w er o w to the other busbars must b e zero, and vice v ersa. Eqs. (2h) and (2i) sp ecify the line status, ensuring that no p o wer ows when the line is op en. Constraint (2j) enforces p o w er conserv ation by requiring that the total p o w er owing out of a busbar equals the pow er owing from the ‘from’ bus to the ‘to’ bus. The line switching constraints are expressed using the big- M method, given by (2k), (2l), and (2m) − M (1 − h l ) ≤ b l ( θ l,f r − θ l,to ) − P l ≤ M (1 − h l ) ∀ l (2k) − h l,e θ max ≤ θ l,e − θ l,e, 1 ≤ h l,e θ max ∀ l, e (2l) − (1 − h l,e θ max ) ≤ θ l,e − θ l,e, 2 ≤ h l,e θ max ∀ l, e (2m) The binary v ariables for busbars, generator, demand connections and lines are connected through Eqs. (2n), (2o), and (2p). When the busbars at each substation are connected, it is not necessary to consider the binary v ariable determining the connection of the generator, load, and end of the line. h b + h g ≤ 1 ∀ b g ∈ G b (2n) h b + h d ≤ 1 ∀ b d ∈ D b (2o) h b + h l,e ≤ 1 ∀ b, e l ∈ LF b or l ∈ LT b (2p) Finally , the constraints (2q) and (2r) expresses the p o w er balance constraints, i.e., the dierence b et w een generation and demand is equal to the sum of p ow er o wing through the lines. g ∈ G b P g, 1 − d ∈ D b P d, 1 − l ∈ LF b P l + l ∈ LT b P l = 0 ∀ b (2q) g ∈ G b P g, 2 − d ∈ D b P d, 2 − l ∈ LF b P l + l ∈ LT b P l = 0 ∀ b (2r) C. Dynamic Line Rating Mo del W e also consider the dynamic line rating capability in our optimization scheme as one of the GET s. Compared to the static line rating (SLR), which op erates by x- ing transmission capacity , DLR enables more economical p o w er system op eration by providing higher transmission capacit y . The DLR is mo deled based on weather data and follows the IEEE Standard 738-2023 [27]. With notations dened in the nomenclature, the dynamic thermal balance of a conductor can b e expressed as dT avg dt = 1 mC p [ R ( T avg ) I 2 + q s − q c − q r ] (3a) where q s , q c , and q r denote the solar heat gain, conv ective heat loss, and radiativ e heat loss, resp ectively . As the am bien t temp erature rises, q c and q r decrease, reducing co oling eciency and current capacity . In contrast, higher wind sp eed enhances conv ective heat loss ( q c ), which cools the conductor more eectively and increases the allow able curren t. Overall, am bient temperature and wind sp eed are the dominant w eather factors determining the dynamic line rating. By neglecting the dynamic term dT avg dt , the steady-state condition of the thermal balance yields. I = q c + q r − q s R ( T avg ) (3b) This simplied steady-state formulation allows for e- cien t estimation of the allo wable current using forecasted w eather conditions [28]. Using the DLR, P max l in (2f), (2g), and (2j) are updated considering the wind and temp erature forecasts. It is up dated as P max l = P max,DLR l = P max,S LR l × α DLR (4) Here, α DLR is a co ecient representing the ratio of the curren t when DLR is applied to that under SLR. T o de- termine α DLR , forecasted ambien t temp erature and wind sp eed are used to compute q s , q c , and q r , and subsequently the allo w able curren t I DLR from (3b). F or comparison, the same pro cedure is applied to the SLR case, but with xed ambien t conditions of 40°C and 0.5 m/s wind sp eed, represen ting the worst-case scenario [27]. The resulting curren ts I DLR and I S LR are then con v erted into the corresp onding p ow er limits P max,DLR l and P max,S LR l , and their ratio denes α DLR . A higher temp erature or low er wind speed results in a smaller α DLR , whereas a low er temp erature or higher wind speed yields a larger α DLR . D. V ariable Imp edance Devices Mo del VIDs are a type of exible A C transmission sys- tem (F A CTS). They are mo deled are several kinds of F A CTS devices, including Th yristor Con trolled Series Comp ensators (TCSCs), Static Sync hronous Series Com- p ensators (SSSCs), and Unied P ow er Flo w Con trollers (UPF Cs) and are t ypically mo deled through reactances that can be v aried by pre-dened limits. The v ariable imp edance/reactance allo ws exibilit y in the transmission net w ork to re-route the pow er-ows and help av oid conges- tion and reduce costs. It can b e mathematically mo deled as [17], [20], [29] b l = ¯ b l + ∆ b l (5a) − r ¯ b l ≤ ∆ b l ≤ r ¯ b l ∀ l, (5b) where, ¯ b l denotes the nominal susceptance and ∆ b l is a v ariable allo wing deviations in the line susceptance is b ounded b y a factor r ≤ 1 of nominal susceptance ¯ b l . I I I. Co-optimization F ramework W e formulate a co-optimization problem that join tly co ordinates the op eration of multiple GET s, aiming to minimize the total op erating cost while satisfying the resp ectiv e constrain ts of eac h technology . The objective function and its cost components are describ ed below. A. Ob jective function The prop osed optimization aims to minimize the total system op erating cost, which consists of (i) generation cost ( C Gen ) and (ii) load-shedding cost ( C LS ) . Each cost comp onen t is dened as follo ws. 1) Generation cost: Generation costs are mo deled as a quadratic function, as shown in Equation (6a), and the total generation is determined by the sum of the generation produced at the tw o busbars. C Gen = N g g =1 ( c g, 2 ( P g, 1 + P g, 2 ) 2 + c g, 1 ( P g, 1 + P g, 2 ) + c g, 0 ) (6a) 2) Load shedding cost: The load shedding cost can be calculated as shown in Equation (6b). When transmission capacit y constraints fail to meet the total load demand, load shedding may o ccur. Multiplying the load shedding p o w er b y a high-cost V O LL minimizes the load shedding cost. C LS = V O LL N b b =1 ( d ∈ D b ( P max d − ( P d, 1 + P d, 2 ))) (6b) B. Final Optimization Problem The nal optimization for co ordinating the op eration of the NTO, DLR and VID can b e form ulated as min C Obj = C Gen + C LS , sub ject to ( 2 ) , ( 4 ) , ( 5 ) . (7) The optimization problem in (7) is non-linear b ecause of the bilinear constraint of VID when ( 5 ) is substituted in (2k) and ( 1 ). An approac h to tac kle these bilinear terms is by transforming them, i.e., ∆ b l × θ l,f r and ∆ b l × θ l,to b y auxiliary v ariables, then applying McCormick en velopes [30]. These McCormick env elop es transform the bilinear constrain ts to a set of linear constraints by dening upp er and low er b ounds on each of the v ariables in the bilinear term. In this w ork, we do not explicitly reformulate the bilinear terms using McCormick env elopes; rather, they are typically transformed by the Gurobi optimization solv er at the pre-solve stage 1 . IV. Simulation Setup and Results A. Simulation Setup W e simulate our framework on tw o dierent IEEE b enc hmark test systems which are Case24_ieee_rts Sys- tem and Case 118 system [31], and will b e describ ed in the results section. W e used the dataset from the MA T- PO WER testcases for the simulations. In the IEEE test cases, we set the minim um output of all generators to zero in order to a v oid situations where a generator’s minim um output would exceed the load at its corresp onding bus. F or the sim ulations with VIDs, w e allo w the susceptance c hange factor (5b), r to 0.1, allowing each line susceptance to v ary by 10%. The cost of load shedding (V OLL) is set to 2,000 $ /MWh. 1) Dataset: F or sim ulation, we require the grid data and relev ant load data, as w ell as the weather data to mo del the DLR. F or load data, we use a 24-hour prole with one-hour in terv als from [32]. The load for eac h time p erio d for the considered IEEE testcase is determined b y the nominal load data b y the normalized hourly prole. The w eather data on am bient temp erature and wind sp eed are from Austin, T exas area for the year 2023 [33]. The w eather data is used to calculate the α DLR in ( 4 ). All other parameter v alues w ere set identically to those for SLR and DLR. W e presen t results for tw o cases: (i) High wind: we consider a perio d when the wind is relatively high and temp erature is low. This p erio d is during the winter (Decem b er to F ebruary). (ii) Lo w wind: we pic k a da y during the y ear c haracterized with the lo west av erage wind sp eed during the year. The av erage weather data, i.e., for the low wind and high wind cases and corresp onding air temp erature, are shown in Figure 2. Note that although w e consider a lo w wind da y , the wind sp eed is ab ov e 0.5 m/s, whic h means that it will ha ve a dynamic line rating higher than the static line rating (SLR), and will p oten tially b enet from the DLR, as will b e presen ted in the results. 2) Simulation Conguration: The optimization prob- lem was implemented in MA TLAB and solved using the Gurobi solver. T o study the inuence of NTO, VID and DLR, w e present simulations for t wo cases. (i) Fixed top ology: W e consider xed top ology , where the operation of the DLR and VID are operation are optimized. In this case, w e solv e ( 7 ) assuming a pre- determined topology representing the base net work (i.e., the decisions h l , h b , h g are already known ac- cording to the nominal top ology as p er the netw ork data). 1 https://www.gurobi.com/ 0 3 6 9 12 15 18 21 24 Hour of Day 8 10 12 14 16 18 Temperature (°C) Lowest wind speed day Average of winter (a) A verage hourly temp erature 0 3 6 9 12 15 18 21 24 Hour of Day 1 2 3 4 5 6 Wind Speed (m/s) Lowest wind speed day Average of winter (b) A verage hourly wind speed Fig. 2. W eather data on temperature and wind sp eed for mo deling the DLR. (ii) Optimized topology: The net w ork topology is opti- mized using NTO in conjunction with DLR and VID. F or the NTO case, the optimization is terminated at a 0.5% optimality gap, as achieving a zero gap requires signican tly higher computational time due to the large n umber of binary decision v ariables. F urthermore, to sim ulate a scenario with a net w ork congestion problem, we rst solve a base case without an y GET s, then we imp ose a congestion pow er-ow limit on eac h line as half of the base case. B. Case24_ieee_rts System Installing DLR or VID tec hnologies requires exp ensive installation costs [34], [35], therefore, it ma y not be prac- tical to assume all the transmission lines to b e equipp ed with DLR and VIDs. Therefore, this study applied DLR or VID to only some of the lines instead of applying them to the en tire netw ork. The results are then presented for lines with dieren t com binations of DLRs and VIDs. F or the follo wing simulations, we increm en tally apply the num b er of transmission lines that are equipp ed with the DLR and VID tec hnology . The Case24_ieee_rts System consists of 38 lines, w e incremen t in steps of 4 lines and simulate for 0, 4, 8, 12, 16 and 20 lines. 1) Fixed T op ology: In this case, we solve ( 7 ) for the nominal top ology , i.e., the decisions h l , h b , h g are already kno wn according to the nominal top ology as p er the net w ork data. W e present results for lo w and high wind cases. The results corresp onding to the high- and lo w-wind scenarios are presen ted in T ables I and I I, resp ectiv ely . Eac h cell in the table rep orts the op erational cost, denoted as C Obj in (7). Eac h row represen ts the op erational cost for dieren t n um b ers of VIDs installed across transmission lines, while keeping the num b er of DLR installations xed. Con v ersely , each column shows the operational cost for v arying num b ers of DLR-installed lines, with the n umber of VID installations held constan t. F rom the results in T ables I and I I, the following observ ations can b e deduced from the results. T ABLE I High Wind Scenario for Fixed T op ology: Cost matrix (in 10 6 ) for applied DLR and VID lines # DLR lines # VID lines 0 4 8 12 16 20 0 3.478 3.477 3.169 3.155 3.110 3.083 (-0.0%) (-8.9%) (-9.3%) (-10.6%) (-11.4%) 4 3.477 3.464 3.155 3.139 3.093 3.066 (-0.1%) (-0.4%) (-9.3%) (-9.8%) (-11.1%) (-11.9%) 8 3.141 3.133 3.033 3.014 2.983 2.927 (-9.7%) (-9.9%) (-12.8%) (-13.4%) (-14.2%) (-15.8%) 12 2.760 2.749 2.533 2.490 2.443 2.412 (-20.6%) (-21.0%) (-27.2%) (-28.4%) (-29.8%) (-30.7%) 16 2.372 2.360 2.101 2.036 1.947 1.841 (-31.8%) (-32.1%) (-39.6%) (-41.5%) (-44.0%) (-47.1%) 20 1.955 1.951 1.801 1.761 1.713 1.644 (-43.8%) (-43.9%) (-48.2%) (-49.4%) (-50.7%) (-52.7%) T ABLE I I Low Wind Scenario for Fixed T op ology: Cost matrix (in 10 6 ) for applied DLR and VID lines # DLR lines # VID lines 0 4 8 12 16 20 0 3.478 3.477 3.169 3.155 3.110 3.083 (-0.0%) (-8.9%) (-9.3%) (-10.6%) (-11.4%) 4 3.474 3.465 3.156 3.140 3.095 3.067 (-0.1%) (-0.4%) (-9.3%) (-9.7%) (-11.0%) (-11.8%) 8 3.142 3.135 3.034 3.016 2.986 2.931 (-9.7%) (-9.9%) (-12.8%) (-13.3%) (-14.2%) (-15.7%) 12 2.849 2.839 2.667 2.638 2.600 2.574 (-18.1%) (-18.4%) (-23.3%) (-24.1%) (-25.3%) (-26.0%) 16 2.610 2.601 2.419 2.374 2.317 2.243 (-25.0%) (-25.2%) (-30.5%) (-31.7%) (-33.4%) (-35.5%) 20 2.377 2.370 2.240 2.213 2.168 2.104 (-31.7%) (-31.8%) (-35.6%) (-36.4%) (-37.7%) (-39.5%) • In general, DLR has dominant reduction on the op erational cost compared to the VIDs. With 20 lines equipp ed with DLR results in reduction of the op erational cost by 43.8%, whereas with 20 lines equipp ed with VID reduces the cost by only 11.4%. It means that implementing DLR is more eectiv e, but it should b e also considered that the eectiveness of DLR tec hnology is directly dep endent on the w eather. This is reected in the results with low er wind conditions in T able I I, where we notice that the op erational cost with DLR reduces b y 31.7% which is 12.1% low er than the high wind scenario. How ever, the eect of VID remains unchanged as it do es not dep end on the weather conditions. • The b enet of adding DLR and VID to the transmis- sion lines in steps of 4 reveals that the initial 4 lines do not change muc h the op erational cost, and it might lo ok in the beginning that DLR and VIDs are not eectiv e. But as we increase their num b ers to 8, we see a sudden cost reduction. W e observe almost the same level of cost reduction with b oth DLR and VID up to the num b er of DLR and VID lines equipped to 8 transmission lines, i.e., 9.7% and 8.9% reduction in DLR and VID, resp ectiv ely . Ho wev er, when we consider the cumulativ e impact of 8 DLR and VID- equipp ed lines, it results in a cost reduction of 12.8%, so the cost reduction is not necessarily cum ulative. • When the num b er of DLR-equipp ed transmission lines are increased, we almost see a linear decrease in the op erational costs, whereas for the case VID- equipp ed lines, the cost reduction is not muc h signi- can t after 8 lines equipp ed with VID technology . The linear cost reduction due to DLR contin ues to when the num b er of DLR-equipped transmissions lines are increased to 20, whereas for the VID-equipped lines, there is not m uch impro vemen t in the cost. With this, it can be deduced that there is a limit after whic h VID tec hnology is not benecial in reducing the operation cost. • W e can reduce the op erational costs b y 52.7% and 39.5% for high and low wind scenarios, resp ectively . Therefore, it can b e concluded that DLR and VID tec hnologies are quite eectiv e in reducing the op er- ational costs. W e nearly see the cumulativ e eect of these tw o technologies, giv en with 20 lines equipp ed with VID alone results in an 11.4% reduction in the cost, whereas for DLR, it w as 43.8% (in the high wind scenario case). Fig. 3. A verage system cost under v arying num b ers of applied DLR and VID lines (xed top ology). Figure 3 presents the av erage of high and lo w wind scenario ob jectives considering dieren t com binations of the transmission lines equipp ed with VID and DLR tec hnologies. As the n umber of lines with DLR and VID increases, all ob jective function v alues consistently decrease. This trend indicates that b oth tec hnologies con tribute to mitigating line congestion, thereb y reducing load shedding and improving ov erall system eciency . In particular, DLR exhibits a more pronounced eect than VID, as it directly increases the thermal limits of transmission lines. 0 0.5 1 Baseline 0 0.2 0.4 0.6 0.8 1 DLR+VID (c) mean " = -0.064 0 0.5 1 Baseline 0 0.2 0.4 0.6 0.8 1 VID-only (b) mean " = 0.021 0 0.5 1 Baseline 0 0.2 0.4 0.6 0.8 1 DLR-only (a) mean " = -0.072 Fig. 4. Comparison of mean line loading b etween the baseline and (a) DLR-only , (b) VID-only , and (c) DLR+VID. Eac h dot is a transmission line; axes show line loading (p.u.). The 45° line indicates no change. W e also ev aluate how DLR and VID improv e the utilization of net work resources and thereby reduce op- erating cost via more economical dispatch and less load shedding. Figure 4 compares the mean line loading be- t w een the baseline (no DLR/VID) and three cases: DLR- only , VID-only , and DLR+VID, where each technology is installed on the top eight priorit y lines. F or each transmission line ℓ (38 lines), w e use the one-day a v erage ¯ u ℓ = 1 T T t =1 | P ℓ ( t ) | /P max ℓ ( t ) (p.u.). With DLR, P max ℓ ( t ) increases according to wind sp eed and ambien t temp erature; giv en these higher limits in the same-da y simulation, most p oints fall b elow the 45 ◦ line (lo w er mean line loading than baseline), and the av erage c hange is negative (e.g., mean ∆ ¯ u = − 0 . 072 ), indicating reliev ed congestion that enables c heap er generation and less load shedding. With VID, modifying line reactance reroutes p ow er along more economical paths; some lines see higher loading while others decrease, so the scatter remains close to the diagonal with a small av erage shift (e.g., mean ∆ ¯ u = +0 . 021 ). When DLR+VID are applied together, b oth eects app ear: a net decrease in mean line loading (e.g., ∆ ¯ u = − 0 . 064 ) from DLR’s capacity relief, with additional disp ersion due to VID-induced o w redistribution. 2) Optimized T opology through NTO: T o ev aluate the impact of NTO along with the co ordination of DLR and VID technologies, w e run the same high and lo w wind scenarios for Case24_ieee_rts System. The corresp onding results are presented in T ables I I I, IV, showing the sim ulation results when NTO w as applied under the same conditions as the xed topology simulation. F rom the results in T ables I I I and IV, the following observ ations can b e deduced. • The base cost in the case of optimized top ology using NTO (i.e., without an y VID and DLRs in the transmission system) is signicantly low er than the base cost with xed top ology . Sp ecically , NTO alone T ABLE I I I High Wind Scenario for Optimized T op ology using NTO: Cost matrix (in 10 6 ) for applied DLR and VID lines # DLR lines # VID lines 0 4 8 12 16 20 0 2.685 2.685 2.687 2.682 2.682 2.681 (-0.0%) (-0.1%) (-0.1%) (-0.1%) (-0.1%) 4 2.034 2.034 2.034 2.034 2.033 2.031 (-24.2%) (-24.2%) (-24.2%) (-24.2%) (-24.3%) (-24.3%) 8 1.998 1.998 1.998 1.996 1.997 1.994 (-25.6%) (-25.6%) (-25.6%) (-25.6%) (-25.6%) (-25.7%) 12 1.234 1.234 1.234 1.234 1.234 1.234 (-54.0%) (-54.0%) (-54.0%) (-54.0%) (-54.0%) (-54.0%) 16 1.229 1.230 1.230 1.230 1.230 1.230 (-54.2%) (-54.2%) (-54.2%) (-54.2%) (-54.2%) (-54.2%) 20 1.196 1.197 1.197 1.197 1.197 1.197 (-55.4%) (-55.4%) (-55.4%) (-55.4%) (-55.4%) (-55.4%) T ABLE IV Low Wind Scenario for Optimized T op ology using NTO: Cost matrix (in 10 6 ) for applied DLR and VID lines # DLR lines # VID lines 0 4 8 12 16 20 0 2.685 2.685 2.687 2.682 2.682 2.681 (-0.0%) (-0.1%) (-0.1%) (-0.1%) (-0.1%) 4 2.034 2.034 2.034 2.033 2.032 2.031 (-24.2%) (-24.2%) (-24.2%) (-24.3%) (-24.3%) (-24.4%) 8 2.004 2.004 2.004 2.003 2.002 2.001 (-25.4%) (-25.3%) (-25.3%) (-25.4%) (-25.4%) (-25.5%) 12 1.278 1.279 1.279 1.279 1.278 1.278 (-52.4%) (-52.3%) (-52.4%) (-52.4%) (-52.4%) (-52.4%) 16 1.241 1.241 1.241 1.240 1.241 1.241 (-53.8%) (-53.8%) (-53.8%) (-53.8%) (-53.8%) (-53.8%) 20 1.220 1.220 1.220 1.219 1.219 1.220 (-54.6%) (-54.5%) (-54.6%) (-54.6%) (-54.6%) (-54.6%) reduces the op eration cost by 22.8% (from 3.478 × 10 6 to 2.685 × 10 6 ). • When applying NTO, the objective function v alue did not c hange based on whether VID was applied, unlik e with xed topology . Optimizing the top ology had already signicantly reduced the ob jective function, so applying VID ma y not b e able to further reduce the cost. In some cases, the ob jective function increased with the VID application, but this result is due to an optimalit y gap of 0.5% and can be disregarded. Ho w- ev er, this observ ation might b e system-dependent. • W e achiev e an accumulativ e reduction in the op era- tion cost by 65.6% and 64.9% for high and low wind scenarios, resp ectively , using NTO, DLR, and VID applied to 20 transmission lines. F urthermore, Fig. 5 presen ts the av erage of high and lo w wind scenario ob jectives considering dierent com bi- nations of the transmission lines equipp ed with VID and DLR technologies. According to the plot, the ob jectiv e function v alue is signicantly reduced by whether DLR is applied. How ever, it is not aected by the application of VID, indicating that it shows an almost constant v alue regardless of VID application. Fig. 5. A verage system cost under v arying num b ers of applied DLR and VID lines (optimized top ology using NTO). C. Case 118 System W e also v alidate the prop osed algorithm on a larger net w ork: case 118 [31], which consists of 186 lines. W e presen t the results for the case with 60 lines equipp ed with VID and DLR technologies. W e sim ulate for b oth the high, and low wind cases and the corresponding results are presen ted in T able V. The simulation was conducted at 6- hour interv als by calculating the a v erage of w eather data and load data ev ery six hours from the single day’s data. The ob jective function for the whole da y was calculated b y m ultiplying it b y six. T ABLE V Cost comparison with NTO, DLR and VIDs under the low and high wind cases. (Case 118 system) Method Low wind High wind Fixed top ology 6,032,010 6,032,010 Fixed top ology + DLR 5,030,689 (-16.6%) 4,863,346 (-19.4%) Fixed top ology + VID 5,817,897 (-3.6%) 5,817,897 (-3.6%) Fixed top ology + DLR + VID 4,929,413 (-18.3%) 4,782,459 (-20.7%) NTO 5,311,093 (-12.0%) 5,311,093 (-12.0%) NTO + DLR 4,334,524 (-28.1%) 4,186,034 (-30.6%) NTO + VID 5,309,058 (-12.0%) 5,309,058 (-12.0%) NTO + DLR + VID 4,333,579 (-28.2%) 4,183,152 (-30.7%) As it can be observ ed, NTO, DLR, and VID alone reduce the cost of op eration by 12%, 19.4% and 3.6% resp ectiv ely for the high wind scenario. The cost reduction p ercen tage for DLR alone reduces to 16.6% for the lo w wind scenario. This suggests that NTO alone is most eec- tiv e. When all the GET s are used, i.e., NTO+DLR+VID, w e can reduce the operation cost b y 28.2% and 30.7% in the low and high wind scenarios, resp ectively . Again, the inuence of adding VID is almost negligible when used together with NTO, whereas VID contributed to the case of xed top ology . Overall, these results motiv ate the use of co-optimization techniques as the combination of GET s (NTO, DLR, and VIDs) has a signicant impact on the net cost reduction. D. Computational performance W e also present the computational p erformance of the dev elop ed algorithm, whic h is run on a workstation with sp ecications as Intel(R) Core(TM) Ultra 5 235 (3.40 GHz), RAM: 32.0GB. The table sho ws the simulation time required for each Case24_ieee_rts System and Case 118 system. The computation time for eac h case is shown in the T able VI. As it can b e seen, sim ulations with xed top ology are quite fast with and without VID, whereas the com bination of bilinear terms (due to VID) and binary v ariables drastically increases the computation time. T ABLE VI Computational time comparison for dierent systems and metho ds for p er-hour Simulation. System Method Computational time (s) Case24_ieee_rts Fixed topology 0.48 Fixed topology + DLR + VID 0.97 NTO 2.75 NTO + DLR + VID 286.29 Case 118 Fixed top ology 1.06 Fixed topology + DLR + VID 2.44 NTO 93.33 NTO + DLR + VID 922.13 V. Conclusion This w ork presented a co-optimization framework that co ordinates dierent grid enhancing technologies, suc h as netw ork top ology optimization, v ariable imp edance devices, and dynamic line rating - equipped transmission lines with an ob jective to minimize the op eration cost. The problem included bilinear constraints due to v ariable imp edance in the topology optimization mo del, making it a mixed in teger non-linear problem. The optimization problem is solv ed for t w o IEEE test cases: case 24 and case 118, and for dieren t wind conditions. The sim ulation results on case 24 indicate that DLR alone (on 20 out of 38 lines) is quite eective in improving the op eration cost, reducing the cost in the range of 40- 50 %. With VID alone (on 20 out of 38 lines), the op eration cost can be reduced by 11.4%, and with NTO alone, the op eration cost can be reduced b y 22.8%. W e observed that com bining all the technologies, i.e., NTO, DLR, and VID, is able to reduce the op eration cost up to 65%, which is quite signicant. F or the case 118, we observed a cost reduction of almost 30% with NTO and VID, and DLR applied on 50 out of 186 lines. These results demonstrate the eectiveness of the prop osed sc heme in coordinating dieren t grid-enhancing technologies. F uture w ork will fo cus on improving the computational p erformance of the prop osed algorithm by explicitly lin- earizing the non-linear terms with feasibility and opti- malit y guarantees. The obtained results also motiv ate for optimal sizing and placements of the grid-enhancing tec hnologies. References [1] Y. Lin, J. H. Eto, B. B. Johnson, J. D. Flic ker, R. H. Lasseter, H. N. V. Pico, G.-S. Seo, B. J. Pierre, A. Ellis, J. Miller et al., “Path wa ys to the next-generation p ow er system with inv erter-based resources: Challenges and re commendations,” IEEE Electrication Magazine, vol. 10, no. 1, pp. 10–21, 2022. [2] U.S. Department of Energy ., “Ev aluating the reliability and security of the united states electric grid,” July , 2025. [Online]. A v ailable: https://www.energy.gov/sites/ default/files/2025- 07/DOE%20Final%20EO%20Report%20% 28FINAL%20JULY%207%29.pdf [3] X. Liang, “Emerging p ow er qualit y c hallenges due to in tegration of renewable energy sources,” IEEE T ransactions on Industry Applications, vol. 53, no. 2, pp. 855–866, 2016. [4] North American Electric Reliabilit y Corp oration., “Characteristics and risks of emerging large loads - large loads task force white pap er,” July , 2025. [Online]. A v ailable: https://www.nerc.com/comm/RSTC_Reliability_ Guidelines/Whitepaper%20Characteristics%20and%20Risks% 20of%20Emerging%20Large%20Loads.pdf [5] C. Lee, S. K. Ng, J. Zhong, and F. F. W u, “T ransmission expansion planning from past to future,” in 2006 IEEE PES power systems conference and exp osition. IEEE, 2006, pp. 257–265. [6] S. De La T orre, A. J. Conejo, and J. Contreras, “T ransmission expansion planning in electricity mark ets,” IEEE transactions on p ow er systems, vol. 23, no. 1, pp. 238–248, 2008. [7] P . Denholm, E. Ela, B. Kirby , and M. Milligan, “Role of energy storage with renew able electricit y generation,” National Renewable Energy Lab.(NREL), Golden, CO (United States), T ech. Rep., 2010. [8] R. Piansky , R. Gupta, and D. K. Molzahn, “Optimizing battery and line undergrounding inv estments for transmission systems under wildre risk scenarios: A b enders decomposition ap- proach,” Sustainable Energy , Grids and Netw orks, p. 101838, 2025. [9] U.S. Department of Energy ., “Grid-enhancing tec hnologies: Unlocking the full potential of transmission capacit y ,” 2021. [Online]. A v ailable: https://www.energy.gov/gdo/ grid- enhancing- technologies [10] O. Mirzapour, X. Rui, and M. Sahraei-Ardakani, “Grid- enhancing technologies: Progress, challenges, and future re- search directions,” Electric P o wer Systems Research, vol. 230, p. 110304, 2024. [11] T. Su, J. Zhao, A. Gomez-Exposito, Y. Chen, V. T erzija, and J. P . Gen tle, “Grid-enhancing tec hnologies for clean energy systems,” Nature Reviews Clean T echnology , vol. 1, no. 1, pp. 16–31, 2025. [12] R. Bac her and H. Glavitsc h, “Netw ork top ology optimization with security constraints,” IEEE T ransactions on Po wer Sys- tems, vol. 1, no. 4, pp. 103–111, 2007. [13] M. Heidarifar and H. Ghasemi, “A netw ork top ology optimiza- tion model based on substation and no de-breaker mo deling,” IEEE T ransactions on Po wer Systems, vol. 31, no. 1, pp. 247– 255, 2016. [14] R. Xiao, Y. Xiang, L. W ang, and K. Xie, “Po wer system reliability ev aluation incorp orating dynamic thermal rating and netw ork topology optimization,” IEEE T ransactions on Po wer Systems, vol. 33, no. 6, pp. 6000–6012, 2018. [15] U.S. Department of Energy ., “Dynamic line rat- ing - rep ort to congress,” 2019. [Online]. A v ail- able: https://www.energy.gov/sites/prod/files/2019/08/f66/ Congressional_DLR_Report_June2019_final_508_0.pdf [16] F. Kreikebaum, D. Das, Y. Y ang, F. Lambert, and D. Div an, “Smart wires—a distributed, low-cost solution for controlling power ows and monitoring transmission lines,” in 2010 IEEE PES Innov ative Smart Grid T ec hnologies Conference Europ e (ISGT Europ e). IEEE, 2010, pp. 1–8. [17] M. Sahraei-Ardakani and K. W. Hedman, “Computationally ecient adjustment of facts set p oints in dc optimal p ow er ow with shift factor structure,” IEEE T ransactions on Po wer Systems, vol. 32, no. 3, pp. 1733–1740, 2016. [18] R. Xiao, Y. Xiang, L. W ang, and K. Xie, “Bulk p ower system reliability evaluation considering optimal transmission switch- ing and dynamic line thermal rating,” in 2016 International Conference on Probabilistic Metho ds Applied to Po wer Systems (PMAPS). IEEE, 2016, pp. 1–5. [19] K. W u, L. W ang, H. Ha, and Z. W ang, “Dynamic line rating and optimal transmission switching for maximizing renewable energy sources injection with voltage stability constraint,” Ap- plied Energy , vol. 378, p. 124651, 2025. [20] A. Nikoobakht, J. Aghaei, T. Niknam, M. Shae-khah, and J. P . Catalao, “Smart wire placemen t to facilitate large-scale wind energy in tegration: an adaptive robust approach,” IEEE T ransactions on Sustainable Energy , vol. 10, no. 4, pp. 1981– 1992, 2018. [21] A. Nasri, A. J. Conejo, S. J. Kazempour, and M. Ghandhari, “Minimizing wind p ow er spillage using an opf with facts de- vices,” IEEE T ransactions on Pow er Systems, v ol. 29, no. 5, pp. 2150–2159, 2014. [22] O. Ziaee and F. Cho obineh, “Sto chastic location-allo cation of tcsc devices on a p ow er system with large scale wind genera- tion,” in 2016 IEEE Po wer and Energy Society General Meeting (PESGM). IEEE, 2016, pp. 1–5. [23] M. Sahraei-Ardakani and K. W. Hedman, “A fast lp approach for enhanced utilization of v ariable imp edance based facts devices,” IEEE T ransactions on Po w er Systems, vol. 31, no. 3, pp. 2204–2213, 2015. [24] Y. Sang, M. Sahraei-Ardakani, and M. P arv ania, “Stochastic transmission imp edance con trol for enhanced wind energy in- tegration,” IEEE T ransactions on Sustainable Energy , vol. 9, no. 3, pp. 1108–1117, 2017. [25] B. Stott, J. Jardim, and O. Alsaç, “Dc p ow er ow revisited,” IEEE T ransactions on Po wer Systems, vol. 24, no. 3, pp. 1290– 1300, 2009. [26] D. Atanack ovic, D. McGillis, and F. Galiana, “Reliability comparison of substation designs,” IEEE transactions on pow er delivery , vol. 14, no. 3, pp. 903–910, 1999. [27] “Ieee standard for calculating the current-temperature relation- ship of bare o verhead conductors,” IEEE Std 738-2023 (Revision of IEEE Std 738-2012), pp. 1–56, 2023. [28] C.-M. Lai, J. T eh, B. Alharbi, A. AlKassem, A. Aljabr, and N. Alshammari, “Optimisation of generation unit commitment and netw ork top ology with the dynamic thermal rating system considering n-1 reliabilit y ,” Electric Po wer Systems Research, vol. 221, p. 109444, 2023. [29] O. Pohl, S. Dalhues, and C. Rehtanz, “Dc-sensitivities for impedance controllers in an agen t-based pow er ow control system,” in 2018 IEEE Po wer & Energy Society Innov ative Smart Grid T echnologies Conference (ISGT), 2018, pp. 1–5. [30] A. Mitsos, B. Chac huat, and P . I. Barton, “Mccormic k-based relaxations of algorithms,” SIAM Journal on Optimization, vol. 20, no. 2, pp. 573–601, 2009. [31] S. Babaeinejadsarookolaee, A. Birc held, R. D. Christie, C. Cof- frin, C. DeMarco, R. Diao, M. F erris, S. Fliscounakis, S. Greene, R. Huang et al., “The pow er grid library for benchmarking ac op- timal p ow er ow algorithms,” arXiv preprin t 2019. [32] R. Gupta, F. Sossan, and M. Paolone, “Grid-a ware distributed model predictive control of heterogeneous resources in a dis- tribution netw ork: Theory and exp erimental v alidation,” IEEE T ransactions on Energy Conv ersion, v ol. 36, no. 2, pp. 1392– 1402, 2021. [33] National Oceanic and A tmospheric Administration (NOAA), National Centers for En vironmental Information (NCEI), “Climate data online (cdo),” 2025, accessed: 2025-09-17. [Online]. A v ailable: https://www.ncei.noaa.gov/cdo- web/ [34] O. Pohl, “Co ordination of imp edance controllers and exible power for curative congestion management in real-time applica- tions,” Ph.D. dissertation, Dissertation, Dortmund, T echnische Universität, 2024, 2024. [35] W. W ang and S. Pinter, “Dynamic line rating systems for transmission lines: T opical rep ort,” US Department of Energy , Oce of Electricity Delivery & Energy Reliability , 2014.
Original Paper
Loading high-quality paper...
Comments & Academic Discussion
Loading comments...
Leave a Comment