Depth-Enhanced YOLO-SAM2 Detection for Reliable Ballast Insufficiency Identification
This paper presents a depth-enhanced YOLO-SAM2 framework for detecting ballast insufficiency in railway tracks using RGB-D data. Although YOLOv8 provides reliable localization, the RGB-only model shows limited safety performance, achieving high preci…
Authors: Shiyu Liu, Dylan Lester, Husnu Narman
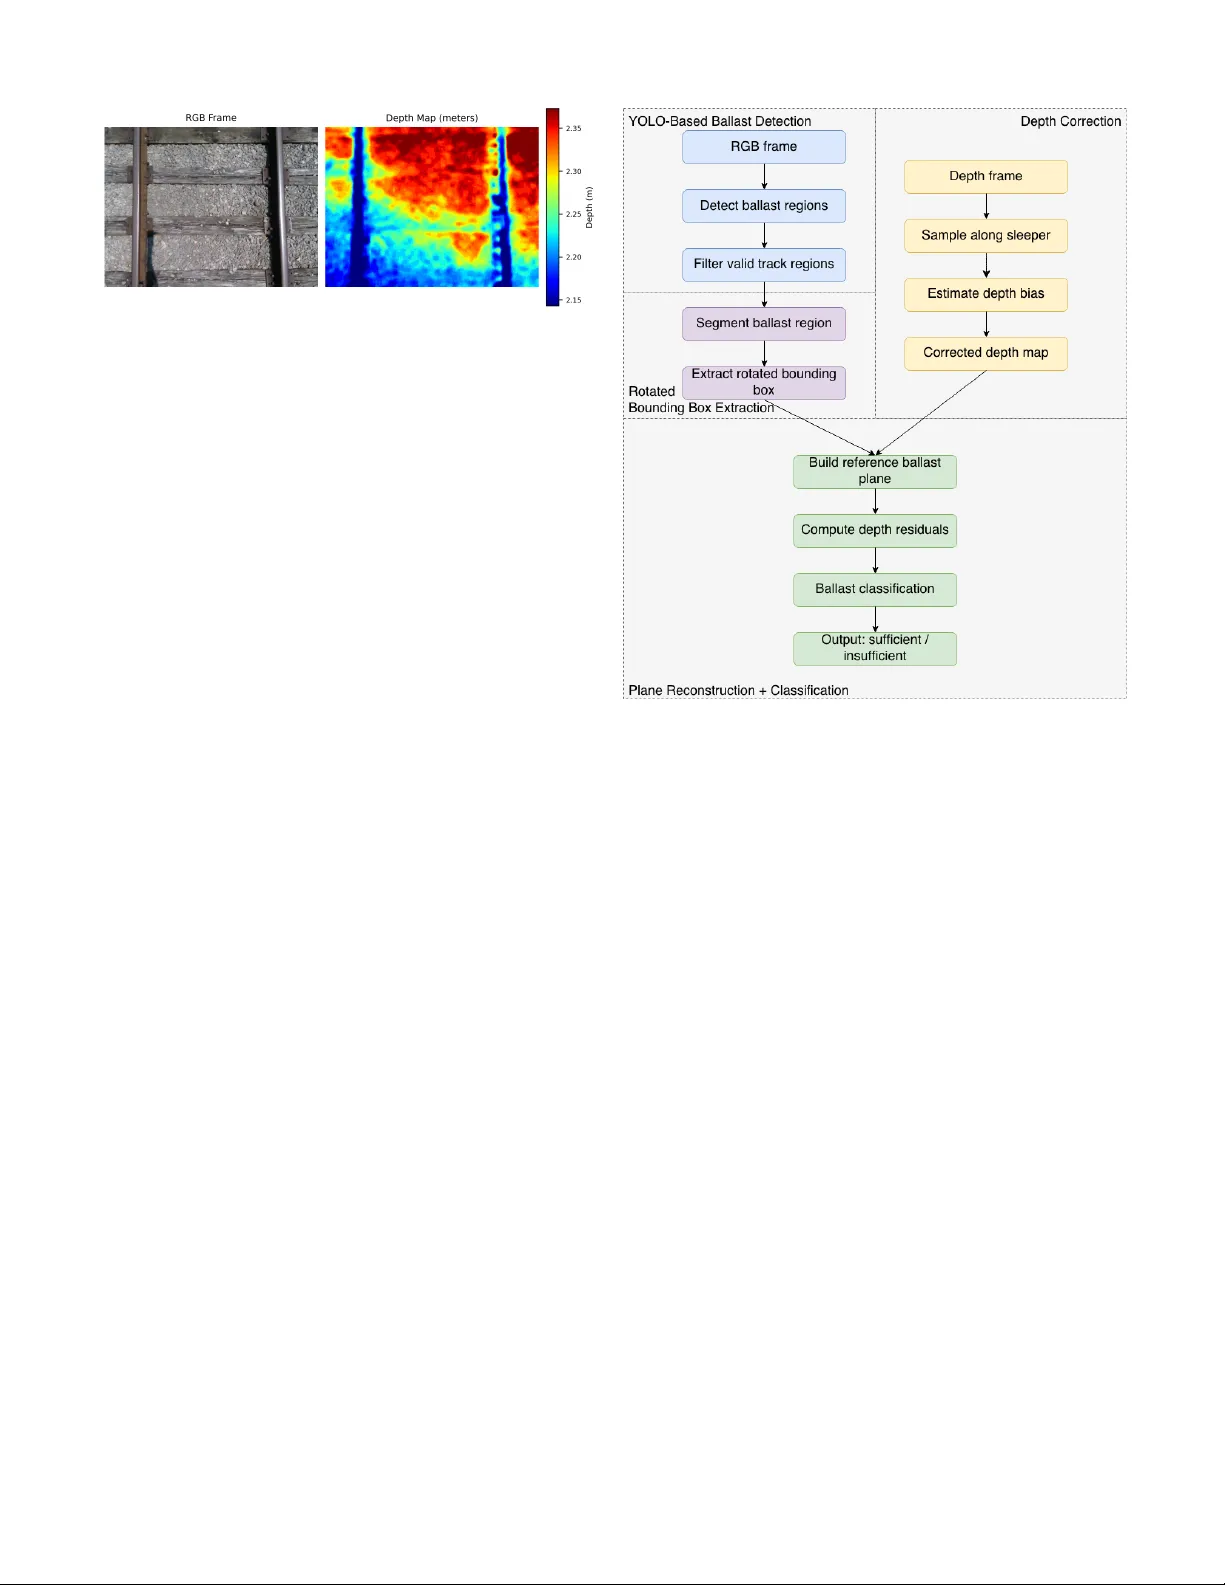
Depth-Enhanced Y OLO–SAM2 Detection for Reliable Ballast Insuf ficiency Identification Shiyu Liu 1 , Dylan Lester 1 , Husnu Narman 2 , Ammar Alzarrad 3 , and Pingping Zhu 1* , Abstract —This paper presents a depth-enhanced Y OLO–SAM2 framework f or detecting ballast insufficiency in railway tracks using RGB–D data. Although Y OLOv8 pro vides reliable localization, the RGB-only model shows limited safety performance, achieving high precision (0.99) but low recall (0.49) due to insufficient ballast, as it tends to over -predict the sufficient class. T o impr ove r eliability , we incorporate depth-based geometric analysis enabled by a sleeper -aligned depth-correction pipeline that compensates for RealSense spatial distortion using polynomial modeling, RANSA C, and temporal smoothing. SAM2 segmentation further refines region-of-interest masks, enabling accurate extraction of sleeper and ballast profiles for geometric classification. Experiments on field-collected top-down RGB–D data show that depth-enhanced configurations substantially improve the detection of insufficient ballast. Depending on bounding-box sampling (AABB or RBB) and geometric criteria, recall increases from 0.49 to as high as 0.80, and F1-score improves from 0.66 to over 0.80. These results demonstrate that integrating depth correction with YOLO–SAM2 yields a more rob ust and reliable approach f or automated railway ballast inspection, particularly in visually ambiguous or safety-critical scenarios. Index T erms —Y OLO, SAM2, RGB-D, Ballast Insufficiency Identification I . I N T RO D U C T I O N Railway ballast is a foundational material that’ s placed be- neath and between railroad ties to support track infrastructure. It plays a crucial role in distrib uting the weight of trains, holding the tracks in place, and allowing for proper drainage. Maintaining sufficient ballast is essential to ensure the struc- tural integrity and operational safety of railway systems. Howe ver , traditional ballast inspection methods rely on manual visual inspection. It is labor-intensiv e, inconsistent due to subjectiv e judgment across different workers and en viron- mental conditions, and sometimes unsafe, as inspectors must physically access acti ve track environments. Recent adv ances in computer vision hav e enabled automated analysis of railway imagery [1], [2], [3]. YOLO (Y ou Only Look Once) [4],is a real-time object detection frame work that This research was supported by the US Army Corps of Engineers (US- A CE) - The Engineer Research and Development Center (ERDC) - Grant: W912HZ249C006 1 Shiyu Liu, Dylan Lester, and Pingping Zhu are with the Department of Biomedical and Electrical Engineering, Marshall University , Huntington, WV 25755, USA. (e-mails: liu137@marshall.edu; lester299@marshall.edu; zhup@marshall.edu) 2 Husnu Narman is with the Department of Computer Science, Marshall Univ ersity , Huntington, WV 25755, USA. (e-mails: narman@marshall.edu) 3 Ammar Alzarrad is with the Department of Civil Engineering, Marshall Univ ersity , Huntington, WV 25755, USA. (e-mails: alzarrad@marshall.edu) *Corresponding author: Pingping Zhu (email: zhup@marshall.edu) rapidly predicts the locations and classes of objects within an image using a single neural network. YOLO-based models can efficiently identify and localize ballast regions from RGB images. Howe v er , relying only on RGB data is insufficient. It can’t capture the depth information necessary to determine whether the ballast is physically sufficient. Depth sensing offers geometric information that can address these limitations. The integration of RGB-D sensing has gained traction in broader infrastructure inspection tasks [5], [6], [7]. Howe ver , depth sensors such as the Intel RealSense often show spatially v arying bias and surface warping due to sensor tilt and environmental conditions. W ithout correcting these depth distortions, the measurements are unreliable. Many researchers have inv estigated distortion-correction techniques for RealSense depth sensors [8], [9], [10]. The broader aim of this paper is to enhance the safety and reliability of railway operations by enabling accurate, automated, and repeatable assessment of ballast conditions using vision-based methods. The specific objectiv e of this work is to develop an RGB–D inspection system that automat- ically detects insuf ficient ballast by integrating deep-learning- based region detection, precise segmentation, and geometri- cally robust depth correction. Our pipeline uses YOLOv8 [11] for initial ballast detection, followed by Segment Anything Model 2 (SAM2) [12] for precise mask refinement and rotated bounding-box extraction, ensuring accurate alignment with the physical orientation of the ballast regions. W e introduce a nov el depth-bias correction method that uses RANSA C-based [13] polynomial fitting and temporal smoothing to stabilize depth estimates over time, mitigating spatial distortions in- herent in raw sensor data. Using this corrected depth data, we reconstruct ideal ballast planes within each rotated re gion and apply a dual-metric classification strategy to distinguish sufficient from insufficient ballast re gions. The ef fectiv eness of this approach is v alidated in Sec- tion IV, where we compare three models: YOLO-only , YOLO with depth, and our rotated-box depth-enhanced algorithm. While Y OLO-only achieves an F1-score of 0.74 b ut suffers from dangerous false positives, our rotated-box depth method achiev es the best performance with an F1-score of 0.81 and a recall of 0.90 for insufficient ballast, representing a substantial improv ement in safety-critical detection. The remainder of this paper is organized as follows. Section II formulates the RGB–D ballast suf ficiency detection prob- lem. Section III presents the proposed methodology , includ- ing YOLO-based ballast detection, SAM2 segmentation with rotated bounding boxes, depth correction, and dual-criteria Fig. 1. RGB frame (left) and corresponding raw depth map (right) captured by the RealSense D435. sufficienc y classification. Section IV describes the dataset, ev aluation metrics, and experimental results comparing the proposed approach with RGB-only and non-rotated depth baselines. Finally , Section V concludes the paper and discusses directions for future work. The main contrib utions of this work are: • An integrated RGB-D pipeline for automated ballast inspection, combining YOLO detection and SAM2 seg- mentation, and rotated bounding-box extraction tailored to railway geometry . • A robust spatial bias correction method using RANSAC- fitted polynomial surfaces and temporal smoothing, en- abling consistent depth measurement without external calibration. • A dual-criteria ballast sufficiency classifier that jointly ev aluates global depth residuals and localized gap indi- cators to reliably identify insufficient ballast with high precision. I I . P RO B L E M F O R M U L A T I O N The goal of this project is to determine whether each sleeper bay contains sufficient ballast using the RGB and depth (RGB- D) image data captured by a top-mounted Intel RealSense D435 camera. As shown in Fig. 1, each frame consists of an RGB image represented by the function I RGB : Ω → [0 , 255] 3 , (1) and a corresponding aligned depth map represented by D raw : Ω → R + . (2) The shared domain of these functions is the discrete pixel grid ( x, y ) ∈ Ω = [1 , . . . , W ] × [1 , . . . , H ] , which specifies the spatial coordinates of the RGB-D image pair . Follo wing object detection, let N denote the number of ballast segments identified in a giv en frame. The objectiv e is to assign each se gment a suf ficiency label s i ∈ { sufficient , insufficient } , i = 1 , . . . , N (3) In this paper, we assume that the RGB–D alignment provided by the Intel RealSense software is accurate and dependable. Even under this assumption, two major challenges remain. Challenge-I: ballast se gments appear with differ ent Fig. 2. Flowchart of the proposed ballast suf ficiency detection algorithm based on RGB–D sensing and rotated bounding box geometry orientations due to trac k g eometry and the camera’ s viewpoint, making r otated bounding r e gions necessary for consistent and pr ecise sampling. Challenge-II: the raw depth data exhibits spatially varying tilt and bias, which must be corrected befor e any r eliable geometric analysis can be performed. I I I . M E T H O D O L O G Y T o achiev e automated identification of insufficient ballast regions from RGB–D imagery , we introduce a nov el frame- work that integrates YOLO-based detection with SAM2 seg- mentation, referred to as the YOLO–SAM2 approach. The ov erall architecture of the proposed method is illustrated in Fig. 2 and consists of four main components: (1) a YOLO- based ballast detection module, (2) a SAM2 segmentation and rotated bounding box extraction module, (3) a depth correction module, and (4) a plane reconstruction and ballast sufficienc y classification module. A. YOLO-Based Ballast Detection Our system first applies YOLOv8 to the RGB frame to localize ballast regions. Giv en an RGB image I RGB , the existing Y OLOv8 approach can predict a finite set of axis- aligned bounding boxes: B = { b i = ( x i , y i , w i , h i , c i ) } N i =1 , (4) where ( x i , y i ) ∈ Ω are the center coordinates, ( w i , h i ) denote the width and height of the i -th bounding box, and c i ∈ [0 , 1] is the corresponding confidence score. After non-maximum sup- pression, lo w-confidence boxes are removed using a threshold T c , such that c i ≥ T c for all i ∈ { 1 , . . . , N } . Because insufficient ballast is typically found in the area between the rails, the Y OLO-based detection is limited to the central 70% of the image width. This constraint helps reduce false positives and ensures the analysis focuses on the relev ant track region. The resulting bounding boxes within this area are then used as preliminary regions of interest (R OI) for subsequent segmentation and depth-based ev aluation. B. SAM2 Segmentation and Rotated Bounding Box Extraction Although Y OLOv8 provides reliable initial localization, its axis-aligned bounding boxes often fail to match the actual geometric orientation of the ballast structures ( Challenge-I in Section II). T o address this, each ROI is processed by the SAM2 segmentation module for mask refinement and rotated bounding-box extraction, ensuring alignment with the railroads’ true physical layout. Follo wing the YOLO-based detection, each axis-aligned bounding box is refined using SAM2. Instead of generating a mask on the full image domain Ω , we first crop the sub-image defined by the YOLO R OI b i and use this cropped region as both the SAM2 input and the spatial prompt. This ROI-guided segmentation restricts SAM2 to the ballast instance identified by YOLO and prevents unrelated track elements from being included in the mask. Formally , let Ω i ⊂ Ω denote the cropped region correspond- ing to b i . SAM2 produces a binary mask: M i ( x, y ) ∈ { 0 , 1 } , ( x, y ) ∈ Ω i , (5) which is then mapped back to the full-image coordinates. Light post-processing, including morphological closing and removal of small isolated components, is applied to enhance mask co- herence. Importantly , this procedure is applied independently to each preliminary R OI, resulting in one refined mask per Y OLO detection. T o better align with the physical orientation of the ballast structures, we compute a rotated minimum-area bounding rectangle for each cleaned mask M i : b r i = ( x r i , y r i , α i , w r i , h r i ) , (6) where ( x r i , y r i ) denote the center of the rotated rectangular bounding-box in image coordinates, α i ∈ ( − π / 2 , π / 2) is the rotation angle, and w r i , h r i represent the width and height along the rotated axes. This rotated bounding box b r i is generated for each preliminary R OI, ensuring that e very detected ballast region obtains its own geometry-aligned representation. These rotated bounding boxes provide a spatially accurate representation of the ballast regions that aligns with the track orientation and enables more consistent depth sampling, which is critical for reliable depth correction and subsequent geometric analysis. C. Depth Corr ection Depth measurements obtained from Intel RealSense sensors often exhibit systematic spatial biases caused by factors such as sensor tilt, lens distortion, and en vironmental conditions ( Challenge-II in Section II). These biases typically manifest as large-scale planar tilting or curved warping across the depth image, which must be corrected to ensure accurate ballast depth estimation. In this section, we present a robust depth correction method that models and removes these distortions using a polynomial surface fitted from sleeper-aligned depth samples. 1) P olynomial Bias Model: T o compensate for the smooth, spatial distortion present in raw RealSense depth maps, we model the depth bias using a lo w-order 2D polynomial surface: ∆ z ( x, y | θ ) = θ 1 x + θ 2 y + θ 3 x 2 + θ 4 y 2 + θ 5 xy + θ 6 , (7) where ( x, y ) ∈ Ω are pixel coordinates and θ = ( θ 1 , θ 2 , θ 3 , θ 4 , θ 5 , θ 6 ) are the distortion parameters. The first fiv e terms describe the spatially v arying tilt–curvature field, while θ 6 represents a global depth offset. Since ballast suf- ficiency depends only on relative height between ballast and sleepers, this constant of fset does not influence the geometric decision. W ith this decomposition, the raw depth measurement at pixel ( x, y ) can be e xpressed as D raw ( x, y ) = D true ( x, y ) + ∆ z ( x, y | θ ) + ϵ ( x, y ) , (8) where D true ( x, y ) is the unknown true depth and ϵ ( x, y ) rep- resents high-frequency noise and residual fitting error . Then, we can hav e the corrected depth D corr , which is expressed by D corr ( x, y | θ ) = D raw ( x, y ) − ∆ z ( x, y | θ ) (9) The correct depth D corr is an approximate of the unknown true depth D true ( x, y ) . This polynomial model provides a compact and effecti ve approximation of the lo w-frequenc y distortion field. Subtract- ing the estimated bias surface removes large-scale tilt and curvature while preserving the geometric detail necessary for accurate ballast surface reconstruction and sufficiency classi- fication. 2) Sleeper Sample Extraction: Accurate depth bias estima- tion relies on sampling from regions where the true depth profile follows a simple planar structure. In railway scenes, the sleeper surfaces between adjacent ballast segments meet this criterion. Therefore, we extract depth samples exclusi vely from sleeper regions to serve as reliable ground truth for polynomial bias fitting. For each pair of neighboring rotated bounding boxes (rboxes) b r i and b r i +1 , we compute the midline between their adjacent edges as the sleeper sampling line. This midline is aligned with the orientation of the rboxes and ensures that depth samples lie precisely on top of the sleeper surface, av oiding contamination from ballast or background regions. In cases where a ballast re gion lies at the top or bottom of the frame, without an adjacent rbox abov e or below . W e apply a fallback strategy , extract depth samples along a horizontal line offset by ∆ w = 10 pixels above or below the rbox boundary , respectively . This ensures sampling consistency across frames and layout v ariations. After extraction, raw depth values may still contain spikes or missing data due to sensor noise or segmentation imper- fections. T o enhance robustness, we apply Median Absolute Deviation (MAD) [14] filtering. Let S d = { ( x n , y n , z n ) } N s n =1 denote the set of sleeper-aligned raw depth samples, where N s is the total number of extracted samples and z n = D raw ( x n , y n ) is the raw depth at pixel ( x n , y n ) . The filtered sleeper depth samples are: S f d = { ( x n , y n , z n ) ∈ S d : | z n − ˜ z | < τ · MAD( Z d ) } , (10) where ˜ z is the median of Z d = { z n } N s n =1 , MAD( Z d ) indicates the MAD of the set Z d , and τ is a scalar threshold that determines the acceptable deviation range. Samples satisfy- ing this condition are retained for subsequent bias surface estimation. This sleeper sampling strategy ensures that bias estimation operates on geometrically meaningful and noise- resistant depth measurements. 3) RANSA C-Based Robust Bias Estimation: The raw Re- alSense depth measurements contain spatially varying bias caused by sensor tilt, stereo-matching distortion, and en viron- mental noise. Since no ground-truth depth is av ailable, we exploit the geometric fact that sleeper surfaces are approx- imately planar in the real world. Therefore, the raw depth samples extracted from sleeper regions, denoted by S f d , should ideally lie on a single smooth surface. Deviations within this set arise from sensor noise, segmentation imperfections, and partial occlusion. T o robustly estimate the polynomial bias surface under such outliers, we use the RANSA C [13] procedure. In each itera- tion, a minimal subset of sleeper samples is randomly selected to generate a candidate bias model ∆ z ( x, y | θ ) . All remaining samples are ev aluated against this candidate, and those whose depth discrepancies fall belo w a tolerance threshold T res are counted as inliers. The model producing the largest inlier set is selected as the best hypothesis. Let S in denote the resulting inlier set. Each inlier sample ( x n , y n , z n ) ∈ S in corresponds directly to a depth value z j taken from the raw depth map within the sleeper region. Because the true sleeper surface is approximately planar in the real world, any smooth, spatially coherent variation observ ed across these inlier depths cannot be explained by actual geometry . Instead, such low-frequenc y variation reflects the underlying distortion introduced by the depth sensor . Therefore, the bias surface can be refined by minimizing the approximated v ariance of the corrected depth data: θ ∗ = arg min θ X ( x n ,y n ,z n ) ∈S in [ D corr ( x n , y n | θ ) − ¯ z in ] 2 (11) where ¯ z in is the av erage of D corr ( x n , y n | θ ) for all ( x n , y n , z n ) ∈ S in . Furthermore, considering the flat nature of sleepers, we assume that ¯ z in is a constant, and can be absorbed by the parameter θ 6 . 4) Depth Corr ection: For each input frame, the polynomial bias parameters θ ∗ estimated by RANSA C are used to cor- rect the spatial depth distortion. T o ensure smooth temporal transitions and reduce frame-to-frame flicker , we apply an exponential moving average (EMA) [14] filter to the bias coefficients. Let θ raw k denote the RANSAC-refined parameters from the k th frame (i.e., θ raw k = θ ∗ k for the k th frame). The temporally stabilized parameters are then computed as: θ k = λ θ raw k + (1 − λ ) θ k − 1 , (12) where θ k is the smoothed parameter vector applied to the current frame, and λ ∈ (0 , 1) is a smoothing factor that controls the relative contribution of the current vs. pre vious estimates. This temporal stabilization ensures smooth transitions in the corrected depth field, minimizing fluctuations due to transient noise or unstable sampling re gions. Depth correction is then performed by removing only the spatially varying component of the estimated distortion field (the terms associated with θ 1 through θ 5 ). The constant of fset parameter c is not remov ed during correction and is intention- ally preserved. Retaining this global offset keeps the corrected depth values within a numerically stable range and pre vents the depth map from collapsing to ward zero or negati ve values. Since ballast suf ficiency depends solely on relative height differences between ballast and sleeper surfaces, the absolute offset does not influence the subsequent geometric analysis. By removing only the spatial distortion while preserving the global depth level, the corrected depth map faithfully reflects the true relati ve geometry of the scene. This stabilized depth field provides a reliable foundation for constructing sleeper reference planes and performing ballast sufficiency classification in later stages. D. Plane Reconstruction and Ballast Suf ficiency Classification W ith the corrected depth map D corr ( x, y ) for all ( x, y ) ∈ Ω , we reconstruct the ideal sleeper-aligned reference plane for each ballast region and ev aluate ballast sufficiency based on depth deviations relativ e to this plane. This section describes how the reference depth surface is derived within each ro- tated bounding box and ho w ballast condition is subsequently classified using rob ust geometric metrics. 1) Refer ence Plane Construction: For each rotated bound- ing box b r i , we operate in its local rotated coordinate system ( u, v ) , where u and v denote the horizontal and vertical axes of the rotated rectangle, respectiv ely . Let R r i denote the set of pixels belonging to the i -th rotated box expressed in this local coordinate frame. Under sufficient ballast conditions, the ballast surface be- tween the upper and lower sleeper boundaries is expected to vary approximately linearly along the v -axis. W e therefore extract corrected depth profiles along the top and bottom edges of the rotated box. Let z top ( u ) and z bot ( u ) denote the depth profiles sampled at v = 0 and v = h r i , where h r i is the height of b r i in the rotated coordinate system. For any pixel ( u, v ) ∈ R r i , the reference depth is computed by linear interpolation between these two boundary profiles: Π i ( u, v ) = 1 − v h r i z top ( u ) + v h r i z bot ( u ) . (13) This construction yields a locally planar sleeper-aligned ref- erence surf ace within each rotated box, adapting to v ariations in sleeper tilt and depth bias. 2) Depth Residual Computation: Given the rotated bound- ing region R r i , the depth residual for each pixel ( u, v ) ∈ R r i is defined as ∆ i ( u, v ) = D corr ( u, v ) − Π i ( u, v ) , (14) where D corr is the temporally stabilized, bias-corrected depth map expressed in the rotated coordinate frame, and Π i ( u, v ) is the reference plane deri ved above. Negativ e residuals indicate that the ballast lies belo w the expected reference surface and may signal insuf ficient material. 3) Dual Ballast Sufficiency Classification: After obtaining the residual depth map for each ballast region, we classify ballast suf ficiency using two complementary criteria that cor - respond to the two dominant failure modes: wide-area ballast depression and localized sleeper–edge gaps. This dual-criteria design combines region-le vel depth statistics with boundary- sensitiv e analysis. Criterion-1 Global Residual Criterion: T o detect widespread depression, we compute the area proportion of pixels in R i whose residual lies below the reference plane by more than a threshold T z : ρ i = { ( x, y ) ∈ R i : ∆ i ( x, y ) < − T z } |R i | , (15) where |·| denotes the number of pixels in each set, equiv alently representing the relativ e area. Larger values of ρ i indicate that a significant portion of the ballast region is depressed. Criterion-2 Edge Gap Criterion: Localized ballast loss often appears near the sleeper–ballast interfaces. For a rotated bounding box b r i , we define a local coordinate system ( u, v ) aligned with the box, where u denotes the horizontal axis of the rotated box and v its vertical axis. Let h r i denote the box height along the v -axis. The edge-band thickness is set adaptiv ely as h i edge = κ h r i , κ ∈ (0 , 0 . 5) . (16) Using this coordinate system, the top and bottom edge-band regions are defined as E top i = ( u, v ) ∈ R r i : 0 ≤ v < h i edge , (17) E bot i = ( u, v ) ∈ R r i : h r i − h i edge < v ≤ h r i . (18) Let { u j } W i j =1 be the ordered set of distinct u -coordinates (columns). F or the j -th column, the corresponding edge-band area is E i,j = ( u, v ) ∈ E top i ∪ E bot i : u = u j . (19) The area proportion of depressed points within this column- wise edge band is defined as γ i,j = { ( u, v ) ∈ E i,j : ∆ i ( u, v ) < − T z } |E i,j | , (20) where pixel cardinality is used as a discrete proxy for area. Region i is classified as insufficient if either criterion is activ ated: s i = ( insufficient , if ρ i > η 1 or γ i,j > η 2 , sufficient , otherwise . (21) Here, η 1 controls the tolerance for wide-area depression, whereas η 2 gov erns the sensiti vity to localized edge gaps. I V . E X P E R I M E N T S A N D R E S U L T S T o ev aluate the proposed method, we tested it on real railroad data collected using the Intel RealSense system. Since our approach incorporates both corrected depth (CD) and Y OLO–SAM2-based rotated bounding box es (Y OLO-SAM2- RBB), we compare it with two baselines: a YOLO-only model and a Y OLO–SAM2 model using axis-aligned bounding boxes (Y OLO-SAM2-AABB). A. Dataset Collection and Pr eparation The dataset used in this study was collected using an Intel RealSense D435 camera positioned above the railroad track, providing an orthogonal top-down view of the ballast and rail structure. The D435 recorded synchronized RGB and depth frames as the camera mo ved along the track. From this dataset, 1,405 images were used for training the Y OLO model responsible for detecting the ballast area. An additional 418 images were reserved for ev aluating the algorithm. For the training data set, the set was split into 40% insufficient and 60% suf ficient. For the testing data set, the split was 55% suf fi- cient, and 45% insuf ficient. Ground-truth labels (“suf ficient” or “insufficient”) were created from RGB frames extracted from the original RealSense recordings and annotated in Roboflow . B. Evaluation Metrics The Performance comparisons are ev aluated using precision ( P ), recall ( R ), and F1-score ( F 1 ), with F1-score as the primary metric due to class imbalance. For safety-critical in- spection, false positiv es (predicting sufficient when the region is insufficient) are the most dangerous; therefore, a higher recall for insuf ficient ballast is emphasized [15]. C. YOLO-Only Baseline Results Initial experiments e v aluated the performance of the Y OLOv8 model operating solely on RGB imagery without depth information. Although a high precision is obtained ( P = 0 . 9896 ), a relatively low F1-score ( F 1 = 0 . 6620 ) is obtained due to the poor recall ( R = 0 . 4974 ), as shown in T able I. The Y OLO-Only approach tends to ov erpredict the “sufficient” class, leading to a high false-positiv e rate. Y OLO- only rarely predicts ‘insufficient’, so its predictions are almost always correct when it does, but it misses many insufficient cases. Fig. 3. Comparison of RGB image (left), raw RealSense depth map (middle), and depth map after tilt and bias correction (right). D. Effectiveness of Depth Correction T o address the limitations of RGB-only classification, the depth-enhanced algorithm was evaluated on the same test dataset. Fig. 3 illustrates the RGB frame alongside the raw and corrected depth maps used in this analysis. The corrected depth map exhibits significantly reduced spatial distortion, clearer sleeper boundaries, and a more consistent depth gradient across ballast regions, enabling more reliable detection of insufficient ballast. E. Effectiveness of Rotated Bounding Boxes An e xample of a comparison between axis-aligned bounding boxes (AABB) and corresponding rotated bounding boxes (RBB) is shown in Fig. 4, which validates the effecti v eness of the rotated bounding boxes method described in Section III-B. Fig. 4. An example of axis align bounding boxes (left) and rotated bounding boxes (right). F . Numerical Comparisons of V ariant Algorithms T o ensure consistent ev aluation across all variants, we use a unified set of implementation parameters. For Y OLO infer - ence, the confidence threshold is T c = 0 . 3 and the Intersection- ov er-Union (IoU) threshold used in Non-Maximum Suppres- sion (NMS) was 0 . 35 . Sleeper depth samples are filtered using a MAD outlier threshold of τ = 3 . 5 . The polynomial bias surface is estimated with 160 RANSAC iterations and an inlier residual threshold of T res = 0 . 01 m, followed by temporal smoothing using an exponential moving average with λ = 0 . 2 . For geometric classification, depth depressions are detected using T z = 0 . 03 m. The global residual criterion is triggered when more than η 1 = 0 . 4 of the region falls below this threshold. The edge-gap criterion uses an edge-band thickness of κ = 0 . 4 , and a column is marked insufficient when its depressed proportion exceeds η 2 = 0 . 18 . T o distinguish the contributions of the proposed dif ferent components, including two types of bounding boxes (pre- sented in Section III-B), and the different classification criteria (presented in Section III-D), we test the variant algorithms with different components on the same image data set. The numerical comparisons are tabulated in T able I. In detail, “CD- Y OLO-SAM2” indicates the proposed approaches, “ AABB” and “RBB” indicate the types of bounding boxes, and “C1” and “C2” indicate Criterion-1 and Criterion-2 in Section III-D, respectiv ely . Furthermore, to leverage the Y OLO algo- rithm, we also add the decision from the YOLO method as the third criterion, denoted by “CY” in T able I. The decisions from all criteria, including C1, C2, and CY , are combined using a logical OR rule to generate the final decision on “insufficient”. From T able I, it can be observed that we can obtain the best performance when three decision criteria are all applied. In addition, we can obtain better precision performances when the RBB is applied. In contrast, we can obtain better recall performances when the AABB is applied. In sum, our proposed approaches can obtain the good precision (close to Y OLO-Only), and best recall and F1-score performances. T ABLE I P E RF O R M AN C E C O M P A R IS O N O F D E TE C T I ON M E T HO D S Method Precision Recall F1 YOLO Only 0.9896 0.4947 0.6620 CD-YOLO-SAM2-AABB-C1-C2 0.6791 0.7644 0.7192 CD-YOLO-SAM2-RBB-C1-C2 0.7377 0.7068 0.7219 CD-YOLO-SAM2-AABB-C1-CY 0.7450 0.7801 0.7621 CD-YOLO-SAM2-RBB-C1-CY 0.8000 0.7330 0.7650 CD-YOLO-SAM2-AABB-C1-C2-CY 0.8191 0.8063 0.8127 CD-YOLO-SAM2-RBB-C1-C2-CY 0.8623 0.7539 0.8045 V . C O N C L U S I O N This paper presented a depth-corrected Y OLO–SAM2 framew ork with rotated bounding box es for reliable detection of ballast insufficienc y in real railroad en vironments. While Y OLO provides strong object-level cues, our results show that RGB-only detection tends to ov er-predict the suf ficient class, leading to poor recall for insufficient ballast—a critical lim- itation for safety-focused inspection. By integrating sleeper- aligned depth correction and SAM2-guided rotated bounding boxes, the proposed method significantly improves geometric alignment and reduces spatial distortion in the depth map. Experiments on field-collected track data demonstrate that the whole system achiev es the highest recall and F1-score among all tested configurations, correctly identifying insuf- ficient ballast ev en in challenging conditions where RGB cues are weak. The combined effect of depth correction and rotated bounding boxes yields more stable depth profiles between sleepers, enabling more accurate geometric classification and reducing missed detections in safety-critical regions. Future work will extend this framework to broader track conditions, incorporate multi-camera fusion for handling ex- treme curvature, and explore temporal consistency models for continuous, train-mounted inspection. The proposed approach provides a practical and reliable step to ward automated, vision- based railway maintenance systems. R E F E R E N C E S [1] A. d’Arms, H. Song, H. S. Narman, N. C. Y urtcu, P . Zhu, and A. Alzarrad, “ Automated railway crack detection using machine learn- ing: Analysis of deep learning approaches, ” in Proceedings of the IEEE Annual Information T echnology , Electr onics & Mobile Communication Confer ence (IEMCON) , Berkeley , CA, USA, Oct. 2024. [2] A. Chandramouli, H. Song, M. Liu, A. Damai, H. S. Narman, and A. Alzarrad, “Deep learning approaches for railroad infrastructure moni- toring: Comparing yolo and vision transformers for defect detection, ” in Pr oceedings of the IEEE Ubiquitous Computing, Electronics & Mobile Communication Conference (UEMCON) , 2025. [3] M. Liu, V . T . Le, H. Song, A. Chandramouli, H. S. Narman, and A. Alzarrad, “Comparing object detection, instance segmentation, and semantic segmentation for automated vegetation detection in railroad systems, ” 2025. [4] J. Redmon, S. Di vvala, R. Girshick, and A. Farhadi, “Y ou only look once: Unified, real-time object detection, ” in Proceedings of the IEEE Confer ence on Computer V ision and P attern Recognition (CVPR) , Las V egas, NV , USA, Jun. 2016, pp. 779–788. [5] T . Ghosh Mondal, M. R. Jahanshahi, and Z. Y . W u, “Deep learning- based rgb-d fusion for multimodal condition assessment of civil infras- tructure, ” Journal of Computing in Civil Engineering , vol. 37, no. 4, p. 04023017, 2023. [6] S. Einizinab, K. Khoshelham, S. Winter , and P . Christopher, “ Automated geometric inspection of building pipes using rgb-d images captured by a mixed reality device, ” Journal of Computing in Civil Engineering , vol. 40, no. 1, p. 04025127, 2026. [7] B. W ´ ojcik and M. ˙ Zarski, “The measurements of surface defect area with an rgb-d camera for a bim-backed bridge inspection, ” Bulletin of the P olish Academy of Sciences. T echnical Sciences , vol. 69, no. 3, 2021. [8] H. J. Park and K. B. Kim, “Depth image correction for intel realsense depth camera, ” Indones. J. Electr . Eng. Comput. Sci , vol. 19, pp. 1021– 1027, 2020. [9] K. T anaka, M. Sano, Y . Horimai, H. Horimai, and Y . Aoki, “Geomet- ric correction method applying the holographic ray direction control technology , ” Journal of Robotics and Mechatr onics , vol. 33, no. 5, pp. 1155–1168, 2021. [10] P . Heinisch, F . Arzberger , and A. N ¨ uchter , “Inertial lidar motion dis- tortion correction on spherical mobile mapping systems for planetary exploration, ” in 2024 International Conference on Space Robotics (iS- paRo) . IEEE, 2024, pp. 84–90. [11] G. Jocher et al. , “Y olov8: Open-source yolo for real-time object detec- tion, ” https://github.com/ultralytics/ultralytics, 2023, online. [12] N. Ravi et al. , “Sam 2: Segment anything in images and videos, ” arXiv preprint https://arxiv .org/abs/2408.00714, 2024. [13] G. Zhang and Y . Chen, “More informed random sample consensus, ” in 2020 8th International Conference on Contr ol, Mechatr onics and Automation (ICCMA) , Moscow , Russia, 2020, pp. 197–201. [14] P . J. Rousseeuw and C. Croux, “ Alternatives to the median absolute deviation, ” Journal of the American Statistical Association , vol. 88, no. 424, pp. 1273–1283, Dec. 1993. [15] X. W ang, H. Gao, Z. Jia, and Z. Li, “Bl-yolov8: An improved road defect detection model based on yolo v8, ” Sensors , vol. 23, no. 20, p. 8361, 2023.
Original Paper
Loading high-quality paper...
Comments & Academic Discussion
Loading comments...
Leave a Comment