Statistical methods for reference-free single-molecule localisation microscopy
MINFLUX (Minimal Photon Flux) is a single-molecule imaging technique capable of resolving fluorophores at a precision of <5 nm. Interpretation of the point patterns generated by this technique presents challenges due to variable emitter density, inco…
Authors: Jack Peyton, Benjamin Davis, Emily Gribbin
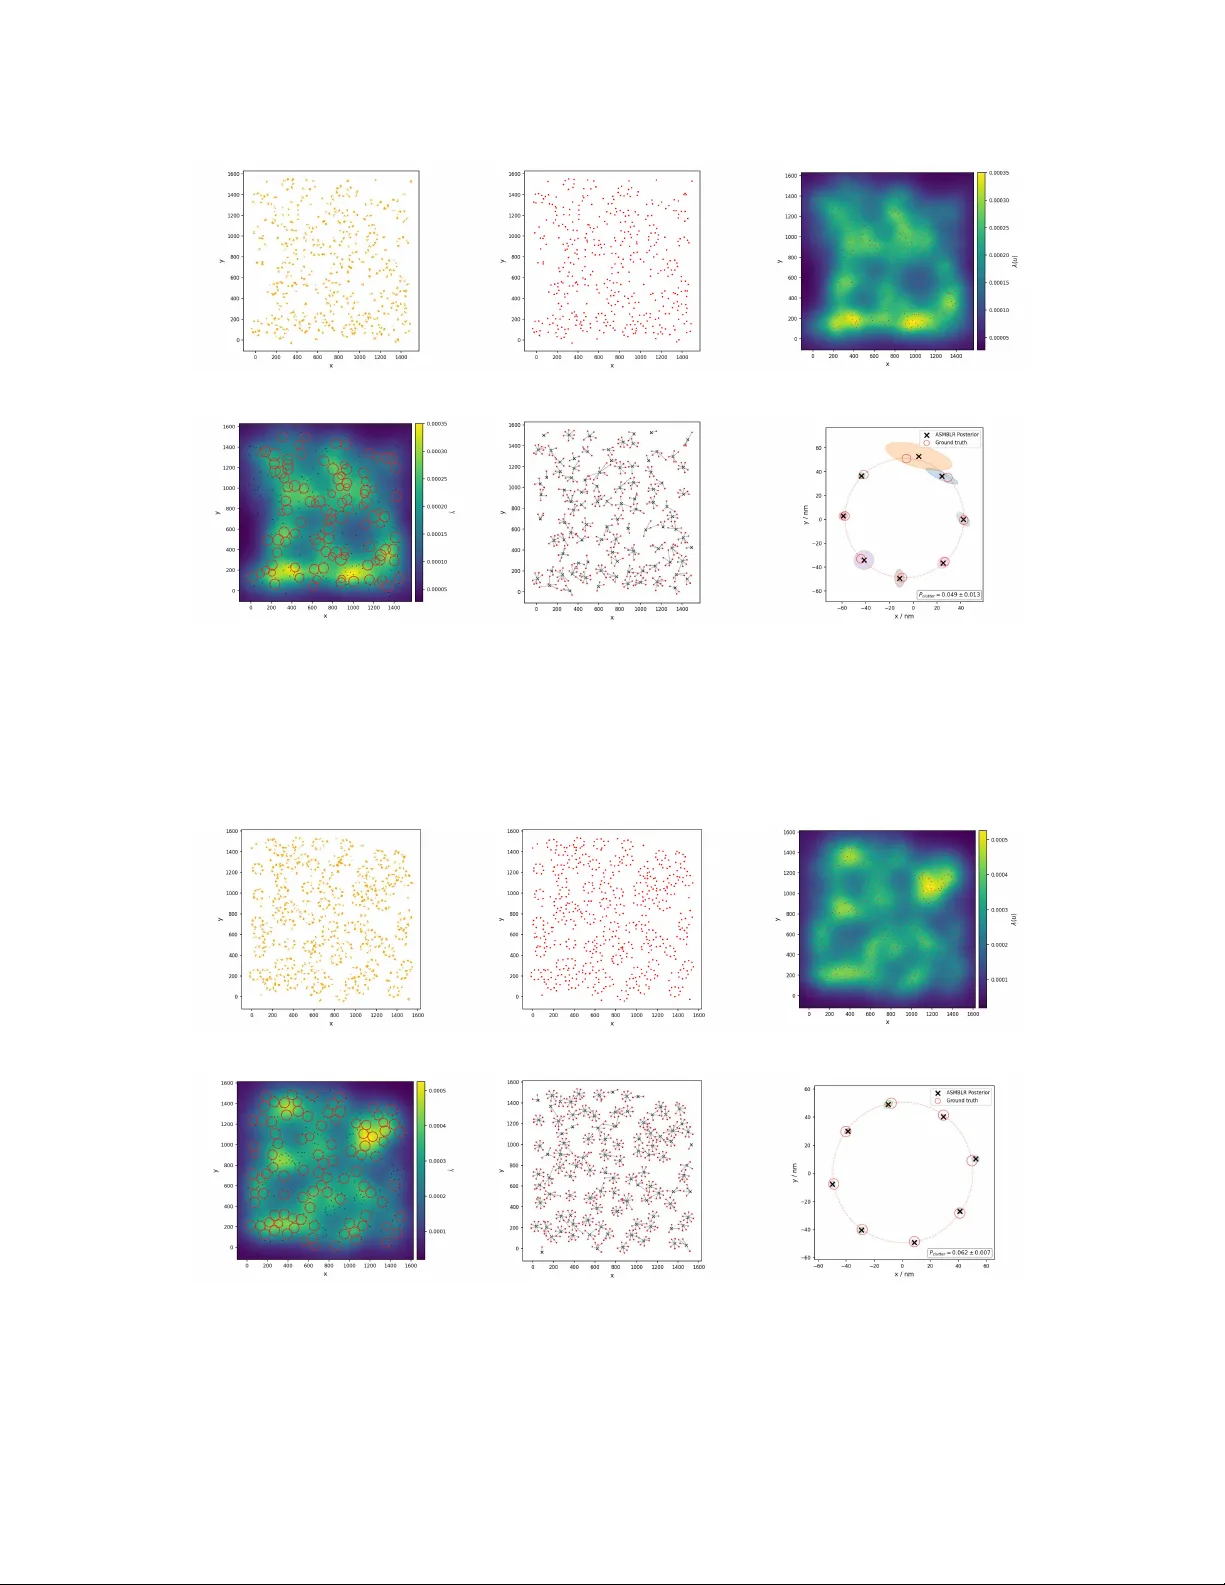
1 Statistical metho ds for reference-free single-molecule lo calisation microscop y analysis Jac k P eyton 1 ∗ , Benjamin Da vis 2 ∗ , Emily Gribbin 1 , Daniel Rolfe 2 , Hannah Mitc hell 1 1 Mathematical Sciences Researc h Cen tre, Sc ho ol of Mathematics and Ph ysics, Queen’s Universit y Belfast, Universit y Road, Belfast, BT7 1NN, United Kingdom. 2 OCTOPUS Group, Central Laser F acilit y , Research Complex at Harwell, Science and T ec hnologies F acilities Council, Appleton Lab oratory , Oxfordshire, OX11 0F A, United Kingdom. ∗ Corresp onding authors: jp eyton01@qub.ac.uk, b enjamin.da vis@stfc.ac.uk F ebruary 24, 2026 Abstract MINFLUX (Minimal Photon Flux) is a single-molecule imaging technique capable of resolving fluorophores at a precision of < 5 nm. In terpretation of the p oin t patterns generated b y this tec hnique presen ts c hallenges due to v ariable emitter densit y , incom- plete bio-lab elling of target molecules and their detection, error prone measurement pro cesses, and the presence of spurious (non-structure associated) fluorescen t detec- tions. T ogether, these c hallenges ensure structural inferences from single-molecule imaging datasets are non-trivial in the absence of strong a priori information, for all but the smallest of p oin t patterns. In addition, curren t metho ds often require sub jectiv e parameter tuning and presupp ose kno wn structural templates, limiting reference-free disco very . W e presen t a statistically grounded, end-to-end analysis framework. F o- cusing on MINFLUX deriv ed datasets and leveraging Ba yesian and spatial statistical metho ds, a pip eline is presented that demonstrates 1) uncertaint y aw are clustering of measuremen ts in to emitter groups that p erforms b etter than current gold standards, 2) rapid identification of molecular structure sup ergroups, and 3) reconstruction of rep eat- ing structures within the dataset without substantial prior kno wledge. This pipeline is demonstrated using simulated and real MINFLUX datasets, where emitter clustering and centre detection main tain high p erformance (emitter subset assignmen t accuracy > 0 . 75 ) across all conditions ev aluated, while structural inference achiev es reliable dis- crimination ( F 1 ≈ 0 . 9 ) at high labelling efficiency . T emplate-free reconstruction of Nup96 and DNA-Origami 3 × 3 grids are achiev ed. 2 1 In tro duction MINFLUX is a single-molecule lo calisation microscop y (SMLM) tec hnique first demonstrated b y Balzarotti et al. in 2017 with a reported nanometre precision [1, 2]. The deriv ation of biological insights from this v aluable and innov ativ e technique are, ho wev er, hamp ered b y frequen t metho dological issues in p ost-ho c analysis of the resulting p oin t patterns. Criticisms levied against the technique b y Prakash [3] highligh t problems typical of analysis of SMLM data: tunable parameters at m ultiple stages of analysis, opaque filtering and clustering steps, and a final phase of matc hing known template structures resulting in a “what you already kno w is what y ou get” paradigm. A recen t dialogue b et ween Gwosc h et al. and Prakash et al. [2, 4, 5, 3] recognise a problem with v alidation of the in terpretation of SMLM data, in that the circularit y of presupp osed parameters and template alignment risks a systematic confirmation bias across SMLM tec hniques. The discussion regarding SMLM analysis highlights the requiremen t for an end-to-end, statistically grounded framew ork, that can be applied cross-tec hnique to more objectively in terpret this v aluable nanometre scale data. Suc h a framework in v olves clustering ev en ts - or measurements - in to emitters, grouping emitters in to structurally informative sets, and inferring structural detail from these emitter sets. Eac h of these steps is impacted by the underlying limitations of the microscop y technique itself: bio-lab elling that masks structure, and spurious fluorescen t detections difficult to parse from meaningful fluorophores. The first stage, clustering measurements in to emitters, is often p erformed with density- based clustering algorithms, suc h as DBSCAN [6, 7] or HDBSCAN [8, 9, 10]. While these algorithms are rapid and scalable, they introduce user-tunable parameters that can sub- stan tially impact clustering [11], affect downstream analysis, and are not measurement uncertain ty-a ware. Ba y esian alternatives to emitter estimations, such as BaGoL, [12, 13] are p o werful yet computationally exp ensive and prior-sensitiv e. A t the structural inference stage, the analysis framew ork for SMLM is further exp osed to the limitations of the field: incomplete bio-lab elling and bio-lab el detection masking struc- ture, dense pac king of emitters in to regions of in terest (R OIs), and structural heterogeneit y [14] (e.g. m ultiple distinct or nested structures within the same R OI). T emplate-based ap- proac hes attempt to solve this by aligning sampled data subsets to mo dels kno wn a priori [2] how ev er missingness in true structure, owing to under-lab elling and spurious detections [4], can result in hallucinations of structure that do not exist in the data, similar to the well do cumen ted “Einstein from noise” phenomenon [15]. Alternative approaches to structural inference include top ology [16, 17], graph- and mac hine learning-based approac hes inspired b y net w ork analysis in systems biology [18, 19, 20]. These techniques similarly dep end on the c hoice of scale, opaque data pre-pro cessing, tunable heuristics and frequen tly neglect the estimation of uncertain ty in the discov ered structure. T ogether, these issues p oin t to the need for an end-to-end, statistically grounded analysis 3 pip eline that (i) treats lo calisation uncertain ty as first-order information, (ii) reduces sub jec- tiv e parameter tuning, (iii) scales b eyond single structures, and (iv) av oids the hard-wiring of sp ecific templates into the analysis. Such a framework should provide a transparen t chain from ra w measuremen ts to emitters, from emitters to structural centres, and from centres to in terpretable molecular architectures, while remaining applicable across lo calisation-based sup er-resolution tec hniques, and establish p erformance b oundaries - do cumenting not only where metho ds succeed but also where they approach fundamen tal information-theoretic limits - to enable informed experimental design and a v oid o v er-in terpretation of sparse or noisy data. Here, we outline one such framew ork for MINFLUX and lo calisation-based SMLM (Fig. 1(a)). First, in Grouping Observ ations Under P airwise Asso ciations (GROUP A) (Fig. 1(c)), w e replace heuristic densit y clustering with a Bay esian measuremen t-to-emitter mo del that couples pairwise Bay es factors and the Infomap communit y detection algorithm [21] to infer emitter assignmen ts without user-tuned distance thresholds, making use of known measure- men t uncertaint y (SI Sec. 1.1). Second, V oidw alker (Fig. 1(d)), an empty-space–seeking algorithm grounded in spatial p oint pro cess theory , identifies statistically significan t v oids in the emitter pattern and uses them to define a data-driv en prop osal space and priors (SI Sec. 1.2) for downstream Rev ersible Jump Marko v Chain Mon te Carlo (RJMCMC) [22]. Third, we mo del structural centres as a Gibbs p oint pro cess and use an RJMCMC sam- pler with a BaGoL-inspired mov e set [13] to infer centre lo cations and pro vide, for each emitter, an uncertain ty-a ware distribution o ver centre assignments (Fig. 1(e)). F ourth, w e interpret these emitter-centre assignments as a marked p oint pro cess to iden tify sup er- structure arrangemen ts of the inferred structures, partitioning the dataset into individual molecular units (Fig. 1(f )). This RJMCMC and sup er-structure discov ery allo ws guided sampling of fully connected subgraphs, or cliques (Fig. 1(g)), that improv es the probabilit y of sampling structurally representativ e cliques (SI Sec. 2.2). Lastly , for eac h unit, we ap- ply a molecular reconstruction algorithm, Assembling Structured Molecular Building blo cks from Lo calisation Reconstructions (ASMBLR), whic h uses a p opulation of sampled cliques from co-assigned emitter p opulations and uses their internal geometry to rapidly reconstruct rep eating structural motifs without strong a priori information (Fig. 1(h, i)). W e sim ulated data represen ting the 2D pro jection of Nup96, a nucleoporin commonly used as an SMLM b enchmark [23], motiv ating its use here. Each stage of the pip eline was v alidated on this simulated Nup96 nuclear p ore complex data, spanning lab elling efficiencies (probabilities of successful fluorophore lab elling) of l = 0 . 3 , 0 . 6 , 0 . 9 , and 1.0, with clutter (spurious, non-structure asso ciated emitters) prop ortions of 0, 0.1, 0.2, and 0.3 across 100 replicate datasets of eac h p ermutation of these conditions. GROUP A is b enchmark ed against DBSCAN and HDBSCAN for emitter clustering under a range of measurement uncertainties. V oidwalk er-Gibbs is assessed for centre-detection accuracy and emitter-to-cen tre assignmen t under incomplete lab elling and spurious detections. Sup er-structure detection via mark ed 4 p oin t pro cesses is ev aluated for its abilit y to distinguish true sup er-structure and higher-order assem blies from chance spatial proximit y . W e demonstrate the framew ork on exp erimental MINFLUX datasets of Nup96, showing template-free iden tification of kno wn n uclear p ore stoic hiometry . The framew ork is additionally applied to a syn thetic DNA-Origami 3 × 3 grid image, demonstrating its applicabilit y for multi-component structures b eyond Nup96. It is sho wn that template-free, full reconstruction of molecular structure is possible under minimal a priori assumptions regarding the structure itself, impro ving the repro ducibility of analysis of exp erimental results. 5 (a) (b) (c) (d) (e) (f ) (g) (h) (i) Figure 1: (a) End-to-end input/output ov erview for each stage of the framew ork. (b) Raw lo calisations are clustered in to (c) emitters using GROUP A. (d) V oidw alk er distinguishes statistically significan t empty space (dashed red circles) that inform priors and prop osal space. (e) RJMCMC sampler assigns emitters to structural centres, yielding p er-emitter probabilit y distributions ov er cen tre assignmen ts. (f ) Assignment distributions define marks in a marked p oint pro cess to iden tify structure (blue) and sup er-structure (green). (g) Cliques are sampled from co-assigned emitter p opulations of b oth structure (blue) and sup er- structure (green). ASMBLR reconstructs molecular (h) structure and (i) sup er-structure from the inner space of sampled cliques. 6 2 Results The analysis pip eline is b enc hmarked against 1600 synthetic Nup96 MINFLUX datasets. These datasets are carried through all stages of the pip eline (example figures demonstrat- ing this are found in SI Sec. 3). F or GR OUP A b enchmarking, additional datasets under expanding measurement uncertainties are simulated. 2.1 GR OUP A In the syn thetic Nup96 data, eac h emitter is tagged with a ground truth ID. Measuremen ts are linked to their paren t ID through the same tag. This allows computation of A djusted Rand Index (ARI)[24], Normalised Mutual Information (NMI)[25] and F o wlkes–Mallo ws Index (FMI)[26] directly b et ween the inferred emitter lab els and the ground truth. F or this emitter-lev el b enc hmark we fix labelling and clutter to isolate the effects of measuremen t uncertain ty . W e compare GROUP A against DBSCAN and HDBSCAN across measuremen t uncertain ty v alues σ ∈ { 0 . 5 , 1 , 2 . 5 , 5 , 7 , 9 , 12 , 15 , 20 } nm. (a) (b) (c) Figure 2: Clustering p erformance v ersus lo calisation uncertaint y σ for GROUP A, DBSCAN, and HDBSCAN, ev aluated on syn thetic Nup96 data with 50 replicates p er σ . Shaded bands: 2.5-97.5th p ercentiles across replicates. (a) ARI, (b) FMI, (c) NMI. DBSCAN/HDBSCAN w ere tuned p er σ ; GR OUP A required no parameter tuning. Fig. 2 compares GROUP A with DBSCAN and HDBSCAN baselines across a range of uncertain ty v alues. F or each uncertaint y level, DBSCAN and HDBSCAN h yp erparameters w ere tuned to maximise p erformance on that condition; these curv es therefore represent condition-optimised baselines rather than a single fixed parametrisation. ARI and FMI sho w steep decline across all algorithms as the measurement uncertaint y increases. NMI deca ys more slowly , consistent with partial retention of coarse partition structure ev en as individual emitters b ecome unresolved. GR OUP A main tains ARI ≥ 0 . 75 up to σ = 10 nm, where DBSCAN/HDBSCAN hold ARI ≈ 0 . 2 . All metho ds degrade substantially b eyond this p oint, highlighting a fundamen tal information limit indep endent of algorithm choice. The improv ed robustness comes at the cost of higher computational ov erhead, yet GR OUP A remains applicable to arbitrarily large p oint patterns in a w ay that p er-R OI RJMCMC 7 metho ds such as BaGoL [13] are not. W e ha ve not compared GR OUP A directly to BaGoL, as the metho ds address differen t analytical scales (SI Sec. 2.1). 2.2 V oidw alker-Gibbs Eac h emitter in the synthetic data is link ed to its paren t structural cen tre via a group ID. V oidwalk er-inferred cen tres are aligned to the ground truth via Hungarian algorithm [27]. An emitter is correctly assigned if the sampled centre lab el from the V oidw alker pro cess matc hes the true group ID in the ground truth. Bio-lab elling and detection efficiency w ere represen ted through application of combined binomial probabilit y to each emitter. This resulted in the partial observ ation of some struc- tures in the lo calisation set, and ma y lead to the complete absence of a structure if the observ ation probability is sufficiently lo w. A cen tre that is present in the ground truth but has no lab elled emitters is unreco verable from the data. Moreo ver, spurious emitters will b e estimated via additional centres, further deflating the F 1 . Thus, one should note that F 1 is b ounded b y unobserved features and high clutter levels, and while this remains a useful metric, the lab elling and clutter agnostic assignment accuracy is a more v aluable measure to judge the results. W e ev aluate the inferred global radius parameter against its ground truth v alue of 50nm. The ground-truth emitter p ositions themselv es are p erturb ed by a radial spread of ± 1 . 5 nm , so relativ e radius errors b elow ∼ 3% are within the generativ e noise of the simulator. Ov erall, Fig. 3 shows that structurally significan t subsets of emitters are w ell-reco vered under V oidw alker-Gibbs, across a range of lab elling and clutter conditions. Fig. 3(a) confirms cen tre detection degrades with increasing clutter, most sev erely at 0.3 lab elling where median F1 drops from 0.75 to 0.6. Ab ov e 0.6 lab elling, F1 remains ≥ 0 . 75 with narro w uncertaint y bands. Emitter-cen tre assignmen t accuracy (Fig. 3(b)) prov es more robust than centre- lev el F1, remaining abov e 0.8 ev en at 0.3 lab elling. Fig. 3(c) confirms assignmen t accuracy systematically exceeds F1, indicating strict F1 scoring p enalises unobserv able centres rather than widespread misassignment. Inferred radius (Fig. 3(d)) sho ws small p ositiv e bias within the ± 1 . 5 nm ground-truth uncertain ty for mo derate-to-high lab elling. A t 0.3 lab elling, radius is o v erestimated under high clutter but remains mo dest. Con vergence diagnostics (Gelman-R ubin [28] ˆ R < 1 . 1 ) confirmed stable mixing. F or our purp oses, structural inference concerns local-scale information, such as protein oligomers < 200 nm in size. W e previously dev elop ed FLImP [29, 30, 31], which uniformly samples 2–3 emitter cliques within a specified radius. Ho w ever, naiv e uniform sampling in- creasingly fav ours in ter-structure ov er intra-struct ure cliques as clique size grows (SI Sec. 2.2). V oidwalk er addresses this b y exploiting similarit y in the structure of empt y space in rep eating but under sampled motifs in the p oint pattern to group emitters in to structurally meaningful sets to facilitate uniform sampling of predominantly in tra-structure cliques. Fig. 3(e) shows that V oidw alker impro ves the probability of sampling one suc h meaningful set, 8 (a) (b) (c) (d) (e) (f ) Figure 3: V oidw alker-Gibbs ac hieves centre detection and emitter assignmen t across data qualit y regimes. P erformance on synthetic Nup96 structures across labelling efficiencies of 0.3, 0.6, 0.9, 1.0 and clutter levels of 0 − 30% . Curv es show median p erformance ov er 100 replicates with 2.5-97.5th p ercentile bands. (a) Centre-lev el F1 score versus clutter. (b) Emitter-cen tre assignmen t accuracy v ersus clutter. (c) Joint distribution of F1 and assign- men t accuracy across all datasets. (d) Relativ e radius bias v ersus clutter, with ground truth emitter uncertain ty . (e) Probabilit y of sampling a structurally representativ e clique v ersus clique size, comparing radial uniform and V oidw alk er-guided sampling. Uniform sampling assumes 8 true emitters with 2-6 spurious neighbours; V oidwalk er-guided sampling assumes 90% p er-emitter assignment accuracy . (f ) No. emitters assigned p er centre across lab elling efficiencies. P within , substan tially in comparison to radial uniform sampling of cliques of emitters, partic- ularly when sampling larger cliques. Fig. 3(f ) highlights the num b er of emitters assigned to eac h estimated centre across v arious lab elling efficiencies, and offers some guidance on the selection of b oth the clique size to sample, and mo del size to estimate, using ASMBLR. A t 1.0 lab elling, for instance, a large concentration is observ ed at 8 p oin ts-p er-cen tre, indicating a p oten tial target structure of 8, and p ermitting reasonable clique sampling of size k ≤ 8 . In the 0.3 lab elling case, no suc h spik e at 8 p oints p er centre exists - and as such no guidance on mo del size ma y b e a v ailable in such under-sampled data - but a concentration of 2-3 p oints p er cen tre is sho wn, suggesting that cliques of k ∈ { 2 , 3 } is a viable sampling strategy . 9 2.3 Sup er-structure Discov ery Most structures comprise m ultiple voids; a DNA-Origami 3 × 3 grid has four v oids, for example. Sup er-structure disco very identifies voids o ccurring in closer spatial pro ximity than exp ected under a CSR hard-shell null hypothesis; grouped voids form single structural units for clique sampling. Eac h structure in the sim ulated data has a small probabilit y of extending in to a connected pair of regular p olygons. In such cases, the pair is considered a sup er-structure, with t wo comp onent structures. In the DNA-Origami case, the ov erarc hing grid is considered a sup er-structure, and eac h of the four cells that mak e up this grid are considered a structure. W e dev elop a sup er-structure discov ery algorithm, that links inferred centres into sup er- structures. W e transform the emitter-cen tre assignment probabilities of Sec. 2.2 into a p er-cen tre probability distribution, itself considered a mark vector. These mark vectors undergo randomly lab elled, p ermutativ e n ull sim ulations to distinguish b et ween close spatial pro ximity by chance, and true sup er-structure (SI Sec. 1.4). W e ev aluate the edge prediction b et w een estimated pairs against ground-truth pairs using precision, recall, and F 1 (Fig. 4(a)). P erformance is heavily impacted by lab elling (Fig. 4(a). Under high lab elling efficiency (0 . 9 − 1 . 0) and lo w clutter (<0.1), the metho d ac hieves high F 1 ( ≈ 0 . 8 − 0 . 9) , indicat- ing reliable discrimination of true sup er-structure edges. At intermediate lab elling (0.6), p erformance drops to mo derate lev els ( F 1 ≈ 0 . 3 − 0 . 6 ), reflecting reduced separabilit y b e- t ween true and false centre pairs as the marks b ecome more sparse. At lo w lab elling (0.3), p erformance collapses across all clutter regimes ( F 1 ≈ 0 . 1 − 0 . 2 ), establishing an effective in- formation threshold for this form of oligomer inference. Fig. 4(b, c) highlight the effect that emitter sparsity has on the sup er-structure disco very algorithm as a result of b oth missing information at this stage, and the propagation of errors from previous steps in the pip eline. This degradation reflects an informational b ottlenec k rather than a strictly algorithmic failure. At 0.3 lab elling of 8-fold symmetrical structure, eac h cen tre is represen ted b y , on a verage, 2 − 3 emitters. The resulting p osterior resp onsibility distributions hav e Shannon en- trop y approaching that of a uniform distribution, yielding Bhattacharyy a distances b etw een true constituen t sub-structures that are statistically indistinguishable from random cen tre pairs (SI Sec. 2.3). W eighting the p erm utation testing by the p osterior intensit y of the field accounts for spatial heterogeneit y , but cannot o v ercome signal collapse in information- p o or marks obtained from under-labelled data. Th us, we establish a stricter data-quality requiremen t for sup er-structure inference, than for emitter sub-grouping. 2.4 ASMBLR ASMBLR seeks to reconstruct complete structures (or rep eating motifs) from a set of under- sampled cliques. This algorithm is required as clique p opulations are sampled from under- lab elled and error prone measuremen t pro cesses and to o vercome limitations with template 10 (a) (b) (c) Figure 4: Mark-based sup er-structure detection establishes data-qualit y thresholds distinct from cen tre detection. (a) P erformance across lab elling efficiencies (0.3, 0.6, 0.9, 1.0) and clutter lev els ( 0 − 30%) on syn thetic Nup96 dimer mixtures. Performance surfaces for F1 (left), precision (centre), and recall (right) ov er 100 replicates p er condition. Numerical v alues indicate mean metrics. Sup er-structure disco very algorithm applied to lab elling effi- ciencies of (b) 1.0 and (c) 0.6. matc hing. W e demonstrate the efficacy of the ASMBLR algorithm under the v ariety of labelling conditions used th us far (Fig. 5). Fig. 5 demonstrates ASMBLR’s robustness to decreasing lab elling efficiency . At full lab elling (Fig. 5(a-b)) the algorithm clearly resolves the characteristic 8-fold symmetry and ≈ 50 nm radius of the 2D Nup96 molecular structure. As labelling efficiency degrades to 0.3 (Fig. 5(g-h)), this c haracteristic symmetry and scale remains eviden t, successfully reco vered despite the challenge in structural data a v ailability , albeit with expanded uncertaint y at select v ertices. Critically , these reconstructions emerge solely from the internal consistency of the lo calisation data, supp orted by the V oidw alker-Gibbs structural inference, without reference to kno wn Nup96 structural mo dels. T o assess 8-fold symmetry , w e aligned an idealised ring to each posterior via Hungar- 11 (a) (b) (c) (d) (e) (f ) (g) (h) (i) (j) Figure 5: ASMBLR reconstructs rep eating molecular motifs across a range of data con- ditions. Observ ed measurements and model reconstruction with 67% credible interv al for lab elling efficiencies of (a-b) 1.0, (c-d) 0.9, (e-f ) 0.6, and (g-h) 0.3. 600 cliques of size 3 w ere used for the 8-fold mo del. Reconstruction of DNA-Origami 3x3 grids (i-j) also shown with 500 cliques of size 5. ian algorithm, then applied three tests: p er-vertex Mahalanobis distance with Bonferroni correction ( α = 0 . 05 / 8 ), Fisher’s combined statistic for joint consistency , and p erm utation testing against 10,000 random rotations to distinguish geometric regularit y from chance. This pattern of strong statistical supp ort was main tained across all labelling conditions, though with appropriately increased uncertain ty at lo wer labelling efficiencies as reflected in expanded credible regions (Fig. 5) and mo destly elev ated Mahalanobis distances. Across all lab elling efficiencies, all criteria show ed near-optimal p erformance: 8/8 vertices passing, Fisher p > 0 . 95 , p erm utation p < 0 . 05 , and mean Mahalanobis 2 < 2 . 0 . The inferred radius remained stable across all conditions, demonstrating that ASMBLR correctly recov ers geometric scale ev en when individual v ertex p ositions carry substan tial uncertain ty . 12 F or DNA-Origami grids (Fig. 5(i-j)) the framew ork correctly identified the lattice geom- etry under no grid structure assumption. Correct inference of emitter separation (25 nm) and statistical v alidation yielded strong evidence (Fisher p > 0 . 95 , p erm utation p < 0 . 05 , mean Mahalanobis 2 < 2 . 0 ) for agreemen t with ground truth. The cen tral v ertex shows mo dest displacement from the exp ected p osition; this likely reflects ASMBLR’s treatmen t of pairwise separations as indep enden t, whereas in practice the O ( K 2 ) separations derived from K v ertices are correlated. A dditionally , the curren t implementation considers only ax- ial lo calisation uncertain t y , neglecting transv erse contributions that become relev an t when separation approac hes the lo calisation precision. Despite these simplifications, all v ertices remain statistically consisten t with the ground truth mo del. 2.5 MINFLUX Data The framework was v alidated on exp erimen tal MINFLUX data by reconstructing Nup96’s c haracteristic 8-fold symmetry and ∼ 50 nm radius from real lo calisation data (Fig.6). GR OUP A requires no h yp erparameter tuning on lo calisation uncertaint y , op erating solely on maximum measurement separation. V oidwalk er-Gibbs then groups emitters via data- driv en priors deriv ed from empt y-space statistics, without assumptions on measuremen t precision. The reconstructed structures (Fig. 6(c,f,i)) recov er the exp ected 8-fold symmetry and ∼ 50 nm radius, with quan titativ e v alidation consisten t with synthetic b enc hmarks. 13 (a) (b) (c) (d) (e) (f ) (g) (h) (i) Figure 6: The outlined framework successfully reconstructs the Nup96 c haracteristic struc- ture from real MINFLUX lo calisation data. (a, d, g) Observ ed measuremen ts, (b, e, h) GR OUP A estimated emitters and V oidw alker assignmen ts, (c, f, i) ASMBLR mo del recon- structions. 3 Discussion Extracting structural information from sparse, error prone and uncertain p oint patterns without strong a priori information represents a fundamen tal c hallenge in single-molecule lo calisation microscop y . While demonstrated on MINFLUX data, the statistical foundations of pairwise h yp othesis testing, inhomogeneous p oin t pro cesses and hard-core Gibbs pro cesses presen ted here can b e applied to an y lo calisation-based single-molecule imaging tec hnique (suc h as STORM) that pro duces p oin t patterns with quan tified uncertain ty and incomplete lab elling. The critical requirement is sufficient lo calisation precision suc h that the structural features of in terest are resolved, encompassing most mo dern SMLM implementations. T emplate-matching w orkflows conflate t wo distinct questions: “Is this structure presen t?” 14 and “Do es the data supp ort this structure?” By first fitting kno wn geometries and then ev aluating go o dness-of-fit, suc h approaches risk confirmation bias, discov ering structures b e- cause one searc hed for them and not b ecause the data indep endently supp ort them. Our framew ork inv erts this logic: we first ask what structures the data ma y supp ort through purely data-driv en clustering and cen tre detection, then enable h yp othesis testing against kno wn arc hitectures if desired. This separation reduces the tendency to w ard false p osi- tiv es while main taining compatibilit y with v alidation against crystallographic or cryo-EM references. Imp ortantly , the uncertaint y quantification at eac h stage provides an explicit measure of confidence, allo wing researchers to distinguish b etw een robust discov eries and findings con tingent on fa vourable data quality . This prop osed framew ork has three distinct use cases: determining structure of proteins with unknown or v ariable stoic hiometry , v ali- dating template-matched results are statistically justifiable, and analysis of sparse lab elling regimes where con ven tional metho ds struggle. F or well-c haracterised structures imaged at high lab elling efficiency and measurement precision, researchers ma y prefer familiar estab- lished to ols. This framework pro duces more statistically defensible results than those of t ypical template matching approaches. GR OUP A reduces measuremen t clustering to pairwise ’sameness’ ev aluations, with higher- order structure inferred via communit y detection. This remov es heuristic parameters and the need to estimate lo cal emitter densit y a priori. GROUP A w as found to outp erform op- timally tuned DBSCAN or Gaussian mixture mo dels across measurement uncertainties 5 to 20 nm (Fig. 2). A direct quantitativ e comparison to BaGoL [13] was not undertaken, as the metho ds address fundamen tally differen t analytical scales. BaGoL excels at sub-nanometre lo calisation refinement within manually defined ROIs and is well-suited for detailed analysis of individual structures where computational cost is secondary to precision. GR OUP A priori- tises scalabilit y and automation, pro cessing en tire imaging fields without ROI pre-selection. F or man y exp erimen tal w orkflo ws, these approaches are complemen tary: researc hers migh t apply GROUP A for field-wide partitioning and structural discov ery , then reserve BaGoL for high-precision refinement of sp ecific structures of in terest. The comparison b etw een measuremen t-uncertaint y-aw are Ba yesian methods (GROUP A, BaGoL) and densit y-based heuristics (DBSCAN, HDBSCAN) reflects a broader trade-off b et ween computational o ver- head and statistical rigour; future hybrid pip elines may leverage each metho d’s strengths at appropriate scales. T reating SMLM images as inhomogeneous p oint patterns, V oidw alk er identifies statis- tically significan t v oids exceeding null-model exp ectations, providing data-driven priors on structure coun t and radius. This narrows the RJMCMC prop osal space, improving con- v ergence. The RJMCMC itself exploits core structural constrain ts inherent to SMLM: the exp ectation that structure interiors are devoid of fluorophores, and that sterically exclu- siv e objects do not ov erlap. By encoding these constraints via a Gibbs p oin t process with hard-core interaction, and lev eraging V oidwalk er-informed priors, the sampler constructs 15 p er-emitter probabilit y distributions ov er cen tre assignmen ts. Fig. 3 demonstrates that this approac h maintains, on a verage, >80% assignmen t accuracy at lab elling efficiencies as low as l = 0 . 3 , indicating robust p erformance for emitter subset detection across the full range of data quality conditions examined. This V oidwalk er step provides a v ast improv ement in do wnstream reconstruction of underlying molecular structure; radial uniform sampling of cliques yields small probabilities of structurally represen tative cliques, particularly at large clique sizes, where V oidwalk er impro ves this probabilit y substantially . As such, few er cliques are clutter, and more cliques can meaningfully contribute to the reconstructed model. The marked p oint-process approach to sup er-structure detection reveals a critical distinc- tion b etw een what is algorithmically feasible and what is information-theoretically possible (SI Sec. 2.3). While V oidw alker-Gibbs main tains >80% assignment accuracy at 30% la- b elling (Fig. 3(b)), sup er-structure inference requires ≥ 90% lab elling to exceed F1 > 0 . 8 (Fig. 4). This threshold difference is not an algorithmic shortcoming but a fundamental consequence of hierarc hical inference: centre detection op erates on lo cal emitter-cen tre spa- tial relationships, whereas sup er-structure discov ery requires discriminating b etw een cen tre pairs based on global assignmen t patterns - a higher-order inference problem with com- p ounded uncertain ty . At 30% lab elling of 8-emitter rings the assignment p osteriors flatten, eac h centre is represen ted b y appro ximately 2 − 3 emitters, yielding marks with Shannon information con tent b elo w the minimum required to distinguish meaningful similarity from noise. Sup er-structure inference b elow this threshold requires in tro ducing additional con- strain ts (c haracteristic inter-cen tre distances, kno wn stoichiometries) that risk the circular reasoning inherent to template-matc hing paradigms. The p erformance surfaces in Fig. 4 do cumen t this degradation explicitly . F or exp erimental design, these results provide actionable thresholds: seek sup er-structure at high bio-lab elling with lo w clutter, or defer sup er-structure inference at lo w lab elling. Differen t molecular geometries exhibit distinct failure mo des: rotationally symmetric struc- tures (such as Nup96) display distributed criticalit y requiring cumulativ e damage, whereas structures with unique cen tral elemen ts (grid lattices) exhibit concen trated criticalit y . This suggests minim um detection thresholds are structure-specific, with symmetric architectures tolerating low er detection probabilities (SI Sec. 2.4), p erhaps explaining Nup96’s prev alence as a MINFLUX b enc hmark [23]. A formal treatmen t of structural fragility will b e developed subsequen tly . These marked p oint-process distributions, when applicable, are further lev eraged to par- tition centres into sub-structure and sup er-structure subsets, enabling template-free recon- struction via ASMBLR. By sampling fully connected subgraphs, or cliques, from emitter p op- ulations co-assigned to the same structural unit, ASMBLR exploits the in ternal geometry of these cliques to reconstruct rep eating structural motifs without prior kno wledge of molecular arc hitecture, other than that the structures to b e reassem bled are fully-connected. The cur- ren t framework assumes known motif size N, though b oth N and clique size ma y b e guided by 16 emitters p er estimated centre (Fig. 3(f )). Moreov er, w e assume a Beta ( α = 10 , β = 90) prior on clutter to reflect that optimally there is no clutter and 10% av erage clutter is exp ected in typical datasets, and broadly isotropic measuremen t uncertaint y . Op erating on the inner space of the structural domain rather than external spatial context, molecular structures are resolv ed from their constituent emitter distributions alone. The statistical v alidation framew ork applied to ASMBLR reconstruction demonstrates that reference-free discov ery is statistically distinguishable from template matching or o v erfitting. Comparing observ ed alignmen t qualit y to thousands of random rotations in the p ermutation test is particularly critical, in that it directly addresses the question of whether a disco vered pattern reflects gen uine geometric regularit y or c hance alignment to noise. A cross all labelling conditions the observed 8-fold arrangements w ere significan tly b etter aligned than random orien tations ( p < 0 . 01) , providing unambiguous evidence that ASMBLR extracts biologically meaning- ful information. The high degree of symmetry present in the DNA-Origami grid, how ev er, necessitates larger sizes of cliques to correctly constrain the mo del - explaining the sligh tly offset cen tre p oint. Using m = 5 or m = 6 would likely impro ve this model at the cost of additional computational o verhead. Graph-theoretic metho ds [32, 17] lack robustness to clutter; p ersistent homology [33, 34] struggles with sparse data; deep learning [35] requires annotated training sets that presupp ose template knowledge. All rely on p oint distributions, suffering from incomplete lab elling. The Bay esian framew ork adopted here is driven by the repro ducibility of the empt y space sub domains in the data, and provides principled uncertain t y propagation at each stage: from measuremen t-to-emitter clustering (posterior o v er lab els), through cen tre detection (p osterior ov er p ositions, scale, and assignments), to sup er-structure inference (p ermutation- tested similarities with explicit p-v alues), and finally to structural v alidation (hypothesis tests with quantified significance). This end-to-end uncertaint y quan tification enables researchers to distinguish robust structural findings from those contingen t on fav ourable data conditions. The mo dular design enables parallelisation at natural b oundaries: GROUP A processes fields in parallel; V oidw alk er executes once p er dataset; RJMCMC c hains run indep endently; ASMBLR op erates p er oligomer. W all-clo ck time is dominated b y ASMBLR (hours for large datasets in p o or-qualit y regimes), while the preceding pip eline requires <1hr. The tractabilit y and VRAM memory requiremen ts of the T opK framework as N > 14 and M > 6 increase by at least P ( N , M ) (SI Sec. 1.5). While our problems are curren tly constrained to this space, solutions would b e to replace the existing T opK sc heme with a Plac k ett-Luce [36, 37] style sequential sampler that a voids the requiremen t to scan all p otential assignments. The current pip eline applies to 2D patterns of a single structure t yp e. Extension to 3D is straigh tforward for pairwise testing and RJMCMC, though V oidwalk er and sup er-structure detection require adaptation to v olumetric fields. Multi-structure detection would require hierarc hical in tensity mo dels or mixture-of-Gibbs processes, b oth tractable extensions. The framework demonstrates that template-free structural biology at nanometre res- 17 olution is ac hiev able without sacrificing statistical rigour. By explicitly testing m ultiple structural h yp otheses and quan tifying supp ort, rather than single template assumption, we prop ose a path forw ard for SMLM analysis that addresses the critique raised b y Prakash [3, 4] while maintaining compatibilit y with v alidation against known structures. The mo d- ular architecture enables incremental adoption of the individual metho ds; researchers may in tegrate an y of GR OUP A, V oidwalk er, or ASMBLR in their o wn existing analysis pip elines, while the end-to-end pip eline aims to pro vide a complete solution for discov ery-fo cussed ap- plications. As SMLM mo ves tow ard discov ering no vel architectures in proteome-wide studies, template-free metho ds with rigorous uncertain ty quan tification will b ecome essen tial rather than optional. Data and co de av ailability . Co de for synthetic data a v ailable on github [38]. Pip eline co de and exp erimental data av ailable up on reasonable request. Supplemen tary information. Supplemen tary information including end-to-end results for example datasets and full mathematical detail for the pip eline is av ailable. A ckno wledgemen ts. Many thanks to Dr Evelyn Garlick of Ab errior Instrumen ts for use- ful discussion. 4 Metho ds 4.1 Data A v ailabilt y Syn thetic datasets are sim ulated via the Python-based SimFlux package [38]. All datasets are sim ulated under a sp ecified seed to analyse under v arying lab elling and clutter conditions. Real MINFLUX datasets acquired from Evelyn Garlick, Ab errior Instruments. 4.2 GR OUP A: measuremen t clustering GR OUP A (SI Sec. 1.1) p erforms measurement-to-emitter clustering via pairwise Ba yes factor tests follo wed by communit y detection. F or eac h pair of measurements i, j with p ositions x i , x j and uncertain ty Σ i , Σ j , we compute the Bay es factor comparing H 0 (same emitter) with H 1 (distinct emitters). Under H 0 b oth measurements arise from a shared distribution; under H 1 t wo distinct distributions. W e construct a weigh ted graph retaining edges of B F ij > 1 . 0 and apply the Infomap algorithm [21] to detect comm unities via the map equation [39]. 4.3 V oidw alker: in tensity-guided void detection V oidwalk er (SI Sec. 1.2) identifies statistically significant empt y voids in the emitter p oin t pattern to inform priors and prop osals for downstream RJMCMC. W e fit an inhomogeneous Log-Gaussian Co x Pro cess (LGCP) [40] to emitter lo cations using the SPDE metho d [41], constructing a finite-element mesh with resolution scaled to the b ounding b o x W , where inner 18 and outer edges of W / 40 and W / 10 w ere used throughout the study . In tensity fit ˆ λ ( x ) is v alidated by assessing R ˆ λ ( x ) d x aligns with observ ed emitter coun t. In tensit y is renormalised to constitute a probability distribution and v oids are probabilistically seeded according to dra ws from this distribution, and sub ject to morphological growth and emitter-repulsive w alks. 1500 voids are seeded, and their significance is determined via z-scores calculated from 1000 inhomogeneous Poisson pro cess simulations on LGCP p osterior-predictive draws under the null hypothesis of no structure. The num b er of v oids seeded was chosen to b e more than necessary to ensure the space is adequately searched; larger windo ws should th us seed a larger n umber of v oids as there is no downside (other than computationally) to seeding man y v oids. V oids passing a p < 0 . 05 gate (testing V oidwalk er on CSR sim ulations yielded few to no contributiv e v oids under this gate) under this null are deemed active and contribute to the Poisson prior on structure count, Gaussian prior on structure radius, and prop osal densit y for dimension c hanging mo ves in RJMCMC. 4.4 RJMCMC: cen tre and sup er-structure inference W e model structural cen tres as a Gibbs p oin t process [40] (SI Sec. 1.3) with hard-core in teraction (minim um separation 1 . 5 r where r is the structural radius) and V oidwalk er- informed priors N centres ∼ P oisson ( λ void ) and r ∼ N ( r void , σ r void ) . The p osterior is explored via RJMCMC [22] with birth, death, split, merge, and shift mov es; prop osal scales are adaptiv ely tuned using a Robbins-Monro [42] scheme targeting 23.4% acceptance rate, an empirically stable rate. At eac h iteration, emitters are probabilistically assigned to the nearest centre under biv ariate Gaussian density in tegrating the centre and radial uncertaint y . W e run 3 c hains p er dataset for 25-125k iterations dep ending on data qualit y (sparse lab elling requires increased runtime), with 80% burn-in, storing the top 20 centre assignmen ts p er emitter from p ost-burn-in samples. Gelman-R ubin [28] ˆ R < 1 . 1 observed for all datasets pro cessed. Eac h centre’s mark is its p osterior resp onsibilit y distribution ov er emitters. Centre pairs are scored via comp osite Bhattac haryy a and harmonic-mean measures, scores are tested against an intensit y-stratified p ermutation null under 1000 p ermutations; edges with simi- larit y b oth exceeding a global 99th p ercen tile of the n ull and individually passing a p < 0 . 05 gate are considered a dimeric pair (SI Sec. 1.4). 4.5 ASMBLR: molecular reconstruction F or eac h identified structural unit, ASMBLR (SI Sec. 1.5) samples m -cliques - fully connected subgraphs of size m - using a centre assignment-conditioned Bron-Kerb osch algorithm. F rom datasets representing these sets of sampled m -cliques with p ositional uncertaint y , ASMBLR reconstructs an n-fully connected graph with uncertaint y and additional clutter comp onent. The vertices and corresponding uncertain ties of this graph constitute the mo del p osterior. These p osteriors, and their joint mo del, are v alidated against idealised mo dels of the ground 19 truth structure using p er-vertex Bonferroni-corrected χ 2 tests, Fisher’s combined statistic, and 1000 rotation p ermutation tests (see SI Sec. 1.5 for full mathematical detail and v ali- dation metho dology .) References [1] F rancisco Balzarotti, Y v an Eilers, Klaus C. Gw osch, Arvid H. Gynnå, V olk er W estphal, F ernando D. Stefani, Johan Elf, and Stefan W. Hell. Nanometer resolution imaging and trac king of fluorescent molecules with minimal photon fluxes. Scienc e , 355(6325):606– 612, F ebruary 2017. [2] Klaus C. Gwosc h, Jasmin K. Pape, F rancisco Balzarotti, Philipp Hoess, Jan Ellenberg, Jonas Ries, and Stefan W. Hell. MINFLUX nanoscopy delivers 3D multicolor nanometer resolution in cells. Natur e Metho ds , 17(2):217–224, F ebruary 2020. [3] Kirti Prakash. At the molecular resolution with MINFLUX? Philosophic al T r ans- actions of the R oyal So ciety A: Mathematic al, Physic al and Engine ering Scienc es , 380(2220):20200145, April 2022. [4] Kirti Prakash and Alistair P . Curd. Assessmen t of 3D MINFLUX data for quantitativ e structural biology in cells. Natur e Metho ds , 20(1):48–51, January 2023. [5] Klaus C. Gwosc h, F rancisco Balzarotti, Jasmin K. Pape, Philipp Ho ess, Jan Ellenberg, Jonas Ries, Ulf Matti, Roman Schmidt, Steffen J. Sahl, and Stefan W. Hell. Assessmen t of 3D MINFLUX data for quantitativ e structural biology in cells revisited, Ma y 2022. [6] Martin Ester, Hans-Peter Kriegel, Jörg Sander, and Xiao wei Xu. A densit y-based algo- rithm for disco vering clusters in large spatial databases with noise. In Pr o c e e dings of the Se c ond International Confer enc e on K now le dge Disc overy and Data Mining , KDD’96, page 226–231. AAAI Press, 1996. [7] Joseph L. Hammer, Alexander J. Dev anny , and Laura J. Kaufman. Densit y-based optimization for unbiased, repro ducible clustering applied to single molecule lo calization microscop y , No vem b er 2024. P ages: 2024.11.01.621498 Section: New Results. [8] Ricardo J. G. B. Camp ello, Da v oud Moulavi, and Jo erg Sander. Densit y-based cluster- ing based on hierarc hical density estimates. In A dvanc es in K now le dge Disc overy and Data Mining , pages 160–177. Springer Berlin Heidelberg, 2013. [9] Leland McInnes and John Healy . Accelerated hierarchical densit y based clustering. In 2017 IEEE International Confer enc e on Data Mining W orkshops (ICDMW) , pages 33–42, Nov ember 2017. 20 [10] Claudia Malzer and Marcus Baum. A h ybrid approac h to hierarchical densit y-based cluster selection. In 2020 IEEE International Confer enc e on Multisensor F usion and Inte gr ation for Intel ligent Systems (MFI) , pages 223–228, Karlsruhe, German y , 2020. [11] Ismail M. Khater, Iv an Rob ert Nabi, and Ghassan Hamarneh. A Review of Sup er- Resolution Single-Molecule Lo calization Microscopy Cluster Analysis and Quan tifica- tion Metho ds. Patterns , 1(3):100038, June 2020. [12] Mohamadreza F azel, Michael J. W ester, Hanieh Mazlo om-F arsibaf, Marjolein B. M. Meddens, Alexandra S. Eklund, Thomas Sc hlic hthaerle, Florian Sc hueder, Ralf Jung- mann, and Keith A. Lidke. Ba yesian Multiple Emitter Fitting using Reversible Jump Mark ov Chain Mon te Carlo. Scientific R ep orts , 9(1):13791, Septem b er 2019. Publisher: Nature Publishing Group. [13] Mohamadreza F azel, Mic hael J. W ester, Da vid J. Sc ho dt, Sebastian Restrep o Cruz, Se- bastian Strauss, Florian Sc hueder, Thomas Sc hlich thaerle, Jennifer M. Gillette, Diane S. Lidk e, Bernd Rieger, Ralf Jungmann, and Keith A. Lidke. High-precision estimation of emitter p ositions using Ba yesian grouping of lo calizations. Natur e Communic ations , 13(1):7152, Nov ember 2022. Publisher: Nature Publishing Group. [14] Mic kaël Lelek, Melina T. Gyparaki, Gerti Beliu, Florian Sch ueder, Juliette Griffié, Su- liana Manley , Ralf Jungmann, Markus Sauer, Melike Lakadamy ali, and Christophe Zimmer. Single-molecule lo calization microscopy . Natur e R eviews Metho ds Primers , 1(1):39, June 2021. [15] Amnon Balanov, W asim Huleihel, and T amir Bendory . Einstein from noise: Statistical analysis. arXiv pr eprint arXiv:2407.05277 , 2024. [16] Cheng W u, W eibing Kuang, Zhiw ei Zhou, Ying jun Zhang, and Zhen-Li Huang. F A CAM: A F ast and Accurate Clustering Analysis Metho d for Protein Complex Quantification in Single Molecule Lo calization Microscop y. Photonics , 10(4):427, April 2023. Publisher: Multidisciplinary Digital Publishing Institute. [17] Herb ert Edelsbrunner and Ernst P . Mück e. Three-dimensional alpha shap es. A CM T r ansactions on Gr aphics , 13(1):43–72, Jan uary 1994. [18] Tijana Milenk oviæ and Nataša Pržulj. Unco vering Biological Net w ork F unction via Graphlet Degree Signatures. Canc er Informatics , 6:257–273, April 2008. [19] Jesús Pineda, Sergi Masó-Orriols, Joan Bertran, Mattias Goksör, Gio v anni V olp e, and Carlo Manzo. Spatial Clustering of Molecular Lo calizations with Graph Neural Net- w orks, No vem b er 2024. arXiv:2412.00173 [cs]. 21 [20] Ismail M. Khater, F anrui Meng, Timothy H. W ong, Iv an Rob ert Nabi, and Ghassan Hamarneh. Sup er Resolution Netw ork Analysis Defines the Molecular Architecture of Ca veolae and Ca veolin-1 Scaffolds. Scientific R ep orts , 8(1):9009, June 2018. Publisher: Nature Publishing Group. [21] Jelena Smiljanić, Christopher Blöck er, Anton Holmgren, Daniel Edler, Magnus Neuman, and Martin Rosv all. Comm unity detection with the map equation and infomap: Theory and applications. arXiv pr eprint arXiv:2311.04036 , 2023. [22] P eter J Green. Reversible jump Marko v chain Mon te Carlo computation and Ba y esian mo del determination. Biometrika , 82(4):711–732, Decem b er 1995. [23] Jervis V ermal Thev athasan, Maurice Kahn wald, K onstant y Cieśliński, Philipp Hoess, Sudheer Kumar P eneti, Man uel Reitb erger, Daniel Heid, Krishna Chaitan ya Kasuba, Sarah Janice Ho erner, Yiming Li, Y u-Le W u, Markus Mund, Ulf Matti, Pedro Matos P ereira, Ricardo Henriques, Bianca Nijmeijer, Moritz Kueblb ec k, Vilma Jimenez Sabin- ina, Jan Ellen b erg, and Jonas Ries. Nuclear p ores as v ersatile reference standards for quan titative superresolution microscopy . Natur e Metho ds , 16(10):1045–1053, Octob er 2019. [24] La wrence Hub ert and Phipps Arabie. Comparing partitions. Journal of Classific ation , 2(1):193–218, 1985. [25] Nguy en Xuan Vinh, Julien Epps, and James Bailey . Information theoretic measures for clusterings comparison: V arian ts, prop erties, normalization and correction for chance. Journal of Machine L e arning R ese ar ch , 11:2837–2854, 2010. [26] Edw ard B F owlk es and Colin L Mallo ws. A metho d for comparing tw o hierarchical clusterings. Journal of the A meric an Statistic al A sso ciation , 78(383):553–569, 1983. [27] Harold W Kuhn. The hungarian metho d for the assignmen t problem. Naval R ese ar ch L o gistics Quarterly , 2(1-2):83–97, 1955. [28] Stephen P . Bro oks and Andrew Gelman. General metho ds for monitoring con vergence of iterativ e simulations. Journal of Computational and Gr aphic al Statistics , 7(4):434–455, 1998. [29] Sarah R Needham, Selene K Rob erts, An ton Arkhip o v, V enkatesh P Mysore, Christo- pher J Tynan, Laura C Zanetti-Domingues, Eric T Kim, V aleria Losasso, Dimitrios K orov esis, Michael Hirsc h, Daniel J Rolfe, Da vid T Clark e, Martyn D Winn, Alireza La jev ardip our, Andrew H A Clayton, Linda J Pike, Michela P erani, Peter J P arker, Yibing Shan, David E Sha w, and Marisa L Martin-F ernandez. EGFR oligomerization 22 organizes kinase-active dimers in to comp etent signalling platforms. Natur e Communi- c ations , 7:13307, 2016. [30] Katie Kingw ell. An tibacterial agents: New antibiotic hits Gram-negative bacteria. Na- tur e R eviews Drug Disc overy , 17(11):785, 2018. [31] R. Suman th Iyer, Sarah R. Needham, Ioannis Galdadas, Benjamin M. Davis, Selene K. Rob erts, Rico C. H. Man, Laura C. Zanetti-Domingues, Da vid T. Clarke, Gilb ert O. F ruhwirth, Peter J. Park er, Daniel J. Rolfe, F rancesco L. Gerv asio, and Marisa L. Martin-F ernandez. Drug-resistant EGFR mutations promote lung cancer b y stabiliz- ing interfaces in ligand-free kinase-activ e EGFR oligomers. Natur e Communic ations , 15(1):2130, March 2024. [32] Boris Delauna y . Sur la sphère vide. Bul letin de l’A c adémie des Scienc es de l’URSS, Classe des Scienc es Mathématiques et Natur el les , 6:793–800, 1934. [33] Herb ert Edelsbrunner, David Letsc her, and Afra Zomoro dian. T op ological p ersistence and simplification. Discr ete & Computational Ge ometry , 28(4):511–533, 2002. [34] Gunnar Carlsson. T op ology and data. Bul letin of the A meric an Mathematic al So ciety , 46(2):255–308, 2009. [35] Artur Sp eiser, Lucas-Raphael Müller, Philipp Ho ess, Ulf Matti, Christopher J. Obara, W esley R. Legan t, Anna Kresh uk, Jakob H. Mac ke, Jonas Ries, and Sriniv as C. T uraga. Deep learning enables fast and dense single-molecule localization with high accuracy . Natur e Metho ds , 18(9):1082–1090, 2021. [36] R. Duncan Luce. Individual Choic e Behavior: A The or etic al A nalysis . John Wiley & Sons, New Y ork, 1959. [37] Robin L. Plack ett. The analysis of p erm utations. Journal of the R oyal Statistic al So ciety: Series C (A pplie d Statistics) , 24(2):193–202, 1975. [38] Jac k P eyton. simflux. https://github.com/j- peyton/SimFlux , 2025. [39] M. Rosv all, D. Axelsson, and C. T. Bergstrom. The map equation. The Eur op e an Physic al Journal Sp e cial T opics , 178(1):13–23, No vem b er 2009. [40] Janine Illian, Antti Pen ttinen, Helga Stoy an, and Dietrich Sto yan. Statistic al A nalysis and Mo del ling of Sp atial Point Patterns . John Wiley & Sons, Chic hester, UK, 2008. [41] Finn Lindgren, Håv ard Rue, and Johan Lindström. An explicit link b e- t ween Gaussian fields and Gaussian Marko v random fields: the sto c has- tic partial differential equation approach. Journal of the R oyal Statistic al 23 So ciety: Series B (Statistic al Metho dolo gy) , 73(4):423–498, 2011. _eprin t: h ttps://rss.onlinelibrary .wiley .com/doi/p df/10.1111/j.1467-9868.2011.00777.x. [42] Herb ert Robbins and Sutton Monro. A sto c hastic appro ximation metho d. The A nnals of Mathematic al Statistics , 22(3):400–407, 1951. 1 SUPPLEMENT AR Y Statistical metho ds for reference-free single-molecule lo calisation microscop y analysis Jac k P eyton, Benjamin Davis, Emily Gribbin, Daniel Rolfe, Hannah Mitc hell F ebruary 24, 2026 Con ten ts 1 Metho ds 2 1.1 GROUP A: Grouping Observ ations Under Pairwise Asso ciations . . . . . . . 2 1.2 V oidw alker . . . . . . . . . . . . . . . . . . . . . . . . . . . . . . . . . . . . . 5 1.3 Gibbs Pro cess Rev ersible Jump MCMC . . . . . . . . . . . . . . . . . . . . . 10 1.4 Emitter Assignmen ts and Sup er-Structure Disco very . . . . . . . . . . . . . . 16 1.5 ASMBLR: Assem bling Structured Molecular Building blo cks from Lo calisa- tion Reconstructions . . . . . . . . . . . . . . . . . . . . . . . . . . . . . . . 19 2 Observ ations 30 2.1 GROUP A and BaGoL: Complementary Approaches to Emitter Estimation . 30 2.2 Uniform Clique Sampling in SMLM . . . . . . . . . . . . . . . . . . . . . . . 33 2.3 Information-Theoretic Limits of Under-sampled Data . . . . . . . . . . . . . 35 2.4 Structure-Dep endent F ragilit y Under Incomplete Detection . . . . . . . . . . 37 3 Additional Figures: end-to-end 38 2 1 Metho ds Let the measuremen t set Y = { y i } n y i =1 denote the ra w observ ed data MINFLUX pro vides. Figure S1: A synthetic p oint pattern representing homogeneously distributed regular- o ctagonal structures with emitters at each vertex that ha v e been sub ject to rep eated (but v arying) n umbers of measurements. These datasets were generated b y SIMFLUX 1 and are similar to p oin t patterns observ ed when imaging Nup96 using MINFLUX. This dataset was further mo dified to contain b oth monomeric and dimeric o ctagon structures. Fig. S1 depicts suc h a measurement set, and will be carried forward to illustrate eac h asp ect of the metho d. 1.1 GR OUP A: Grouping Observ ations Under Pairwise Asso ciations GR OUP A is an uncertaint y a ware algorithm for clustering measurements into groups whose cen tre represen ts the most likely position of an unseen parent p oint lo cations (an emitter). This pro cess is re-framed from attempting to fit a global mo del to instead ev aluating a series of more constrained models; the relativ e evidence that eac h pair of lo calisations represen t measuremen ts from: H 0 : a common emitter , H 1 : tw o distinct emitters . This pairwise form ulation offers several adv an tages to those discussed prior: • P airwise comparisons reduce problem complexity to a series of binary h yp othesis tests, 3 tractable through ov erlap in tegrals of probabilit y densities, i.e. p ermits efficient sparse matrix and Kdtree representations. • Only lo calisation pairs within a reasonable cut-off distance are considered, av oiding com binatorial explosion. • Strong global priors on emitter coun ts or their densit y in the dataset are not required. Let each lo calisation y i ∈ Y b e represen ted b y a Gaussian mixture mo del (GMM) 1 , p ( y ) = X k w k N ( y | µ k , Σ k ) , q ( y ) = X ℓ v ℓ N ( y | ν ℓ , Λ ℓ ) . The ov erlap in tegral betw een t wo suc h mixtures is I = Z p ( y ) q ( y ) d y = X k X ℓ w k v ℓ Z N ( y | µ k , Σ k ) N ( y | ν ℓ , Λ ℓ ) d y . As each inner in tegral has the closed form Z N ( y | µ k , Σ k ) N ( y | ν ℓ , Λ ℓ ) d y = N ( µ k | ν ℓ , Σ k + Λ ℓ ) , I reduces to a w eigh ted sum of Gaussian–Gaussian ov erlaps. This quan tity measures the ra w probabilit y mass assigned join tly b y b oth uncertain t y mo dels. Under the single-emitter h yp othesis H 0 , tw o indep enden t measurements should fall within the emitter’s effectiv e uncertaint y region. This region is approximated b y the 99 . 5% confi- dence ellipsoid defined by the Gaussian cov ariance in d dimensional space: r 2 = χ 2 d,α , α = 0 . 995 . The effective volume is then estimated as the union of the t wo uncertain ty regions V eff ≈ V ol( E ( µ p , Σ p , r p ) ∪ E ( µ q , Σ q , r q )) , whic h can b e readily and rapidly estimated using Monte Carlo sampling 2 pro viding a baseline scale for coinciden tal o verlap under H 0 . The pairwise Ba yes factor is defined as BF ij = I · V eff , where I captures the lo cal ov erlap of tw o Gaussian mixture mo dels, and V eff accoun ts for the prior-volume p enalty asso ciated with t w o indep enden t emitter lo cations under H 1 . 1 The GMM mo del could b e weigh ted and comp onents are not necessarily restricted to space – for example molecular dip oles. 4 Assume a uniform prior o ver a feasible region R of v olume V eff . Then - Under H 0 : p ( data | H 0 ) = Z R 1 V eff p ( z ) q ( z ) dz = I V eff , - Under H 1 : p ( data | H 1 ) = Z R Z R 1 V 2 eff p ( z 1 ) q ( z 2 ) dz 1 dz 2 = 1 V 2 eff . As p and q are normalised, the resulting Bay es factor is therefore BF ij = p ( data | H 0 ) p ( data | H 1 ) = I · V eff . Th us, the evidence for a common emitter naturally factorises into a lo cal o v erlap term ( I ) and a prior-volume term ( V eff ), which p enalises the extra latent parameter in the t w o-emitter h yp othesis. P airwise Bay es factors ab o ve a threshold (t ypically BF > 1) are retained as w eighted edges in an undirected graph where no des represent localisations and edges represent ev- idence of common origin. As these edges provide only first-order evidence of asso ciation and do not directly enco de higher-order dependencies, tec hniques such as mo dularity and other sp ectrum-based approaches that ev aluate partitions from static measures of pairwise connectivit y are unsuitable for this clustering problem. Instead, the Infomap algorithm 3 w as used, which exploits flow-based dynamics to minimize the map equation (an information- theoretic ob jective corresp onding to the Shannon entrop y of a random w alk’s description length under a giv en partition 4 ) and therefore captures b oth second-order and higher-order structure emerging from lo cal evidences 3 . This technique provides an efficien t alternative to fully Ba yesian net work models that attempt to infer higher order in teractions directly , yielding comparable explanatory p ow er at substantially lo wer computational cost. GR OUP A can b e used to cluster millions of measurements lo cally (connectivit y dep en- den t), and is amenable to ch unking. In dense systems, connectivit y can b e sampled by considering mutual-KNN or setting a global upp er limit on max separation b et w een p oin ts. Mutual-KNN will a void o ver-relying more uncertain p oints that will hav e more neighbours otherwise. In a sparse, under-sampled net work, a p o or selection of KNN may lead to o ver- fitting 5 . F or lo calisations mo delled as single Gaussian, ev aluating I requires a single Gaussian- Gaussian ov erlap and is constan t time p er pair. In the more general case of Gaussian mixtures with K p and K q comp onen ts, the o v erlap in tegral expands into O ( K p K q ) closed-form terms. Since clustering only considers pairs within a spatial cutoff, the total graph construction scales approximately as O ( N · k ) for N lo calisations and a verage neigh b ourho o d size k , rather than O ( N 2 ) . 5 Figure S2: The result of the emitter estimation metho d applied to the measurement set in Fig. S1 1.2 V oidw alker Once emitter positions hav e b een estimated from the measuremen t set, V oidw alker is the first step tak en in structural inference. V oidw alker uses the p osterior of the intensit y of the p oin t pattern to seed v oids probabilistically , then gro ws and w alks these v oids to fill their lo cal empty space, and tests all v oids to determine which empty space is of statistically significan t in terest, pro viding priors and a prop osal space for future RJMCMC. Let W ⊂ R 2 b e an observ ation windo w with boundary ∂ W and Leb esgue measure | W | . Observ e the spatial point pattern of the estimated emitters X = { x n } N n =1 ⊂ W . F or an y u ∈ W , define distances to the point set and to the b oundary , d X ( u ) := min 1 ≤ n ≤ N ∥ u − x n ∥ , d ∂ W ( u ) := inf v ∈ ∂ W ∥ u − v ∥ . Define the clearance field, r ( u ) , as the p oin twise radius of the largest empt y disc centred at u : r ( u ) := min { d X ( u ) , d ∂ W ( u ) } , B ( u, r ( u )) ∩ X = ∅ , B ( u, r ( u )) ⊂ W, (S1) where the empt y disc B ( u, r ( u )) is referred to as a v oid. The inhomogeneous in tensity is modelled as λ ( u ) = exp { η ( u ) } , η ( u ) = β 0 + ω ( u ) , u ∈ W, (S2) 6 where β 0 is an intercept and ω is a mean-zero Matérn Gaussian random field represen ted b y a Sto chastic Partial Differen tial Equation (SPDE) 6 on a triangular mesh built on W . P enalised complexit y priors are placed on the Matérn h yp erparameters, with range and marginal standard deviation scaled to the window span. The likelihoo d is the standard Log- Gaussian Co x Pro cess (LGCP) 7 with the observ ation domain passed as a named p olygonal sampler. This fit pro vides p osterior draws of the intensit y field λ ( s ) ( u ) = exp η ( s ) ( u ) , s = 1 , . . . , S, (S3) and consequently a v ariance corrected p osterior mean intensit y ˆ λ ( u ) ≃ exp E [ η ( u ) | X ] + 1 2 V ar [ η ( u ) | X ] . (S4) Figure S3: P osterior mean intensit y estimate of emitter p oint pattern Fig. S2. Discretise the observ ation windo w W into a regular grid of |G | square cells, eac h with side length δ and area ∆ A = δ 2 . Let { λ g } g ∈G denote the p osterior mean in tensity ev aluated at each cell cen troid. The exp ected coun t o v er a region R ⊆ W is then appro ximated b y summing ov er cells whose cen troids fall within R : µ ( R ) = Z R λ ( u ) du ≈ X g ∈G ( R ) λ g ∆ A, (S5) where G ( R ) = { g ∈ G : c g ∈ R} and c g denotes the cen troid of cell g . T o a v oid trivial seeding of v oids, a guard function is implemented to enforce minim um 7 distance criteria b et w een b oth X and ∂ W . Set tw o distance criteria, ρ X > 0 and ρ ∂ W > 0 , and define G ( u ) := 1 { d X ( u ) ≥ ρ X } 1 { d ∂ W ( u ) ≥ ρ ∂ W } . Dra w a finite set of seeds { ι k } I 0 k =1 ⊂ W from a guarded, intensit y-weigh ted prop osal q ( u ) ∝ ˆ λ ( u ) G ( u ) , u ∈ W , implemented on a raster { x p , y q } by normalising ˆ λ pq G pq . F or eac h seed s k , consider the empt y-ball radius function, r ( u ) . V oidwalk er seeks the lo cal maximiser c ∗ k of r ( u ) in the basin of attraction of ι k . A t a lo cal maximum c ∗ there is a con tact set H ( c ∗ ) ⊂ X ∪ ∂ W such that r ( c ∗ ) = min h ∈ H ( c ∗ ) ∥ c ∗ − h ∥ , and X h ∈ H ( c ∗ ) α h c ∗ − h ∥ c ∗ − h ∥ = 0 , for some α h ≥ 0 with P h α h = 1 . This first order Karush-Kuhn-T uck er (KKT) 8 condition is not directly solved, but is approximated b y p oint repulsive sto chastic growths and random w alks of eac h seeded v oid. A t eac h step, v oid radii are increased. If an y of the p oint set are violating a voids emptiness condition (Eq. S1), the void centre undergo es a random w alk step in the direction of the resultant force v ector from all violating p oints. Gro wth terminates when either (i) a pre-defined maximum radius is reached, chosen to exceed the spatial scale of in terest (75 nm for the syn thetic Nup96 data), or (ii) the void attains a lo cal maxim um of the clearance field, i.e. r ( c k ) cannot increase under any small p erturbation of c k . Let this set of grown v oids b e denoted v k := ( c k , r k ) , where c k = c ∗ k and r k = r ( c ∗ k ) . This set is thinned by a user-defined minimum radius gate, and b y non-maxim um suppression (NMS). In ( x, y , r ) , NMS sorts voids b y descending r , greedily k eeping a candidate and suppressing any similar in lo cation and in size. V oids are calibrated against the p osterior predictive dra w (PPD) n ull computed from the dra ws describ ed in Eq. S3. Throughout PPD null sim ulations, tw o characteristic statistics are computed on the already existing candidate void geometry , and an additional statistic is computed from inhomogeneous simulations on these dra ws. F or a candidate void i , with lo cation and radius c i , r i , define the ball and annulus resp ectively B i := B ( c i , r i ) , R i := { x ∈ W : ∥ x − c i ∥ ≤ r i (1 + f r ) } , with f r ∈ (0 , 1) . F or sim ulation m = 1 , . . . , M , and candidate voids i = 1 , . . . , n : 1. Pic k a p osterior dra w λ ( s m ) . 2. Sim ulate X ( m ) | λ ( s m ) as an inhomogeneous Poisson pro cess on W . 3. F or each candidate i with centre c i and radius r i , define the annulus R i = { x ∈ W : 8 Figure S4: All seeded v oids after the gro wth and walk pro cess. r i < ∥ x − c i ∥ ≤ r i (1 + f r ) } with f r ∈ (0 , 1) , and compute µ ( m ) i = Z R i λ ( s m ) ( u ) du, N ( m ) i = # { x ∈ X ( m ) : x ∈ R i } , Z ( m ) i = N ( m ) i − µ ( m ) i q µ ( m ) i . P o ol all sim ulated scores to form the empirical null CDF ˆ F 0 ( z ) = 1 M n M X m =1 n X i =1 1 h Z ( m ) i ≤ z i , t Z ( α ) = ˆ F − 1 0 (1 − α ) . On the existing void candidates, compute µ i = Z R i ˆ λ ( u ) du, N i = # { x ∈ X : x ∈ R i } , Z i = N i − µ i √ µ i , p i = 1 − ˆ F 0 ( Z i ) . A ctiv ate candidate i iff p i ≤ α and Z i ≥ t Z ( α ) , to form the set of activ e voids A = { i : ( p i ≤ α ) ∩ ( Z i ≥ t Z ( α )) } . A ctive voids inform the Poisson prior on structure, the Gaussian prior on radius, and the birth prop osal for use do wnstream in RJMCMC. Assuming the radii of activ e voids to follow a normal distribution, compute the mean and v ariance ( ˆ µ r , ˆ σ r ) , and apply a band A ∗ = { i ∈ A : | r i − ˆ µ r | ≤ 2 ˆ σ r } 9 to discard outliers. Figure S5: Set of thinned activ ated voids, A ∗ . Let the cardinalit y |A ∗ | define the rate parameter of a P oisson prior on the n um b er of structures, and let the radii { r i : i ∈ A ∗ } define a Gaussian prior on structure radius with mean ˆ µ r and v ariance ˆ σ 2 r estimated from activ e v oids. Let C = { c i : i ∈ A ∗ } denote the cen tres of active voids. The birth prop osal distribution is a t wo-component mixture: q b ( x ) ∝ ω λ λ ( x ) R W λ ( u ) du + ω A ∗ 1 |A ∗ | X i ∈A ∗ ϕ ( x ; c i , ˆ σ b I ) , (S6) where: • ω λ , ω A ∗ ∈ [0 , 1] are mixture w eights satisfying ω λ + ω A ∗ = 1 , con trolling the relativ e con tribution of each comp onent; • the first comp onen t samples prop ortionally to the normalised p osterior intensit y λ ( x ) R W λ ( u ) du , encouraging births in regions of high emitter density; • ϕ ( x ; c i , ˆ σ b I ) denotes the biv ariate Gaussian densit y with mean c i and isotropic co v ari- ance ˆ σ 2 b I 2 , where ˆ σ b is a bandwidth parameter controlling disp ersion around each v oid cen tre; • the second comp onent places Gaussian kernels at each active void centre, encouraging births near regions already iden tified as structurally significan t. 10 This mixture prop osal concen trates birth attempts in promising regions of the domain while retaining cov erage of the full observ ation window through the in tensity comp onent. Figure S6: Birth prop osal q b calculated from in tensity and A ∗ co verage 1.3 Gibbs Pro cess Rev ersible Jump MCMC The structural centres of the biological sub jects are mo delled as a realisation of a Gibbs P oint Pro cess 9, 10 . This approach enables spatial regularisation through radial and repulsion energies, while main taining no geometric assumptions as to the true shap e of the underlying structure. Let X = { x n } N n =1 ⊂ R d denote estimated emitters. Let C = { c i } k i =1 b e the latent structural centres of these emitter configurations. The probabilit y densit y of a general point configuration x = { x 1 , . . . , x n } in a domain W ⊂ R d , under a Gibbs p oin t pro cess, is given by p ( x ) = 1 Z exp ( − U ( x )) , where U ( x ) is the energy function (the form of whic h enco des the in teraction b et ween p oin ts) and Z is the normalising constan t, or partition function: Z = Z exp ( − U ( x )) d x , where Z is t ypically in tractable 9 . Biological structures imaged via SMLM, such as protein oligomers, ha ve physical size and are therefore sterically inhibitiv e. This serv es to enforce an o v erlap constrain t: tw o distinct structures cannot o ccup y the same physical space. Thus, protein oligomeric arrangements can b e represented as a series of voids (occupied by unlab elled protein mass) surrounded 11 b y a ‘ring’ of fluorescence lab els, within whic h there cannot be an y emitter in the in terior of the structure. While the strictness of this paradigm depends on the presence of spurious lo calisations within v oid in teriors, such a construction applies to the ma jority of protein oligomer structures, including dimers. These key facts p ermit the formation of a biologically grounded, Gibbs p oin t pro cess lik eliho o d defining v oids and their structural cen tres: P ( X | C ) = exp − k X i =1 X x n : a n = i ( ∥ x n − c i ∥ − r ) 2 2 σ 2 r + X i 0 and hard-core distance d min > 0 . Its density with resp ect to a unit-rate Poisson pro cess on W is 2 The inclusion of k + 1 in the denominator as opp osed to k as in Birgé & Massart is to ensure numerical stabilit y in downstream work in the rare case that k = 0 . 12 π ( C | λ C , d min ) = 1 Z hc ( λ C , d min ; W ) λ k C Y i 0 clamped to user-c hosen b ounds (e.g. f sml ∈ [ f sml min , f sml max ] , f lrg ∈ [ f lrg min , f lrg max ] ). The radius up date uses a Gaussian random w alk with reflection and hard clamping to w eakly informativ e b ounds [ r min , r max ] : r ′ = clip( r + ϵ, r min , r max ) , ϵ ∼ N (0 , σ 2 r ) . A daptive Robbins-Monro. Prop osal scales for radius and shift mo v es are adapted by a Robbins-Monro 15, 16 sc heme tow ards target acceptance rates a ⋆ (w e use a ⋆ r ≈ 0 . 234 for scalar r and a ⋆ shift ≈ 0 . 468 for random-walk shifts in R 2 ). Let a t ∈ { 0 , 1 } b e the accept indicator for the most recent prop osal of a giv en type (radius or a particular shift component). Maintain an exp onen tially w eighted moving a verage (EWMA) b a t = (1 − ρ t ) b a t − 1 + ρ t a t , ρ t = t − β , β ∈ (0 . 5 , 1] , and up date the log-scale of the prop osal b y log s t +1 = log s t + γ t ( b a t − a ⋆ ) , γ t = t − α , α ∈ (0 . 5 , 1] . Instan tiating s t b y the radius standard deviation σ r yields the radius adaptation; instan ti- ating s t b y the step fractions f sml and f lrg yields f • ,t +1 = f • ,t exp ( γ t ( b a t − a ⋆ )) , • ∈ { sml , lrg } , after which f • ,t +1 is clamp ed to its admissible interv al. F or numerical stabilit y and to prev ent runaw ay adaptation after trans-dimensional mov es, we (i) reflect at the windo w b oundary in all random-walk prop osals, (ii) hard clamp r to [ r min , r max ] , and (iii) after birth/death/split/merge we damp en the adaptation by halving the effective counts t in ρ t , γ t and recentering b a t part wa y to a ⋆ . A cceptance probabilities remain those in the fixed- k “Radius up date” and “Within-mo del Shift” paragraphs and in the trans-dimensional formulas (S14)-(S15) and (S16). As prop osal rates remain unc hanged b y the Robbins-Monro sc heme, detailed balance remains intact. Radius up date ( k fix ed). Augmen t the state with the radius r > 0 so the target b ecomes π ( k , C, r | X ) ∝ L ( X | C , r ) π ( C | λ C , d min ) π ( k ) π ( r ) , where the radial term of the Gibbs likelihoo d con tributes L ( X | C , r ) ∝ exp − 1 2 σ 2 r k X i =1 X x n : a n = i ∥ x n − c i ∥ − r 2 . 15 With probability j r at each iteration, propose a radius mo ve r ′ = r + ϵ, ϵ ∼ N (0 , τ 2 r ) , with reflection at the b oundary r ′ > 0 to main tain prop osal symmetry . The scale of the radius shift is c hosen from a small or large mo v e with user-specified standard deviations, or a uniform mo ve clamp ed to a w eakly informativ e [ r min , r max ] . The acceptance probabilit y is α r = min ( 1 , L ( X | C , r ′ ) L ( X | C , r ) π ( r ′ ) π ( r ) ) = min ( 1 , exp − ∆ U r 2 σ 2 r π ( r ′ ) π ( r ) ) , where the radial energy difference is ∆ U r = k X i =1 X x n ∈ c i ∥ x n − c i ∥ − r ′ 2 − ∥ x n − c i ∥ − r 2 . Within-mo del Shift ( k fixed). When a shift mov e is selected, uniformly select an index J ∈ { 1 , . . . , k } and prop ose a lo cal translation of the corresp onding centre. Let η ∼ q shift ( η ) . T o encourage exploration of the space, q shift is chosen from a small or large Gaussian draw with standard deviations tied to the curren t R - such that a small mov e aims to refine a p osition and a large mov es aims to mo ve from a structures b oundary to its in terior - or a uniform mov e clamped to the Leb esgue measure of the p oint set | B | . Set c ′ J = Reflect W c J + η , C ′ = n c 1 , . . . , c J − 1 , c ′ J , c J +1 , . . . , c k o . If the hard-core constraint is violated, min i = J ∥ c ′ J − c i ∥ < d min , reject immediately; otherwise accept with probabilit y α shift = min ( 1 , L ( X | C ′ ) π ( C ′ | λ C , d min ) L ( X | C ) π ( C | λ C , d min ) × 1 k q shift ( − η ) 1 k q shift ( η ) ) . With a symmetric prop osal and reflecting b oundary (so q shift ( − η ) = q shift ( η ) ), the prop osal factors cancel and the ratio reduces to the target-densit y ratio. Birth/Death ( k ↔ k ± 1 ). F or a birth mov e, choose the mo ve with probabilit y j b ( k , C ) and draw a proposed new centre c ⋆ ∼ q b ( · | k , C ) , from the prop osal space disco vered via V oidwalk er in Sec. 1.2. Set k ′ = k + 1 , C ′ = C ∪ { c ⋆ } , u ′ = ∅ , J b = 1 . Birth prop osals violating the hard-core constraint are immediately rejected. The reverse mo ve, death, c ho oses one of the k ′ cen tres uniformly to delete, such that 16 q d ( u ′ | k ′ , C ′ ) = 1 / ( k ′ ) and j d ( k ′ , C ′ ) is the probabilit y of prop osing a death at ( k ′ , C ′ ) . The birth acceptance probabilit y from (S13) is α b = min ( 1 , L ( X | C ∪ { c ⋆ } ) π ( C ∪ { c ⋆ } | λ C , d min ) π ( k + 1) L ( X | C ) π ( C | λ C , d min ) π ( k ) j d ( k + 1 , C ∪ { c ⋆ } ) j b ( k , C ) 1 / ( k + 1) q b ( c ⋆ | k , C ) ) . (S14) The death mov e ( k , C ) → ( k − 1 , C \ { c j } ) selects an index J uniformly from { 1 , . . . , k } , so q d ( J | k , C ) = 1 /k , and has acceptance probabilit y α d = min 1 , L X | C \ { c J } π C \ { c J } | λ C , d min π ( k − 1) L ( X | C ) π ( C | λ C , d min ) π ( k ) × j b k − 1 , C \ { c J } j d ( k , C ) × q b c J | k − 1 , C \ { c J } 1 /k . (S15) Split/Merge ( k ↔ k ± 1 ). T o encourage mo del exploration in cases where birth/death may b e insufficient, such as a pair of centres attempting to explain the same emitter configuration, or a single centre explaining t w o configurations, split and merge mov es are implemented. F or a split mov e with probabilit y j s , uniformly select an index J ∈ { 1 , . . . , k } , dra w auxiliary u = ( r, ω ) with densit y q s ( r , ω ) (radius and angle), and set in d = 2 c (1) = c J + r (cos ω , sin ω ) , c (2) = c J − r (cos ω , sin ω ) , C ′ = C \ { c J } ∪ { c (1) , c (2) } , k ′ = k + 1 . The reverse mov e with probabilit y j m merges a selected pair { i, j } - where the mem b ers of the pair are within 3 R of one another to encourage con textually sensible merging - to their midp oint c = ( c i + c j ) / 2 and recov ers ( r , ω ) . The dimension-matching map ( c J , r , ω ) 7→ ( c (1) , c (2) ) has Jacobian determinant | J s | = 4 r in d = 2 . The split acceptance probabilit y is α s = min ( 1 , L ( X | C ′ ) π ( C ′ | λ C , d min ) π ( k + 1) L ( X | C ) π ( C | λ C , d min ) π ( k ) j m ( k + 1 , C ′ ) q m ( i ⋆ , j ⋆ | C ′ ) j s ( k , C ) p sel ( J | C ) q s ( r , ω ) | J s | ) , (S16) where q m ( i ⋆ , j ⋆ | C ′ ) is the probabilit y of c ho osing the rev erse merge pair (typically the t wo newly created cen tres). The merge acceptance is the recipro cal form with | J m | = | J s | − 1 and the corresp onding selection and prop osal factors. 1.4 Emitter Assignmen ts and Sup er-Structure Disco v ery A p ersisten t identifier for eac h centre is maintained during RJMCMC, and up dated directly as mov es are accepted. A t the b eginning of sampling, the existing centres are assigned consecutiv e IDs { 1 , . . . , k } . A shift mov e translates an existing cen tre but leav es its ID 17 unc hanged. A birth mov e creates a new cen tre and assigns it a fresh ID, a death mov e retires the c hosen cen tre’s ID. A split replaces one ID b y tw o new IDs; a merge replaces t wo IDs by a single new ID. This deterministic index b o okk eeping remov es the need for p er-iteration assignmen ts, saving on run time and av oiding p oten tial lab elling errors that accompan y spatial implementations of the Hungarian algorithm. Let t ≤ T index accepted states and let b denote the burn-in length. F or eac h p ersisten t ID j that exists at iteration t > b , the current centre p osition c ( t ) j and (if sampled) the current radius r ( t ) are appended to that ID’s history . F rom the retained dra ws of ID j , { c ( s ) j } s ∈S j where S j ⊂ { b +1 , . . . , T } , p osterior uncertaint y is summarised via empirical momen ts: µ j = 1 S j X s ∈S j c ( s ) j , Σ j = 1 S j − 1 X s ∈S j c ( s ) j − µ j c ( s ) j − µ j ⊤ , (S17) with S j = |S j | . A running estimate of the squared radius is main tained to capture radial spread in the predictive mo del: [ E [ r 2 ] = 1 S r T X s = b +1 r ( s ) 2 . (S18) Assignmen ts are computed b oth online (p erio dically during sampling for diagnostics) and offline (once, p ost burn-in, for final lab elling). In b oth cases, the same Gaussian predictive form is used. Let σ 2 loc denote the global lo calisation v ariance (assumed isotropic) and ϵ > 0 a small numerical jitter. Assuming random radial orien tation, the radial contribution adds 1 2 [ E [ r 2 ] I 2 to the co v ariance, yielding x | j ∼ N µ j , Σ j + σ 2 loc + 1 2 \ E [ R 2 ] I 2 + ϵI 2 . (S19) Giv en the set of currently active IDs J , define the unnormalised lik eliho o ds ℓ nj = ϕ x n ; µ j , Σ j + σ 2 loc + 1 2 [ E [ r 2 ] I 2 + ϵI 2 , n = 1 , . . . , N , j ∈ J , (S20) where ϕ ( · ; µ, Σ) is the biv ariate Gaussian densit y . Ro w-normalising giv es p er-emitter assign- men t probabilities p nj = ℓ nj P j ′ ∈J ℓ nj ′ , X j ∈J p nj = 1 for all n. (S21) Emitters are assigned sto chastically , via drawing j ∼ Categorical( p n · ) . F or online diagnostics the same form ulas are reused with ( µ j , Σ j ) replaced b y running momen ts of eac h active ID up to the curren t iteration t , and with [ E [ r 2 ] replaced by its running av erage to date. This yields stable, lo w-latency estimates without any cross-iteration matc hing. The offline pass simply fixes ( µ j , Σ j ) and [ E [ r 2 ] to their p ost burn-in v alues in 18 (S17)– (S18) and ev aluates (S20)– (S21) once. IDs created near the end of sampling may ha ve small S j ; these are not eliminated, but instead their Σ j are treated with extra jitter ϵI 2 . As IDs are p ersistent, no gating parameter or assignmen t solver is required; births and splits create new IDs and deaths and merges retire or replace IDs deterministically . With the only assumption that emitter micro-structure forms ring-like arrangements, the pro cess th us far is geared tow ard finding single structures. In the case of super-structure c hains, or a DNA-Origami grid, these single structures are reflective of the individual com- p onen ts of the ov erall macro-structure. Thus, a metho d of distinguishing b etw een single structures as isolated or paired is dev elop ed. In a purely spatial meaning, tw o close single structures are indistinguishable from a sup er- structure formed by tw o sub-structures. Thus, the assignmen t information is utilised. F or eac h emitter n , up to K max candidate cen tres are stored with weigh ts, determined in Sec. 1.4. Assem ble the sparse matrix P ∈ R N ×| C | ≥ 0 , P n,i ≥ 0 , b y placing each stored weigh t for emitter n and cen tre i at ( n, i ) , and zero elsewhere. Let m row n denote the stored probability mass for emitter n . Define the ro w normalised matrix ˜ P n,i = P n,i m row n s.t. ∀ n, | C | X i =1 ˜ P n,i = 1 . Define column sums P N n =1 ˜ P n,i , and the mark matrix M ∈ R | C |× N ≥ 0 , M i,n = m i ( n ) = ˜ P n,i P N n =1 ˜ P n,i , where m i ( · ) ≡ 0 if P N n =1 ˜ P n,i = 0 . Each row m i = ( m i (1) , . . . , m i ( N )) lies in the ( N − 1) − simplex ∆ N − 1 = ( u ∈ R N ≥ 0 : N X n =1 u n = 1 ) . Define a b ounded similarity S ij ∈ [ 0 , 1] to assess the shared supp ort of emitters i, j . Let k B ( i, j ) = N X n =1 q m i ( n ) m j ( n ) , where k B ∈ [ 0 , 1] is the Bhattacharyy a distance. Let T ( i, j ) = N X n =1 m i ( n ) m j ( n ) m i ( n ) + m j ( n ) , 19 where T ( i, j ) = 0 if m i ( n ) + m j ( n ) = 0 . Generally , T ( i, j ) ≤ 1 2 . As such, it is counted t wice in the final S ij to av oid silen tly w eighting to ward k B . Let S ij = 1 2 ( k B ( i, j ) + 2 T ( i, j )) , S ii = 0 . High S ij suggests cen tres with similar emitter distributions, where S ij = 1 implies an iden tical distribution of emitters. Eac h S ij is tested against a randomly lab elled (RL) n ull to determine the significance of the shared supp ort, under the hypothesis H 0 : i, j are dissimilar / monomeric structures , H 1 : i, j are similar / a dimer pair . Let ˆ λ : R 2 → R ≥ 0 b e the LGCP-fit intensit y field of the cen tres, estimated b y the same SPDE process as in Sec. 1.2. F orm Q quantile bins of { ˆ λ i } . In eac h bin, p ermute lab els indep enden tly; preserving inhomogeneity . Rep eat permutation for b = 1 , . . . , B , collecting upp er-triangular entries n S ( b ) ij : i < j o . Calculate pairwise RL p-v alues p ij = 1 + # n b : S ( b ) ij ≥ S ij o B + 1 . T o stabilise pairs across heterogeneous regions, p o ol all p ermuted scores S po ol = B [ b =1 n S ( b ) ij : i < j o , setting a single global barrier at a high quan tile, q . If b oth p ij ≤ α and S ij ≥ S po ol [0 . 99] hold, centres i, j, are considered a pair, and emitter assignments are relab elled such that any emitters b elonging to a group ed cen tre share the same lab el as that group. F ollowing sup er-structuring, the data are separated based on the n um b er of connected structures. The data in Fig. S8, for example, is separated into t w o datasets; single and paired. 1.5 ASMBLR: Assem bling Structured Molecular Building blo cks from Lo cali- sation Reconstructions Giv en the sampled and finalised emitter-to-cen tre assignments p er dataset, discussed in Sec. 1.4, let a n ∈ {− 1 , 0 , 1 , . . . , J − 1 } , n = 1 , . . . , N , denote the p er-emitter cen tre lab els, where − 1 represents emitters that were unassigned. Define the index of assigned emitters I = { n : a n ≥ 0 } and, for eac h cen tre j , the group 20 (a) (b) Figure S8: (a) Sampled emitter assignments. (b) Mark-relab elling-based sup er-structuring of inferred cen tres. G j = { n ∈ I : a n = j } , j = 0 , . . . , J − 1 . Within each G j consider the induced complete graph on its v ertices, so every k -subset of G J is a k -clique. Let k ≥ 2 b e the desired clique size and Ω = n j : | G j | ≥ k o , K = [ j ∈ Ω G j k ! b e the centres with enough mem b ers and the univ erse of admissible k -cliques, resp ectiv ely . Dra w n samples distinct cliques via rep eated t wo-stage sampling with de-duplication: 1. Filter: Discard all unassigned emitters a n = − 1 . Build Ω , and a map j 7→ G j . 2. Prop ose: Cho ose J ⋆ ∼ Unif (Ω) , and c ho ose S ⋆ ∼ Unif G J ⋆ k , without replacement, within G J ⋆ . 3. De-duplicate: If S ⋆ has not b een sampled b efore, accept it; otherwise reject and resample. The procedure ends when n samples ha ve b een accepted 3 , or a fixed n um b er of attempts ha ve b een made to sample distinct cliques. The output is 3 A necessary condition is th us P j ∈ Ω | G j | k ≥ n samples , otherwise fewer than n samples distinct cliques exist after removing unassigned emitters. 21 { X S ( r ) } n samples r =1 ∈ R n samples × k × 2 , the set of emitter co ordinates of eac h selected clique. On a single prop osal, the probability of a particular clique S ∈ G j k b eing proposed is P { S prop osed } = 1 | Ω | · 1 | G j | k , so the sampler is uniform within groups, treating groups equally . Consequen tly , when groups ha v e v arying sizes, the ov erall law on K is not uniform across all cliques; cliques from larger groups hav e smaller p er-prop osal probability . If exact global uniformity on K is required, one should choose the group with w eights prop ortional to | G j | k and draw S ∼ Unif G j k . T o quan tify the probability that a sampled clique is structurally coheren t, define P within ( k ) as the probabilit y that all k mem b ers of a sampled k -clique originate from the same underlying structure. Uniform radial sampling. Consider a radial neigh b ourho o d (e.g. within a fixed cut-off) con taining s emitters from a single true structure and c additional emitters arising from clutter or neighbouring structures, so that the neighbourho o d size is s + c . If a k -clique is sampled uniformly without replacement from this neigh b ourho o d, then P rad within ( k ; s, c ) = s k s + c k . (S22) V oidw alker/assignmen t-guided sampling. Let a ∈ [0 , 1] denote the p er-emitter as- signmen t accuracy , i.e. the probability that an emitter is assigned to its true centre. Under an indep endence appro ximation for assignment correctness across clique mem b ers, the prob- abilit y that all k members of a clique drawn within an inferred group are correctly assigned is P VW within ( k ; a ) = a k . (S23) This provides an analytical upp er b ound on the rate of structurally coheren t clique draws ac hiev able b y assignmen t-guided sampling at a given accuracy a . F ollowing the iden tification of candidate molecular features through the sampling of cliques from co-assigned emitters, the mo del can b e reduced to a set of spatial relation- ships b etw een connected emitters. Let X a n = { x a n 1 , . . . , x a n N a } b e the set of N a emitters in R 2 that share assignmen t lab el a , where each x a n i = ( x a n i 1 , x a n i 2 ) is a tw o dimensional vector represen ting its lo cation in W . This p oin t set is then limited to the inner-space of W ; the N a × N a Euclidean distance matrix of separations of co-assigned emitters, denoted R . Each en try R ij represen ts the Euclidean distance b etw een emitters i and j , given b y: 22 R ij = v u u t 2 X d =1 ( x a n i d − x a n j d ) 2 , where a n represen ts the identical assignment lab el of b oth emitters i and j. The data for the reconstruction algorithm consists of a series of p oint sets formed from the sampled cliques, where N cliques is the num b er of cliques. Eac h clique con tains a measuremen t set of size M ≤ N represen ting a lo calised set of detections L n = { l 1 , . . . , l M } for each n = 1 , . . . , N cliques . Eac h l i is a d -dimensional v ector represen ting a point in the domain for i = 1 , . . . , M , analogous to the mo del lo cations with asso ciated uncertain ty . This ground truth uncertain ty is represen ted b y an additional Gaussian distribution cen tred on the true p ositions, which is not av ailable from measuremen ts and so is provided a priori , based on knowledge of the problem area, i.e. DNA origami repro ducibility or protein complex stabilit y . Each measurement set has rotational and translational freedom relativ e to the mo del, addressed by considering only the in ternal spatial relationships within L n . Each measuremen t set can therefore also b e represented as a Euclidean distance matrix, S n , where the full set of data can therefore b e represen ted as the v ector S = S 1 , . . . , S N cliques . F or eac h clique, mo del locations are mapp ed to the measuremen t set by introducing a set of corresp ondences, or assignments, b et w een eac h mo del location, x n , and measuremen t lo calisation, l j in eac h clique. Note that the mo del lo cations, are shared across the cliques. The vector of correspondences betw een elements in the L measuremen t and X lo cation sets is denoted K = ( k 1 , k 2 , . . . , k M ) , where eac h k i ∈ { 1 , 2 , . . . , N } for all i = 1 , . . . , M , and k i = k j , for all i = j . Thus, the index of eac h assignmen t corresp onds to the lo calisation and v alue corresp onds to the lo cation. This concept is depicted in Fig. S9 As the order of assignmen ts in K is informativ e, the list of p ossible assignment com- binations for each dataset can b e expressed as the p ermutations of size M from the set { 1 , . . . , N } . There are therefore ( N ) M = N ! ( N − M )! p erm utations of assignmen t sets. A common problem in sup er-resolution imaging is the app earance of spurious detections in the data whose spatial arrangemen t is unkno wn, resulting in separations that are not otherwise accounted for by the mo del. The V oidw alker-Gibbs pip eline do es substantially reduce this o ccurrence, but do es not nullify it is a p ossibility . Where one or b oth of x i or x j are not incorp orated in the mo del structure X , their asso ciated separation is termed a clutter separation. A dditionally , close spatial proximit y b etw een distinct, disconnected structures may pro duce separations that bridge these indep endent structures. T o handle this p ossibility , these bridge separations are also deemed clutter separations. Hence, there exist tw o distinct sources of clutter, depicted in Figure S10. T o account for clutter, an additional assignment v alue, k i = 0 is in tro duced. Eac h non- 23 Figure S9: The mo del structure as a connected square (a) and the cliques as triangular graphlets (b). Index remains consisten t betw een mo del and cliques. Cliques themselves are order in v ariant, but are used to construct the order dep endent assignments, e.g. the clique with lo cations {1, 3, 4} has assignmen ts K=(1, 3, 4), K=(3, 4, 1) etc. Figure S10: The t w o types of clutter in the mo del: (a) spurious detection, and (b) bridging. clutter assignmen t k i ∈ { 1 , 2 , . . . , N } can feature only once p er assignment combination, ho wev er the clutter assignmen t k i = 0 can app ear more than once. This new, complete, set of p ossible assignments, K all , is constructed a priori and has size | K all | 4 , given by | K all | = M X q =0 N ! ( N + q − M )! M ! q !( M − q )! , for M ≤ N . (S24) Under the assumption that the structure represen ted b y the mo del is fully connected and the measuremen ts are randomly drawn and abundant, eac h p ossible assignmen t set, K , in K all w ould b e exp ected to hav e an equal probability of app earing in the dataset. Ho wev er, to ensure that the num b er of clutter assignmen ts reflects prior b eliefs regarding the exp ected prop ortion of clutter in a sample, the probability distribution ov er each p ossible assignment, 4 As the total num b er of p ossible assignment sets | K all | grows com binatorially in N and M , explicitly computing the full probabilit y distribution, P ( K ∗ n ) , b ecomes infeasible. A sampler is adapted to batc h pro cess probabilities and retain the top-K 17 highest probability assignments, binning all else into a non-top- K bin, and forming a probability distribution from the top-K, with this bin as a single en try . Sample then from this distribution, and sample uniformly in the non-top-K bin, if this bin is sampled. A Multiple-T ry Metrop olis correction step 18 is incorp orated to account for truncation bias as a result of top- K rest-bin sampling. 24 K , is constructed as follo ws. A Beta prior is placed on the prop ortion of clutter lo cations, denoted P clutter , so that P clutter ∼ Beta ( a, b ) where the shap e parameters are initially set to a = 1 and b = 9 so that mo del will minimise P clutter and reflect that optimally there is no clutter and on a verage, 10% clutter is exp ected in t ypical datasets. As the distribution of clutter measuremen ts in the dataset is random, let the n umber of clutter measurements, Q , within a single assignmen t set of size M , b e binomially distributed so that Q ∼ Binomial ( M , P clutter ) . Therefore, Q = 0 describ es vectors with no clutter, Q = 1 describ es vectors containing a single clutter assignmen t, Q = 2 describ es v ectors with tw o clutter assignmen ts, and so on, for Q = 0 , 1 , . . . , M . Assignment com binations require at least 2 non-clutter assignments to provide v alid separation information. Generally , a d -dimensional clique with fewer than ( M − ( d + 1)) non-clutter assignmen ts is equiv alen t to an all clutter assignmen t set as it con tains insufficient informative separations to constrain the structure of in terest. T o handle this, in the prior distribution, assignment probabilities of v ectors with more than ( M − ( d + 1)) clutter are assigned to the all clutter assignment set. The probabilit y distribution across all assignment vectors is defined b y allo cating the probabilit y of having Q = q clutter assignments evenly across all p ossible assignments con- taining q clutter assignments. Therefore, the probability of selecting a specific assignment v ector, K i , denoted P ( K i | P clutter ) , which has q i clutter assignments is giv en b y P ( K i | P clutter ) = P ( Q = q i ) N ! ( N + q i − M )! M ! q i !( M − q i )! for i = 1 , . . . , | K all | and q i ∈ { 1 , . . . , M } . Substituting in the expression for P ( Q = q ) from the binomial distribution and simplifying: P ( K i | P clutter ) = P clutter q i (1 − P clutter ) ( M − q i ) ( N + q i − M )! N ! for i = 1 , . . . , | K all | and q i ∈ { 1 , . . . , M } . Consider now the distribution of separations from the Euclidean distance matrix of mo del lo cations, R . Considering p oin t pairs indep endently , for tw o p oin ts chosen at random in a disk with radius ρ = 1 2 R max , the distribution of a distance, r , b et ween p oints is not uniform, but instead has the probabilit y distribution function 19 : 25 P ( r ) = 4 r π ρ 2 cos − 1 r 2 ρ ! − 2 r 2 π ρ 3 v u u t 1 − r 2 4 ρ 2 . (S25) P ( r ) serves as the prior on each separation, R ij , when lo cations x i and x j are considered to b e within the mo del lo cation set X . Clutter separations follo w a uniform distribution o ver R max , reflecting the maximal uncertain t y in r when lo calisation constrain ts do not apply . Therefore the prior distribution for eac h separation b etw een lo cations x i and x j for all i, j = 1 , . . . , N , given their resp ectiv e assignments denoted here for simplicity as k i for x i and k j for x j , is giv en b y P ( R ij | k i , k j ) = 1 R max if k i = 0 or k j = 0 and R ij < R max , P ( R ij ) if k i , k j > 0 and R ij < R max , 0 if R ij > R max , where P ( R ij ) is as sho wn in Eq. (S25). The full set of all parameters to b e estimated by the mo del is therefore θ = ( R , K , P clutter ) . The prior distribution, P ( θ ) , is given b y P ( θ ) = P ( R | K ) × P ( K | P clutter ) × P ( P clutter ) , where pairwise indep endence is assumed for separations and assignmen ts, so that P ( R | K ) = N Y j =2 j − 1 Y i =1 P ( R ij | k i , k j ) , P ( K | P clutter ) = | K all | Y i =1 P ( K | P clutter ) . Consider the lik eliho o d of the data; the Euclidean distance matrix of localisation sep- arations, S n , for n = 1 , . . . , N cliques . Assume that for eac h matrix, each element S ij , for i, j = 1 , . . . , M , follo ws a folded Gaussian distribution 20 with mean given b y the assigned mo del separation, denoted here as R ij for simplicit y , and v ariance σ i determined b y the r ∆ x measure as describ ed in Iy er et al 21 , so that, for eac h i, j ∈ { 1 , . . . , M } , i = j , P ( S ij | R ij , σ 2 i ) = 1 q 2 π σ 2 i exp − ( S ij − R ij ) 2 2 σ 2 i ! + exp − ( S ij + R ij ) 2 2 σ 2 i !! . (S26) 26 Assuming that the lo calisation separations are pairwise indep enden t, then P ( S n | θ ) = P ( S n | R ) = M Y j =2 j − 1 Y i =1 P ( S ij | R ij , σ 2 i ) . (S27) Th us, the full lik eliho o d ov er all N cliques is given by P ( S | θ ) = N cliques Y n =1 P ( S n | θ ) . The likelihoo d of the measurement separations, S , dep ends on the mo del separations, R , and so is then indirectly dependent on the assignments and amoun t of clutter in the mo del. This dep endency is accoun ted for in the prior distribution by the P ( P clutter ) term. The full mo del p osterior can then b e expressed as P ( θ | S ) ∝ P ( S | θ ) × P ( θ ) . A t each iteration, the Euclidean distance matrix of separations, R , is up dated by prop os- ing new lo cations for all x i ∈ X . T o ac hiev e this, for eac h co ordinate, x i k ∈ x i , a new v alue is prop osed based on one of t wo Gaussian distributions or a uniform distribution. The Gaussian distributions are centred on the current co ordinate v alue, x ( t ) i k at iteration t , and one of t wo p ossible v ariance v alues are considered and fixed a priori , allo wing for the mov es of different magnitudes: a large mov e or a small mo v e, with v ariances σ 2 large or σ 2 small resp ectiv ely , or a uniform mov e across the domain. The small mov e has v ariance σ 2 small = c 2 . 38 / √ d ) q σ 2 GT + ( σ 2 measurement / N eff )) , where σ GT represen ts the (sample dep enden t) uncertaint y in p ositions in the structure to b e reassem- bled, σ measurement is the av erage measuremen t uncertain ty , c 2 . 38 / √ d is the optimal scaling factor for the prop osal co v ariance in the random-walk Metrop olis algorithm with Gaussian prop osals in d dimensions with optional scaling factor c = 1 22 , and N eff = N cliques × ( M / N ) is the effectiv e sample size. The v ariance of the large mo ve, σ 2 large = R max / 4 , is set such that in a single mov e, p ositions can b e reasonably exp ected to tra v erse the p ortion of the domain with high probability of con taining the structure of interest. F or completeness, the new co ordinate may also b e dra wn from a uniform distribution U (1 /R max ) to ensure the proposal has a non-zero probabilit y of reac hing any p osition in the domain in a single mov e. Therefore, for each coordinate x i k , a new v alue is drawn from one of: x ∗ i k ∼ N x ( t ) i k , σ 2 large , N x ( t ) i k , σ 2 small , Unif (0 , ρ ) , 27 where it is recalled that ρ = 1 2 R max . P clutter is initially dra wn from Beta (1 , 9) , and new v alues for P clutter are prop osed from Beta ( a + Q, b + ( M − Q )) , where Q is num b er of clutter measuremen ts. Thus the prop osal distribution at iteration ( t + 1) for P clutter is given by: P ( P ∗ clutter | P ( t ) clutter ) ∼ Beta a + Q ( t ) , b + ( M − Q ( t ) ) . Giv en P clutter , the probabilities, P ( Q = q i ) and consequen tly P ( K i | P clutter ) can b e drawn for all p ossible assignmen t sets, where i = 1 , . . . , | K all | . T o propose the new assignment set, denoted K i for i = 1 , . . . , | K all | , for eac h clique, a probabilit y distribution, denoted P ( K i ) , is constructed as the pro duct of relev ant prior distributions and the lik eliho o d of the subset of lo calisations corresp onding to the assignmen t set. F or eac h clique n , all p ossible assignment sets within clique n ha v e equal lik eliho o d given by Eq. (S27), for n = 1 , . . . , N cliques . This is then m ultiplied b y the prior distribution of prop osed parameter v alues for that assignment set, denoted here as P ( θ ∗ i ) , and giv en b y P ( θ ∗ i ) = P ( R | K i ) × P ( K i | P clutter ) × P ( P clutter ) , T o construct a probability distribution, w e then normalize o v er all assignmen t sets within eac h clique n , and dra w the prop osed assignmen t set, K ∗ n , for eac h clique n from this, so that P ( K ∗ n ) = P ( S n | θ ∗ ) × P ( θ ∗ n ) P | K all | i =1 P ( S i | θ ∗ ) × P ( θ ∗ i ) and thus P ( K ∗ ) = N cliques Y n =1 P ( K ∗ n ) . The un-normalised pro duct of lik eliho o d and prior for each assignmen t and eac h clique is retained to ensure detailed balance when calculating the acceptance ratio. The p osterior distribution at iteration ( t + 1) is then constructed for the prop osed set of parameters ov er all cliques and accepted or rejected based on an acceptance ratio given b y , α = P ( θ ∗ | S ) × P ( K ( t ) ) × P ( P ( t ) clutter | P ∗ clutter ) P ( θ ( t ) | S ) × P ( K ∗ ) × P ( P ∗ clutter | P ( t ) clutter ) . The ratio of the un-normalised prop osal distribution for prop osed and current assignmen t sets must also be m ultiplied to ensure detailed balance. P ost-ho c, align all iterations to the Maximum a Posteriori (MAP) to estimate uncertainties, and assess conv ergence of b oth mo del dimension and P clutter b y Gelman-R ubin. W e v alidate ASMBLR reconstructions through three complemen tary statistical tests that collectiv ely address whether inferred structures represen t genuine geometric patterns rather than artifacts of template matc hing or ov erfitting to sparse data. Each test ev aluates a dis- tinct asp ect of mo del-data agreement: p er-vertex consistency , global coherence, and sp eci- ficit y of the disco vered orientation. 28 (a) (b) Figure S11: T emplate-free reconstructed molecule for inferred centres of (a) sim ulated Nup96 and (b) 3 × 3 DNA-Origami. P er-V ertex Hypothesis T ests with Bonferroni Correction F or eac h of the k vertices in a reconstructed k -fold motif, w e test whether the idealised mo del p osition is consisten t with the corresp onding p osterior distribution. Let m i denote the p osition of vertex i in the idealised k -fold mo del (obtained via Hungarian algorithm 23 to minimise total Gaussian negativ e log-lik eliho o d), and let µ i and Σ i denote the empirical mean and co v ariance of v ertex i computed from p ost-burn-in MCMC samples. W e test the null h yp othesis H ( i ) 0 : m i ∼ N ( µ i , Σ i ) for eac h vertex. The test statistic is the squared Mahalanobis distance: D 2 i = ( m i − µ i ) ⊤ Σ − 1 i ( m i − µ i ) , (S28) whic h measures the distance from m i to µ i accoun ting for the shap e and orien tation of the p osterior uncertaint y ellipse. Under H ( i ) 0 , D 2 i follo ws a χ 2 distribution with 2 degrees of freedom (corresp onding to the 2D spatial co ordinates). T o control the family-wise error rate across k simultaneous tests, w e apply Bonferroni correction with adjusted significance level α Bonf = α/k , where α = 0 . 05 . W e compute the tail probabilit y p i = P ( χ 2 (2) ≥ D 2 i ) for eac h v ertex and reject H ( i ) 0 if p i < α Bonf . A v ertex is deemed consistent with the mo del if p i ≥ α Bonf . Fisher’s Com bined T est for Global Consistency While p er-v ertex tests assess indi- vidual p ositions, they do not ev aluate whether all vertices are join tly consisten t with the geometric constrain t of k -fold rotational symmetry . W e emplo y Fisher’s metho d to com bine 29 the k p-v alues { p 1 , . . . , p k } into a global test statistic: F = − 2 k X i =1 log( p i ) . (S29) Under the global n ull hypothesis H global 0 (all individual n ull hypotheses H ( i ) 0 hold sim ul- taneously), and assuming indep endence of the p-v alues, F follo ws a χ 2 distribution with 2 k degrees of freedom. W e compute the combined p-v alue as p Fisher = P ( χ 2 (2 k ) ≥ F ) . In terpretation: Large v alues of p Fisher (e.g., p Fisher > 0 . 95 ) indicate exceptionally tight agreemen t b etw een the constrained mo del and p osterior means, whic h arises when a genuine k -fold pattern exists in the data. This o ccurs b ecause the mathematical constrain t (only 3 free parameters: cen tre x , centre y , rotation θ ) naturally pro duces close alignmen t when the underlying structure exhibits true rotational symmetry . Con v ersely , p Fisher ≈ 0 . 5 indicates t ypical consistency , and p Fisher < 0 . 05 suggests systematic deviation from the mo del. P ermutation T est Against Random Orien tations The p er-vertex and Fisher tests establish that the mo del fits the data, but do not address whether the discov ered orien tation is uniquely determined by the data or whether any rotation w ould fit equally well. T o distin- guish gen uine patterns from spurious alignments, w e p erform a p ermutation test comparing the observed alignment qualit y to a n ull distribution generated from random rotations. Our test statistic is the sum of squared Mahalanobis distances: Q = k X i =1 D 2 i , (S30) where smaller v alues indicate b etter alignmen t. W e compute Q obs for the optimal rotation θ ∗ disco vered b y ASMBLR. T o construct the null distribution, w e generate N perm = 10 , 000 random rotations { θ (1) , . . . , θ ( N perm ) } uniformly sampled from [0 , 2 π ) . F or eac h θ ( j ) , we: 1. Generate a k -fold mo del at rotation θ ( j ) : m ( j ) i = c + R cos( θ ( j ) + 2 π i/k ) sin( θ ( j ) + 2 π i/k ) , where c is the cen tre and R is the radius estimated from the p osterior means. 2. Compute the optimal v ertex-to-sp ot assignment via the Hungarian algorithm to mini- mize total Mahalanobis distance. 3. Compute the n ull statistic Q ( j ) = P k i =1 ( D ( j ) i ) 2 for this random rotation. The p ermutation p-v alue is the fraction of null statistics as extreme or more extreme than the observ ed: p perm = 1 N perm N perm X j =1 1 ( Q ( j ) ≤ Q obs ) , (S31) 30 where 1 ( · ) is the indicator function. Small v alues of p perm (e.g., p perm < 0 . 05 ) indicate that the disco vered orientation is significantly b etter than random, pro viding strong evidence for a genuine k -fold pattern. In terpretation and Decision Criteria W e classify reconstruction qualit y based on the com bined evidence from all three tests: • Strongly Supp orted: All v ertices pass per-vertex tests, p Fisher > 0 . 5 , and p perm < 0 . 001 . The k -fold pattern is unam biguous. • W ell-Supp orted: ≥ ( k − 1) /k v ertices pass, p Fisher > 0 . 05 , and p perm < 0 . 01 . The pattern is statistically clear despite some p ositional uncertaint y . • A dequate: ≥ ( k − 2) /k vertices pass, p Fisher > 0 . 01 , and p perm < 0 . 05 . The pattern is detectable but marginal. • Questionable: F ew er than ( k − 2) /k vertices pass or p perm ≥ 0 . 05 . Insufficient evidence for k -fold symmetry . The p erm utation test is the most critical diagnostic, as it directly addresses whether the reconstructed orien tation represents genuine geometric regularity v ersus c hance alignment to noise—the core concern raised by template-matching critiques. A large impro vemen t ratio Q null /Q obs ≫ 1 (where Q null is the mean of the null distribution) pro vides in tuitiv e evidence that the disco vered pattern is not arbitrary . 2 Observ ations 2.1 GR OUP A and BaGoL: Complementary Approaches to Emitter Estimation GR OUP A and BaGoL 13, 14 represen t fundamentally differen t approaches to the measurement- to-emitter clustering problem in SMLM, designed for distinct analytical scales and use cases. Here w e clarify their relationship and explain why a direct quantitativ e comparison was not undertak en. BaGoL (Bay esian Grouping of Lo calisations) op erates at the single-structure level within man ually defined regions of interest (ROIs). It emplo ys a full Bay esian hierarc hical mo del with RJMCMC to jointly infer: • The num b er of emitters K within an ROI, • Emitter p ositions { µ k } K k =1 , • Assignmen t of each lo calisation to an emitter, • Emitter-sp ecific photophysical parameters. 31 The generative mo del assumes lo calisations arise from a mixture of Gaussians cen tred at true emitter p ositions, with measurement uncertain ties propagated through the likelihoo d. BaGoL ac hieves sub-nanometre precision by po oling information across rep eated observ a- tions of eac h emitter. GR OUP A (Grouping Observ ations Under Pairwise Asso ciations) op erates at the field-of- view level without requiring R OI pre-selection. Rather than fitting a global mixture model, GR OUP A reduces the clustering problem to a series of pairwise h yp othesis tests: BF ij = P ( data | H 0 : common emitter ) P ( data | H 1 : distinct emitters ) = I ij · V eff , (S32) where I ij is the o verlap integral b etw een lo calisation uncertain t y distributions and V eff is the effective volume p enalty (see Sec. 1.1). These pairwise evidences are assembled in to a w eighted graph, and communit y detection via the Infomap algorithm 3 partitions lo calisations in to emitter groups. The fundamental distinction lies in analytical scale: Characteristic BaGoL GR OUP A Input scop e Single ROI En tire field-of-view R OI selection Man ual, required Not required T ypical input size 10 1 – 10 2 lo calisations 10 3 – 10 5 lo calisations Output precision Sub-nanometre Nanometre-scale Computational cost High (RJMCMC p er ROI) Mo derate (pairwise + graph) Prior sensitivity Mo derate–High Lo w T able S1: Comparison of BaGoL and GR OUP A op erational c haracteristics. BaGoL’s RJMCMC sampler explores a mo del space that gro ws combinatorially with the n umber of lo calisations, making it computationally prohibitiv e for large fields without prior segmen tation in to R OIs. This segmen tation, ho wev er, requires either man ual in terven tion or a preliminary clustering step, in tro ducing the v ery sub jectivit y that motiv ates alternative approac hes. GR OUP A circumv en ts this b y op erating on pairwise relationships with computational complexit y O ( N · ¯ k ) , where N is the num b er of lo calisations and ¯ k is the a verage neigh- b ourho o d size under a spatial cutoff. The graph-based comm unity detection then scales as O ( E log E ) for E edges, enabling field-wide analysis without R OI pre-selection. A direct quan titative comparison betw een GR OUP A and BaGoL would require: 1. Applying BaGoL to the same synthetic datasets used for GR OUP A b enchmarking, 2. Defining R OIs for BaGoL in a manner that do es not presupp ose kno wledge of structure lo cations, 32 3. Matc hing computational budgets or accepting substan tial run time disparities. The second requirement presents a methodological circularit y: any automated ROI defi- nition pro cedure would itself constitute a clustering algorithm, confounding the comparison. Man ual ROI definition, while standard practice for BaGoL, is incompatible with the auto- mated, discov ery-fo cused w orkflow that GROUP A enables. Moreo ver, the metho ds optimise for different ob jectiv es. BaGoL maximises lo calisation precision within kno wn structures; GROUP A maximises partitioning accuracy across un- kno wn structures. Comparing ARI scores b etw een a method designed for precision and one designed for disco very would conflate distinct p erformance dimensions. Rather than comp eting alternatives, GROUP A and BaGoL address complemen tary needs in SMLM analysis workflo ws: 1. Disco very-focused analysis : GR OUP A enables field-wide partitioning without prior structural kno wledge, identifying candidate emitter groups for do wnstream analysis. This is appropriate when: • Structure lo cations are unknown a priori , • Large fields m ust b e pro cessed automatically , • The goal is structural disco very rather than precision refinemen t. 2. Precision-fo cused analysis : BaGoL achiev es maximal lo calisation precision within defined ROIs. This is appropriate when: • Structures of in terest ha ve b een iden tified (man ually or via GR OUP A), • Sub-nanometre precision is required for downstream measuremen ts, • Computational cost is secondary to precision. 3. Hybrid w orkflows : A natural pip eline com bines b oth approaches: (a) Apply GROUP A for field-wide emitter partitioning, (b) Iden tify structures of in terest via V oidwalk er-Gibbs, (c) Apply BaGoL to selected R OIs for precision refinemen t. This complementary relationship motiv ates our comparison of GROUP A against DB- SCAN and HDBSCAN (Fig. 2 of the main text), which op erate at the same analytical scale and address the same partitioning ob jective. BaGoL remains the metho d of c hoice for applications requiring maximal precision within pre-defined structures. F or completeness, we provide complexit y estimates for b oth metho ds: 33 BaGoL (p er R OI with n lo calisations, K emitters, T MCMC iterations): O ( T · n · K ) lik eliho o d ev aluations per R OI , (S33) with T t ypically 10 4 – 10 5 and the trans-dimensional mov es (birth/death) requiring additional b o okkeeping. F or a field with R R OIs, total complexit y scales as O ( R · T · ¯ n · ¯ K ) . GR OUP A (for N lo calisations with a verage neighbourho o d size ¯ k ): O N · ¯ k pairwise Bay es factors + O ( E log E ) communit y detection , (S34) where E ≤ N · ¯ k is the num b er of edges retained after thresholding. With spatial indexing (e.g., k-d trees), neighbourho o d queries are O (log N ) , yielding total complexity O ( N · ¯ k · log N ) . F or typical SMLM datasets ( N ∼ 10 4 , ¯ k ∼ 10 , R ∼ 10 2 , ¯ n ∼ 10 2 , T ∼ 10 4 ), GR OUP A requires ∼ 10 5 – 10 6 op erations while BaGoL requires ∼ 10 8 – 10 9 op erations, a difference of 2-3 orders of magnitude. This disparity underscores that the methods are designed for differen t scales rather than representing comp eting solutions to the same problem. 2.2 Uniform Clique Sampling in SMLM The c hallenge of sampling structurally represen tative cliques from SMLM data is a practical b ottlenec k that significantly impacts downstream reconstruction qualit y . Here we provide additional mathematical detail and practical guidance on the clique sampling problem illus- trated in Fig. 3(e) of the main text. Consider a t ypical SMLM scenario where an 8-fold symmetric structure (such as Nup96) is imaged with incomplete lab elling and background clutter. When sampling a clique of size k from a radial neighbourho o d, the probabilit y of obtaining a "pure" clique - one where all mem b ers originate from the same underlying structure - dep ends on the comp osition of that neigh b ourho o d. Structurally Representativ e Clique. A k -clique C = { e 1 , . . . , e k } sampled from an emitter set X is structur al ly r epr esentative if all members share the same true structural paren t, i.e., parent ( e i ) = parent ( e j ) for all i, j ∈ { 1 , . . . , k } . F or uniform radial sampling within a cut-off distance d cut , the neighbourho o d around a seed emitter t ypically con tains: • s emitters from the same true structure as the seed • c clutter spurious emitters (bac kground noise, autofluorescence) • c bridge emitters from neighbouring structures whose spatial extent o verlaps the searc h radius 34 The total con tamination is c = c clutter + c bridge , and the neighbourho o d size is n = s + c . When sampling uniformly without replacement from a neigh b ourho o d of size n contain- ing s true structure members, the probabilit y of drawing a pure k -clique is given b y the h yp ergeometric ratio: P rad within ( k ; s, c ) = s k s + c k = s ! / ( s − k )! ( s + c )! / ( s + c − k )! = k − 1 Y i =0 s − i s + c − i This expression has several imp ortant prop erties: 1. Monotonic deca y in k : As clique size increases, P rad within decreases rapidly . Each additional member in tro duces another opp ortunit y for contamination. 2. Sensitivit y to contamination ratio: The probability dep ends on c/ ( s + c ) , the con tamination fraction. Ev en mo dest con tamination sev erely impacts large cliques. 3. Asymptotic b eha viour: F or fixed con tamination c > 0 , lim k → s P rad within → 0 , meaning pure cliques b ecome increasingly rare as k approaches the true structure size. Consider a fully lab elled 8-fold ring ( s = 8 ) with a neigh b ourho o d contaminated by 3 spurious detections ( c = 3 ), giving n = 11 total emitters. The probabilit y of sampling a pure clique of v arious sizes is sho wn in T able S2. k T k = s + c k W k = s k B k = T k − W k P rad within P rad between P VW within Impro vemen t 2 55 28 27 0.509 0.491 0.810 1.6 × 3 165 56 109 0.339 0.661 0.729 2.1 × 4 330 70 260 0.212 0.788 0.656 3.1 × 5 462 56 406 0.121 0.879 0.590 4.9 × 6 462 28 434 0.061 0.939 0.531 8.7 × 7 330 8 322 0.024 0.976 0.478 19.9 × 8 165 1 164 0.006 0.994 0.430 71.7 × T able S2: Probability of sampling a structurally pure k -clique under uniform radial sam- pling ( s = 8 true emitters, c = 3 contaminan ts) v ersus V oidw alker-guided sampling (90% assignmen t accuracy). T k : total k -cliques in neighbourho o d; W k : within-structure cliques; B k : b et ween-structure/con taminated cliques; P rad within , P rad between : uniform sampling probabili- ties; P VW within : V oidw alker-guided probabilit y ( 0 . 9 k ); Improv ement: ratio P VW within /P rad within . This dramatic deca y in P rad within explains why uniform radial sampling b ecomes impractical for ASMBLR when con tamination is presen t: the v ast ma jority of sampled cliques will con- tain emitters from multiple sources, corrupting the internal geometry used for reconstruction. A t k = 8 , fewer than 1% of uniformly sampled cliques are structurally pure. 35 The V oidw alk er-Gibbs pip eline pro vides p er-emitter assignment probabilities to inferred structural centres, enabling assignment-guide d clique sampling. Rather than sampling uni- formly from spatial neighbourho o ds, cliques are drawn from emitters sharing the same centre assignmen t. Under the indep endence approximation for assignment correctness, if each emit- ter is correctly assigned with probability a ∈ [ 0 , 1] , then: P VW within ( k ; a ) = a k This expression represen ts an upper b ound on structural coherence achiev able through assignmen t-guided sampling. The k ey observ ation from Fig. 3(e) is that the impro v emen t factor gro ws rapidly with clique size, precisely where ASMBLR b enefits most from consistent in ternal geometry . F or k = 8 (full ring), V oidw alker-guided sampling with 90% accuracy yields P within ≈ 0 . 43 , a 72-fold improv emen t ov er uniform sampling in the con taminated neigh b ourho o d. Based on these analyses, w e offer the following guidance for clique sampling in SMLM reconstruction: 1. Prefer assignmen t-guided sampling when a v ailable; the improv emen t factor grows ex- p onen tially with clique size. 2. T arget mo derate clique sizes ( k = 3 – 5 ) that provide sufficient geometric constrain ts for reconstruction while maintaining reasonable purit y probabilities ab ov e 50%. 3. Sample more cliques than strictly necessary , then use internal consistency metrics (e.g., v ariance in reconstructed separations) to identify and discard likely con taminated cliques. 4. A ccount for imp erfect assignmen t accuracy . Even at 90% accuracy , approximately 57% of sampled 8-cliques will con tain at least one misassigned emitter. ASMBLR’s robustness to mo derate contamination partially mitigates this issue. 5. The num b er of pure cliques av ailable for reconstruction is approximately N cliques × P within ( k ; a ) ; ensure this exceeds the minim um required for stable inference. 2.3 Information-Theoretic Limits of Under-sampled Data The sup er-structure disco very algorithm (Sec. 1.4) exhibits a sharp performance degrada- tion at lo w lab elling efficiencies that cannot b e o vercome by algorithmic refinemen t. This section characterises the information-theoretic basis for this limitation and pro vides practical guidance on when sup er-structure inference is feasible. The sup er-structure disco v ery algorithm relies on comparing the marks asso ciated with eac h structural centre, where a mark m i ∈ ∆ N − 1 is a probabilit y distribution ov er emitter 36 assignmen ts. The discriminative p ow er of mark-based similarity dep ends on the information con tent of these distributions. Shannon en trop y of assignmen t distributions. F or a centre i with n i assigned emitters from a total p o ol of N emitters, the p osterior resp onsibilit y distribution has Shannon en tropy: H ( m i ) = − N X n =1 m i ( n ) log m i ( n ) where m i ( n ) is the probability that emitter n is assigned to cen tre i . In the ideal case where assignments are deterministic (eac h emitter belongs to exactly one centre), H ( m i ) = 0 for concentrated distributions and marks are maximally informativ e. As assignment uncertaint y increases - due to ov erlapping structures, measurement noise, or sparse lab elling - the entrop y increases to w ard its maximum v alue H max = log N . Consider an 8-fold symmetric structure with labelling efficiency ℓ ∈ [0 , 1] . The exp ected n umber of observ ed emitters p er structure is ¯ n = 8 ℓ . Under the V oidwalk er-Gibbs mo del, eac h observ ed emitter contributes probability mass to its parent cen tre’s mark. Lo w detection. With ¯ n ≈ 2 – 3 emitters p er structure: • Eac h cen tre’s mark is spread across only 2–3 emitters • The p osterior resp onsibility for each emitter is diluted by assignment uncertain ty • Mark entrop y approac hes H max as the distribution flattens High detection. With ¯ n ≈ 7 – 8 emitters p er structure: • Marks are concen trated on a w ell-defined set of emitters • P osterior resp onsibilities are sharply p eak ed • Mark entrop y is low, pro viding strong discriminative signal The similarity b etw een tw o cen tres is quantified via the Bhattac haryya co efficient: k B ( i, j ) = N X n =1 q m i ( n ) m j ( n ) F or tw o distributions to b e reliably distinguished as "similar" (same sup er-structure) vs. "dissimilar" (indep endent structures), their Bhattac haryya distances must separate into distinct p opulations. 37 As mark entrop y increases, all pairwise Bhattac haryya distances con v erge to ward a com- mon v alue. In the limit where all marks are uniform (maximum en tropy), k B ( i, j ) → 1 for all pairs, and no discrimination is p ossible. W e can formalise the minim um information required for sup er-structure detection. Let µ same and µ diff denote the mean Bhattacharyy a distances for true sup er-structure pairs and indep enden t centre pairs, respectively . Sup er-structure detection requires: µ same − µ diff σ po oled > t α where σ po oled is the p o oled standard deviation and t α is the critical threshold for signifi- cance level α . F rom Fig. 4 in the main text, this separation collapses b elow ℓ ≈ 0 . 6 for 8-fold structures. A t ℓ = 0 . 3 : • Mean emitters p er structure: ¯ n = 2 . 4 • Effectiv e bits of information p er mark: ≲ 2 bits • Separation ( µ same − µ diff ) /σ po oled ≈ 0 . 3 – 0 . 5 (indistinguishable from noise) The p erformance boundary observ ed in Fig. 4 is not an algorithmic artefact but reflects a fundamental information-theoretic constrain t: 1. Fixed information budget: Eac h lab elled emitter provides a finite amoun t of infor- mation ab out structural membership. At low lab elling, this budget is insufficien t to supp ort hierarc hical inference. 2. Comp ounding uncertaint y: Sup er-structure requires t wo levels of inference: (i) emitter-cen tre assignment, and (ii) centre to sup er-structure grouping. Uncertaint y comp ounds across lev els. 3. Pigeonhole principle: With k structures and n ≪ 8 k total emitters, the mark matrices are inherently lo w-rank. The n um b er of distinguishable mark patterns is b ounded by n ¯ n , which may b e smaller than the num b er of structure pairs requiring classification. 2.4 Structure-Dep enden t F ragility Under Incomplete Detection The performance b oundaries documented throughout this w ork - particularly the div ergent lab elling requirements for centre detection versus sup er-structure inference - reflect deep er structure-dep enden t vulnerabilities that merit brief discussion. Differen t molecular geometries degrade qualitatively differen tly under emitter loss. Con- sider tw o canonical cases: an 8-fold symmetric ring (such as Nup96) and a 3 × 3 grid lattice. 38 A t equiv alent detection probabilit y p ≈ 0 . 7 , the ring typically retains its characteristic top ol- ogy - the circular arrangement with cen tral void p ersists provided no gap exceeds a critical angular exten t. The grid, ho w ever, ma y b ecome unrecognisable dep ending on which emit- ters are lost: missing corner emitters preserve regularity , whereas losing the cen tral emitter destro ys the distance distribution that defines “grid-ness. ” This asymmetry can b e formalised through the concept of criticality distribution. Struc- tures with high rotational symmetry exhibit distributed criticalit y: all emitters con tribute equally , failure requires cumulativ e damage, and recognition probability v aries smo othly with p . Structures with unique top ological roles (central vertices, bridging elemen ts) ex- hibit concen trated criticalit y: a small subset of emitters carries disprop ortionate structural information, and recognition probability displays step-lik e dep endence on p . F or the 8-fold ring, topological recognition (preserv ation of the H 1 homological feature corresp onding to the central hole) fails only when three or more consecutiv e emitters are undetected, creating a gap exceeding the ring diameter. The probability of such catastrophic gaps remains lo w ( < 0 . 1 ) ev en at p = 0 . 55 . F or the 3 × 3 grid, the central emitter has b et w eenness cen tralit y four times that of edge emitters; its loss alone (probabilit y 1 − p ) substan tially degrades structural inference. These observ ations suggest that minim um detection thresholds are not universal but structure-sp ecific, and further suggest that symmetric ring-lik e arc hitectures tolerate de- tection probabilities approximately 30-40% lo w er than grid-like structures for equiv alen t recognition reliabilit y . This has practical implications for exp erimental design: the lab elling efficiency required to resolve a molecular architecture dep ends not only on emitter density but on the geometry of the target structure itself. A comprehensiv e mathematical treatmen t of structural fragilit y - dra wing on p ersistent homology , graph-theoretic centralit y measures, and spatial p oint pro cess theory - is b eyond the scop e of the presen t w ork but represents a natural extension of the framework developed here. 3 A dditional Figures: end-to-end The following figures displa y the end-to-end framew ork discussed in Sec. 1 across a n umber of randomly selected synthetic Nup datasets. 39 (a) (b) (c) (d) (e) (f ) Figure S12: 0.3 labelling with 0.0 clutter. (a) Lo calisations. (b) GR OUP A estimated emit- ters. (c) LGCP in tensity map. (d) V oidwalk er-discov ered significan tly empty space. (e) RJMCMC emitter-centre assignments. (f ) ASMBLR reconstruction. (a) (b) (c) (d) (e) (f ) Figure S13: 0.3 labelling with 0.1 clutter. (a) Lo calisations. (b) GR OUP A estimated emit- ters. (c) LGCP in tensity map. (d) V oidwalk er-discov ered significan tly empty space. (e) RJMCMC emitter-centre assignments. (f ) ASMBLR reconstruction. 40 (a) (b) (c) (d) (e) (f ) Figure S14: 0.6 labelling with 0.2 clutter. (a) Lo calisations. (b) GR OUP A estimated emit- ters. (c) LGCP in tensity map. (d) V oidwalk er-discov ered significan tly empty space. (e) RJMCMC emitter-centre assignments. (f ) ASMBLR reconstruction. (a) (b) (c) (d) (e) (f ) Figure S15: 0.9 labelling with 0.1 clutter. (a) Lo calisations. (b) GR OUP A estimated emit- ters. (c) LGCP in tensity map. (d) V oidwalk er-discov ered significan tly empty space. (e) RJMCMC emitter-centre assignments. (f ) ASMBLR reconstruction. 41 (a) (b) (c) (d) (e) (f ) Figure S16: 1.0 labelling with 0.3 clutter. (a) Lo calisations. (b) GR OUP A estimated emit- ters. (c) LGCP in tensity map. (d) V oidwalk er-discov ered significan tly empty space. (e) RJMCMC emitter-centre assignments. (f ) ASMBLR reconstruction. 42 References 1 Jac k P eyton. simflux. https://github.com/j- peyton/SimFlux , 2025. 2 W. K. Hastings. Monte carlo sampling metho ds using marko v c hains and their applications. Biometrika , 57(1):97–109, 1970. 3 Jelena Smiljanić, Christopher Blöc ker, Anton Holmgren, Daniel Edler, Magnus Neuman, and Martin Rosv all. Comm unity detection with the map equation and infomap: Theory and applications. arXiv pr eprint arXiv:2311.04036 , 2023. 4 M. Rosv all, D. Axelsson, and C. T. Bergstrom. The map equation. The Eur op e an Physic al Journal Sp e cial T opics , 178(1):13–23, No vem b er 2009. 5 Jelena Smiljanić, Daniel Edler, and Martin Rosv all. Mapping flo ws on sparse net works with missing links. Physic al R eview E , 102(1):012302, 2020. 6 Finn Lindgren, Hå v ard Rue, and Johan Lindström. An explicit link b etw een Gaussian fields and Gaussian Mark ov random fields: the sto chastic partial differen tial equation approac h. Journal of the R oyal Statistic al So ciety: Series B (Statistic al Metho dolo gy) , 73(4):423–498, 2011. _eprin t: h ttps://rss.onlinelibrary .wiley .com/doi/p df/10.1111/j.1467- 9868.2011.00777.x. 7 Jesp er Møller, Anne Randi Syversv een, and Rasm us Plenge W aagep etersen. Log Gaussian co x pro cesses. Sc andinavian Journal of Statistics , 25(3):451–482, 1998. 8 Stephen Boyd and Lieven V andenberghe. Convex Optimization . Cambridge Univ ersity Press, Cambridge, UK, 2004. 9 Janine Illian, Antti Pen ttinen, Helga Stoy an, and Dietric h Stoy an. Statistic al A nalysis and Mo del ling of Sp atial Point Patterns . John Wiley & Sons, Chic hester, UK, 2008. 10 Da vid Dereudre. In tro duction to the theory of Gibbs p oint pro cesses, April 2018. arXiv:1701.08105 [math]. 11 Lucien Birgé and Pascal Massart. Gaussian mo del selection. Journal of the Eur op e an Mathematic al So ciety , 3(3):203–268, Septem b er 2001. 12 P eter J Green. Rev ersible jump Marko v chain Mon te Carlo computation and Bay esian mo del determination. Biometrika , 82(4):711–732, December 1995. 13 Mohamadreza F azel, Michael J. W ester, Hanieh Mazlo om-F arsibaf, Marjolein B. M. Med- dens, Alexandra S. Eklund, Thomas Schlic h thaerle, Florian Sch ueder, Ralf Jungmann, and Keith A. Lidk e. Ba yesian Multiple Emitter Fitting using Rev ersible Jump Mark o v 43 Chain Mon te Carlo. Scientific R ep orts , 9(1):13791, Septem b er 2019. Publisher: Nature Publishing Group. 14 Mohamadreza F azel, Michael J. W ester, David J. Sc ho dt, Sebastian Restrep o Cruz, Se- bastian Strauss, Florian Sc hueder, Thomas Sc hlich thaerle, Jennifer M. Gillette, Diane S. Lidk e, Bernd Rieger, Ralf Jungmann, and Keith A. Lidke. High-precision estimation of emitter p ositions using Bay esian grouping of lo calizations. Natur e Communic ations , 13(1):7152, Nov ember 2022. Publisher: Nature Publishing Group. 15 Heikki Haario, Eero Saksman, and Johanna T amminen. An adaptive Metrop olis algorithm. Bernoul li , 7(2):223–242, April 2001. 16 Gareth O. Rob erts and Jeffrey S. Rosen thal. Optimal scaling for v arious Metrop olis- Hastings algorithms. Statistic al Scienc e , 16(4):351–367, 2001. 17 Y ehuda K oren. F actorization meets the neigh b orho o d: a m ultifaceted collab orative filter- ing mo del. In Pr o c e e dings of the 14th A CM SIGKDD international c onfer enc e on K now l- e dge disc overy and data mining , pages 426–434, 2008. 18 Jun S. Liu, F aming Liang, and Wing Hung W ong. The m ultiple-try metho d and lo cal optimization in metrop olis sampling. Journal of the A meric an Statistic al A sso ciation , 95(449):121–134, 2000. 19 Luis A. Santaló. Inte gr al Ge ometry and Ge ometric Pr ob ability . Cambridge Universit y Press, Cambridge, UK, 2nd edition, 2004. 20 F. C. Leone, L. S. Nelson, and R. B. Nottingham. The folded normal distribution. T e ch- nometrics , 3(4):543–550, 1961. 21 R. Suman th Iy er, Sarah R. Needham, Ioannis Galdadas, Benjamin M. Davis, Selene K. Rob erts, Rico C. H. Man, Laura C. Zanetti-Domingues, Da vid T. Clark e, Gilb ert O. F ruhwirth, Peter J. P ark er, Daniel J. Rolfe, F rancesco L. Gerv asio, and Marisa L. Martin- F ernandez. Drug-resistant EGFR mutations promote lung cancer by stabilizing interfaces in ligand-free kinase-activ e EGFR oligomers. Natur e Communic ations , 15(1):2130, Marc h 2024. 22 Gareth O. Rob erts, Andrew Gelman, and W alter R. Gilks. W eak conv ergence and optimal scaling of random w alk metrop olis algorithms. The A nnals of A pplie d Pr ob ability , 7(1):110– 120, 1997. 23 Harold W Kuhn. The hung arian metho d for the assignment problem. Naval R ese ar ch L o gistics Quarterly , 2(1-2):83–97, 1955.
Original Paper
Loading high-quality paper...
Comments & Academic Discussion
Loading comments...
Leave a Comment