A Marginal Reliability Impact Based Accreditation Framework for Capacity Markets
This paper presents a Marginal Reliability Impact (MRI) based resource accreditation framework for capacity market design. Under this framework, a resource is accredited based on its marginal impact on system reliability, thus aligning the resource a…
Authors: Feng Zhao, Tongxin Zheng, Dane Schiro
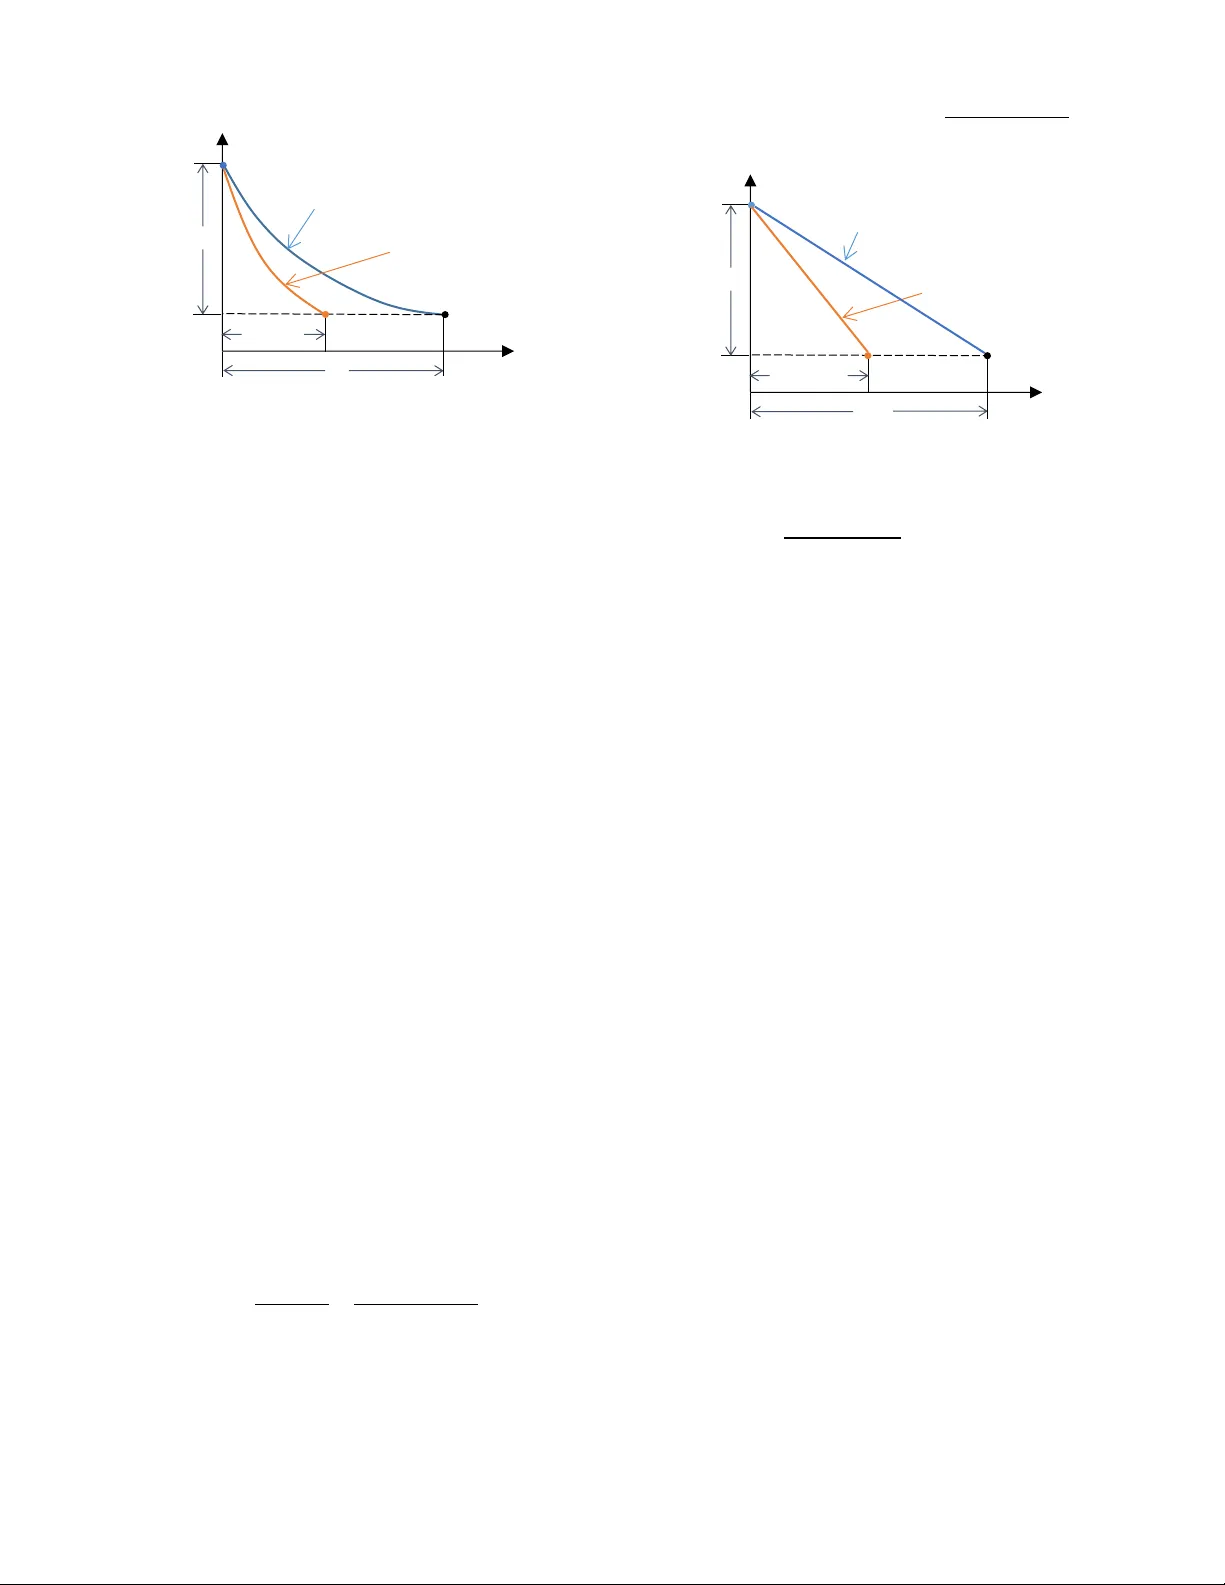
1 Ab stract — This paper presents a M arginal Reliability Impact (MRI) bas ed reso urce accreditatio n f ram ew ork for cap acity market desig n. Under this f ra mework, a resource is a ccredit ed bas ed on its ma rginal imp a ct o n sy stem relia bility , thus ali gning the r eso urce’s accreditation v alu e with it s reliab ility contribution. A key f e a ture o f the MRI-based accreditati o n is t hat t he a ccredited capa cities supplied by dif f erent reso urces to the ca p a city m a rket are substitutab le in r elia bility contribution , a desired f ea ture o f hom ogeneous p roducts . Mo re ov er, with M RI-bas ed ca pacity demand , sub stitutability betwee n supp l y an d dema n d fo r cap a city is a ls o achieved . As a re sult, a c a p a city market with t he MRI -based capa city pro duct can better cha racterize the underly ing resource adequa c y problem a nd lea d to more efficient market outcomes. Ind ex Terms — Adequacy, capacity accreditation, c ap acity market, dema nd curve, Effective Load C a rrying Ca p a bility (ELCC), Marg ina l Reliability Impa ct (MRI), M RI Ca pacity (MRIC) , MRI ho urs, Resource Adequa cy Assessment (RAA) . I. I NT RODU CT ION dequa cy is a key aspec t of pow er syst em reliabilit y. Acc ording to t he North A merica n Elec tric Reliabi li ty Corpora ti on (NERC), ade quacy is “ the abilit y of the e lectric it y system to s upply the aggr egate elec tric al de mand and ener gy re quirements of the end-use custom er s a t a ll times, taking int o ac count sche duled and r easona bly expec ted unsche dul ed outages of system e lements ” [1]. Curre ntly, several Regional Tra nsmi ssion Organiza tions (RTOs) i n the US , e.g., ISO New England, Mid-continent ISO (MISO) , Ne w York ISO (NYI SO) and PJM, use capa city m arke ts to addr ess t he ir re gion s’ ade quacy needs. Resourc e accre dit ation is an important par t of the c apac ity market de sign as it dicta tes t he c apac it y produc t and de termines the quantity tha t a re source c an of fer int o the marke t. Installed Capacity (ICAP) and its o utage ra te discounted Un forc ed Capac it y (UCAP) were often used as the ac credited ca pacity in regional ca pac it y marke ts [2]. While ICAP and UCA P have been adopted in conventional therma l domi nated sys tem s, extend ing the se conce pts t o intermittent and energy storage resour ces with t he grid transitionin g to clea n ener gy raises t he i ssue of s ubstitutabil ity betwe en diffe rent re source type s. Ther efore , in r ece nt ye ars many US regions have pursued c apa city accreditation re forms [3]- [10]. ISO-NE is curre ntly undergoing the transit ion from Qualifie d C apa city (QC) accreditation, an ICAP alike conc ept, The views expres se d in t his pape r are those of the authors and do not represent the vie ws of ISO New England. Feng Zhao (fzhao@iso-ne.com, corresponding a uthor), Tongxin Zheng (tzheng@iso- ne. com), Dane Schiro (dschiro@iso-ne. com) a nd Xiaochu Wang to a Mar ginal Reliability Impac t (MRI) ba sed ac c re dit ation fra mework [3] ; MI S O has cha nged from UCA P to a D irect Loss of Loa d (DLOL) method, which re sembles a margina l m ethod, for their capa city acc reditation [4] ; NYISO has impleme nt ed a margina l re liabili ty improve ment ba sed acc reditation to replac e UCAP f or non-ther m al re source s [5] ; a nd PJM has shifted fr om the UCAP acc reditation to an a vera ge Effective L oad Carrying Capability (ELCC) acc reditation and m ore r ece ntly , a mar ginal ELCC m eth od [6 ]. Com par ed to ICA P and UCAP, t hese new ac creditations are intended to more acc urately ref l e ct a re source ’s contribution t o s ys tem adequacy or reliability 1 . A share d feature of these m ethods is that a resourc e’s ac creditation value is aff ecte d not only by its own cha rac te ristics but by other re sources a s well, a r esult of syst em re li ability not being an add it ive ly s epa rable func ti on of individual resour ces. Such i nterde pendenc e allows these ne w ac creditation methods to ref lect the diver sit y impact of the re source mix , e.g., adding re source s of the same c haracter ist ics tends to re duce the ir marginal reliabi li ty benef it s. This pape r in troduces the M RI-based ac cre dit ation fra mework that has serve d as a founda tion for ISO- NE ’s ongoing capac ity marke t re form [7]-[ 8]. St ar ti ng with the desire d substi tu tability of a hom o geneous c apac it y produc t, we first der ive the gene ral idea of M RI-based acc reditation. By choosing Expected Unser ved Ener gy (EUE) as t he ade quacy metric and per fe ct capa city as the r efe r ence , we then d efine MRI Capac it y (MRIC) as a resourc e’s accredited ca pac i ty . I n conjunction with capa city market design, var ious aspec ts of the MRI-base d acc reditation fra mework, includin g c onstruction of MRI C demand curves, calculat ion o f MRI for di ff ere nt re sourc e types, int erpretat ions of MRI and MRIC, i ts pr o perties, and its alignment with the adequac y problem , ar e then di scussed. Furthermore , we compare the MR I-base d ac cr editation to ICAP, UCAP, ave rage and ma rginal ELCC approa ches [11]- [12]. T he main contribut ions of t his paper are : (i) introducing a rigorous MRI-ba sed a ccr editation fr amewor k for capac ity marke t design; (ii) analyz ing t he interpre tations and proper ti es of the MRI- based acc reditation; and (ii i) provid ing a compre hensive compa rison of diffe rent ac creditation m ethods. The rest of the paper is organize d a s follows. Sec tion II provides details of the M R I-ba sed ac cre dit ation fra mework . Section III compare s MRI-based accreditation wit h other ac creditation methods. S ec ti o n IV summar izes numerica l (xiwang@iso -ne.c om) are with ISO New England I nc ., H olyoke, MA 01040 USA. 1 The two terms “ a dequac y” and “ reliability” are used interchangeably i n this pa per. A Mar gina l Relia bilit y Im p act Based Accre ditati on Framew ork for Ca paci ty M ar ket s Feng Zhao, Se nior M ember , IEE E , To ngxin Z heng, F e l l ow , IEE E , D ane S chiro , Mem ber, I EEE , Xia o ch u Wa ng , M ember, IEEE A 2 testing results. Sec tion V conclude s the paper . II. T HE M RI- BASED A CCR EDIT A TION F RA MEWORK FOR C APACITY M A RKETS The key i dea of MR I-base d accreditation is t o align a re source’ s accre dit ed capacity, i.e., the quantit y the resourc e ca n offer into a capa city marke t, with its c ontribution t o system ade quacy. The M RI concept plays a c entra l role in t his alignment. The follow ing Sectio n I I.A starts w it h t he de sired substitutabili ty f eature for a homogene ous capa city product to deduc e the MRI and MR I Capacity (MR IC) conce pts . S ection II.B then der ives t he MR IC de mand curve s from our previously deve loped capa city dema nd cur v es [13]- [1 5]. Se ction II.C pre sents the calc ulation of MRI for diff ere nt r esourc e types. Section II.D explore s the interpre tations of M RI and MR IC . Section II.E exa mines the properties o f MR I-ba sed ac creditation. La stl y, Section I I.F provides insigh t s in to the potential marke t ef ficienc y gain by aligni ng resour ces’ ac creditation values with their contribut ions to a dequac y. II.A MRI-base d Capacity Accre ditat ion In ca pacity marke t de si gn, a homogeneous capac ity produc t is hig hly de sirable. H omogeneity i mpl ies substitut ability , i.e., ea ch unit of acc r edited capa city, regardless of its sourc e, provides t he same bene fit to sy stem a dequac y or reliability, or mathematic ally, (1) wher e is an adequac y risk metric 2 , is resour ce i ’ s acc redited capac it y or market capacity , and is a positive constant. The negative si gn i ndicates re duced adequac y risk with the i ncr ease of ca pacity. Note that i s a multi-var iate func ti on of all re sourc es’ capa cities s ince syst em ade quacy i s af fec t ed by all re source s in the system. Eq. (1) indicate s that diffe rent re source s ’ accre dited capacities ha ve the same margina l re li abili ty contribu t ion . Ne xt, we der ive t he mathematic al expre ssi on of that satisfies ( 1). Let be a pa rame ter repr es enting r esourc e i ’s own si ze , e .g., namepla te ca pa city, opera ti ng ca pabilit y, etc. Here aft er w e use native capacity or physical capacity for as it ref lects resourc e i ’s own physical char acter ist ics. The native capa citi es of diffe rent re sources may not be substitu table, e.g., one MW namepla te ca pacity of a nuclear resource could have a very diffe rent impact than t hat of a solar re source on system re li ability. To have an accr editation scheme that sati sfies the substitutabili ty prope rty (1), resourc e i ’s native c apac ity is adjusted by a fac tor to de fine its a ccr edited ca p acity , i.e., (2) Substitut i ng (2) into (1 ), we ha ve , or 2 The adequac y metric is assumed a differentiable function in this pa per for the c onvenience of nota tion in de riving the M RI c oncept. In rea lity, the adequac y function may not be everywhere differentiable. (3) Substitut i ng (3) into (2), w e obtain the following for m of ac credited ca pacity that is substitu table in terms of mar ginal re li ability contrib ution: (4) Eq. (4) s hows that resourc e i 's acc redited c apac it y , in MW, is the resour ce’ s native ca pacity , in MW, adjusted b y its margina l reliability impact , and normalize d by a constant that has t he same unit as t he marginal reliabi lit y impact (in order to yield the acc redited ca pacity in MW) . Note t hat the hi gher a resourc e’s m ar ginal reliabili ty i mpact, t he higher its a ccr editation value. This way, a resource’s accredited ca pacity ac counts for its Ma rginal R eliab i lity Impac t (MRI) and is thus termed MRI Capa city (MRIC). With subst i tut abil ity, MRIC can be treate d as a homogene ous capacity product and price d uniformly in capac ity ma rket, all owing more marke t transpa ren cy and e f ficien cy . B elow we discuss the choices of and in (4 ). In [16] , NERC defines severa l system adequac y metr ics suc h as Loss of Load Expectation (LO LE), Loss of Loa d P robabil ity (LOLP), and Expe cted Unse rved Energy ( EUE). Among them, the E UE metric c apture s bot h fre quency a nd magnitude of Loss of Loa d (LOL ) events a nd yi elds intuitive i nterpr etation s for MRI and MRIC ( disc ussed in S ec t ion II.D). It is there fore selecte d f or the re li ability m etric . With EUE, in MWh pe r planning period , re source i ’ s MRI, in hours pe r planning period , is de fined as (5) MRI denotes a resourc e’s total marginal reliability impac t . To ca pture such total impact for cer tain resourc e s with mul tiple ca pacity-drive n parameters, the de rivative in (5) should be viewe d as a t otal de rivative to disti ngu ish f rom the pa rtial der ivative re prese ntation of MRI co m ponents in later Section II.C. The resourc e MRI is evalua ted at a pa rticular point on the multi -var iate EUE func ti on, i.e., the “ base case ” that summarize s all settings of load and resour ces neede d for eva luating EUE a nd it s derivative s. The base c ase is often set to the planning cr iteria suc h as “ 1-day - in -10-y ear s” of LOLE. The c onstant in (4) has the same uni t as MR I a nd thus ca n be vi ewe d as the ref erenc e MRI for all resour c es. F ollowing the use of pe rfe ct c apa city i n conventional Effe ctive Load Carrying Capability (EL CC ) calc ulations [17], we adopt perf ect ca pacity ’s MR I a s t he c onstant in (4), i.e., (6) wher e perfec t capacity repr esents a r esource that is alwa ys ava il able a t it s full ca pacity. With the EUE m etric a nd the perf ect capac ity re f er en ce, re source i 's ac credited ca pa city in (4), denote d as , is 3 (7 ) The ratio of MRIs in (7 ) de fines the relati ve MRI ( rMRI) of re source i with re spect to perf ect capac ity, i .e., (8) Note that r MR I is unitle ss and serve s as a c ommon re ference for all re sources ’ MRIs . Then re source i ’ s MR IC can also be e xpressed a s (9) Name ly, t he resourc e ’s rMRI conver ts i ts native capa city to MRIC. In the followi ng, rMRI for capa city demand w ill be def ined to c onvert the nati ve capa city demand t o MRIC demand and de rive the MRIC demand c urves. I I. B MRI C Demand Curves With M RI-base d capa city accreditation, MRIC bec omes t he ca pacity marke t product, i.e., both offe red capacities and ca pacity demand shoul d be expr essed in MR I C quant it ies . Below we derive t he M RI C de mand curve s f rom our previo usly deve loped native ca pac it y demand c urves. A capa city demand curve refle cts the margina l benef it s of ca pacity to system adequa cy at diffe rent l eve ls of the t otal ac quired ca pacity . In our previous w ork [13 ] tha t ha s been implemented in I SO- NE’s ca pacity marke t, the sys tem ca pacity demand curve e xpressed in Qua li fied Capa city (QC), a native ca pacity, is define d as , (10) wher e Value of Lost Load (VOLL) is a c onstant c alcula ted from the long-term m ar ket equilibrium condition, repr esents the system demand for native ca pacity, i.e., , (11) and r efle cts the margina l re liability impa ct of havi ng one extra MW of c apa city in the s ystem. T o e valuate , one needs to know the composition of the extra MW . In our native c apac it y demand curve construc ti on, is composed of t he base case resour ce mi x 3 , and repr esents proportiona l cha nges to the resour ces in the mi x, i.e., (1 2) As a r esult , can b e viewed a s a directiona l derivative w it h the “ direc ti on ” being determined by t he vector of native ca pacities composing the base case . With MRIC being the marke t produc t, capac ity demand nee ds to be me asured in MRIC inst ea d of native c apac it y . Foll ow ing t he MRI-base d resourc e accreditation, one can simil arly de fine the M RI for system c apac it y demand as 3 A “res ource mix” refers to a set of res ource s characterized by their s hares of the total native capa city, i . e., a resource mix of N resources is represe nted by the ir normalized native capa cities ve ctor . , (1 3) wher e the directional deriva ti ve is eva luated at the same base ca se in resource MRI def ini tion (5). The system dema nd rMRI ca n be def ined as (1 4) and the MRIC de mand can be expre ssed as . (1 5) With (13)- (1 5), it ca n be shown in a simil ar way as in S ec t ion II.A that one MW of MRIC de mand has the s ame reliability bene fit as one MW per fec t capacity. Thus, the substi tut ab ili ty betwee n MRI-base d capacity supply and de mand quantities is ac hieved. Eq. (1 5) also indicates that the native capacity demand ca n be conve rted to the system M R IC dema nd by the adjustment fa ctor , which c an b e calculated f rom re source r MRIs as follows. With the vector of native ca pacities in the base ca se and its L1 norm in (11), the directional derivative i n (1 3) ca n be expressed a s , (1 6) wher e the deriva ti ves on both si des are taken at t he s ame base ca se, allowing the substitut ion of (5) a nd (13) into (16) t o yield . (1 7) By dividing both sides of (1 7) with the s ame refere nce of and substituting with (11), we have . (1 8) Name ly, t he rMRI of system ca pacity demand is the native ca pacity weighted ave rage rMRI of the base case resourc e mix . This result is consistent with the assu m ption (12) i n na tive ca pacity de mand c urve construction that one extra MW ca pacity dema nd i s made of the base c ase r esource mix. The syst em MRIC demand cur ve repr esents the margina l reliability be nefit of system MRIC c apac it y, i.e., . (1 9) With the l inea r re lationshi p (15) betwee n and , the a bove MRIC demand curve (19) c an be derived from the native c apac ity demand cur ve (10) a s follows: 4 . (20) The above (20 ) re veals t hat the sys tem MR IC demand curve can be obt ained by scaling the coor dinates of the s y stem native ca pacity dema nd curve (10) usi n g the sys t em demand rMRI. Similarly, a zonal M RIC demand curve can b e transfor med from the corr esponding zonal native capa city demand cur ve using the zonal demand r MR I (i.e ., t he native capa city w eighted ave rage rMRI of resources modeled in the zone) . In summar y, the MR IC demand curves ca n be transfor m ed from our pre vious ly develope d nat i ve capac ity de mand curve s using t he cor responding system or zona l demand rM RI. I I. C Resource MRI Calculations Depending on resourc e models, the c alculation of resourc e MRI may take di ffe rent f orms. In this se ction, the formula for ca lculating MRIs of therm al , e nergy- li mited , interm i ttent and group resour ces a re pre s ented. II.C.1 Calcula ting MRI f or Thermal Reso urces A t her mal r esourc e is t ypica ll y modeled in RAA a s a Markov proc ess [18]- [19]. T he capac ity associate d with ea ch Mar kov state is propor tional to the re source ’s native c apac it y. The MRI of t herma l r esourc e i is then c alcula ted by measuring the s ystem EUE change with respect to a small change to i ts native ca pa city , or equivalently proportional cha nges to the re source’ s ca pacities i n all states, i.e., , where re presents t he resourc e’s capacity l eve l a ssociated with state s . Then the MRI of thermal re source i is re prese nted by (21) II.C.2 Calcula ting MRI f or Energy Limi ted Resource s An ener gy li mited resour ce ( ELR) i s typically modeled w it h limited ener gy for supporting i ts capa city. C onseque ntly, t he ELR’s M RI is af fec ted by both i t s capa city and ene rgy li m it s . Suppose that an ene rgy-limit ed re source i is modeled with its native capac ity of MW (e.g., maximum dis patching power) and a n energy l imit of MWh. Then t he m argina l reliability impacts of the re source’s capa city and energy li mit s , re spectively, ca n be def ined as: . (22) The above and , re spectively, can b e viewed as capac it y and e nergy c omponents of the ELR’s MRI . To reflec t the total marginal reliabil ity i m pac t of both c apac ity a nd e nergy limits, the ELR’ s capa city and ene rgy lim it are pertur bed proportiona l ly, i.e ., , in calc ulating its MRI, i.e ., , (23) wher e “ d ” repr es ents the to tal derivative of resourc e MRI and “ ” repre sents the pa rtial deriva ti ve for MR I c omponents . Note that for a resour ce i with unconstrained energy, and will only r eflec t the marginal impac t of capa city . Substitut i ng (22) into (23), w e have . (24) As will be d iscussed in later Sec ti on II.D, the t er m “ ” ca n be int er preted as resour ce i ’s tot al contribut ion to a dequac y. Then the a bove (24 ) ind icates that a stora ge r esourc e’s contribution is m ade of its ca pacity and e nergy c ontributions. II.C.3 Calcula ting MRI for Inte rmitt ent Reso urces An i ntermit tent resourc e such as wi nd and s olar has varying outputs ove r time and is often m odeled as hourly profiles . Consequently, t he hour ly output s of the intermittent r esource deter mine its reliabi li ty contribution. Suppose d t hat a n intermittent resourc e i has an hourly output profile , wher e is its MW o ut put in hour t of the pla nning horiz on of T hour s. D efine t he m ar ginal r eliabi lit y impact of t he resourc e’s output in hour t as . (25) The i ntermittent resour ce’ s MR I ref le cts the system EUE cha nge with respect to a sm all cha nge to its native capacity , or equivalently proportional cha nges to the resource’ s output in all hours, i.e., . Then we have . (2 6) Substitut i ng (25) into (26), w e have (2 7) With the MRI and MRIC i nterpr etations to be disc usse d in l ater Section II.D , t he above (2 7) indicate s t hat an intermittent re source ’s r eliability contrib uti on is the sum of i t s c ontributions in individual hour s . II.C.4 Calcula ting MRI for a Re source Group There are si tuations t hat may re quire calc ulating the MR I for a group of resourc es, e.g., the sys tem capa city de mand MRI in (13), or a cla ss MR I for a technology type. C onsi der a group of re sources with ea ch member resourc e i ’s nat ive capa city being and its mar ginal reliabili ty impac t being . De note the group’s native capa city as to re present the native ca pacity of the group. F o ll owing the MRI definition (5), th e group’s mar ginal reliabilit y im pac t ca n be def ined as (28) 5 The above group ’s MRI re flects t he m ar ginal im pac t of the group size . Varying i s equivale nt t o proportional var iations t o member resour ces ’ native c apac iti es, i .e., . Then we have (2 9) With individua l resourc e MRIs define d i n (5), t he above (29 ) ca n be re pr esente d as (30) With the MRI and MRIC i nterpr etations to be disc usse d in l ater Section II.D , the a bove (30 ) indicates that the group’s re li abil it y contribution i s the sum of contribution s from indi vidual re sources in the gr oup. I I. D MRI and MRIC Interpre tat ions B elow we di scuss t he interpre tation s of a resour ce’ s MRI and MRIC by int roduc ing t he concept of MRI hours first. In proba bil isti c hourly RAA simu lations, each simulated scena rio of the planning period is composed of hour ly load and eac h re source’ s hourly ava ilable ca pac it y. The capa city margin f or ea ch hour of t he scenar io can be calc ulated by compar ing t he load a nd total ava il able capa city. The Unse rved Energy ( UE ) under a scena rio is the tota l shortage across al l t he hours w ith nega ti ve capa city m argins or L oss of Load (LOL), and EUE is the proba bil ity-weighted a vera ge UE a cross all sce narios. A re source MRI in (5) me asure s how a small increa s e to the re source’ s size , denote d by its native capa city, aff ects its ava il able capacity in e ach hour of a sim ulated scenar io and thus the system E UE . Depe nding on t he hour’s ca pacity margin, small change s t o t he resourc e’s ava ilable capacity in that hour may or m ay not aff ect EUE. For an hour wi th a positive margin, small change t o available capa city wil l not affe ct EUE. For an hour w it h ne gative mar gin, additional ava ilable c ap acity w i ll alwa ys reduce the LOL of the h our by the same a mount. For an hour wit h ze ro margin, additional ava il able capacity may re du ce the UE in t he presenc e of ELRs , e.g., t he ex tra ava ilable ca pacity for the hour can b e shif t ed f rom that hour to the subsequent LOL hours to reduce the UE of the scenario. All the hours affe cting the EUE and t hus resour ce MRIs are termed “ M RI hours, ” which inc lude all LO L hou rs and c ertain zero- margin hour s 4 . Note that MRI hour s are sc enario de pendent. With MR I hours, a sma ll ∆ MW incr ease to resour ce i ’s size could result i n extra ava il able ca pac it y (and thus UE re duction) for those MRI hours w h en the resour ce i s ava il able . Ther efor e, can be i nterprete d as t he expec t ed number of MRI hours w hen resource i’s capacity is available. In other words, measur es the re source ’s ca pa city per formanc e during M RI hours. As a spe cial ca se, per fec t capac ity is always fully ava il able, and thus represe nts the expe cted number of MRI hour s . Cons eque ntl y, resource i’s r MRI represe nts its expec ted availabil it y durin g MRI hours . 4 I dentifying zero-margin MRI hours is not a trivial tas k. One may numerically examine each zero-marg in hour of every s imulated sc enario by Since resourc e i ’s M RI r eprese nts it s expe cted num ber of MRI hours with available ca pacity , t hen represe nts r esourc e i’s ex pe cted e nergy output during the MRI hours. Cons eque ntly, , i.e., , can be inter preted a s resource i ’s expected e nerg y c ont ribution during an MR I hour . Note t hat the above MR IC i nterpr etation of e nergy contribution during the common set of MRI hour s impli es MRIC subst itutability sinc e ene rgy is subst i tut able. I I. E Properties of MRI -based Ac creditation B esides the substitu tability proper ty in Section II .A, t he MRI-base d fra mework has severa l other proper ties including additivity, homogene it y, co m mon M R I hours, resourc e mix depe ndency, de mand b enef it s prese rv ation, and refer en ce MR I independe nce . These prope rties are discusse d as follows. Additivity and homoge neity . Additivity me ans the accr editation value of a group of resour ces is equal to the sum of accre dit ation values of individua l resourc es in the group, and homogeneity means the a cc r editation va lue of n identical resour ces i s n times the ac cre dit ation value of an indi vidual one. Based on the group MRI definition (28), di viding (30) by the re fer ence yields the additivity prope rty. Moreove r, applying additiv ity t o n identica l group resour c es would lead to homogeneity, and thus homoge neity also holds f or the M RI-based a ccreditation. Common MRI hours . B ased on t he MRI and MRIC interpr etations i n Section II .D, the MRI hours af fec t ing syst em ade quacy a re used t o measur e re sources’ a cc reditation values . Name ly, t he MRI a ccreditation employs a common set of MRI hours for evaluating all resourc e MR Is. The use of com mon MRI hour s for all re sources c ontrasts with the aver age ac creditation scheme as w il l be di scussed in later S ec ti o n III . Resourc e mix depende ncy . MRI is defined as a derivative of EUE. As sys t em EUE is a ffe cted by resour ce m ix, so is the MR I and thus the MRI C of any re source . Namely, a r esourc e ’s MRI ac creditation value depe nds no t only on it s own physical cha rac te ristics but on the resourc e mix as well. S uch re source mix depe ndency allows t he a ccr editation value to ca pture the diversity bene fits of resourc e m ix, e.g., adding capacities with simil ar char acter ist ics tend s t o reduc e their mar ginal reliabil it y bene fit and conse quent acc r editation values. Dem and benefits preserv ati on. As di scussed in S ec ti on II.B, ca pacity demand c urves a re a dmi nistratively construc ted to re flect the marginal reliability bene fits of ca pacity under the base c as e re sour ce m ix a ssumpti on. The reliability benef it s of a given si ze and mix of ph ysical resourc es, repr esente d by the ar ea under a dema nd curve, shoul d not depend on how re sources are a ccredited. Such demand benefit pre serva ti on is maintained betwe en the capa city demand curve i n native ca pacity and the corresponding MRIC dema nd curve, sinc e the latter is construc ted by scaling the t wo coordinates of the former with rec iproca l factors ba sed on (20). Refe rence MRI indepe ndence . The MRI-ba sed accre dit ation uses pe rfec t capacity MRI as the r eferenc e to define e ac h ass essing the EUE impact of adding a small capac ity to that hour, which could be computationally dema nding due to the large number o f simulation scenarios. 6 re source’ s rMRI. From the de rivation of t he gener al ac creditation f ormula (5), however , the r efe rence ca n be an arbitrar y constant while still sati sfying subst itutability. With a di ffe rent ref er ence (e .g., a non -per f ec t re source MRI), each re source’ s rMRI and thus MRIC will be sca led by a fac tor of the two re fer ence s, i.e., . Consequently, eac h resour ce’s offer curve will have it s MRIC quantity axis sca led by and t he offe r price scale d by , pre serving ea ch re source’ s total capa city cost under the two diffe ren t refere nc es. And the dema nd c urves wil l ha ve its t otal MRIC quant ity axis scaled by and t he marginal benef it sca led by . W i th the demand c urves a nd eac h supply cur ve sca led by the same factor , the a u ction clea ring will yield the same s et of opt imal physical re source s and the same capacity payment for each r esourc e, although the cleared resource quantities wil l be scale d by and the clea ring prices will be sca led by . In sum, the opt imal resour ce mix and re source payments a re indepe ndent of the c hoice of r efe renc e MRI. Th is re ference-indepe ndent property of M RI-based ac cre ditation indicates the im portanc e of re lative accre dit ation values i nstead of a bsol ute ones f or re source s. I I. F Mark et Effi cienc y Unde r MRI-base d Accre dit ation This s ec ti on provides insight into how MRI- based ac creditation, a s c ompared to na ti ve capa city, could better align a c apacity m ar ket with system adequa cy and thus allow more ef ficient mar ket outcomes. Prior to the rec ent capa city accreditation re forms, most of the RTOs equipped wit h a capac ity market procur e an adequate amount of native capac ity, i.e ., ca pacity requir ement, to meet the re gion’s adequa cy tar get. This is repr esented by the supply- demand c onstraint in capa city marke t, e.g., (31) wher e is the native ca pacity of re sour ce i , and is the ca pacity re quirement which re prese nts the size of a given re source m ix that, t ogethe r wi th a given load, would mee t t he ade quacy criteria suc h as 0.1 days/yea r LOLE. The calculation of re quires load and resour c e mix assumptions, which are ca ptured in the b ase case . Note that capa city demand curve is an extension of the capa city require ment by allowin g di ffe rent levels that corr espond to dif ferent syst em adequa cy levels. C onstraint (31) does not distinguish d iffer ent resour c es’ native capa cities in meeting t he capa city demand. R ather , it trea ts system ade quacy as a single-va riable l inear function of the tot al capac ity . However , system adequa cy i s a multi var iate nonlinea r func tion of individ ual resourc es (re prese nted by the re sourc e mix vector a nd its s ize ). Thus, the linear capa city require ment constraint (31) c an be vie wed as a n appr oxim ation to the actua l a dequac y ne ed. This is ill us trated in F i g. 1 w ith a s im ple mix of two r esource s. In the figure, the ac tual a dequa cy level curve represents all the pairs that yield the same adequac y lev el as the at- criter ia bas e ca s e . The cur ve is in gene r al nonlinear 5 and tends to be flatter (or steeper) 5 The actual a dequac y leve l c urve ca n be l inea r when both resources are perfectly 1:1 s ubs titutable, e. g., both are pe rfect capa city. as (or ) increa ses s ince it would require more capac ity from an abunda nt r esource to r eplac e the ot her resourc e t o maintain the same sys tem ade quacy l eve l. The native capacity marke t im pl ied level cur ve re prese nts the pairs that yield t he sa me total capa city requir ement in the marke t constra int (31). The curve is line ar with the slope of -1, indicating the capa city m ar ket’s approximation of system ade quacy n eed with the total capacity r equireme nt. The t wo cur ves repr esent the same ade quacy l eve l a s the base case, which corr esponds to their inter section poi nt . The di ffe renc e betwe en the t wo cur ves reflec ts the approximation er ror of ca pacity re quirement to the ac tual ade quacy need. Fig. 1 . Le v el curves o f adequ acy fu n ction and its ap p ro x imation With the MR I-ba sed ca pacity product, bot h capa city suppl y and demand are denominated in MR IC. Th us, the native ca pacity re quirement constra int (31) is repla ced by (32) wher e and , respec tively, are i ndividual re source MRICs a nd the sys tem M R IC re quirement. To compar e the above MRIC re qui re ment (32) with the native ca pacity requir ement (31), t he MRICs are substi tuted by (9) and (1 5) to yield (3 3) Constraint (33) attac hes r MR Is as weights to ind ivi dual re sources i n meeting the ca pacity re quirement. Na mely , the same amount of na tive c apac ity f rom dif fere nt r esourc es ar e no t trea ted as substit utable. The implied a dequac y level cur ve for the above two-re source example is depicte d in F ig.2 . In the figure , the a ctual adequac y level curve remains uncha nged f rom Fig.1 as i t refle cts the physica l char acte risti cs of the system . The M RIC market i mpli ed curve r epre sents the pairs that yi eld t he same tot al MR I C require ment in the marke t constraint (32). The cur ve is linea r and inter sect s with the a ctual a dequac y leve l c urve a t the point corr esponding to the base case when re sour ce r MR Is and dema nd are ca lculated fr om t he sa me base case. The sl ope of t he c urve is deter mined by the ve ctor , which re presents t he gra dient of the actual adequacy level curve at the b ase case point when EUE is used as the adequac y me asure 6 . Thus, the 6 Note that the us e of EUE to characterize s yste m adequac y will not contradict the ade quacy criteria de fined on a differ ent adequa cy mea s ure, e. g ., Actual adequ acy level curve Native capacit y m arke t im plied level curve At -criteria base case 45 7 ade quacy level curve impli ed by the MR IC requireme nt constra int (33) ca n be viewed a s a linear approximation to t he nonlinear adequa cy level c urve. By incorpora ti ng the gra dient informa t ion of adequac y function at the base case, the MRI- induced li nea r approximat i on is tangent to the actual non linear ade quacy curve and thus is more accurate than the one under native c apac ity near the base case point . Assu me that the optimal solu tion unde r the actua l nonlinea r adequa cy func ti on is not far f rom the base case point , which likely holds in prac ti ce since the base c ase i s often c onstructed fr om the set of e xi sting or rece ntly clea r ed re sources and a drasti c cha nge from the set is typic ally c ostly and t hus unl i kely to be optimal. Then, a more ac cura te approximation nea r the base case would likely lead to a market solution closer to t he optima l one. Fig. 2 . Level curv es of adeq u ac y fun cti o n a nd its MRIC approximation The a bove ana lysis shows that t he MRI C re qui re ment (32) provides a more ac cu ra te appr oxim ation to the nonlinear ade quacy function than the native c apac ity r equire ment (31). This is re flecte d i n more accur ate repre sentations of individual re sources’ reliability contribut ions (i.e., a ccre dited ca pac i ties) and a m ore accura te mode l of the r eliability function (i.e., EUE), thus a ll owing more ef ficient ca pacity mar ket outcomes. III . C OMPARISON WITH O TH ER A CC REDITATION M ETHODS In thi s s ec ti on, existing acc reditation methods of ICAP/UCAP (Sec ti on III .A), Aver age ELCC (Section III.B) and Margina l ELCC (Sec t ion III.C) are int roduc ed and compar ed with the MRI based a ccr editation. III .A ICAP/UCAP Prior to the rec ent wa ve of capac ity accr editation ref orm, ISO/RTOs often define a resourc e’s a ccr editation based on it s ICAP or U C AP. For example, ISO-NE and IESO use the I CAP conc ept for t heir capa city ac creditations w hile P J M a nd NYISO use t he UC AP conce pt. The main dif fere nce be twe en ICAP and UCAP is: T he ICAP of a re source does not reflec t its ou tage informa t ion, while t he UCAP of the resourc e applies an outa ge- ra te-base d dis count to the I CAP . Both ICA P and U CAP of a resourc e ar e de termined only by the resourc e’s o wn characte ristics . As a result, ICAP or U CAP does not provide an a ccur ate charac te riza t ion of a re sour ce’ s the 1 - in -10 LOLE criteria can be use d to cons truct the b a se case , while E UE can be use d to derive the level curves and their gradients. 7 T he word “ average ” is used to distinguish the method from the marginal EL CC me thod intr oduced in Section III.C. re li ability contribut ion and is gene rally no t substi tutabl e betwe en diffe rent resources, since system re li ab i lity m etric s such a s LOLE and EU E are in separ able functions in individual re sources a nd one resource ’s r eliability contribu tion is aff ected by other r esourc es. In contrast, the MRIC of a resourc e is determined b y not onl y the re source ’s own cha rac teristics, but load and other re source s as well. S uch resource mi x depe ndence allows diversity bene fits t o be r eflec ted in resourc e ac creditation values. III. B Ave rage ELC C The Av erage Effective Loa d C ar rying Capability 7 (AEL C C ) method (c onventionall y known as ELCC method) a ccr edits a re source by the amount of perfec t capacity that can replace the re source f or the same level of system reliabil ity. LOLE is typically adopted as the reliabilit y me tric in ELCC ca lculations. The A ELCC method can a lso be a ppli ed t o a c lass of re sources by re placing the entire class with an equiva lent a mount of per fec t c apac it y. The A ELCC method is i llust ra t ed i n Fig. 3 for a resour ce (or class) i wit h a native ca pa city of MW. The di ffe r enc e in system adequa cy levels with and wi thout the re source is re presente d by ∆ LOLE. In t he figure, a perf ect capac ity of MW is assumed to replac e the resour ce of MW to yield the same system LOLE im pac t. Note that the LOLE cur ves are shown as dec r easing func ti ons of capa city as additional capa city would i mprove system ade quacy (i.e ., re ducing LOLE). Als o, the steepne ss of the curve s re duces with the incr ease of ca pa city, ref lecting the gene rally decr e asing margina l re li ability be nefit of additional ca pacity. The A ELCC method ac cre dit s resour ce i at MW, i.e., . (34) For t he convenie nce of comparing differ ent accreditation methods, we d efine a resource’ s C ontribution F ac tor (CF ) as the ra ti o of its acc redited c apac it y to its native capa city. Then for AELCC, resour ce i 's CF c an be re prese nted as (35) wher e and . The above f ormula indicates that to yield the sa me reliabili ty impac t of would re qui re MW of re source i or MW of per fect capac ity. T wo R AA c ases a re involved i n the AELCC evaluation for resourc e i : One with r esourc e i remove d from the base ca se (re pres ente d by point A in F ig . 3); and the other c ase w it h the re plac ement pe rfect ca pa city (point B ). The forme r case evaluates the LOLE i mpact of r esourc e i and the latter case deter mi nes t he replac ement perfe ct ca pacity value (i.e., ) that yields t he sa me LOLE i mpact 8 . 8 T he ca lculation of the replac ement perfect c apacity value often involves multiple RAA runs and can be computationally demanding, in contras t to a single RAA run required for MR I calcula tion. Actual adequ acy level curve MRIC market im plied cu rve At -crit e ria b ase case Native capacit y m ark et impl ied lev el curve 45 8 Fig.3. I llu stration of AEL C C method . For eac h resource, the AELCC method find s a perfe ct ca pacity value that yields t he same LOLE impac t. As LOLE is af fec t ed by resour ce mix, the AELC C value of a resourc e is depe ndent on the resource mix . Moreove r, the RAA c ases involved in r esourc e i ’s AELCC ca lculation and those invol ved in other re sourc es’ c alculations have di ffere nt resource mixes, i.e., the R AA cases A and B in F ig.3 are resourc e de pendent, leading t o d i ff ere nt LOL eve nts patterns for diffe rent resour ces’ AELCC c alculations . The refor e, unl ike the MRI-base d ac creditation cha rac teri zed by c ommon M RI hours, t he AEL C C is not evalua t ed on a c ommon set of hou rs for di ffe rent re sources, impl ying that ac cre dit ed AELCC capa cities of diffe rent re sour ces ar e not subst itutable in terms of reliab ili ty contribution . Also, with non li nea r LOLE functions, additi vity and homoge neity do not hold w i th t he AEL C C ac cre dit ation, i.e., the AELCC value of a r esource group is not the sum of AELCC values of individual re source s in t he group, and the AELCC value of n identical resource s isn’t equa l to n tim es the value of an individual resour ce. III. C Marginal E LCC Marginal ELCC (MEL C C) is the marginal version of the ELCC m ethod. T he MELC C calcula tion c an f ol low a simi lar proc ess as the AELCC c alculation, e xcept t hat a small (mar ginal) perturba tion to a resour ce i s pe rfor med instea d of the re moval of the entire resour ce. Namely, it calc ulates the equivale nt a mount of per fec t c apac ity that would yield the sa me LOLE impac t of a small change to a re source ’s capacity . The M ELCC calc ulation is il lus trated in F i g. 4, w here the ade quacy impac t of a sm all cha nge to resourc e i , and t he perfect ca pacity amount that would yield t he same adequac y impac t are il lustrated. Note that wit h the margina l changes, t he LOLE functions are plott ed as li near ones in the figure. F ollowing (35), the contribution fa ctor fo r the small change of re source i can be r epre sented as (36) wher e “ ” indica tes marginal cha nges to be d istinguished f rom the “∆” changes of the entire r esourc e in AELCC. The a bove formula indi ca tes that to yiel d the same reliabi li ty impact of would re quire MW resourc e i or MW per fec t c apac it y. Then the MELCC of re source i is defined a s: (37) Fig.4. I llu stration of MELCC m eth od . The CF in (36) ca n also be wr it ten as: , (38) which re sembles the rM RI defini tion (8) exc ept for t he use of LOLE metric. Indee d, if EU E w ere adopted, MELCC w ould be equa l to MRIC in t heor y. A s a result, the MELCC acc reditation share s the resource-mix dep endenc y prope rty with the MRI- base d acc r editation. The add itivity a nd homogeneity p roperties also ho ld due to the mar ginal nat ure of the MELCC c oncept. With LOLE metric, howeve r, a resourc e’s MELC C does not have t he i nterpretation of ene rgy contribution as MRIC. Also, LOLE is less sensi ti ve t o capa city change s as compar ed to EU E or c ould even be disc onti nuous, and thus the prac tical MELCC ca lculation of LOLE derivatives may require sizable per turbations to incur trac eable LOLE change s, undermining the mar ginal nature of t he me thod . IV. N UM ERICAL T E STING In t his section, we test di ffe rent ac c reditation methods on a 25-unit s ystem with GE-MAR S [20] and examine their prope rties discussed in the previous sectio ns. A plann ing pe riod of 8760 hours (i.e., one yea r ) is c onsidere d for a syste m with 10 proba bil isti c hourly load prof il es bu il t on a historic al yea r’s load shape i n New England, 12 ther mal unit s of diff ere nt size s and out age rates ( eac h unit modeled as a two-state Markov Chain wi th the “1” state repr esenting f ull capac ity a nd “ 0” re presenting ze ro ca p acity), 11 Inter m ittent Power Resource s (IPRs) (ea ch modeled a s pr obabilist ic hourly output profiles), 2 Ener gy S torage (ES) uni ts (ea ch modeled wit h charging ca pacity, dischar ging capacity and ener gy li mit , and without forc ed outage o r efficie ncy loss ), and a perfec t resource re presenting the rema ining re source s in the system. T he ICA P s, forc ed outage rate s (f or non- ES unit s) and energy li mits ( for ES unit s) are l isted in Table 1. F or s im p licity, no tra nsmi s si on limit or uni t main tena nce i s considere d . The system i s verif i ed to be at 0.1 days/ye ar LOLE and thus serve s as the base case for a ccreditation ca lculations. Foll ow ing the MRIC ca lculati on desc ribed in Sec ti on II .B , and the avera ge and m ar ginal ELCC ca lculations describe d in Section III , the resulting acc r edited ca pa cities under these Capacity Reliabil ity A B Base case Capacity Reliabil ity A B Base case 9 ac creditation metho ds ar e sum mariz ed in Ta ble 1. For M R IC ca lculation, the per turbation siz e of 1 MW is applie d. F or AELCC calc ul ation, a trial-and- err or method is us ed t o identify the perf ect c apac ity va lue that yi elds the closest LOLE im pac t as a resourc e. Note that for ea ch resourc e, t he AELCC ca lculation require s multiple evaluations of ca ndidate values and thus i s compu t ationally more expe nsi ve than the M RIC ca lculation that evalua tes only once for the perturbed capacity. For MELC C calcula ti on, to re duce t he computational burde n we apply a simi lar perturba ti on proce ss to t he M RIC calcula ti on by exa mini ng the LOLE impa ct of “smal l” ca pacity changes base d on (38) . Noted that the LOLE function is discontinuous at some capacity values, and thus t he MELCC could be undef ined in theory and ha ve numeric al issues in practic e. From Table 1, the AEL CC, M ELC C a nd MR IC acc reditation values of a unit are no higher than its ICAP s ince all the se ac creditation methods repr esent the unit’s imper fec t i nstalled ca pacity to some “ equivale nt ” perfect ca pa city. Note that for per fec t c apac it y, all three methods yield the ICAP value as expe cted. Also, MELCC and MRI C , both being m ar ginal methods, yield di ffe rent ac cre dit ation values due to their adoption of diff ere nt ade quacy m etric s of LO LE and EUE, re spectively. AELCC and MELCC, both using t he LOLE metric, ge nera lly yi eld diffe rent acc r editation values due to the nonlineari ty of the LOLE function. Obser ve that M RIC of a t herma l unit i is no more than its UCAP val ue of , e.g., TH1 unit’s MR I C of 605.6 MW is less than i ts UCAP value of 750 (1 -0.1041) = 671.9 MW. The reason i s : UCA P re flec ts the unit’s expe cted ava il ability acr oss all hours, while MRIC re flects it s expec ted ava il ability during the MRI hours. As an hour is more like l y to be an MR I hour when the u nit i s on outage than when the u nit is available (with all else being the same), t he unit is m ore l ikely to be unava ilable during the M RI hours. Table 1: Average ELCC, Ma rg in al ELCC , and MRIC. Unit Native or AELCC MEL C C MRIC TH 1 750 0.1 041 63 1 560.6 605.6 TH 2 150 0.0 097 148 148.5 148.4 TH 3 100 0.2 061 79 76. 8 77 .9 TH 4 1000 0.0 08 986 969.7 979.6 TH5 5 0.0 723 4.6 4.6 4.6 TH6 10 0.0 723 9.8 9. 2 9. 3 TH7 150 0.0 964 134 133.3 133.8 TH 8 600 0.0 381 567 551.5 56 1 .0 TH 9 900 0.0 16 879 836.4 866.5 TH 10 50 0.0 01 49 .5 50 49 .9 TH 11 200 0.0 01 199 200 199.7 TH 12 300 0.0 06 298 293.9 297.7 IPR1 900 0 145 132.9 138.9 IPR2 600 0 145 117.3 133.7 IPR3 1400 0 153 92. 8 228.4 IPR4 60 0 35 34 .8 35. 3 IPR5 275 0 185 191.7 181.8 IPR6 15 0 7.8 8.0 8.0 IPR7 700 0 159 136.6 159.7 IPR8 25 0 16 .5 16 .8 16. 6 IPR9 200 0 197 198 193.2 IPR 10 50 0 45 .5 45 .3 44 .2 IPR11 800 0.7 962 12 .9 15. 1 23 .6 ES1 600 1200 570 515.2 22 4 .0 ES2 1500 12000 1500 1500 1437 .2 Perfe ct 21576.3 0 21576.3 21576.3 21576.3 Total 32916.3 - 28911.9 28415.2 28334.9 The contribution fac tors (i.e., acc reditation value di v ided by ICAP) of t he s torage units are l isted in Ta ble 2. It can be seen the contribution fac tor of the 2-hour storage is lower t han t hat of the 8-hour storage for ea ch a ccreditation method. This can be e xplained as t he lon ger-dur ation storage is l es s like ly to be ene rgy constra ined and thus acts more like a perfe ct ca pa city. The low r MRI (i.e., 0.37) of the 2-ho ur storage c an be explained by the inte rpre tation of rM R I as the expe cted availabi lit y durin g the MRI h ours (Sec ti on II.D) and the re latively long e xpecte d dura ti on of loss of l oad eve nts (i.e., 4.2 hours) in the base case . Table 2 : Co ntribution factors of 2-ho u r and 8 -h o ur storag e unit s. Storage Unit CF -AE LCC CF -M ELCC CF -M R IC (r MRI) ES1 (2-ho ur) 0.9 5 0.8 6 0.3 7 ES2 (8-ho ur) 1.0 1.0 0.9 6 To test the additivi ty of differ ent ac creditation m ethods, consider IPR s 1-8 as a si ngle group. The group’s accr edited values under diffe rent ac cr editations a re calcula ted and list ed in Table 3, along wit h the sum of i ndividual acc reditation values in Table 1 . It can be seen from Table 2 that the gr oup AEL CC (i.e., 903 MW) is 56.7 MW more t han the su m of ind ividual re source AELCCs (i.e., 846.3 MW), c onsistent w ith the non - additive f eature of AELCC me thod. The M RI C of the group, whethe r ca lculated a s a single group or t he sum of individual unit MRICs, yield s almost identica l results w ith t he s mall 0.3 MW di ffe rence attributing to numerica l tol er ance , which is consistent with the additive featur e of M RIC. The MELC C ac creditation, although additive in theory with assum ed diffe rentiability of LOLE, shows s iza bl e gap (25.7 MW) betwe en the group MELCC (756.6 MW) and the sum of individual MEL CC s (730.9), l ikely cause d by t he nume rical cha ll enge s of MELCC calc ulation (i.e., discontin uity of LOLE func ti on and low LO LE sensi ti vi ty t o s mall capac ity change s). Table 3 : Group accreditation and total individual accreditati o n s. IPR Group ICAP AELCC MEL C C MRIC Group Accreditation 3975 903 756.6 902.8 Sum of Indiv i d ual Accr ed . 3975 846.3 730.9 902.5 To exa mi ne the re fer ence depende n ce, c onsider TH1 as the new refe r enc e. Then re source s’ ac c redita ti on values under the new re ference can be calculate d and the corresponding contribution fa ctors ca n be compar ed with the value s under the per fec t cap ac it y re ference . Table 4 lists the c ontribution fa ctors of t wo uni t s, TH1 and TH2, unde r the two diffe rent refe r ence s for AELCC, MELC C and MRIC m ethod s . Note that a re source’ s ICAP is not affe cted by the r eferenc e choice . Also, when TH1 is t he r eferenc e, its contribution fac tors a re 1. The CF s of TH2 u nder the new ref ere nce TH1 capa city are hi gher than those under perfe ct ca p acity si nce the new re f ere nc e is less per fec t. N ote that the CF s of TH2 exce ed 1 since TH 2 wit h a 10 small outage rate is mor e l ikely to be available tha n the new re ference TH1 with a much highe r outage rate. The percenta ge incre ases of acc reditation values under the TH1 refe renc e with re spect to those under the per f ec t r efe r enc e ar e also listed in Table 4. Observe that marginal method s (i.e., MEL CC a nd MRIC) i mpose a uniform perce ntage inc rea s e to the ac creditation values of both units witho ut aff ecting the relative ca pacity value s b etwe en the two units, and are thus considere d re ference independe nt. AELCC, howe ver, r esults in ac creditation incr ease s of 18.9% fo r TH1 and 12.2% for TH2 , re spectively, a lt er ing the re lative value s of the two units , i.e., TH 1 gained an advanta ge over TH2 due t o the ref e re nc e shift. Ther efor e, AELCC is refe r enc e depe nd ent. Table 4 : Co ntribution factors with diff erent refer en ces. Unit ICAP CF -AE LCC CF -M ELCC CF -MRI C With perfect cap acity as ref erence TH1 750 0.8 41 0.7 47 0.8 07 TH 2 150 0.9 87 0.9 90 0.9 89 With TH1 as ref erence TH 1 750 1.0 (+ 1 8.9%) 1.0 (+33.8%) 1.0 (+ 2 3.9%) TH 2 150 1.1 1 (+1 2 .2%) 1. 32 (+3 3 .8%) 1. 23 (+2 3 .9%) V. C ONCLUSION An MRI-ba sed ac cre dit ation fra mework is introduce d for ca pacity m ar kets. The framew ork is ana l yze d for its fe atures and compar ed with other acc r editation methods. Wi t h the MRI- base d resourc e ac creditation and capa city de mand, the capa city marke t of MRIC produc t is better a ligned with the system ade quacy ne ed, allowing more effic ient market outcome s. R EFE R ENC ES [1] NERC Reliability Termi nology. [online available] https://www.ne rc.com/AboutN E RC /Documents / Terms%20AU G13.pdf [2] AES O, Comparison of Ins talled C apac ity (ICAP) & Unforced Capacity (UCAP) Capac ity Value Calculation M ethods, 2017, [online ava ilable] https://www.a es o.ca /assets/Uploads /20170704-E ligibility- Sess ion-3- UCAP-ICAP -Comparison -Presentatio n. pdf [3] Capac ity Auction R eforms Ke y P rojects , I SO -N E, [ online a vailab le] https://www.is o-ne. com/commi ttees/ke y-projec ts/ca pacity-auction- refor ms -ke y-projec t [4] Res ource Accreditation, MISO white paper, May 2023, [online availab le] https://cdn.mis oenergy.org/M IS O% 20Draf t%20Resource %20A ccreditat ion%20Design %20White %20Paper 628865. pdf [5] Z. T. Smith and M. Mohrman, “Improvi ng capac ity a ccreditation,” https://www.nyis o.c om/documents/2014 2/2917706 4/C apac ity%20Acc re ditation%2003-16 -22 %20v7.pdf/b 26e6a99 -5 f4e-29cc-c60c - 47608c78c983, 2022, [Online; acc es sed 4-Dec ember-2024]. [6] C. Glazer and C. Lu, “C apacity mar ket r eforms to acc om modate the energy trans ition while maintaining resource adequacy, ” P J M Intercon - nection LL C, Tech. Re p., 2023. [7] IS O- N E, “ Res ource Capacity A ccreditation in the Forward C apacity Market: MR I- based conce ptual des ign,” J ul. 2022, [Online ava ilable] [8] IS O- N E, “ Res ource Capacity A ccreditation in the Forward C apacity Market : continued discus sion on c onceptual des ign,” Aug. 2022, [Online available] [9] D. S tenclik, “ Ensuring ef ficient rel iability : Ne w des ign princip les for capac ity ac creditation,” Energy Sys tems Integration Group, T ech. Rep . , 2023. [10] P. Huang, “Wha t new reform s to capa city accreditation mean f or us power markets, ” https://www.w oodmac. com/news /opinion/wha t -new- refo rms- to -capacity-acc reditat ion- mean-for-us-powe r- ma rkets /, 2024, [Online; acce ss ed 4-December-2024]. [11] T. Aagaa rd and A. N. Kleit , “ Marginal vs. average eff ec tive load ca rr ying capability: How s hould c apacity markets deal with a lternative gene ration form s ? ”, Utilities Policy, Vol. 84, Oct. 2023. A. D . Kevin Carden and R . A mitava, “Effective load carrying c apability study, ” As trap´e C onsulting, Tech. Re p., 202 4. [online ava ilable] https://www.e rcot.com/fi les/doc s/2025/02/12 /2024 ERCOT_ELCC _Stud y_Final_Report 02112025.pd f [12] F. Zhao, T . Zheng, and E . Litvinov , “Constructing demand curves in forward capacity market,” IE EE Transac tions on Power Sy stems , vol. 33, no. 1, pp. 525 – 535, 2017. [13] F. Zhao, T. Zheng, and E. Litvinov, “Economic inte r pretatio n of demand curves in multi-product electricit y markets - part I : Theory, ” IEEE Transac tions on Power Sy stems, vol. 35, no. 6 , pp. 4880 – 4887, 2020. [14] F. Zhao, T. Zheng, and E. Litvinov, “Economic inte r pretatio n of demand curves in multi- product e lect ricity mar ke ts- part II : P ractice, ” IEEE Transac tions on Power Sy stems , vol. 35, no. 6 , pp. 4888 – 4895, 2020. [15] NERC , Probabili s tic Assessme nt - Technical Guideline Document [ online available] https://www.ne rc.com/comm/R ST C/PAW G/pr oba_ technical_guideline_ document_0808201 4. pdf [16] NERC , M ethods to Model and Ca lculate Capa city C ontributions of Variable Generation for Resource Adequa cy Planning [online available] https://www.ne rc.com/pa/R APA/ ra/Reliability %20Ass ess ments%20DL/ IVGTF1-2.pdf [17] R . Billinton and R. N. Allan, Reliability Evaluation of Power Systems, Springer, 1996. [18] C. Singh, P. Jirutitijaroen, J. Mitra, Electric Powe r Grid Reliabil ity Evaluation: Models and M ethods , John Wiley & Sons , 2018 [19] GE, “Multi - area reliabilit y simulation (MARS) software,” https://www.ge vernova.c om/content /dam/ Energy_Consult ing/global /en_ US/pdfs/G EA35097B- GE -MAR S _Brochure_R3. pdf, 2018, [On line; acce ss ed 4-December-2024].
Original Paper
Loading high-quality paper...
Comments & Academic Discussion
Loading comments...
Leave a Comment