Forecasting the Evolving Composition of Inbound Tourism Demand: A Bayesian Compositional Time Series Approach Using Platform Booking Data
Understanding how the composition of guest origin markets evolves over time is critical for destination marketing organizations, hospitality businesses, and tourism planners. We develop and apply Bayesian Dirichlet autoregressive moving average (BDAR…
Authors: Harrison Katz
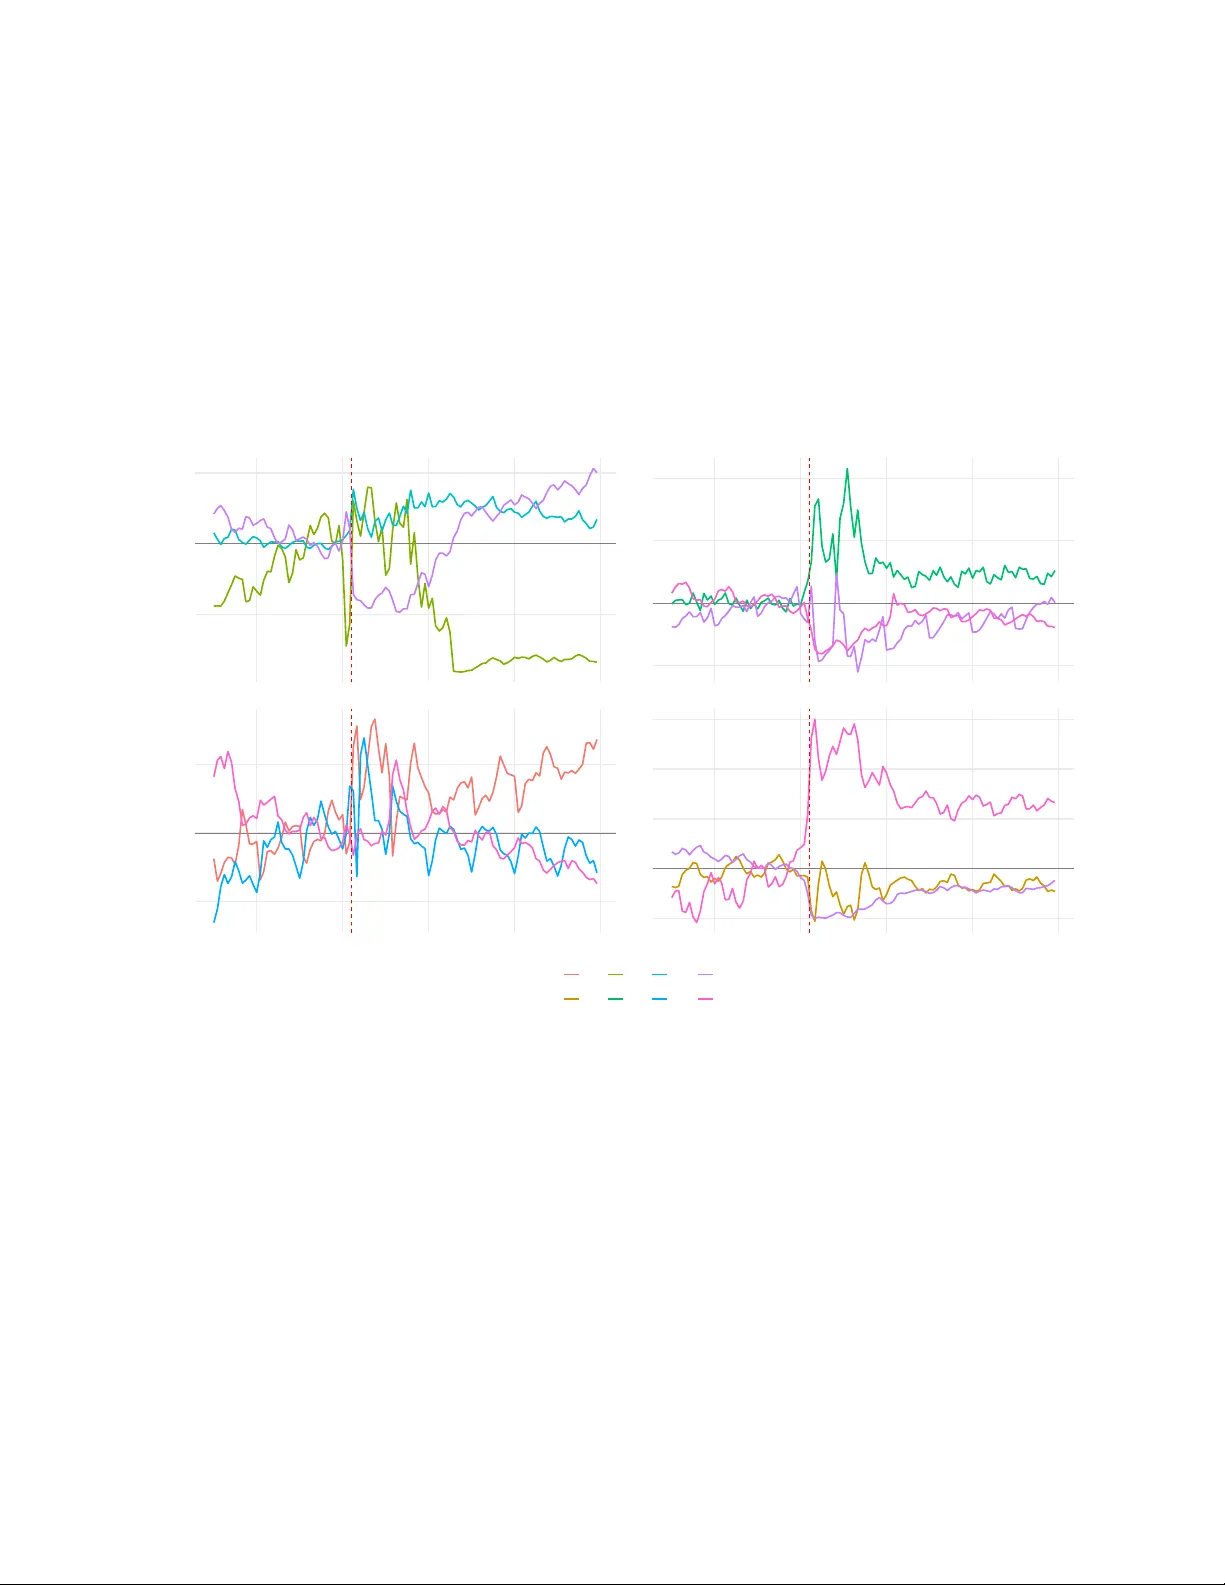
F orecasting the Ev olving Comp osition of In b ound T ourism Demand: A Ba y esian Comp ositional Time Series Approac h Using Platform Bo oking Data Harrison E. Katz a,1, ∗ a Data Scienc e, F or e c asting, Airbnb Inc., San F r ancisc o, CA, USA Abstract Understanding how the comp osition of guest origin mark ets evolv es ov er time is critical for destination mark eting organizations, hospitalit y businesses, and tourism planners. W e dev elop and apply Ba yesian Diric hlet autoregressiv e mo ving a v erage (BD ARMA) mo dels to forecast the comp ositional dynamics of guest origin market shares using proprietary Airbn b b ooking data spanning 2017–2024 across four ma jor destination regions. Our analysis reveals substan tial pandemic-induced structural breaks in origin comp osition, with heterogeneous reco very patterns across markets. The BD ARMA framework achiev es the low est a v erage forecast error across all destination regions, outp erforming standard b enc hmarks including naïv e forecasts, exponential smo othing, and SARIMA on log-ratio transformed data. F or EMEA destinations, BD ARMA achiev es 23% lo w er forecast error than naïv e metho ds, with statistically significan t impro v ements. By mo deling comp ositions directly on the simplex with a Diric hlet likelihoo d and incorp orating seasonal v ariation in both mean and precision parameters, our approach pro duces coherent forecasts that resp ect the unit-sum constrain t while capturing complex temporal dep endencies. The methodology pro vides destination stak eholders with probabilistic forecasts of source market shares, enabling more informed strategic planning for mark eting resource allo cation, infrastructure inv estmen t, and crisis resp onse. Keywor ds: Compositional time series, T ourism demand forecasting, Ba yesian metho ds, ∗ Corresp onding author Email addr ess: harrison.katz@airbnb.com (Harrison E. Katz) Diric hlet distribution, Airbnb, Source markets, COVID-19 1. In tro duction T ourism demand forecasting has long b een recognized as essen tial for destination plan- ning, resource allo cation, and strategic decision-making (Song et al., 2019; Li et al., 2005; Witt and Witt, 1995). Accurate forecasts enable destination marketing organizations (DMOs) to optimize promotional sp ending across source markets, allow hospitalit y businesses to ad- just pricing and staffing, and help p olicymakers anticipate infrastructure needs (Song and Li, 2008; Assaf et al., 2019). While the tourism forecasting literature is extensiv e, the v ast ma- jorit y of studies fo cus on predicting aggregate arriv als or total exp enditure (Jiao and Chen, 2019; W u et al., 2017). Considerably less attention has b een paid to forecasting the c om- p osition of tourism demand—that is, ho w the mix of visitors from different origin markets ev olves ov er time. The comp osition of inbound tourism matters for sev eral reasons. First, visitors from differen t source markets exhibit distinct sp ending patterns, length-of-stay distributions, and seasonal preferences (W u et al., 2011; Divisekera, 2003). Second, the mark eting c hannels and messaging that resonate with trav elers v ary substan tially across cultures and geographies (Song and Li, 2008). Third, geop olitical ev ents, exchange rate fluctuations, and public health crises affect origin markets asymmetrically , as demonstrated vividly during the COVID-19 pandemic (Gössling et al., 2020; Sigala, 2020). Understanding and forecasting comp ositional shifts is therefore crucial for agile destination managemen t. F rom a metho dological standp oin t, mark et share data are c omp ositional : the shares of all origin mark ets must sum to unity , and each share is b ounded b et w een zero and one. Stan- dard time series methods that ignore these constraints can pro duce incoheren t forecasts—for example, predicted shares that sum to more than 100% or take negative v alues (Aitc hison, 1986; P awlo wsky-Glahn et al., 2015). The comp ositional data analysis literature, pioneered b y Aitchison (1982), offers principled approaches based on log-ratio transformations that 2 map the simplex to unconstrained Euclidean space. Ho wev er, transformed approac hes can obscure in terpretability and ma y p erform p o orly when shares approac h zero (Greenacre, 2021). An alternative paradigm mo dels comp ositions directly using the Diric hlet distribution, whic h has supp ort on the simplex and naturally enforces the unit-sum constrain t. Recent adv ances in Bay esian comp ositional time series ha ve made this approach increasingly prac- tical. The Katz framework (Katz et al., 2024) in tro duced Bay esian Dirichlet Autoregressiv e Mo ving A verage (BDARMA) models for forecasting lead time distributions in the hospitalit y industry , demonstrating sup erior p erformance relativ e to b oth frequentist Dirichlet ARMA and transformed Gaussian approac hes. Extensions ha ve addressed time-v arying v olatilit y through Dirichlet ARCH comp onen ts (Katz and W eiss, 2025), cen tered mo ving a verage for- m ulations that improv e n umerical stabilit y (Katz, 2025), and renewable energy mix fore- casting (Katz and Maierhofer, 2025). Softw are implementation is a v ailable in the darma R pac k age (Katz, 2024). This pap er contributes to b oth the tourism forecasting and comp ositional time series literatures b y developing and applying BD ARMA mo dels to forecast guest origin market shares using large-scale platform b o oking data. W e analyze Airbnb reserv ations from 2017 to 2024 across four ma jor destination regions (EMEA, North America, Asia-P acific, and Latin America), providing what is, to our kno wledge, the first application of Bay esian com- p ositional time series metho ds to tourism source market forecasting. Our empirical setting offers sev eral adv an tages. First, Airbn b op erates globally with stan- dardized data collection, enabling consisten t measuremen t across diverse mark ets. Second, platform b o oking data captures actual reserv ations rather than surv ey-based in tentions or aggregate b order crossing statistics, providing a direct measure of revealed demand. Third, our sample p erio d spans the COVID-19 pandemic and subsequen t recov ery , allowing us to examine how comp ositional dynamics shifted during and after this unprecedented disruption. Prior work using Airbnb data has do cumen ted pandemic-induced c hanges in b o oking lead 3 times (Katz et al., 2025b) and length of stay distributions (Katz and Sa v age, 2025), but the ev olution of origin market comp osition has not b een systematically analyzed. W e find that BD ARMA mo dels ac hiev e the low est a verage forecast error across all desti- nation regions, substantially outp erforming standard b enc hmarks in forecasting origin mar- k et shares. The pandemic caused dramatic comp ositional shifts—most notably a surge in within-region b ookings at the exp ense of long-haul trav el—with recov ery tra jectories that v aried mark edly across destination regions. Our mo dels capture these dynamics through autoregressiv e and mo ving av erage terms that allow past comp ositions and sho c ks to influ- ence current shares, while the Diric hlet lik eliho o d ensures forecasts remain v alid probability distributions. A k ey metho dological finding is that incorp orating seasonal v ariation in the precision parameter—not just the mean comp osition—substantially impro ves forecast accu- racy . The remainder of this pap er is organized as follows. Section 2 reviews related work on tourism demand forecasting, comp ositional data analysis, and p eer-to-p eer accommo dation researc h. Section 3 presen ts the BDARMA mo deling framework and estimation approach. Section 4 describ es our Airbnb b o oking data and the construction of origin market com- p ositions. Section 5 rep orts empirical findings, includi ng mo del comparisons and forecast accuracy assessments. Section 6 discusses implications for destination managemen t and di- rections for future researc h. Section 7 concludes. 2. Literature Review 2.1. T ourism Demand F or e c asting T ourism demand forecasting has attracted substan tial sc holarly attention ov er the past three decades (Song et al., 2019; Li et al., 2005). Early work relied primarily on econometric mo dels—autoregressiv e distributed lag (ADL) sp ecifications, error correction mo dels, and time-v arying parameter approaches—to relate arriv als or exp enditure to economic determi- nan ts such as income, prices, and exchange rates (Song and Li, 2008; Witt and Witt, 1995). 4 Song and Li (2011) and Li et al. (2006) demonstrated that incorp orating coin tegration and allo wing for structural change improv es forecast accuracy . More recent contributions ha ve embraced mac hine learning and big data. Li et al. (2020) sho wed that search query data from Google T rends can enhance short-term arriv al forecasts. W en et al. (2019) developed h ybrid mo dels com bining ARIMA with neural netw orks, while Assaf et al. (2019) introduced Bay esian global vector autoregression (BGV AR) to capture spillo vers across regional tourism markets. The tourism forecasting comp etition (Athana- sop oulos et al., 2011) pro vided a systematic comparison of metho ds, finding that simple b enc hmarks often remain comp etitiv e with more complex approac hes. Despite this ric h literature, forecasting the c omp osition of tourism demand—as opp osed to aggregate levels—has receiv ed limited atten tion. A notable exception is the almost ideal demand system (AIDS) ap proac h (W u et al., 2011; Li et al., 2006), whic h mo dels budget shares allo cated to different tourism pro ducts or destinations. How ev er, AIDS mo dels fo cus on exp enditure allo cation rather than visitor origin shares, and their linear functional form do es not naturally enforce simplex constraints. 2.2. Comp ositional Data Analysis Comp ositional data—observ ations that represent parts of a whole and th us sum to a constan t—arise throughout the sciences (Aitchison, 1986). The standard approach trans- forms comp ositions via log-ratios (additive, centered, or isometric) to map the simplex to Euclidean space, after which conv en tional multiv ariate methods apply (Egozcue et al., 2003; P awlo wsky-Glahn et al., 2015). F or time series, this enables the use of v ector autoregression (V AR) and related mo dels on transformed data (Kynčlo vá et al., 2015). An alternative approac h mo dels comp ositions directly using distributions supp orted on the simplex. The Diric hlet distribution is the canonical c hoice, parameterized b y a concen tra- tion vector α = ( α 1 , . . . , α C ) with α c > 0 . Grun wald et al. (1993) prop osed Bay esian state- space mo dels for con tinuous prop ortions, while Zheng and Cadigan (2017) developed fre- quen tist Diric hlet ARMA mo dels. More recen tly , Katz et al. (2024) introduced the Bay esian 5 Diric hlet ARMA (BDARMA) framework, whic h com bines the Diric hlet lik eliho o d with v ec- tor autoregressiv e moving a verage (V ARMA) dynamics on the mean parameters. Extensions include volatilit y clustering via Diric hlet AR CH (Katz and W eiss, 2025) and extensive prior sensitivit y analysis (Katz et al., 2025a). The BD ARMA framew ork offers several adv an tages for tourism applications. First, fore- casts automatically satisfy simplex constrain ts without p ost-ho c normalization. Second, the Dirichlet concen tration parameter provides a natural measure of forecast uncertaint y— lo wer concen tration implies greater disp ersion across p ossible comp ositions. Third, the Ba yesian approac h yields full p osterior predictiv e distributions, enabling probabilistic state- men ts ab out future mark et shares. 2.3. Pe er-to-Pe er A c c ommo dation and Platform Data The rise of p eer-to-peer (P2P) accommo dation platforms, particularly Airbn b, has trans- formed the hospitalit y landscape and generated a substantial research literature (Guttentag, 2015; Dolnicar, 2019; Hall and Gössling, 2022). Studies hav e examined Airbn b’s comp etitiv e effects on hotels (Zerv as et al., 2017), and implications for destination go v ernance (Nieuwland and V an Melik, 2020). Platform data offer unique adv antages for tourism researc h. Unlik e official statistics that rely on b order crossings or accommodation surv eys, b o oking data capture actual reserv ations with precise timing and geographic detail. Sev eral recent studies hav e leveraged Airbnb data to examine pandemic-era disruptions. Katz et al. (2025b) analyzed b o oking lead time distributions across ma jor U.S. cities, finding a tw o-phase pattern of pandemic disruption follo wed by incomplete recov ery . Katz and Sa v age (2025) do cumen ted a structural shift to ward longer stays, with the share of month-plus b o okings nearly doubling during CO VID restrictions and remaining elev ated thereafter. Sainaghi and Mauri (2022) examined rev en ue impacts in Milan. Our study contributes to this literature by examining a previously unexplored dimension of platform b o oking data: the ev olving comp osition of guest origin mark ets. Understanding 6 where guests come from—and ho w this mix changes ov er time—is fundamen tal for destina- tion mark eting yet has not b een systematically analyzed at scale. 3. Metho dology 3.1. The BD ARMA Mo del Let y t = ( y t, 1 , . . . , y t,C ) ⊤ denote the v ector of origin market shares at time t , where y t,c ≥ 0 and P C c =1 y t,c = 1 . W e model y t as Diric hlet distributed conditional on time-v arying parameters: y t | µ t , ϕ t ∼ Dirichlet ( ϕ t µ t ) , (1) where µ t = ( µ t, 1 , . . . , µ t,C ) ⊤ is the mean comp osition satisfying P C c =1 µ t,c = 1 , and ϕ t > 0 is the precision (concen tration) parameter. Under this parameterization, E [ y t ] = µ t and V ar ( y t,c ) = µ t,c (1 − µ t,c ) / (1 + ϕ t ) . T o mo del temporal dynamics, we w ork with the isometric log-ratio (ILR) transformation of the mean: η t = ILR ( µ t ) = V ⊤ log( µ t ) , (2) where V is a ( C × C − 1) con trast matrix satisfying V ⊤ V = I C − 1 and V ⊤ 1 C = 0 . The ILR transformation maps the C -part simplex to R C − 1 while preserving the geometry of comp ositional data (Egozcue et al., 2003). The in verse transformation reco vers µ t via the generalized softmax. The BD ARMA ( P , Q ) sp ecification mo dels η t as a V ARMA pro cess: η t = X t β + P X p =1 A p ( η t − p − X t − p β ) + Q X q =1 B q ˜ ϵ t − q , (3) where X t is a cov ariate matrix (including F ourier terms for seasonality), β contains regression co efficien ts, A p are ( C − 1) × ( C − 1) autoregressive co efficien t matrices, B q are mo ving a verage co efficien t matrices, and ˜ ϵ t are mean-centered comp ositional inno v ations. The cen tering 7 adjustmen t, whic h ensures that the MA innov ations ha ve mean zero under the Dirichlet lik eliho o d, follows Katz (2025); technical details are provided in App endix App endix A. 3.2. Se asonal Pr e cision A k ey modeling choice is whether the precision parameter v aries o ver time. W e allo w the precision to dep end on seasonal cov ariates: log ϕ t = z ⊤ t γ , (4) where z t includes an intercept and F ourier terms ( K = 6 harmonics) capturing monthly seasonalit y . This sp ecification allo ws comp ositional volatilit y to v ary seasonally—for ex- ample, summer months may exhibit tighter concentration around exp ected shares due to more predictable trav el patterns, while shoulder seasons ma y show greater disp ersion. As w e demonstrate in Section 5, incorp orating seasonal precision substan tially impro v es forecast accuracy compared to constan t-precision sp ecifications. 3.3. Prior Sp e cific ation W e adopt w eakly informativ e priors: for the intercept and regression co efficien ts, we use β j ∼ Normal (0 , 1) . F or autoregressive co efficients, we place Normal (0 . 5 , 0 . 3) priors on diagonal elements (reflecting t ypical p ersistence) and Normal (0 , 0 . 2) on off-diagonal elemen ts. Mo ving av erage coefficients receiv e Normal (0 , 0 . 3) priors. The precision intercept has a Normal (3 , 1) prior, implying mo derate concentration, with seasonal co efficien ts receiving Normal (0 , 0 . 5) priors. 3.4. Estimation W e estimate the mo del using Marko v chain Monte Carlo (MCMC) via Stan (Carp en ter et al., 2017), accessed through the darma R pack age (Katz, 2024). W e run four c hains for 2,000 iterations eac h (1,000 warm up), yielding 4,000 p osterior draws. Conv ergence is assessed via the ˆ R statistic and effective sample size (V eh tari et al., 2021). 8 3.5. F or e c asting and Evaluation Giv en p osterior dra ws of mo del parameters, we generate h -step-ahead forecasts by it- erating the V ARMA recursion forw ard and sampling from the implied Dirichlet predictiv e distribution. P oint forecasts are p osterior means of the predictiv e comp osition; in terv al forecasts use p osterior quantiles. W e ev aluate forecast accuracy using multiple metrics. F or p oin t forecasts, w e compute the mean absolute error (MAE) a veraged across comp onen ts. W e also rep ort Aitc hison distance, a proper metric for compositional data (Aitc hison et al., 1992), and the log predictiv e densit y (LPD) for probabilistic calibration assessmen t (Gneiting and Raftery, 2007). W e compare BD ARMA against several benchmarks: (i) naïv e forecasts (last observ ation carried forward); (ii) seasonal naïv e (same mon th previous y ear); (iii) rolling mean (12-mon th a verage); (iv) exponential smo othing (ETS) on ILR-transformed series; and (v) SARIMA on ILR-transformed series. F or transformed b enchmarks, we apply the inv erse ILR to obtain simplex-v alued forecasts. Mo del comparison within the BDARMA family uses lea ve-one-out cross-v alidation (LOO- CV) via P areto-smo othed imp ortance sampling (V eh tari et al., 2017). W e rep ort the exp ected log p oin twise predictiv e densit y (ELPD) and effective n umber of parameters ( p loo ). T o test whether accuracy differences b etw een metho ds are statistically significant, w e emplo y the Dieb old-Mariano test (Dieb old and Mariano, 1995) with a heteroskedasticit y and auto cor- relation consisten t v ariance estimator; details are pro vided in App endix App endix A. 4. Data 4.1. A irbnb Bo oking Data Our analysis uses reserv ation data from Airbn b’s global platform spanning Jan uary 2017 through Decem b er 2024. Airbnb is one of the world’s largest p eer-to-p eer accommo dation mark etplaces, op erating in ov er 220 coun tries and regions with more than 8 million activ e 9 listings (Airbn b, Inc., 2025). The platform’s standardized b o oking infrastructure enables consisten t measurement of guest origin and destination across diverse markets. W e extract all confirmed reserv ations (excluding cancellations) from Airbnb’s internal b ookings database. Eac h reserv ation record includes the bo oking date, guest coun try of res- idence, and listing lo cation. W e aggregate daily b o okings to monthly frequency to smo oth high-frequency noise while preserving meaningful temp oral dynamics. The full sample com- prises 96 mon ths of observ ations. 4.2. Ge o gr aphic Sc op e W e analyze b ookings into four ma jor destination regions defined by Airbnb’s financial planning and analysis (FP A) taxonomy: • EMEA : Europ e, Middle East, and Africa—Airbnb’s largest region by b ooking v olume, encompassing ma jor destinations suc h as F rance, S pain, Italy , the United Kingdom, and German y . • NAMER : North America—comprising the United States and Canada, with the U.S. represen ting the platform’s founding market. • AP A C : Asia-Pacific (excluding mainland China)—including Australia, Japan, South K orea, and Southeast Asian markets. • LA T AM : Latin America—spanning Mexico, Brazil, Argen tina, and other Central and South American coun tries. F or each destination region, w e compute the monthly comp osition of guest origin mark ets. Guests are assigned to origin countries based on their registered country of residence at the time of b ooking. 10 4.3. Origin Market Classific ation T o obtain interpretable comp ositions, we consolidate origin coun tries into a manageable n umber of categories. F or each destination region, we identify the top seven origin mark ets b y a verage b ooking share ov er the sample p eriod. Markets outside the top seven are aggregated in to an “Other” category . This yields eigh t distinct origin categories p er destination region. F or interpretiv e con venience, w e define a b o oking as within-r e gion if the guest’s origin coun try falls within the same destination region (e.g., a F renc h guest bo oking in Spain, b oth within EMEA), and outside-r e gion otherwise. This distinction serv es as a pro xy for short-haul v ersus long-haul trav el patterns in our subsequen t analysis. T able 1 presen ts descriptiv e statistics for eac h destination region, including the n um- b er of observ ations, origin market comp onen ts, and summary statistics for comp ositional v ariability . T able 1: Descriptive Statistics by Destination Region EMEA NAMER AP A C LA T AM Observ ations 96 96 96 96 Comp onen ts 8 8 8 8 T op origin (avg. share) FR (23.4%) US (82.3%) A U (21.2%) BR (27.4%) Second origin (a vg. share) GB (14.9%) CA (9.6%) KR (17.8%) MX (19.7%) T op origin share range 0.18–0.41 0.75–0.90 0.15–0.28 0.20–0.33 Mean auto correlation 0.89 0.94 0.87 0.91 4.4. Descriptive Patterns Figure 1 displays the evolution of origin market compositions o ver our sample p erio d for eac h destination region. Sev eral patterns emerge. First, comp ositions exhibit substan tial temp oral v ariation, with visible seasonal patterns (e.g., increased Europ ean trav el to EMEA during summer mon ths) and trend shifts. Second, the CO VID-19 pandemic (beginning Marc h 2020) caused dramatic comp ositional changes: within-region origin shares surged as in ternational trav el collapsed, particularly for long-haul markets. Third, the recov ery from 11 pandemic lows has b een unev en across origin mark ets, with some shares returning to pre- pandemic lev els while others show p ersisten t deviations. AP AC LA T AM EMEA NAMER 2018 2020 2022 2024 2026 2018 2020 2022 2024 2026 0% 25% 50% 75% 100% 0% 25% 50% 75% 100% 0% 25% 50% 75% 100% 0% 25% 50% 75% 100% Share of Bookings Or igin FR GB DE US ES IT NL CA CN A U KR MY NZ JP BR MX AR CL CO Other Guest Origin Market Shares by Destination Region Figure 1: Guest origin market shares by destination region, January 2017–December 2024. Stac ked area c harts sho w the comp ositional ev olution of the top seven origin mark ets plus “Other” for eac h destination. The v ertical dashed line indicates Marc h 2020 (onset of CO VID-19 pandemic). Note the dramatic compositional shifts during 2020–2021, particularly the collapse of Chinese outb ound tra vel to AP AC and the surge in within-region b o okings across all destinations. The high auto correlation co efficien ts (0.87–0.94 across regions) confirm substan tial p er- sistence in comp ositional shares, motiv ating autoregressiv e mo deling. AP A C exhibits the most dramatic compositional v ariation, with Chinese origin share dropping from appro xi- mately 25% pre-pandemic to under 5% during restrictions, with gradual recov ery thereafter. NAMER sho ws the least comp ositional v ariation, with U.S.-origin b o okings consistently dominating at 75–90% of the total. Both the Diric hlet likelihoo d and ILR transformation require strictly p ositiv e comp osi- 12 tional comp onen ts. In our data, the minimum observed share across all region-month-origin com binations is 0.8%, occurring for the “Other” category in NAMER during p eak U.S.-origin mon ths. No exact zeros app ear in the data, a consequence of aggregating large b o oking v olumes (tens of thousands of reserv ations p er mon th) where ev en small origin markets con- tribute p ositiv e coun ts. W e therefore apply no zero-replacement or smo othing pro cedures. 4.5. Comp ositional Dynamics T o motiv ate our mo deling choices, we examine temp oral patterns in comp ositional v ari- abilit y . Figure 2 plots the Herfindahl-Hirsc hman Index (HHI) of origin mark et concen tration o ver time for eac h destination region. NAMER exhibits consisten tly high concentration (HHI ≈ 0.60–0.75), reflecting U.S. dominance, with a pandemic-induced spik e to nearly 0.90 as Canadian cross-b order tra vel collapsed. In contrast, EMEA, AP A C, and LA T AM maintain div erse origin p ortfolios (HHI ≈ 0.20) with only mo dest pandemic disruption. This hetero- geneit y in mark et structure explains wh y forecast metho d p erformance v aries across regions: BD ARMA’s abilit y to mo del comp ositional dynamics pro vides greater v alue where multiple origin mark ets comp ete. 0.00 0.25 0.50 0.75 1.00 2018 2020 2022 2024 2026 HHI Destination AP AC EMEA LA T AM NAMER Herfindahl−Hirschman Index of origin composition (higher = more concentrated) Market Concentration Over Time Figure 2: Mark et concentration ov er time by destination region. The Herfindahl-Hirschman Index (HHI) measures origin market concentration, with higher v alues indicating dominance b y fewer markets. NAMER exhibits consisten tly high concentration due to U.S. dominance, while EMEA maintains div erse origin p ort- folios. The vertical dashed line indicates March 2020. 13 Figure 3 displays a verage auto correlation functions of CLR-transformed shares by desti- nation. All regions exhibit substantial persistence at short lags, with NAMER sho wing the slo west deca y (lag-1 ACF ≈ 0.90) and EMEA the fastest (lag-1 ACF ≈ 0.70). AP A C and LA T AM display a secondary p eak at lag 12, indicating seasonal patterns in comp osition. These autocorrelation structures motiv ate the AR(1) sp ecification in our BD ARMA mo dels. 0.00 0.25 0.50 0.75 0 6 12 18 24 Lag (months) ACF Destination AP AC EMEA LA T AM NAMER A veraged across all origin components within each destination A verage Autocorrelation of CLR−T ransformed Shares Figure 3: A v erage autocorrelation of CLR-transformed origin shares b y destination region. All regions show substan tial persistence, with NAMER exhibiting the slow est decay . The seasonal bump at lag 12 for AP A C and LA T AM motiv ates including F ourier terms for seasonality . Critically , comp ositional v ariabilit y itself exhibits seasonal patterns. Figure 4 sho ws box- plots of Aitc hison distance from the mean comp osition by calendar month for EMEA. Spring and early summer months (Marc h–June) display substan tially higher comp ositional disp er- sion than autumn months (September–Octob er), with median Aitc hison distances approxi- mately 25% larger. This pattern reflects greater uncertaint y in origin mix during shoulder seasons when tra vel patterns are less predictable compared to p eak summer mon ths when established seasonal flo ws dominate. This empirical pattern directly motiv ates our seasonal precision specification: rather than assuming constan t comp ositional volatilit y , we allow the Dirichlet precision parameter ϕ t to v ary with F ourier seasonal terms. As we demonstrate in Section 5, this sp ecification 14 0.4 0.8 1.2 1.6 Jan Feb Mar Apr Ma y Jun Jul Aug Sep Oct Nov Dec Aitchison Distance from Mean Aitchison distance from mean composition by calendar month (red diamonds = monthly means) Seasonal Pattern in Compositional De viation: EMEA Figure 4: Seasonal pattern in comp ositional deviation for EMEA. Boxplots sho w Aitchison distance from mean comp osition by calendar month; red diamonds indicate monthly means. Spring and early summer mon ths exhibit greater comp ositional dispersion than autumn, motiv ating the seasonal precision sp ecification in our BD ARMA mo dels. substan tially improv es forecast accuracy . 5. Results 5.1. Mo del Sele ction W e estimate BD ARMA mo dels with v arying autoregressiv e ( P ∈ { 0 , 1 , 2 } ) and moving a verage ( Q ∈ { 0 , 1 } ) orders for each destination region. All mo dels use the ILR transfor- mation and include F ourier terms ( K = 6 harmonics) for b oth the mean comp osition and the precision parameter. T able 2 rep orts LOO-CV results for EMEA, our primary analysis region. The BD ARMA(1,1) sp ecification achiev es the highest ELPD across all destination re- gions, indicating that b oth autoregressiv e and mo ving av erage comp onen ts contribute to forecast p erformance. The inclusion of the MA(1) term consistently impro ves mo del fit, sug- gesting that comp ositional sho c ks hav e effects that p ersist b ey ond what the AR dynamics alone capture. Figure 5 visualizes the LOO comparison for EMEA. 15 T able 2: Mo del Comparison via LOO-CV for EMEA Mo del ELPD SE p loo ∆ ELPD BD ARMA(1,1) 1450.0 34.6 153.0 0.0 BD ARMA(2,1) 1433.6 38.3 187.8 − 16 . 4 BD ARMA(2,0) 1390.7 37.5 160.4 − 59 . 3 BD ARMA(1,0) 1341.4 41.4 134.2 − 108 . 6 BD ARMA(0,1) 1292.0 36.4 123.0 − 158 . 0 Note: ELPD = exp ected log p oin twise predictiv e density (higher is b etter); p loo = effectiv e n umber of parameters; ∆ ELPD = difference from b est mo del. All mo dels use ILR transformation with K = 6 F ourier harmonics for b oth mean and precision. BD ARMA(0,1)_ilr BD ARMA(1,0)_ilr BD ARMA(2,0)_ilr BD ARMA(1,1)_ilr BD ARMA(2,1)_ilr 1300 1400 1500 1600 ELPD−LOO Expected log pointwise predictive density (higher is better) Model Comparison via Leave−One−Out Cr oss−V alidation Figure 5: Mo del comparison via leav e-one-out cross-v alidation for EMEA. P oints indicate p osterior mean ELPD; error bars show ± 2 standard errors. The BDARMA(1,1) specification ac hieves the highest exp ected log predictive density . 16 5.2. F or e c ast A c cur acy W e ev aluate forecast accuracy using rolling origin ev aluation with a 3-mon th forecast horizon. Rolling origins b egin in Jan uary 2022 and pro ceed in 3-month increments through Octob er 2024, yielding 15 forecast origins with 45 total forecast observ ations p er destination. T able 3 presen ts the mean absolute error (MAE) for each metho d across destination regions. BD ARMA ac hieves the lo west av erage MAE across all destinations (0.0072), out- p erforming ETS (0.0073), SARIMA (0.0079), and naïv e forecasts (0.0080). F or EMEA, BD ARMA ac hieves MAE of 0.0055, representing 23% low er error than naïve forecasts (0.0072) and 6% lo wer than SARIMA (0.0059). T able 3: F orecast A ccuracy: Mean Absolute Error by Destination Region Mo del EMEA NAMER AP A C LA T AM A v erage BD ARMA (ILR) 0.0055 0.0018 0.0122 0.0092 0.0072 SARIMA (ILR) 0.0059 0.0019 0.0154 0.0085 0.0079 ETS (ILR) 0.0066 0.0020 0.0136 0.0070 0.0073 Naïv e 0.0072 0.0019 0.0124 0.0104 0.0080 Rolling Mean 0.0070 0.0028 0.0202 0.0106 0.0101 Seasonal Naïv e 0.0086 0.0038 0.0326 0.0115 0.0141 Note: MAE computed as the mean absolute error av eraged across comp onen ts and forecast horizons. Bold indicates best p erformance for each destination and o verall. Rolling ev aluation uses origins from January 2022–Octob er 2024 with 3-month forecast horizon. The relativ e p erformance of metho ds v aries systematically across destinations. BDARMA excels for EMEA and AP A C, where comp ositional dynamics are rich—these regions feature m ultiple origin mark ets with shares b et ween 5–25%, creating scop e for autoregressive pat- terns to improv e forecasts. F or NAMER, where U.S.-origin b ookings dominate at ov er 80%, the comp osition is nearly constan t and all metho ds p erform similarly . F or LA T AM, ETS ac hieves the low est MAE, suggesting that smo oth trend dynamics dominate the autoregres- siv e patterns that BDARMA targets. Figure 6 summarizes the forecast accuracy comparison for EMEA, showing BDARMA’s consisten t adv an tage o ver b enc hmarks. 17 0.0055 0.0059 0.0066 0.0070 0.0072 0.0086 SNaive Naive Rolling Mean ETS (ILR) SARIMA (ILR) BDARMA (ILR) 0.0000 0.0025 0.0050 0.0075 MAE Mean Absolute Error (lower is better) Forecast Accuracy Comparison: EMEA Figure 6: F orecast accuracy comparison for EMEA destination. BDARMA achiev es the low est mean absolute error, follow ed by SARIMA and ETS. Seasonal naïve p erforms po orly due to pandemic-induced structural breaks that in v alidate same-month-last-y ear patterns. T able 4 examines forecast accuracy b y horizon for EMEA. BD ARMA maintains its ad- v antage at horizons 2 and 3, with SARIMA slightly outp erforming at h = 1 . T able 4: F orecast A ccuracy b y Horizon for EMEA Horizon BDARMA SARIMA ETS Naïv e SNaïv e h = 1 0.0050 0.0048 0.0051 0.0054 0.0094 h = 2 0.0057 0.0067 0.0067 0.0075 0.0089 h = 3 0.0058 0.0062 0.0080 0.0087 0.0074 Note: Bold indicates b est p erformance at each horizon. A notable finding is BD ARMA’s strong p erformance in NAMER at short horizons (T a- ble 5). Despite the region’s near-constan t comp osition, BDARMA ac hieves the lo w est MAE at h = 1 (0.00098) and h = 2 (0.00161), outp erforming all b enchmarks. This suggests that ev en in lo w-v ariation settings, the mo del captures subtle dynamics that simple forecasts miss. 5.3. Statistic al Signific anc e T able 6 reports Dieb old-Mariano test results comparing BD ARMA forecasts against each b enc hmark for EMEA. BDARMA significantly outp erforms naïv e forecasts ( p = 0 . 036 ) and 18 T able 5: F orecast A ccuracy b y Horizon for NAMER Horizon BDARMA SARIMA ETS Naïv e SNaïv e h = 1 0.0010 0.0013 0.0010 0.0010 0.0041 h = 2 0.0016 0.0018 0.0019 0.0019 0.0036 h = 3 0.0028 0.0026 0.0030 0.0028 0.0038 Note: Bold indicates b est p erformance at each horizon. seasonal naïv e ( p = 0 . 027 ). The improv emen t ov er ETS is marginally significant ( p = 0 . 081 ), while the comparison with SARIMA is not statistically significan t ( p = 0 . 329 ). T able 6: Dieb old-Mariano T ests for EMEA (H 1 : BD ARMA has low er error) Comparison DM Statistic p -v alue Significan t BD ARMA vs. Naïve − 1 . 84 0.036 Y es BD ARMA vs. SNaïve − 1 . 99 0.027 Y es BD ARMA vs. ETS − 1 . 43 0.081 No BD ARMA vs. SARIMA − 0 . 45 0.329 No Note: One-sided tests at α = 0 . 05 . See App endix Appendix A for implementation details. A cross all destination regions, BDARMA significantly outp erforms seasonal naïve ( p < 0 . 05 ), reflecting the breakdown of ann ual seasonal patterns during the pandemic recov ery p eriod. F or AP A C, BDARMA sho ws marginally significan t impro v ement o ver SARIMA ( p = 0 . 075 ), while comparisons with naïve and ETS are not significan t. 5.4. F or e c ast Visualization Figure 7 displays BD ARMA forecasts against actuals for EMEA, fo cusing on the four largest origin mark ets (F rance, Great Britain, Germany , and the United States). The mo del captures the p ost-pandemic recov ery dynamics, with forecast in terv als (80% credible regions sho wn as shaded bands) pro viding principled uncertain ty quan tification deriv ed from the Diric hlet predictive distribution. 19 10% 20% 30% 40% Mar 2017 Sep 2017 Mar 2018 Sep 2018 Mar 2019 Sep 2019 Mar 2020 Sep 2020 Mar 2021 Sep 2021 Mar 2022 Share of Bookings Origin FR GB DE Other Model: BD ARMA(2,1)_ilr | Solid: histor y , Dashed: forecast, P oints: actual BD ARMA Forecasts vs Actuals: EMEA Figure 7: BD ARMA(1,1) forecasts versus actuals for EMEA. Solid lines sho w historical comp ositions; dashed lines sho w p oint forecasts; shaded regions indicate 80% prediction interv als; p oin ts sho w realized v alues. The mo del captures the post-pandemic stabilization of origin mark et shares. 5.5. Comp onent-L evel A c cur acy T able 7 rep orts MAE by origin market comp onen t for EMEA. BDARMA achiev es the b est accuracy for the three largest origin markets: F rance (28% impro vemen t o ver naïve), Great Britain (51% improv emen t), and the United States (34% improv emen t). These substantial gains for ma jor comp onents drive BDARMA’s ov erall adv antage. 5.6. Pandemic Structur al Br e ak Figure 8 illustrates the p andemic’s impact on origin mark et comp ositions b y plotting deviations from pre-pandemic baseline levels (January 2019–F ebruary 2020 a verage) for the three most-affected origin mark ets in each destination region. The figure rev eals substan tial heterogeneit y in how the pandemic reshap ed tourism flo ws. AP AC exp erienced the most dramatic comp ositional shift: Chinese outb ound trav el col- lapsed b y ov er 30 p ercen tage p oin ts as China maintained strict trav el restrictions, while South K orean and Australian origin shares increased to partially fill the gap. EMEA saw a 20 T able 7: Comp onen t-Level MAE for EMEA Comp onen t Naïv e SNaïv e Rolling ETS SARIMA BDARMA FR 0.0127 0.0178 0.0122 0.0148 0.0103 0.0092 GB 0.0136 0.0073 0.0075 0.0083 0.0098 0.0067 DE 0.0056 0.0063 0.0056 0.0049 0.0043 0.0053 US 0.0064 0.0150 0.0100 0.0069 0.0078 0.0042 ES 0.0025 0.0030 0.0025 0.0025 0.0029 0.0024 IT 0.0036 0.0030 0.0025 0.0040 0.0020 0.0032 NL 0.0030 0.0018 0.0016 0.0015 0.0021 0.0015 Other 0.0100 0.0142 0.0139 0.0097 0.0077 0.0091 Note: Bold indicates b est p erformance for each comp onent. BDARMA ac hieves the best MAE for four of eight components (FR, GB, US, ES, NL tied with ETS), with particularly strong gains for the three largest origin markets. surge in F rance-origin b o okings of nearly 25 p ercen tage p oints during the initial lo c kdo wn p eriod, reflecting increased within-region trav el when international b orders closed. NAMER, already dominated b y U.S.-origin b ookings, sa w this dominance in tensify b y an additional 15 p ercen tage p oin ts as Canadian cross-b order trav el declined. LA T AM exhibited a temp orary spik e in Brazil-origin b o okings follow ed b y gradual normalization. The po or performance of seasonal naïve forecasts across all regions (T able 3) reflects this structural break: using same-mon th-last-y ear v alues fails when the underlying compositional regime has shifted. BD ARMA’s autoregressiv e structure allows it to adapt to the new regime while still lev eraging historical patterns through the F ourier seasonal terms. 6. Discussion 6.1. Summary of Findings Our analysis demonstrates that BDARMA mo dels achiev e the lo w est av erage forecast error across all destination regions, with particularly strong p erformance for destin ations exhibiting meaningful comp ositional dynamics. F or EMEA, BDARMA achiev es 23% low er forecast error than naïve metho ds, with statistically significant impro vemen t ( p = 0 . 036 ). The model also significantly outp erforms seasonal naïv e across all regions, reflecting its 21 LA T AM NAMER AP AC EMEA 2018 2020 2022 2024 2026 2018 2020 2022 2024 2026 −10% 0% 10% 20% −5% 0% 5% 10% 15% −20% 0% 20% −10% 0% 10% Change in Share (percentage points) Origin BR CA CN FR KR MX Other US Change in share relative to J an 2019 − Feb 2020 baseline (top 3 most−affected origins per region) Pandemic Impact on Origin Market Composition Figure 8: Pandemic impact on origin market comp osition by destination region. Lines show changes in mark et share relative to the January 2019–F ebruary 2020 baseline for the three most-affected origin markets in eac h region. The v ertical dashed red line indicates March 2020 (WHO pandemic declaration). Note the heterogeneous responses: AP AC saw Chinese share collapse b y 30 p ercen tage p oin ts; EMEA experienced a F rance-origin surge of 25 percentage p oin ts; NAMER’s U.S.-origin dominance intensified; LA T AM sho wed temp orary Brazil-origin gains follo wed b y normalization. 22 abilit y to adapt to regime changes while still capturing underlying temp oral patterns. A k ey metho dological finding is the imp ortance of seasonal precision. By allowing the Diric hlet concentration parameter to v ary with F ourier seasonal terms, we capture the em- pirical pattern documented in Figure 4: comp ositional volatilit y differs systematically across mon ths, with spring and early summer sho wing greater disp ersion than autumn. This sp ecifi- cation substantially impro v ed forecast accuracy compared to constant-precision alternativ es, particularly for NAMER and AP AC where seasonal patterns in precision are pronounced. The BDARMA(1,1) sp ecification consistently achiev es the b est in-sample fit across all destination regions, as measured by LOO-CV, indicating that b oth autoregressiv e and mov- ing av erage comp onen ts capture imp ortan t features of comp ositional dynamics. The relativ e adv antage of BD ARMA v aries systematically with the nature of comp ositional v ariation: it excels where multiple origin mark ets comp ete with shares in the 5–25% range (EMEA, AP AC), p erforms comparably to simpler metho ds where one mark et dominates (NAMER), and is outperformed by ETS in settings with smo oth trend dynamics (LA T AM). As shown in Section 4, the HHI concentration analysis (Figure 2) helps explain this pattern: BDARMA pro vides greatest v alue for destin ations with div erse origin p ortfolios where comp ositional dynamics are meaningful. 6.2. Implic ations for Destination Management Our findings hav e sev eral practical implications for destination marketing organizations and tourism planners: Mark et-sp ecific strategies. The substantial v ariation in origin market comp ositions across destinations underscores the need for tailored mark eting approac hes. A one-size-fits- all strategy that allo cates promotional resources uniformly across source mark ets will b e sub optimal. BDARMA forecasts can inform more n uanced resource allo cation by predicting whic h origin markets are likely to grow or shrink in relative imp ortance. Crisis resp onse planning. The pandemic rev ealed ho w quickly origin comp ositions can shift when tra vel restrictions differen tially affect source markets. Probabilistic forecasts from 23 BD ARMA mo dels provide uncertaint y quan tification that supp orts scenario planning and stress testing. Destination managers can assess the likely range of comp ositional outcomes under v arious recov ery scenarios. Seasonalit y management. The F ourier terms in our BDARMA sp ecification capture regular seasonal patterns in both origin comp osition and comp ositional v olatilit y—for exam- ple, increased Europ ean trav el to Mediterranean destinations during summer months with tigh ter concentration around exp ected patterns. Understanding these patterns enables b etter alignmen t of mark eting campaigns, staffing, and infrastructure utilization with anticipated demand comp osition. Long-term strategic planning. While our forecast ev aluation fo cused on 1–3 month horizons, the BDARMA framew ork can generate longer-term probabilistic pro jections. These can inform strategic decisions ab out market developmen t, language capabilities, and part- nership strategies with origin-mark et trav el in termediaries. 6.3. Metho dolo gic al Contributions This study makes sev eral metho dological con tributions to the tourism forecasting litera- ture: First, w e demonstrate the applicabilit y of Ba y esian comp ositional time series methods to tourism demand forecasting. The Dirichlet lik eliho o d ensures coherent forecasts that resp ect simplex constrain ts, a voiding the need for p ost-hoc normalization or transformation back from unconstrained space. Second, we sho w that mo deling seasonal v ariation in precision—not just mean comp osition— substan tially impro v es forecast accuracy . This finding has implications beyond tourism, suggesting that comp ositional time series mo dels in other domains may b enefit from time- v arying concentration parameters. Third, we pro vide a systematic comparison of BDARMA against standard b enc hmarks using rolling origin ev aluation. The finding that BD ARMA ac hiev es the low est a verage error across all destination regions, and significantly outp erforms transformed approaches (ETS 24 and SARIMA on ILR data) for EMEA, demonstrates that the direct comp ositional mo deling approac h offers practical b enefits b ey ond theoretical elegance. F ourth, we do cumen t the importance of the mo ving a verage comp onen t in comp ositional forecasting. The consisten t impro vemen t from including MA(1) terms indicates that com- p ositional sho cks hav e p ersistent effects that pure autoregressive mo dels miss. 6.4. Limitations Sev eral limitations should b e ackno wledged. First, our data capture only Airbnb b ook- ings, whic h represen t a subset of total accommo dation demand. Origin comp ositions ma y differ for hotel guests or visitors staying with friends and relatives. Second, the forecast ev al- uation p erio d coincides with pandemic reco very , whic h ma y not b e representativ e of normal forecasting conditions. Third, we do not incorp orate exogenous predictors such as exchange rates, fligh t capacity , or visa p olicies, whic h could p oten tially impro ve forecast accuracy . F ourth, the aggregation to regional destinations obscures within-region heterogeneit y that ma y b e imp ortan t for lo cal destination managers. 6.5. F utur e R ese ar ch Sev eral directions for future research emerge from this study: Exogenous predictors. Incorp orating co v ariates suc h as exc hange rates, airline capac- it y , and Go ogle searc h trends could improv e forecast accuracy and enable scenario analysis. The BD ARMA framework accommo dates exogenous regressors through the X t co v ariate matrix. Finer geographic gran ularit y . Extending the analysis to coun try-lev el or cit y-level destinations w ould supp ort more targeted mark eting decisions, though data sparsit y may require hierarc hical mo deling approac hes. Com bined volume and comp osition forecasts. Integrating comp ositional forecasts with aggregate volume forecasts would yield complete predictions of arriv als by origin mark et, enabling comprehensiv e demand planning. 25 Real-time implementation. Deploying BD ARMA mo dels in op erational forecasting systems with automated up dating would maximize practical v alue for destination stakehold- ers. 7. Conclusion This pap er dev elop ed and applied Bay esian Dirichlet autoregressive mo ving a verage mo d- els to forecast the ev olving comp osition of guest origin markets using Airbnb b o oking data. Our analysis of 96 mon ths of reserv ations across four ma jor destination regions demonstrates that BDARMA mo dels achiev e the lo west a verage forecast error across all destinations, with 23% lo wer error than naïv e metho ds for EMEA and significan t improv emen ts ov er seasonal naïv e b enc hmarks across all regions. The CO VID-19 pandemic caused dramatic comp ositional shifts—most notably the col- lapse of Chinese outb ound trav el and the surge in within-region b ookings—with reco very tra- jectories that v aried mark edly across regions. Our mo dels capture these dynamics through autoregressiv e and mo ving a verage terms while the Diri c hlet likelihoo d ensures forecasts re- main v alid probability distributions. A key finding is that incorp orating seasonal v ariation in the precision parameter substan tially improv es forecast accuracy . The metho dological con tribution lies in bringing recent adv ances in Ba yesian comp osi- tional time series to tourism demand forecasting, including the nov el application of seasonal precision mo deling. The empirical con tribution do cumen ts substan tial heterogeneit y in ho w origin mark et comp ositions evolv ed during and after the pandemic, with implications for destination mark eting strategy . As tourism markets con tinue to ev olve in resp onse to c hanging tra vel preferences, eco- nomic conditions, and p oten tial future disruptions, robust metho ds for forecasting demand comp osition will remain essen tial. The BD ARMA framew ork offers a principled, flexible approac h suited to this challenge. 26 App endix A. T echnical Details App endix A.1. Center e d MA Innovations Under the Dirichlet lik eliho o d, the ra w log-ratio residual ϵ t = ILR ( y t ) − η t do es not ha ve mean zero b ecause E [log Y c ] = log E [ Y c ] for Diric hlet-distributed random v ariables. Sp ecifically , if Y ∼ Dirichlet ( ϕ µ ) , then E [log Y c ] = ψ ( ϕµ c ) − ψ ( ϕ ) , (A.1) where ψ ( · ) denotes the digamma function. This bias can distort the MA dynamics if left uncorrected. F ollowing Katz (2025), we use centered innov ations: ˜ ϵ t = ILR ( y t ) − E [ ILR ( Y t ) | µ t , ϕ t ] , (A.2) whic h ensures E [ ˜ ϵ t | µ t , ϕ t ] = 0 . The conditional exp ectation is computed b y apply- ing the ILR con trast matrix to the vector of comp onen t-wise exp ectations ( ψ ( ϕ t µ t, 1 ) − ψ ( ϕ t ) , . . . , ψ ( ϕ t µ t,C ) − ψ ( ϕ t )) ⊤ . App endix A.2. Dieb old-Mariano T est Implementation Let d t = L ( ˆ y (1) t , y t ) − L ( ˆ y (2) t , y t ) denote the loss differen tial b et ween t wo forecasting metho ds at time t , where L ( · , · ) is the comp onen t wise MAE loss. The Dieb old-Mariano statistic is DM = ¯ d ˆ σ d , (A.3) where ¯ d = n − 1 P n t =1 d t and ˆ σ d is computed using the Newey and W est (1987) heteroskedas- ticit y and auto correlation consistent (HAC) estimator with bandwidth ⌊ h 1 / 3 ⌋ to account for serial correlation induced b y multi-step forecast errors. With n = 45 forecast observ ations and h = 3 step maxim um horizon, we use bandwidth 1. Giv en the mo derate sample size, we report p -v alues from the t n − 1 distribution rather than 27 the asymptotic normal, follo wing the finite-sample correction recommended b y Dieb old and Mariano (1995). References Airbn b, Inc., 2025. Airbn b Q4 2024 shareholder letter. Inv estor Relations. URL: https: //investors.airbnb.com . Aitc hison, J., 1982. The statistical analysis of comp ositional data. Journal of the Ro y al Statistical So ciet y: Series B (Metho dological) 44, 139–160. Aitc hison, J., 1986. The Statistical Analysis of Comp ositional Data. Chapman and Hall. Aitc hison, J., Barceló-Vidal, C., Martín-F ernández, J.A., Pa wlo wsky-Glahn, V., 1992. On criteria for measures of comp ositional difference. Mathematical Geology 24, 365–379. Assaf, A.G., Li, G., Song, H., T sionas, M.G., 2019. Mo deling and forecasting regional tourism demand using the bay esian global vector autoregressive (bgv ar) mo del. Journal of T rav el Researc h 58, 383–397. A thanasop oulos, G., Hyndman, R.J., Song, H., W u, D.C., 2011. The tourism forecasting comp etition. In ternational Journal of F orecasting 27, 822–844. Carp en ter, B., Gelman, A., Hoffman, M.D., Lee, D., Go o dric h, B., Betancourt, M., Brubak er, M., Guo, J., Li, P ., Riddell, A., 2017. Stan: A probabilistic programming language. Journal of Statistical Soft ware 76, 1–32. Dieb old, F.X., Mariano, R.S., 1995. Comparing predictiv e accuracy . Journal of Business & Economic Statistics 13, 253–263. Divisek era, S., 2003. A mo del of demand for international tourism. Annals of T ourism Researc h 30, 31–49. 28 Dolnicar, S., 2019. A review of research in to paid onlin e peer-to-p eer accommo dation: Launc hing the annals of tourism research curated collection on p eer-to-p eer accommo- dation. Annals of T ourism Researc h 75, 248–264. Egozcue, J.J., P a wlowsky-Glahn, V., Mateu-Figueras, G., Barcelo-Vidal, C., 2003. Isometric logratio transformations for comp ositional data analysis. Mathematical Geology 35, 279– 300. Gneiting, T., Raftery , A.E., 2007. Strictly prop er scoring rules, prediction, and estimation. Journal of the American Statistical Asso ciation 102, 359–378. Gössling, S., Scott, D., Hall, C.M., 2020. P andemics, tourism and global change: A rapid assessmen t of covid-19. Journal of Sustainable T ourism 29, 1–20. Greenacre, M., 2021. Comp ositional data analysis. Annual Review of Statistics and Its Application 8, 271–299. Grun wald, G.K., Raftery , A.E., Guttorp, P ., 1993. Time series of con tinuous prop ortions. Journal of the Ro yal Statistical So ciet y: Series B 55, 103–116. Gutten tag, D., 2015. Airbn b: Disruptive innov ation and the rise of an informal tourism accommo dation sector. Curren t Issues in T ourism 18, 1192–1217. Hall, C.M., Gössling, S., 2022. Airbn b and the sharing econom y: A review. Current Issues in T ourism 25, 3213–3232. doi: 10.1080/13683500.2022.2122418 . Jiao, E.X., Chen, J.L., 2019. T ourism forecasting: A review of metho dological dev elopmen ts o ver the last decade. T ourism Economics 25, 469–492. Katz, H., 2024. darma: Ba yesian Diric hlet ARMA Mo dels for Comp ositional Time Series. URL: https://github.com/harrisonekatz/darma . r pac k age version 0.1.0. Katz, H., 2025. Cen tered MA Dirichlet ARMA for financial comp ositions: Theory & empir- ical evidence. URL: , . 29 Katz, H., Brusc h, K.T., W eiss, R.E., 2024. A Ba yesian Diric hlet auto-regressive mo ving a verage mo del for forecasting lead times. International Journal of F orecasting 40, 1556– 1567. Katz, H., Maierhofer, T., 2025. F orecasting the U.S. renewable-energy mix with an ALR-BD ARMA comp ositional time-series framework. F orecasting 7, 62. doi: 10.3390/ forecast7040062 . Katz, H., Medina, L., W eiss, R.E., 2025a. Sensitivit y analysis of priors in the Bay esian Diric hlet auto-regressiv e mo ving av erage mo del. F orecasting 7, 32. doi: 10.3390/ forecast7030032 . Katz, H., Sa v age, E., 2025. Slomads rising: Structural shifts in U.S. Airbn b stay lengths during and after the pandemic (2019–2024). T ourism and Hospitality 6, 182. doi: 10.3390/ tourhosp6040182 . Katz, H., Sa v age, E., Coles, P ., 2025b. Lead times in flux: Analyzing Airbn b bo oking dynamics during global upheav als (2018–2022). Annals of T ourism Research Empirical Insigh ts 6, 100185. Katz, H., W eiss, R.E., 2025. A Bay esian Diric hlet auto-regressive conditional heterosk edas- ticit y mo del for forecasting currency shares. arXiv preprint arXiv:2507.14132 . Kynčlo vá, P ., Hron, K., Filzmoser, P ., 2015. Mo deling compositional time series with vector autoregressiv e mo dels. Journal of F orecasting 34, 303–314. Li, G., Song, H., Witt, S.F., 2005. T ourism demand forecasting: A time v arying parameter error correction mo del. Journal of T rav el Researc h 44, 396–405. Li, G., Song, H., Witt, S.F., 2006. Time v arying parameter and fixed parameter linear aids: An application to tourism demand forecasting. International Journal of F orecasting 22, 57–71. 30 Li, X., P an, B., Law, R., Huang, X., 2020. F orecasting tourism demand with multisource big data. Annals of T ourism Researc h 83, 102912. doi: 10.1016/j.annals.2020.102912 . New ey , W.K., W est, K.D., 1987. A simple, p ositive semi-definite, heteroskedasticit y and auto correlation consistent cov ariance matrix. Econometrica 55, 703–708. Nieu wland, S., V an Melik, R., 2020. Regulating airbn b: Ho w cities deal with perceived negativ e externalities of short-term rentals. Curren t Issues in T ourism 23, 811–825. P awlo wsky-Glahn, V., Egozcue, J.J., T olosana-Delgado, R., 2015. Mo deling and Analysis of Comp ositional Data. John Wiley & Sons. Sainaghi, R., Mauri, A., 2022. The effects of the covid-19 crisis on airbnb: A demand-side p erspective. Curren t Issues in T ourism 25, 600–610. Sigala, M., 2020. T ourism and covid-19: Impacts and implications for adv ancing and resetting industry and researc h. Journal of Business Researc h 117, 312–321. Song, H., Li, G., 2008. T ourism demand mo delling and forecasting: A review of recent researc h. T ourism Managemen t 29, 203–220. Song, H., Li, G., 2011. T ourism demand forecasting: A review of empirical research. In ter- national Journal of F orecasting 27, 503–528. Song, H., Qiu, R.T., Park, J., 2019. A review of researc h on tourism demand forecasting: Launc hing the annals of tourism research curated collection on tourism demand forecast- ing. Annals of T ourism Researc h 75, 338–362. V ehtari, A., Gelman, A., Gabry , J., 2017. Practical ba yesian mo del ev aluation using lea ve- one-out cross-v alidation and waic. Statistics and Computing 27, 1413–1432. V ehtari, A., Gelman, A., Simpson, D., Carp en ter, B., Bürkner, P .C., 2021. Rank- normalization, folding, and lo calization: An impro ved ˆ R for assessing con vergence of mcmc. Bay esian Analysis 16, 667–718. 31 W en, J., Liu, X., Qi, H., Lo c kyer, T., 2019. F orecasting tourist arriv als using time series, artificial neural netw orks, and m ultiv ariate adaptiv e regression splines: Evidence from c hina. T ourism Managemen t 71, 1–12. Witt, S.F., Witt, C.A., 1995. F orecasting tourism demand: A review of empirical research. In ternational Journal of F orecasting 11, 447–475. W u, D.C., Li, G., Song, H., 2011. Analyzing and forecasting tourism demand in asia and the pacific. T ourism Management 33, 1489–1501. W u, D.C., Song, H., Shen, S., 2017. New dev elopments in tourism and hotel demand mo del- ing and forecasting. International Journal of Contemporary Hospitality Managemen t 29, 507–529. Zerv as, G., Proserpio, D., Byers, J.W., 2017. The rise of the sharing economy: Estimating the impact of airbn b on the hotel industry . Journal of Marketing Research 54, 687–705. Zheng, N., Cadigan, N., 2017. Dirichlet arma mo dels for comp ositional time series. Journal of Multiv ariate Analysis 158, 31–46. 32
Original Paper
Loading high-quality paper...
Comments & Academic Discussion
Loading comments...
Leave a Comment