Equal Marginal Power for Co-Primary Endpoints
The choice of sample size in the context of co-primary endpoints for a randomised trial is discussed. Current guidance can leave endpoints with unequal marginal power. A method is provided to achieve equal marginal power by using the flexibility prov…
Authors: Simon Bond
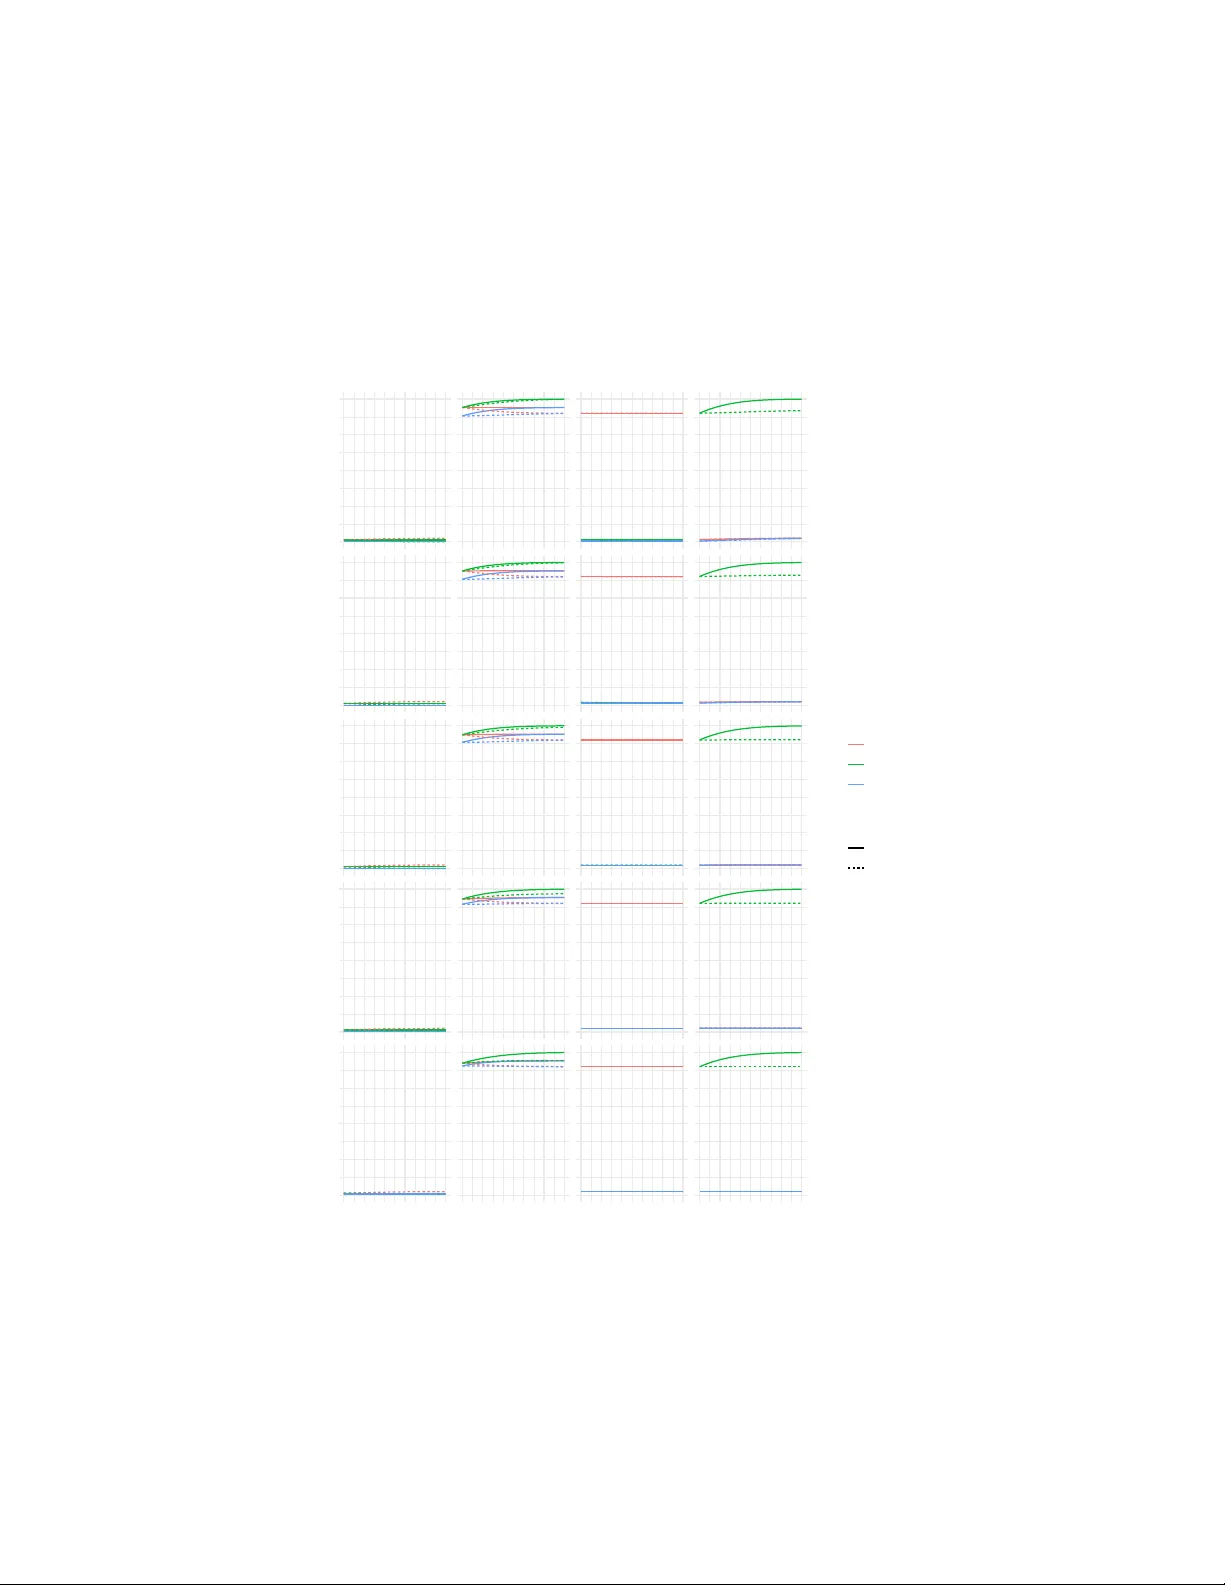
Equal Marginal P o w er f or Co-Primary Endp oin ts Simon Bond, Cam bridge Clinical T rials Unit, Cam bridge Univ ersity Hospitals NHS F oundation T rust, Cam bridg e, UK F ebruary 23, 2026 Abstract The choi ce of sa mple size in the context of co-primary endp oints for a randomised trial is discussed. Current guidance can leav e endp oints with unequal marginal p o w er. A metho d is provided to ac hieve equal marginal p ow er by using the flexibility provided in m ultiple testing pro cedures. A comparison is made to severa l choices of rule to determine the sample size, in terms of the study d esign and its operating characteristics. 1 In tro duction The liter ature on the analysis of multiple endpo int s is rich with numerous tech- niques to cont rol the t yp e 1 err or rate [6, 7, 2]. How ever the corresp o nding steps for study design, sp ecifically choo s ing the sample size is less abundant. The designation of a singular endpo int as primary implies that the choice of sample size is justified by the prop erties of the future primary analysis of the same e ndp o int ; the v as t ma jority of clinical trials use a sample siz e that pro - vides a power of 80-9 0% a s suming a minimally clinically imp ortant difference, and any o ther n uisance parameter v alues. The use of multiple endp oints a s c o- primary implies the des ir e to link the ch oice of sa mple size and a na lysis in the same wa y . Howev er rather than there just b eing 2 po ssible outcomes from one formal hypothesis test, for k co-pr ima ry endp oints there a r e 2 k combinations, and indeed 2 k sets of hypothes es rather than just the pair Null and Alternative, th us giving 2 2 k sets of consideratio ns. Guidance do es sug g est that there may b e tw o sp ecific scenario s that simplify our consider a tions: where all the co-pr ima ry endp oints m ust achiev e s ignificance to change clinical practice; where it would b e of interest should any of the endpo ints gain significance. These can b e termed the c onjunct ive a nd disjunctive alternative h yp otheses. Both focus o n a single sp ecific even t, and so the chances of it o ccur ring, as an unambiguous definition o f the p ow er , can b e calculated and used to inform the choice of sample size. Other recommendations fo cus on a simpler consideration o f the margina l chance of each endp oint achieving significance, and th us there can b e k different powers o r k different choices of sample size unless all the input parameter s 1 for each e ndpo int are iden tica l, which is highly unlikely . In which case the general guidance is to cho ose t he largest sample size o ver the differen t endpo int s. This over-powers all the other co-pr imary e ndp o int s and could b e consider ed to impo se an ordering, rather than equality , on the imp ortance of each co-primar y , which generally would not b e desir able and po tentially unethical. This paper aims to improve this last ca se, fo cus ing on the mar ginal p ow er, but us ing the extra flexibility in the ana lysis steps a llow ed by [1] as a wa y to provide equal margina l p ower and sample size across a set of multiple endpoints. W e present the mathematical a s p e cts and a lgorithm to p er form the ca lculations with an example, a long with some tables to p otentially use to lo ok up, rather than calculate, a suitable design for t wo co- pr imary endpoints as an impor - tant sp ecia l case . W e consider the o p erating characteris tics, across a r ange of sp ecifications for tw o co-prima ry endp oints. 2 Definitions and notation W e ass ume that a randomised clinical tr ial w ants to have a set of k co- primary endpo ints, each g iven the index i . Eac h endp oint has its own pair of minimally clinically impo rtant differences δ i and standard deviation σ i . W e fo cus o n the canonical cas e of contin uo us endpo ints with nor mally distributed z-statistics, as inference o n the v ast ma jority of endpo ints used, including binary and time-to- even t, will b e well approximated by this distribution as justified by the cen tral limit theorem. W e take the st andar dise d tre atment effe ct to be | δ i | /σ i . 3 No v el Metho d A m ultiple testing pro cedure needs to be sp ecified that alters the nominal signif- icance level used in each endpo int’s hypothesis test, alo ng with a set o f steps to determine which subset of e ndp o int s has achiev ed statistica l significance. The rationale is the need to preser ve the ov era ll family-wise err or rate to a fixed level α , typically 5%, under the globa l n ull hypothesis. Such a constr aint can be criticized but crucially is a r equirement set by regula to ry b o dies [6] for piv otal clinical trials. F o llowing the g e neral graphica l appr oach [1], w e form a graph with no des for each endp oint and form pairs of a rrows in b oth direc tions b etw een every pairwise co m bination, with eq ua l sha r ing o f trans ference o f α. But we only constrain the initial choice of nominal significance levels α i to sum to α the ov era ll family-wise er ror rate. At each iteration o f the pro cedure we see if a ny nominal p-v alues are below t heir nominal significance level. If there are none the pro cess s tops. Otherwise we reject o ne of these hypotheses and tra nsfer their nominal significance to the other hypotheses ’ no des using the pr op ortion stated on any arr ows leaving the r ejected no de, which is deleted from the diagram. The order in whic h r ejected hypotheses a re deleted do es not matter, as pr ov en in the origina l pap er. 2 H 1 α 1 H 2 α 2 H 3 α 3 1/2 1/2 1/2 1/2 1/2 1/2 Figure 1: Gra phica l Representation of multiple testing across three endpoints Our approach is a slig ht generalisation of the Bo nferroni-Holm metho d [3] as we start with unequal initial v alues o f α i rather tha n all eq ual to α/k . Figure 1 shows an example for three endp o ints r e presented graphica lly . The basic sa mple size formula, to achiev e a marg inal p ow er for an e ndpo int to be sig nificant at the first itera tio n of a multiple testing pro cedure is n = d ( z α + z β ) 2 σ 2 /δ 2 (1) where d is a factor that solely dep ends on the desig n of the trial (par allel or crossover, ra ndomisation ratio ), but not para meters sp ecific to the endp oint. The β gives the desired type II err o r rate, and z x is the standard no rmal inv erse cum ulative distribution function for qua nt ile x . W e cons erv atively approximate the marginal chances of significance b y the chance tha t an endp oint re aches significance on the first iteration of the algo rithm, and ignore s subsequent itera- tions; under the alter native h yp o thesis, the proba bilit y of achieving sig nifica nce at an y iteration is dominated by the first itera tion. So if we denote r i = | δ i /δ 1 | σ 1 /σ i , 2 ≥ i then we can cons tr ain the n to b e equal across each end p oint with z α i + z β = r i ( z α 1 + z β ) , ∀ i > 1 . W o rking o n the s cale of the { z α 1 , . . . , z α k } ′ = z α , this is simply a line in k − dimensiona l spa ce, which can b e r epresented in vector for mat z α = λ v + v 0 , where v ′ = { 1 , r 2 , . . . , r k } , v 0 ′ = { 0 , ( r 2 − 1) z β , . . . , ( r k − 1) z β } , 3 The other constraint is P i Φ( z α i ) = α, s o the pro blem reduces to a one- dimensional equation in ter ms of λ. The ro ot can be found using the Newton- Raphson metho d, iteratively mapping until conv erge nc e λ 7→ λ − X i Φ( z α i ( λ )) − α ! / φ φ φ ( λ ) ′ v where φ φ φ ( λ ) has i th comp onent φ ( z α i ( λ )), and Φ and φ ar e the CDF a nd density functions o f a standard normal. Simple a pplication of the intermediate v a lue theorem, pr ov es a r o ot exists as all the elements of v a re po sitive s o we can take large neg ative and p ositive v alues for λ to give oppo site sig ns to the constraint equation. This metho d provides an appr oximately equal ma rginal p ow er for each end- po int under their individual alterna tive h yp o theses, and works by using the flexibility in the initial choice o f nominal significance levels for each endpo int, whilst satisfying tw o constra ints of meeting a fixed family-wise e r ror rate, and having a single v alue for the sample size as required prac tica lly when running a randomisatio n trial. 4 Example W e present an ex ample with 4 co-primary endp oints, a nd use a set of r v alues { 1 . 2 , 1 . 3 , 1 . 5 } with a power of 9 0 %, 1-sided FWER of 5 %, and solve for λ. R co de is supplied as supplementary materia l. The resulting z α = {− 1 . 78 , − 2 . 39 , − 2 . 70 , − 3 . 31 } , w hich equates to α α α = { 0 . 037 6 , 0 . 00 84 , 0 . 0035 , 0 . 00046 } . This follows the intuit ion that the endp oints with the bigger sta ndardised effect size ha ve smaller adjusted α i , as they would be ov er-p ow e r ed with equal α i , and inv ersely the under -p ow er endpo ints with smaller standardised effect sizes are b o osted by having a more generous α i but a relatively mo dest increa se in s ample size. T able 1 consider s the sp ecific ca se o f tw o co-pr imary endp oints, which are the ma jority o f real-life examples. It takes the cases of 1-s ided α = 0 . 05 , 0 . 025, and power 80% and 90%, ac r oss a grid of v a lue s for r 2 , whic h is now s implified in notation to r . The output is • the initial α 1 v a lue, from which α 2 can b e obtained by subtra c tion • the equal sample size needed, sca led b y dσ 2 /δ 2 as per equation (1). The actual equa l sample size needed will dep end o n the absolute, rather than relative, v alues of the standar dised effect s iz e, and the nature of the trial design, as per eq uation (1). 5 Conjunctiv e and Disjunctiv e p o w er The same concept of o ptimally splitting up the α unequally to minimise the sample size needed to reach a given power fo r conjunction or disjunctive defi- 4 r α = 2 . 5% α = 5 % Po wer=80% Po wer=90% P ower=80% P ower=90% 1.1 1.7 1, 8 .76 1.77, 11.46 3.26, 7.21 3.38, 9.67 1.2 2.0 6, 8 .31 2.14, 10.94 3.89, 6.79 4.06, 9.15 1.3 2.2 8, 8 .07 2.35, 10.68 4.34, 6.52 4.52, 8.85 1.4 2.4 , 7.94 2.45, 10.57 4.64, 6.36 4.78, 8.69 1.5 2.4 6, 7 .89 2.48, 10.53 4.82, 6.27 4.91, 8.62 T able 1: Splitting α as a function o f relative standar dised effect sizes for t wo co-primar y endp oints. Number on the left is α 1 , and on the right is nδ 2 / ( dσ 2 ) nitions of p ow er ca n b e applied. The R pa ck age m v tnorm provides a quantile function qmvnorm, that calcula tes eq ui-co ordina te quantiles of a multiv aria te normal with arbitra ry mean a nd co v a riance matrix, where the even t can either be the upper tail or lower tail. The disjunctive pow er can b e calcula ted exactly by only considering the firs t iteration of the multiple testing pro cess, as if a ll endp oints are non-significant initially then we hav e type I I er ror under the a lternative hypothesis, a nd so the power is the pro bability of the co nverse. So assuming, without loss of generality , the direction of the alternativ e h yp othesis is p ositive, w e find the low er tail equi- co ordinate q uantile for β , with mean z α σ /δ and cov ar iance of the endp oints’ correla tion matrix with rows and co lumns scaled by σ / δ . It can easily b e shown that this quantile equates to − √ n. F o r the conjunctiv e power, the region of all endpo int s b eing s ignificant is the upper c orner of the sample space, which is t he region where all are significant on the first iteration, plus sma ll reg ions with both upp er and low er bo unds on all but one of the endp oints. As an approximation, a nd for feasibilit y of computing, we just lo o k a t the fir st itera tion. Here a very similar quantile calculatio n is needed, but with the uppe r tail used, and the quantile b eing for 1 − β . Minimising n ov er the choice o f the z α i is appr oached using numerical op- timisation routines that include the co nstraint P i Φ( z α i ) = α. The R pack a ge nloptr pro vides tools to do this based on [4] and the NLOPT LN C O BYLA metho d [5] conv erg ed without the need for functions to ca lculate deriv atives. The co njunctive and disjunctive p ow er calculations do req uire the correlation matrix to b e spe cified as an assumption, whic h is a weakness compared to the marginal p ow er a pproach, a s there may be little to no evidence to infor m such v a lues at the time of designing a study . 6 Op erating Characteristics 6.1 Sample Size Figure 2 shows the samples size , sca le d by dσ 2 /δ 2 , fro m different rules for k = 2 as the ra tio of effect s izes v aries: using an equal marginal p ow er a nd n acr oss co-primar ies; showing the maximum and minimum n from ea ch endpo int for an 5 equal α. ; using co njunctive and disjunctive p ow er assuming a corr elation o f 0 . 3. It shows that the equal p ower rule r eaches an as y mptote for effect size ra- tios larger than a round 1.5. The gap b etw ee n the smaller and larger n fro m equal alpha howev er keeps on g rowing with the endp oint with the larger effect size be ing ov er -p ow er ed. The disjunctiv e pow er requires the s mallest sample size, as it is dominated by the endpo int with the lar gest effect size, and also adds in the chance of other endpo ints r eaching significance as well. As the ratio increase this dominance gr ows further, a nd is pa ralleled in terms o f the a lpha being split mostly to the endp oint with the larger s tandardised effect siz e. The conjunctive pow er initially starts with the highest p ow er, as it is the most strin- gent combination of even ts, but decrea ses and then conv erges with the equal n rule based o n the mar ginal pow ers as p er section 3. Bo th the conjunctive a nd marginal p ow er is splitting the a lpha mostly to the endpo int with the smaller standardised effect s ize . O verall the equal marg inal power a pproach reaches a go o d compromise b etw een the rules consider ed. 6.2 P ow er unde r alternativ e h yp otheses The ob jective of this se c tio n is to conv ey the chances of the different p ossi- ble outcomes from hypothesis testing , using exact calculations, compar ing the equal alpha and equa l p ower rules. The para meter s outside of the control of the study desig n are the r elative effect sizes, and the cor r elation. W e ar e consider- ing the sp ecific ca se o f tw o co-primar y endp oints as this is the mos t common case, and a lso the num b er of pos s ible outcome co mbinations g rows to o la rge to provide a ny general insigh t for three or more endp oints. On this last p oint, even with a sample space of four m utually exclusive outco mes , in terms of whic h of the tw o endp oints achiev e statistical s ig nificance (neither, b o th, exclusively one endpo int) , the asso ciated sigma -algebra o f ev ents is siz e 16. So we hav e simplified to only pr esent the mar ginal even t for ea ch endp oint (the union of bo th ac hieving s ignificance and just that endp oint), and b oth together lab elled as ”co njunctive”. Most other even ts of in terest could b e quantified using basic probability calculus. Considering figur e 2 we can see that the rule based on the conjunctive power starts as the larg est n, falls b elow the equal alpha rule, and even tually converges to the equal p ow er rule. Hence there is little insight to b e gained fro m including it in this exer c is e. The disjunctive p ow er a nd using the s ma llest sample s ize across endp oints us ing equal a lpha, all fo cus the p ow er on the endp oint with the lar g est effect size, and would under -p ow er all o ther endp oints, so these are also not considered, as they would b e of little prac tica l v alue. Figure 3 is showing a lar ge amoun t of infor ma tion • The columns of the grid are showing four combinations of pairs of treat- men t effect v alues: – Nul l where b oth are zero – Both where the alter na tive h y p o thesis holds for b oth endp oints 6 – One and Two where the a lternative hypotheses holds for one end- po int a nd the n ull for the o ther. O ne is the endpoint with the smaller effect size, and Two is the endp oint with the large r effect deter mined by the ratio para meter r . • the rows of the grid show different v a lues o f the corr elation betw ee n the t wo endp oints, going fr o m -0.8 to +0.8. • The colour s o f the lines re present an outcome fro m the multiple testing: marginally gaining significance for each endpoint, and both endp oints si- m ultaneously reaching sig nifica nce. • the t yp e of line, das hed or solid tells us how the s ample siz e and splitting of the to ta l α was achiev ed, using a target p ow er of 9 0% and 1 -sided 2.5% family-wise significance. • the horizontal axis gives r the r atio of the effect size betw ee n the tw o endpo ints • the vertical axis g ives a pr obability of the outco me. Ther e is a black reference line at 0.9, to compar e to the targ et power. The pro babilities are calc ulated using the biv aria te normal, ev aluating nu- merically the pr obabilities of the biv ar iate z-statistic falling in the re c tangular regions cor resp onding to the multiple testing outcomes and c hoice of α. R co de is supplied in supplement ary material. Examining figure 3 we conclude v arious key points. • The probabilities reach an asymptote a t ar ound a ratio o f 1 .5, or are flat. • The cor relation has o nly a mino r effect with small differences only visi- ble in the Both co lumn where the alternative hypothesis holds fo r b oth endpo ints. • The type 1 error probability is well co ntrolled whenever the strong or weak nulls hold, thus co nfirming the prop erties of the m ultiple testing rules, which ar e not dep ending on sample size. • When only the e ndp o int with the smaller effect size, One is non- z ero, the power prop erties ar e simila r for the tw o se ts of r ules for sample siz e and α . How ever fo r the equiv ale nt for the larg er Two , the equal α is over- powered, with an unnecessar y larg er sample s ize but the equa l p ow e r is only slightly in excess of the ta r get p ower. • When b oth endp oints a re no n-zero, the chance o f b o th achieving signif- icance is close to the target p ower, a nd thus the mar ginal p ow ers a r e in excess of the targ et p ow e r. 7 7 Conclusions The metho d provides a pra c tical and rea dily applicable to o l for the choice of sample size when using co-pr imary endp oints and desire is to achiev e equal marginal pow er across the endp oints when the standardised effect size differ betw een endpoints. The resulting c hoice of sample, in the case of t wo co-primary endpo ints only v ar ie s b etw een a ratio 1 to 1.5 b etw een the effect sizes, and is near constant f or higher ratios, a s seen in figur e 2. The op er ating c haracter is tics are go o d and succes sfully av oid the endp oints with the la rger effect sizes b eing ov er- powered as would be the case when using a equal-a lpha B o nferroni-Ho lm metho d for mu ltiple adjustment and tak ing the maximum sample size. References [1] F rank Bretz, W illi Maurer , W erner Br annath, and Martin P o sch. A gra phical approach to sequentially rejective multiple test pro cedure s . Statistics in Me dicine , 28(4):586 –604 , 20 09. [2] T oshimitsu Ha masaki, Scott R. Ev ans , and Koko Asak ur a. Design, data monitoring, a nd ana lysis of clinical trials with co-prima ry endp oints: A review. Journal of Biopharmac eut ic al Statistics , 28(1):28 –51, 2018. PMID: 29083 951. [3] Sture Holm. A simple s equentially rejective m ultiple test pr o cedure. Sc an- dinavian Jou r n al of Stat ist ics , 6(2):65 –70, 1 979. [4] Steven G. Jo hnson. The NLo pt nonlinear-o ptimization pack a g e. ht tps://github.com/stevengj/nlopt, 20 07. [5] M. J. D. Po well. A direct search optimization metho d that mo dels the ob jective and co nstraint functions by linear in ter p olation. In S. Gomez and J.-P . Hennart, editor s, Ad vanc es in Optimization and Numeric al Analysis , volume 275 of Mathematics and Its Applic ations , page s 51– 67. Springer, 1994. [6] U.S. F o o d and Drug Administration. Multiple endp oints in clinical tria ls guidance for industry , 2022. [7] Victoria Vick er s taff, Rumana Z. Omar, and Gareth Ambler. Methods to adjust for multiple co mpa risons in the analysis and sample size calculation of randomised controlled trials with multiple primary outcomes. BMC Me dic al R ese ar ch Metho dolo gy , 19(1), 2019. 8 5 10 15 1.0 1.5 2.0 2.5 3.0 r n ( d σ 2 δ 2 ) R ule Equal n Equal alpha max n Equal alpha min n Disjunctive Power Conjunctive Power Figure 2: Comparing the sa mple sizes 9 Null Both One T wo −0.8 −0.5 0 0.5 0.8 1.0 1.1 1.2 1.3 1.4 1.51.0 1.1 1.2 1.3 1.4 1.51.0 1.1 1.2 1.3 1.4 1.51.0 1.1 1.2 1.3 1.4 1.5 0.00 0.25 0.50 0.75 1.00 0.00 0.25 0.50 0.75 1.00 0.00 0.25 0.50 0.75 1.00 0.00 0.25 0.50 0.75 1.00 0.00 0.25 0.50 0.75 1.00 r, ratio of standardised effect sizes Pr obability Outcome Marginal One Marginal T wo Conjunctive R ule Equal alpha Equal power Figure 3: Comparing the pr obability of each p oss ible outcome from testing 10
Original Paper
Loading high-quality paper...
Comments & Academic Discussion
Loading comments...
Leave a Comment