RamanSeg: Interpretability-driven Deep Learning on Raman Spectra for Cancer Diagnosis
Histopathology, the current gold standard for cancer diagnosis, involves the manual examination of tissue samples after chemical staining, a time-consuming process requiring expert analysis. Raman spectroscopy is an alternative, stain-free method of …
Authors: Chris Tomy, Mo Vali, David Pertzborn
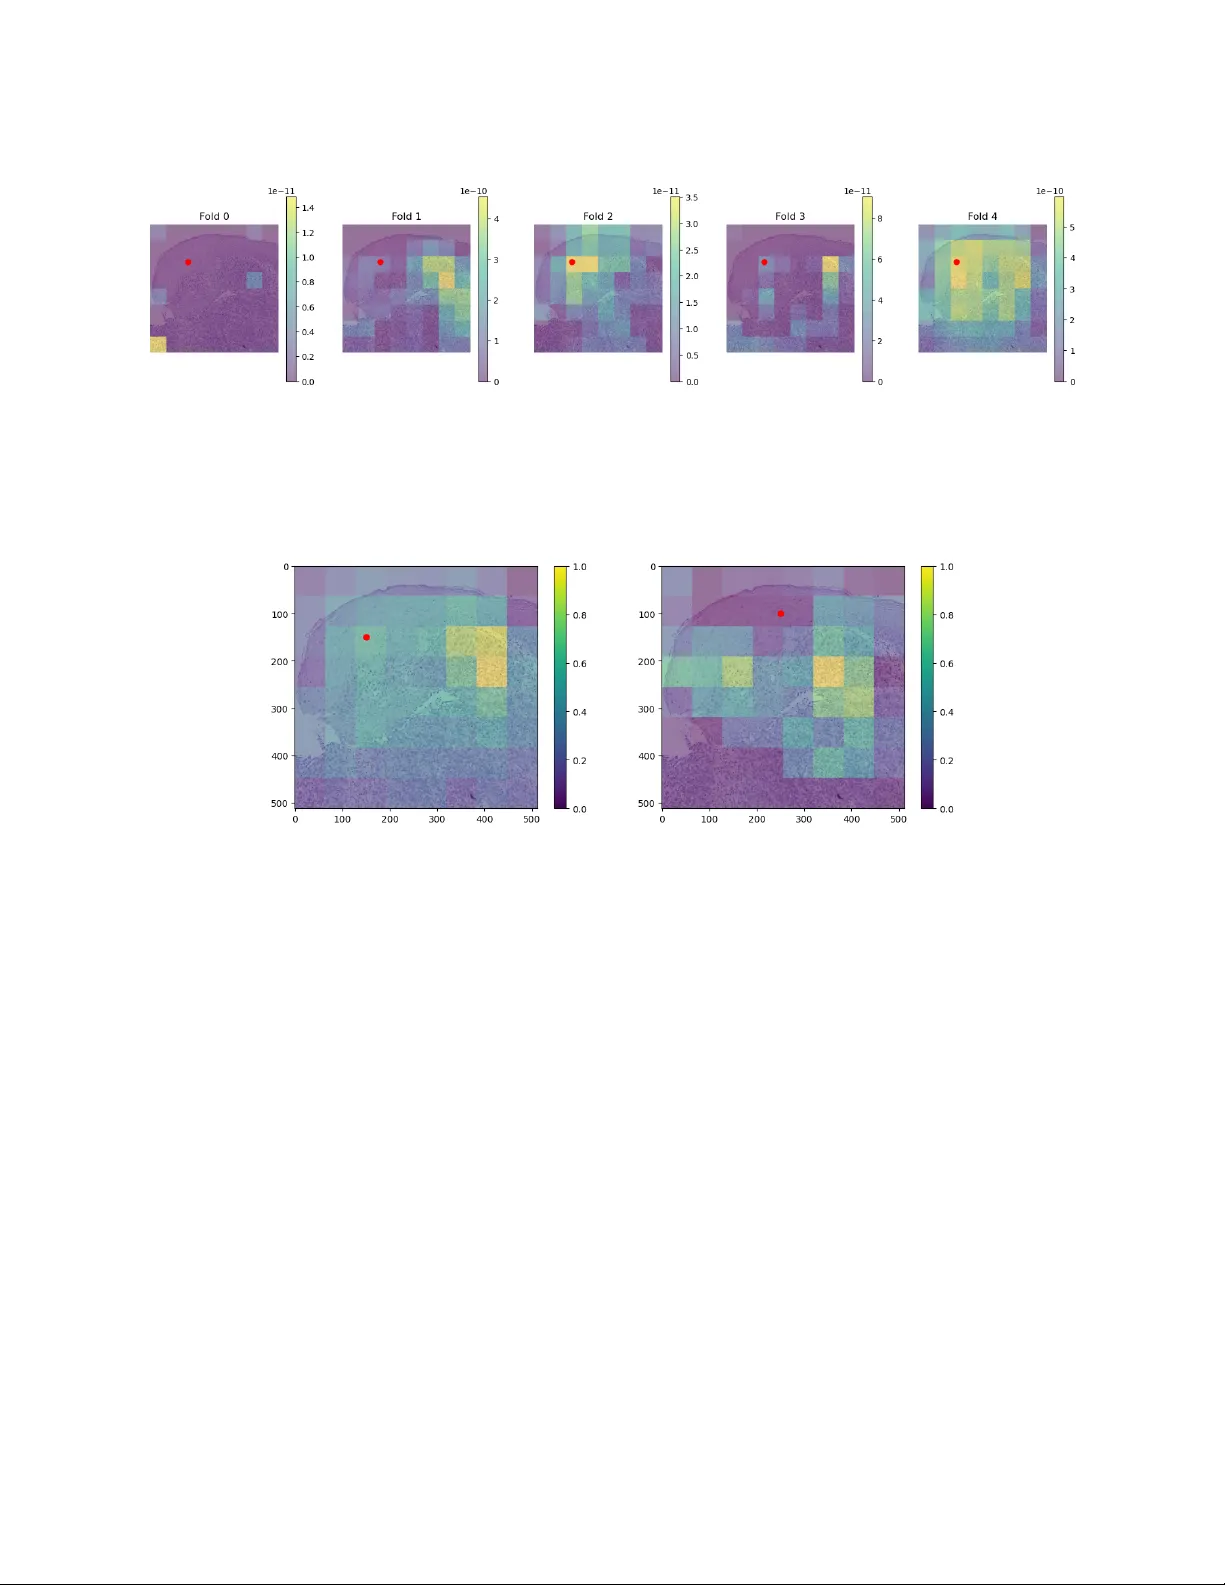
Proceedings of Mac hine Learning Research XXX, 2026 RamanSeg: In terpretabilit y-driv en Deep Learning on Raman Sp ectra for Cancer Diagnosis Chris T om y ∗ Dep artment of Computer Scienc e and T e chnolo gy, University of Cambridge, Cambridge, UK Mo V ali Dep artment of Physics, University of Cambridge, Cambridge, UK Da vid Pertzborn, T ammam Alamatouri, Anna M ¨ uhlig, Orlando Gun tinas-Lichius Dep artment of Otorhinolaryngolo gy, Jena University Hospital, Jena, Germany Anna Xylander Se ction Patholo gy of the Institute of F or ensic Me dicine, Jena University Hospital, Jena, Germany Eric Mic hele F antuzzi, Matteo Negro, F rancesco Crisafi Cambridge R aman Imaging Srl, Milan, Italy Pietro Lio, Tiago Azev edo † Dep artment of Computer Scienc e and T e chnolo gy, University of Cambridge, Cambridge, UK Abstract Histopathology , the current gold standard for cancer diagnosis, in volv es the manual examination of tissue samples after chemical staining, a time-consuming pro cess requiring exp ert analysis. Raman spectroscopy is an alternative, stain-free metho d of extracting information from samples. Using nnU-Net, we trained a segmentation model on a no vel dataset of spatial Raman sp ectra aligned with tumour annotations, ac hieving a mean foreground Dice score of 80.9%, surpassing previous work. F urthermore, we prop ose a no vel, interpretable, protot yp e-based architecture called R amanSe g . RamanSeg classifies pixels based on disco vered regions of the training set, generating a segmentation mask. Tw o v ariants of RamanSeg allow a trade-off b et ween in terpretability and p erformance: one with prototype pr oje ction and another pr oje ction- fr e e version. The pro jection-free RamanSeg outp erformed a U-Net baseline with a mean foreground Dice score of 67.3%, offering a meaningful impro vemen t ov er a black-box training approach. Keyw ords: histopathology , Raman sp ectroscop y , segmentation, in terpretability , deep learning 1. In tro duction T o com bat cancer, diagnosis is a critical first step in treatmen t. Histopathology , the examination of tissue samples, is currently the gold standard for diagnosis ( Aljehani et al. , 2023 ). T o assist insp ection, a c hemical stain is applied, for example, the hematoxylin and e osin (H&E) stain ( Chan , 2014 ). This is time-consuming. As a stain-free alternative, R aman sp e ctr osc opy directly provides molecular information by measuring scat- tered laser light from a tissue sample. While this sp ectral data is difficult to use directly , we could train deep learning models via a sup ervised training setup. Hence, this w ork utilizes a no vel dataset from the EU-funded CHARM pro ject ( CHARM ), comp osed of spatial Raman data along with tumour annotations. Previous w ork ( Hollon et al. , 2020 ) inv estigated the p erformance of a dataset comp osed of tw o p eaks of the Raman sp ectrum; for this work, we train ov er a newer dataset with 21 p eaks spread ov er the C-H str etching r e gion of the Raman sp ectrum. ∗ ct678@cantab.ac.uk † tiago.azevedo@cst.cam.ac.uk © 2026 C. T omy et al . RamanSeg W e adapted tw o existing con volutional neural netw ork (CNN) arc hitectures: U-Net ( Ronneb erger et al. , 2015 ) and ProtoPNet ( Chen et al. , 2018 ). Firstly , w e applied the nnU-Net framework to establish a strong baseline, improving on initial results with hand-written U-Net and UNet T ransformer mo dels ( Hatamizadeh et al. , 2022 ). Our nnU-Net mo del achiev ed a mean foreground Dice score of 80.9%, in contrast to a score of 72% on the previous tw o-p eak dataset. Secondly , we developed a no v el approach called R amanSe g . RamanSeg is an adaptation of the ProtoSeg architecture ( Sacha et al. , 2023 ), whic h is itself an adaptation of the ProtoPNet architecture ( Chen et al. , 2018 ). Notably , we alter the ob jective function, in tro ducing an activation overlap loss , making it more computationally efficien t to train. Additionally , our RamanSeg approac h has tw o v arian ts: one that includes a step called pr ototyp e pr oje ction , and one that do es not, represen ting a meaningful difference in p erformance and interpretabilit y . Ov erall, we mak e the following contributions: • The first successful application of a segmentation model to spatial Raman data across the entire C-H stretc hing region. Our mo del achiev ed a mean foreground Dice score of 80.9%. • An empirical demonstration that architectures with a laten t b ottlenec k (like prototype-based architec- tures) hav e the capability to generate high-quality segmentation masks. • R amanSe g , an adaptation of the ProtoSeg architecture, with an efficient, nov el ob jective function and training pro cess, exploring the potential for in terpretable segmentation mo dels on sp ectral data collected for cancer diagnosis. 2. Related W ork Early work by Mahadev an-Jansen and Richards-Kortum ( 1996 ) inv estigated the application of Raman sp ec- troscop y for tissue samples. Sp ecifically , they demonstrated that the in tensities of peaks in the Raman sp ectrum can b e used to distinguish b et w een normal, precancerous, and cancerous tissue samples. Their researc h fo cused on the fingerprin t region of the Raman spectrum, approximately betw een 300 to 1900 cm − 1 . More recent work has inv estigated using the stretching region, approximately 2800 to 3100 cm − 1 . F or example, Heuk e et al. ( 2016 ) used the stretc hing region as part of their analysis of head and nec k squamous cell carcinoma. Hollon et al. ( 2020 ) looked at t wo notable peaks within the stretc hing region, 2850 and 2950 cm − 1 : p eaks kno wn to indicate the presence of lipids and cellular regions respectively . Previous w ork in ternal to the CHARM group inv olved training a segmentation mo del using a dataset of the same t wo p eaks, o ver head and neck tissue samples. This mo del achiev ed a Dice score of 72%, and represents a useful comparison p oin t to judge our work, which instead leverages the full range of the stretching region. The abilit y to in terpret models is often a requirement for clinical deplo ymen t. T raditionally , p ost- ho c in terpretability tec hniques hav e b een used to understand CNNs. Some techniques include saliency maps ( Rudin , 2018 ) or Gradient-w eighted Class Activ ation Mappings ( Selv ara ju et al. , 2020 ). A new paradigm of pr ototyp e-b ase d mo del architectures has emerged with Chen et al. ( 2018 )’s work. The Pr o- totypic al Part Network (ProtoPNet) classifies inputs based on pr ototyp es learned from the training set. Giv en a trained ProtoPNet, the model takes an input x , maps it to a conv olutional output f ( x ) = z , and computes distances || ˜ z − p j || b et ween latent patches ˜ z and prototypes p j . These distances are inv erted to represen t similarity and are used to generate the final classification probabilities. Sacha et al. ( 2023 ) extend this idea to an arc hitecture that generates segmentation masks, called Pr otoSe g . Our work brings together ideas from early research into sp ectroscopic-based tec hniques for cancer diag- nosis, as well as this recent work making deep conv olutional mo dels in terpretable. 3. Metho d 3.1. Exp erimen tal setup Hyp erspectral dataset Tissue samples of 10 patients with Squamous C ell Carcinoma (SCC) w ere col- lected and preserved as F ormalin-Fixed Paraffin-Em b edded tissue (FFPE). Eac h FFPE sample is then sliced 2 RamanSeg in to thin sections, which are moun ted on glass slides for Raman imaging and H&E staining; in total, we used 32 samples. In the context of the EU-funded CHARM pro ject ( CHARM ), we used a stimulated Raman microscop y (SRS) s ystem ( Crisafi et al. , 2023 ) designed to o vercome the c hallenges of existing commercial SRS systems, which often limit detection to one or tw o frequencies at a time. This microscop e features an all-fib er, dual-wa velength, self-synchronized laser with a detection unit based on a m ulti-channel amplifier. This setup enables broadband SRS in the C-H stretching region, allo wing for the simultaneous acquisition of up to 38 c hannels in 400ns. F or each sample, the microscop e hardware collected 21 channels of Raman data in the C-H stretching re- gion, with eac h c hannel corresp onding to a differen t w a ven um b er within the range 2802 to 3094 cm − 1 . Hence, w e effectively hav e a vector of 21 Raman intensities for each pixel in the image, forming our main training input: ( N , C, H , W ). Additionally , the full dataset includes 24 channels made up of: 21 of the captured Raman p eaks, a transmission channel representing light intensities, a Two-Photon Excitation Fluor esc enc e (TPEF) c hannel, and a Se c ond Harmonic Gener ation (SHG) channel. TPEF is based on the absorption of t wo photons by a mole cule, whic h excites it to a higher energy state ( So et al. , 2000 ). SHG relies on the effect where t wo photons of the same frequency combine to pro duce a photon of double the frequency , useful for probing collagen structures in human tissue ( Han et al. , 2005 ). Normalization was p erformed by scaling v alues b etw een the 5th and 95th p ercentiles into a [0 , 1] range for Raman channels, and b etw een 1st and 99th p ercen tiles for TPEF and SHG c hannels. V alues outside the p ercen tile range were mapp ed to zero or one as appropriate. F urthermore, w e run k-means clustering on the H&E image to iden tify foreground pixels. Then, the mean sp ectral profile of foreground pixels is applied column-wise to correct for intensit y drifts during optical collection. P athologist annotations were provided in QuPath ( Bankhead et al. , 2017 ), which we exp orted. These included multiple classes, but w e c hose to train o ver t wo classes, with tumorous or necrotic regions mapped to the foreground class and all other tissue clas ses designated as bac kground. This was because of an imbalance of classes present in the annotations, making the binary setup more effective than k-class training. In summary , the data we used includes three k ey components: (1) the m ulti-channel, spatial Raman spec- tra of tissue samples, collected using Raman sp ectroscop y , (2) the H&E stained images of the corresp onding samples, and (3) the tumour annotations (from pathologists) which segmen t the input. Figure 1 shows these three sources for a sample from the dataset. ( a ) Raman channel ( b ) H&E staining ( c ) Annotated staining Figure 1: F rom left-to-righ t: (a) Raman intensities of approximately 2910 cm − 1 for a single sample, (b) the H&E stained image of the same sample, and (c) the H&E stained image ov erlaid with tumor annotations from pathologists. T raining Mo dels were either written in PyT orch, or using the nnU-Net library ( Isensee et al. , 2021 ). All training o ccurred on an NVIDIA L4 GPU, and for our final train, v alidation, and test splits we used 19 3 RamanSeg training samples, 8 v alidation samples, and 5 test samples. T o av oid data leak age, we group ed together samples from the same patient to b e in the same split. The U-Net ( Ronneb erger et al. , 2015 ) architecture w as implemented in PyT orch as a baseline. This featured four downsampling la yers, and we trained with a 512 × 512 patch size. Our U-Net was trained with Dice loss, using the AdamW optimizer ( Loshc hilov and Hutter , 2017 ), a learning rate of 0.0001 and weigh t decay of 0.001 . W e used data augmentation: random horizon tal flips of patches. W e also utilized the nnU-Net framework, selecting a Residual Enco der-based U-Net architecture. It featured seven downsampling stages and the framework c hose a 576 × 448 patch size. nnU-Net used a com bination of Dice loss and cross-entrop y loss, with an SGD optimizer, Nestero v momen tum set to 0.99, and a learning rate of 0.0001 . Notably , w e used nnU-Net to train fiv e folds, with segmentation masks generated as an ensemble of the mo dels. 3.2. RamanSeg Figure 2: The architecture of RamanSeg. The mo del consists of conv olutional lay ers, pro ducing laten t feature maps which are passed to the prototype la yer to generate similarit y b efore probability maps. Finally , the probabilit y map is upsampled to the original input size. (Diagram adapted from ProtoPNet ( Chen et al. , 2018 ).) While the original ProtoSeg architecture by Sacha et al. ( 2023 ) is an effective approach to protot yp e- based segmentation, we introduced a n umber of changes to the arc hitecture and training pro cess, leading to the developmen t of RamanSeg, visualized in Figure 2 . 3.2.1. Bottleneck hypothesis Similar to ProtoSeg ( Sac ha et al. , 2023 ), RamanSeg takes the latent protot yp e similarity map of shap e H d × W d × M (for M protot yp es), passes each point through a fully connected lay er, and outputs H d × W d × C probabilities for eac h class. Finally , it takes this map of p er-p oin t class probabilities and upscales it to the original input size H × W , simply through bilinear in terp olation. This means it do es not hav e a decoder: it relies on the “quality” of the latent probabilit y map to pro duce a segmentation mask. 4 RamanSeg T umour segmentation masks can b e fine-grained, so to verify if this architecture is viable for our dataset, w e devised an exp erimen t: assuming the b est p ossible b ottlenec k, compute the Dice score b et ween that upsampled b ottlenec k and ground truth mask. Sp ecifically , w e do wnsampled the ground truth mask to a smaller size (representing the p erfect H d × W d b ottlenec k), before upsampling it to the original size H × W with bilinear in terp olation. The results are in T able 1 , showing the a v erage dice score for differen t b ottlenec k sizes. While the b ottlenec k size do es impact p erformance, we generally see high Dice scores, demonstrating that the prototype-based architecture is not fundamentally flaw ed on our dataset. T able 1: Average dice scores for different bottleneck sizes. The original patch size is 512 × 512. F eature Map Size Mean Dice 512 × 512 (Baseline) 1.0000 32 × 32 0.9804 16 × 16 0.9581 8 × 8 0.9113 4 × 4 0.8356 3.2.2. Activ a tion overlap loss ProtoSeg ( Sacha et al. , 2023 ) includes a p enalt y term in the ob jectiv e function that incen tivizes protot yp es to b e div erse, but their formulation of this diversit y loss is computationally exp ensiv e. The authors use the Kullbac k-Leibler divergence to measure the difference b et ween distributions of prototype activ ations, but we instead formulate an alternativ e p enalty term, called the activation overlap loss . Firstly , the forward pass through the mo del computes a similarit y map S of shap e ( H d , W d , M ), where M is the num ber of prototypes; let S ′ b e the flattened similarit y map, i.e. ( H d · W d , M ). Eac h class has some asso ciated protot yp es (in our binary case, foreground and background), let the similarity map for protot yp es of class c b e denoted as S ′ c . The k ey part in computing our activ ation o v erlap loss is the pairwise dot product b et w een the similarit y vectors (after flattening) for each class; the activ ation ov erlap loss term L A is shown in Equation ( 1 ). L ( c ) A = P i = j S ′ ( i ) c · S ′ ( j ) c K 2 L A = 1 C X c L ( c ) A (1) This mak es computation fast as pairwise dot pro ducts are simpler than pairwise KL-divergence on “protot yp e-class-image distance v ectors” ( Sacha et al. , 2023 ). This leads to RamanSeg’s ov erall ob jective function in Equation ( 2 ): a combination of cross-entrop y , the activ ation ov erlap penalty , and an L1 p enalt y . L = αL CE + β L A + γ L L1 (2) 3.2.3. Model & training choices T o enrich the mo del with additional capacity , we include a series of tw o-dimensional conv olutions after the protot yp e lay er, with Spatial Dropout ( T ompson et al. , 2015 ) at drop out probability p = 0 . 35 b et w een them. T o improv e training stability , w e adapt the Xavier initialization scheme ( Glorot and Bengio , 2010 ) to prototype v ectors. F or a prototype vector of shap e ( D , H P , W P ), v alues are drawn from the uniform distribution defined in Equation ( 3 ). b = 1 √ D · H P · W P p ∼ U ( − b, b ) D × H P × W P (3) Selecting hyperparameters is also particularly imp ortan t for this arc hitecture, for example, the num b er of prototypes M to use. Prior work on prototype-based architectures suggest using 10 prototypes p er 5 RamanSeg class ( Chen et al. , 2018 ; Sacha et al. , 2023 ), but we hypothesized more prototypes could b e effective, given the p er-pixel binary classification setup. Fixing one v ariant of the RamanSeg architecture, w e performed a hyperparameter search ov er the num b er of prototypes, within the range [20 , 200]. Figure 3 demonstrates that increasing the num b er of prototypes p er class can offer b etter p erformance on our dataset. Leveraging Optuna ( Akiba et al. , 2019 ) for a wider hyperparameter search, our final run in Section 4 used 15 prototypes p er class. Figure 3: P erformance when only v arying the num b er of prototypes. 3.2.4. RamanSeg without projection As an alternative training approach, we prop ose pr oje ction-fr e e R amanSe g , whic h forego es the protot yp e pro jection step discussed in previous prototype-based architectures ( Chen et al. , 2018 ; Sacha et al. , 2023 ). W e make further changes to the arc hitecture under this pro jection-free v ariant: increasing the prototypes p er class to 60, reducing the num b er of channels in the add-on conv olutional lay ers (to 128), and increasing the drop out probability to 0.5. F urthermore, there are t wo changes we consider particularly imp ortan t (1) using a combined cross-entrop y loss and Dice loss ob jectiv e function, and (2) increasing the spatial size of the prototypes from 1 × 1 to 3 × 3. W e elab orate on these choices below. The standard RamanSeg training computes losses betw een the downsample d ground truth mask and laten t probabilit y map. (Note that the latent probabilit y map, the “b ottleneck”, is directly upsampled to generate the segmen tation mask — there is no learnable deco der.) Hence, cross-entrop y loss is critical to ensure the per-pixel correctness in the latent map. How ever, w e found empirically that the combined loss performs b etter in training pro jection-free RamanSeg. Secondly , we increased the spatial size of the protot yp es to represent more complex features of the input space. Hence, prototypes in pro jection-free RamanSeg hav e (64 , 3 , 3) — no longer 64-dimensional vectors. By not pro jecting prototypes to their nearest representativ e region from the training set, we allow such ric her representations. How ever, this makes prototypes more abstract, weak ening the usual interpretabilit y 6 RamanSeg guaran tees from insp ecting similarity scores (which would otherwise correspond to similarit y for sp ecific protot ypical regions). 4. Results The mean and standard deviation Dice scores of the trained mo dels on the holdout dataset is presented in T able 2 . Given the medical context, we also compute the p er-pixel sensitivity and sp ecificit y of the mo dels. The nnU-Net mo del outp erforms other mo dels, achieving a mean Dice score of 80.9%. Even with our c hallenging dataset, Isensee et al. ( 2024 )’s claim that their approac h is a “recipe” for strong performance, app ears to hold. How ever, the nnU-Net mo del faces some interpretabilit y challenges, outlined in Section 4.1 . On the other hand, pro jection-free RamanSeg achiev es a mean Dice score of 67.3%, outp erforming the baseline U-Net mo del. While omitting the pro jection step somewhat reduces in terpretability , the bottleneck approac h still provides greater interpretabilit y than traditional mo dels like U-Net, delivering a practical arc hitecture that balances interpretabilit y and p erformance. T able 2: Results of our trained mo dels on the holdout set. Mo del Dice ( ± std) Sensitivit y ( ± std) Sp ecificit y ( ± std) U-Net 66.7 ± 15.4 81.5 ± 23.6 90.9 ± 5.5 UNet T ransformer 69.8 ± 10.9 79.9 ± 18.1 92.5 ± 3.9 nnU-Net 80.9 ± 10.4 83.5 ± 14.5 95.9 ± 2.8 RamanSeg 60.5 ± 11.7 95.9 ± 3.4 79.1 ± 4.9 Pro jection-free RamanSeg 67.3 ± 8.2 70.3 ± 17.5 93.3 ± 5.5 4.1. Interpretabilit y analysis In the following sections, we inv estigate the differences in interpretabilit y b et ween the tw o mo del paradigms: the traditional CNN mo del via nnU-Net, compared to our prototype-based architecture, RamanSeg. 4.1.1. nnU-Net interpret ability anal ysis One of the behaviours w e identified was the presence of consisten t false positives when classifying regions that contain epithelial structures such as squamous epithelium. F o cusing on a single patc h of a sample with false p ositiv e predictions, we used the Captum library ( Kokhlikyan et al. , 2020 ) to apply popular post-ho c in terpretability tec hniques. Starting with Lay er Grad-CAM ( Selv ara ju et al. , 2020 ), w e computed attributions for a pixel in a false p ositiv e region (e.g., at coordinates (150,150)) with resp ect to the final 2D conv olutional lay er in the encoder. The attributions w ere computed for each of the five mo dels trained by nnU-Net and then av eraged. While the individual attribution maps for each fold sho w noticeable disagreemen t (see Figure 4 ), hinting that the 5- fold split may b e sub optimal for the av ailable data, the av eraged heatmap pro vides another explanation. As sho wn in Figure 5( a ) , the model’s confusion stems from its fo cus on the nearby tumorous region, suggesting that spatial pro ximity to the tumor is a primary cause for misclassifying adjacent epithelial tissue. This b eha viour was consistent across different p oin ts in the false p ositiv e region. T o determine which input c hannels w ere most influential in this m isclassification, we applied tw o further tec hniques. First, using Integrated Gradien ts ( Sundarara jan et al. , 2017 ), we computed the contribution of eac h of the 24 input channels to the prediction. By summing the absolute attribution v alues spatially for eac h channel, we obtained a con tribution vector c ∈ R 24 . The results in Figure 6( a ) highligh t channel 21, a transmission channel in tended for morphological context, as highly influential. Secondly , we used F eature Ablation b y masking the en tire epithelial region for each channel and measuring the resulting chan ge in the 7 RamanSeg Figure 4: Lay er Grad-CAM attribution heatmaps for each of the five cross-v alidation mo dels. Lightly coloured regions indicate p ositiv e con tributions to the model’s prediction that the red pixel at (150,150) is tumorous. ( a ) Relativ e to pixel (150,150). ( b ) Relative to pixel (250,100). Figure 5: Averaged attribution heatmaps for tw o different pixels in the false p ositiv e region. The mo del consisten tly fo cuses on the nearby ground truth tumor area as an explanation for its incorrect prediction. mo del’s output for a target pixel. This confirmed the Integrated Gradients finding: Figure 6( b ) shows that c hannel 21, along with c hannel 7, provided significan t p ositiv e evidence for the tumor class, contrary to the exp ectation that epithelial regions should provide negativ e evidence. Visual insp ection of the iden tified channels appears to corrob orate this analysis, as we noticed the epithe- lial and tumorous regions are nearly indistinguishable, particularly in channel 21. Squamous Cell Carcinoma is known for high morphological similarity b et ween tumorous and healthy epithelial regions ( Mahadev an- Jansen and Ric hards-Kortum , 1996 ). This suggests the mo del’s confusion is ro oted in the input data, where the spectral channels may b e missing k ey morphological information needed to differentiate these similar tissue types. 4.1.2. RamanSeg interpret ability anal ysis The first step is to c heck if protot yp es corresp ond to the classes they aim to represen t. F ollo wing the algorithm to identify the b ounding region for a given prototype describ ed by ( Chen et al. , 2018 ), we index into the corresp onding segmen tation mask, and compute the prop ortion of each class presen t in that section. These prop ortions are visualized in Figure 7 . Given that there are far more tumorous regions in the prototypes 8 RamanSeg ( a ) Sum of absolute In tegrated Gradien t attribu- tions for each channel on the ensem ble model. ( b ) Mean attributions from F eature Ablation on the epithelium region. Figure 6: Both Integrated Gradients (a) and F eature Ablation (b) p oin t to c hannel 21 as a key contributor to the false p ositiv e prediction. Figure 7: Class prop ortions in protot yp e regions. in tended to represen t tumour (the last fifteen protot yp es), the protot yp es learned b y our training process m ust b e meaningful. Another prop ert y we verify is the diversit y of the prototypes. The activ ation ov erlap loss w e prop ose in Section 3.2.2 should encourage prototypes to b e diverse. By plotting the inertia of k-means clustering fits for increasing k , w e can observe ho w useful additional clusters are in capturing the data. Figure 8 displays this result: given the steepness of the curve for the first fifteen fits, we can conclude that the ma jority of the 9 RamanSeg Figure 8: Inertia for each cluster fit k , along x-axis. protot yp es are diverse, represen ting differen t regions. The activ ation o verlap loss successfully encouraged protot yp e diversit y . Returning to the false p ositiv es triggered by healthy epithelium regions, while we could inv estigate in- dividual similarity scores to understand why the mo del made such a prediction, there is a simpler metho d. Observing the t yp es of protot yp es learned from Figure 7 , it is clear that the training process has not included protot yp e(s) for squamous epithelium regions, which are imp ortan t non-tumorous structures. 5. Conclusion and future w ork This pap er demonstrates the efficacy of using m ulti-channel Raman sp ectroscopy data for the seman tic segmen tation of cancerous tissue. Our primary mo del, an nnU-Net ensem ble, achiev ed a Dice score of 80.9% on the holdout set, setting the state-of-the-art p erformance on the h yp erspectral dataset. W e in vestigated the mo del’s primary failure mo de — confusion betw een tumorous and epithelial tissue — using post-ho c in terpretability metho ds. In tegrated Gradients rev ealed this confusion was largely driven b y misleading morphological similarities in the transmission channel, highligh ting the utilit y of suc h techniques for mo del debugging. T o create a more inherently in terpretable mo del, w e prop osed RamanSeg, a nov el prototype- based arc hitecture. A pro jection-free v ariant outp erformed a baseline U-Net with a Dice score of 67.3%. RamanSeg supp orted a straigh tforward w a y to understand the false-p ositiv e failure mo de: c hecking the class prop ortions of the regions of the learned protot yp es. Ac kno wledgmen ts This wor k w as supported b y EU HORIZON EUR OPE researc h pro jects TR OPHY (101047137) and CHARM (101058004). It was also supp orted by the German Cancer Aid pro ject ARBOR (Deutsche Krebshilfe Grant No. 70116061, 70116281) and F ederal Ministry of Researc h, T echnology and Space pro ject Hyp erTUM (BMFTR No. 16SV9564). 10 RamanSeg References T akuya Akiba, Shotaro Sano, T oshihiko Y anase, T ak eru Ohta, and Masanori Koy ama. Optuna: A next- generation hyperparameter optimization framework. In Pr o c e e dings of the 25th ACM SIGKDD interna- tional c onfer enc e on know le dge disc overy & data mining , pages 2623–2631, 2019. Mohammad Ra ja Aljehani, F ouad Hamed Alamri, Mohanad Emad K Elyas, Ahmed Salem Almohammadi, Ab dulaziz Saud Awad Alanazi, and Mohammed Ab dullah Alharbi. The imp ortance of histopathological ev aluation in cancer diagnosis and treatment. International journal of he alth scienc es , 7(S1):3614–3623, Jan uary 2023. P eter Bankhead, Maurice B Loughrey , Jos´ e A F ern´ andez, Yvonne Dombro wski, Darragh G McArt, Philip D Dunne, Stephen McQuaid, Ronan T Gray , Liam J Murray , Helen G Coleman, et al. Qupath: Op en source soft ware for digital pathology image analysis. Scientific r ep orts , 7(1):1–7, 2017. John K C Chan. The wonderful colors of the hemato xylin-eosin stain in diagnostic surgical pathology . International Journal of Sur gic al Patholo gy , 22(1):12–32, F ebruary 2014. ISSN 1066-8969. doi: 10.1177/ 1066896913517939. URL https://doi.org/10.1177/1066896913517939 . Epub 2014 Jan 9. CHARM. CHARM Europ ean Industrial Consortium. URL https://charm- eic.eu/ . Accessed: 2024-11-04. Chaofan Chen et al. This lo oks like that: deep learning for interpretable image recognition. In Neur al Information Pr o c essing Systems , 2018. F rancesco Crisafi, Benedetta T alone, Andrea Ragni, Gabriele Di Noia, Mujeeb Rahman, Jing He, Jeremiah Marcellino, Goutam Kar, Y arjan Samad, Boy ang Mao, Renzo V anna, F ranzisk a Hoffmann, Orlando Gun tinas-Lichius, Silvia Ghislanzoni, Italia Bongarzone, Sze Y un Set, Andrea C. F errari, Giulio Cerullo, and Matteo Negro. Plug-and-play stimulated raman microscop y system for broadband coheren t vibrational imaging. In 2023 Confer enc e on L asers and Ele ctr o-Optics Eur op e & Eur op e an Quantum Ele ctr onics Con- fer enc e (CLEO/Eur op e-EQEC) , page 1–1. IEEE, June 2023. doi: 10.1109/cleo/europ e- eqec57999.2023. 10231815. URL http://dx.doi.org/10.1109/CLEO/Europe- EQEC57999.2023.10231815 . Xa vier Glorot and Y osh ua Bengio. Understanding the difficult y of training deep feedforw ard neural net works. In Pr o c e e dings of the thirte enth international c onfer enc e on artificial intel ligenc e and statistics , pages 249– 256. JMLR W orkshop and Conference Pro ceedings, 2010. Meng Han, G ¨ unter Giese, and Josef F Bille. Second harmonic generation imaging of collagen fibrils in cornea and sclera. Optics expr ess , 13(15):5791–5797, 2005. Ali Hatamizadeh, Y uc heng T ang, Vishw esh Nath, Dong Y ang, Andriy Myronenko, Bennett Landman, Hol- ger R Roth, and Daguang Xu. Unetr: T ransformers for 3d medical image segmen tation. In Pr o c e e dings of the IEEE/CVF winter c onfer enc e on applic ations of c omputer vision , pages 574–584, 2022. Sandro Heuk e, Olga Chernavsk aia, Thomas Bo c klitz, Fisseha Bekele Legesse, T obias Meyer, Denis Akimov, Olaf Dirsc h, G ¨ un ther Ernst, F erdinand v on Eggeling, Iver Petersen, Orlando Guntinas–Lic hius, Michael Sc hmitt, and J ¨ urgen Popp. Multimodal nonlinear microscop y of head and neck carcinoma — to ward surgery assisting frozen section analysis. He ad & Ne ck , 38(10):1545–1552, 2016. doi: https://doi.org/10. 1002/hed.24477. URL https://onlinelibrary.wiley.com/doi/abs/10.1002/hed.24477 . T o dd C. Hollon, Bala ji Pandian, Arjun R. Adapa, Esteban Urias, Akshay V. Sa ve, Siri Sahib S. Khalsa, Daniel G. Eic hberg, Randy S. D’Amico, Zia U. F aro o q, Sp encer Lewis, Petros D. Petridis, T amara Marie, Ashish H. Shah, Hugh J. L. Garton, Cormac O. Maher, Jason A. Heth, Erin L. McKean, Stephen E. Sul- liv an, Shawn L. Herv ey-Jump er, P arag G. Patil, B. Gregory Thompson, Oren Sagher, Guy M. McKhann, Ricardo J. Komotar, Mic hael E. Iv an, Matija Snuderl, Marc L. Otten, Timothy D. Johnson, Michael B. Sisti, Jeffrey N. Bruce, Karin M. Muraszk o, Jay T rautman, Christian W. F reudiger, Peter Canoll, Honglak 11 RamanSeg Lee, Sandra Camelo-Piragua, and Daniel A. Orringer. Near real-time in traop erativ e brain tumor diagnosis using stimulated raman histology and deep neural netw orks. Natur e Me dicine , 26(1):52–58, 2020. ISSN 1546-170X. doi: 10.1038/s41591- 019- 0715- 9. URL https://doi.org/10.1038/s41591- 019- 0715- 9 . F abian Isensee, Paul F Jaeger, Simon AA Kohl, Jens Petersen, and Klaus H Maier-Hein. nnu -net: a self-configuring metho d for deep learning-based biomedical image segmen tation. Natur e metho ds , 18(2): 203–211, 2021. F abian Isensee, T assilo W ald, Constan tin Ulric h, Mich ael Baumgartner, Saik at Roy , Klaus Maier-Hein, and P aul F Jaeger. nnu-net revisited: A call for rigorous v alidation in 3d medical image segmentation. In International Confer enc e on Me dic al Image Computing and Computer-Assiste d Intervention , pages 488– 498. Springer, 2024. Narine Kokhliky an, Vivek Miglani, Miguel Martin, Edward W ang, Bilal Alsallakh, Jonathan Reynolds, Alexander Melnik ov, Natalia Kliushkina, Carlos Aray a, Siqi Y an, et al. Captum: A unified and generic mo del in terpretability library for pytorc h. arXiv pr eprint arXiv:2009.07896 , 2020. Ily a Loshchilo v and F rank Hutter. Decoupled weigh t decay regularization. arXiv pr eprint arXiv:1711.05101 , 2017. Anita Mahadev an-Jansen and Rebecca R Ric hards-Kortum. Raman spectroscopy for the detection of cancers and precancers. Journal of biome dic al optics , 1(1):31–70, 1996. Olaf Ronneberger, Philipp Fischer, and Thomas Brox. U-net: Conv olutional netw orks for biomedical image segmen tation, 2015. URL . Cyn thia Rudin. Stop explaining black box mac hine learning mo dels for high stakes decisions and use inter- pretable mo dels instead. Natur e Machine Intel ligenc e , 1:206–215, 2018. Mik o la j Sacha, Dawid Rymarczyk, Luk asz Struski, Jacek T ab or, and Bartosz Zieli ´ nski. Protoseg: Inter- pretable semantic segmentation with prototypical parts. In Pr o c e e dings of the IEEE/CVF Winter Con- fer enc e on Applic ations of Computer Vision , pages 1481–1492, 2023. Ramprasaath R Selv ara ju, Michael Cogsw ell, Abhishek Das, Ramakrishna V edantam, Devi Parikh, and Dhruv Batra. Grad-cam: visual explanations from deep netw orks via gradient-based lo calization. Inter- national journal of c omputer vision , 128:336–359, 2020. P eter TC So, Chen Y Dong, Barry R Masters, and Keith M Berland. Two-photon excitation fluorescence microscop y . Annual r eview of biome dic al engine ering , 2(1):399–429, 2000. Mukund Sundarara jan, Ankur T aly , and Qiqi Y an. Axiomatic attribution for deep net works. In International c onfer enc e on machine le arning , pages 3319–3328. PMLR, 2017. Jonathan T ompson, Ross Goroshin, Arjun Jain, Y ann LeCun, and Christoph Bregler. Efficient ob ject lo calization using con volutional net works. In Pr o c e e dings of the IEEE c onfer enc e on c omputer vision and p attern r e c o gnition , pages 648–656, 2015. 12
Original Paper
Loading high-quality paper...
Comments & Academic Discussion
Loading comments...
Leave a Comment