Hybrid Non-informative and Informative Prior Model-assisted Designs for Mid-trial Dose Insertion
In oncology phase I trials, model-assisted designs have been increasingly adopted because they enable adaptive yet operationally simple dose adjustment based on accumulating safety data, leading to a paradigm shift in dose-escalation methodology. In …
Authors: Kana Yamada, Hisato Sunami, Kentaro Takeda
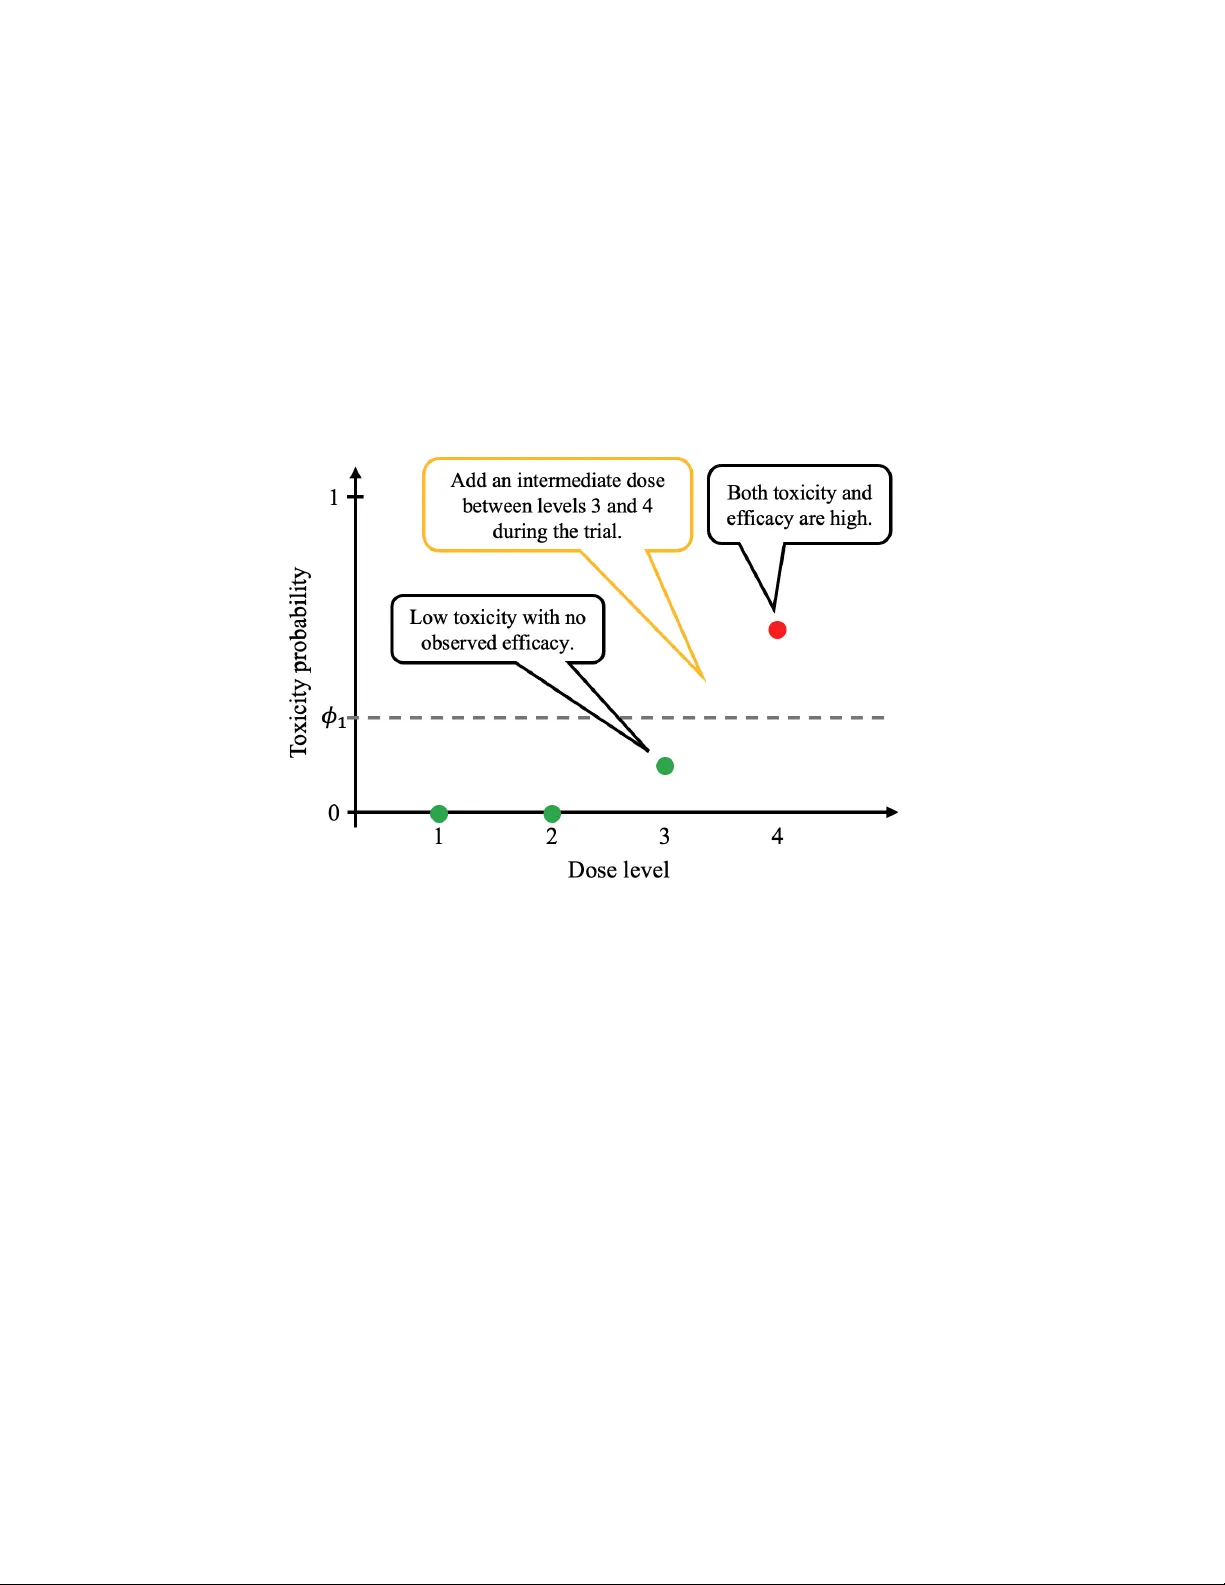
Hybrid Non-informativ e and Informativ e Prior Mo del-assisted Designs for Mid-trial Dose Insertion Kana Y amada 1 , Hisato Sunami 2 , Ken taro T akeda 4 , Keisuk e Hanada 5 , and Masahiro Ko jima ∗ 3,6 1 Institute of Science T oky o 2 The Univ ersity of Osak a 3 Ch uo Universit y 4 Astellas Pharma Global Dev elopment Inc. 5 W ak a yam a Medical Univ ersity 6 The Institute of Statistical Mathematics F ebruary 23, 2026 Abstract In oncology phase I trials, mo del-assisted designs ha v e b een increasingly adopted because they enable adaptiv e yet operationally simple dose adjustment based on accum ulating safety data, leading to a paradigm shift in dose-escalation methodology . In practice, a single mid-trial dose insertion may be considered to examine safer doses and/or to collect more informative efficacy data. In this study , w e inv estigate metho ds to impro v e dose assignmen t and the selection of the maxim um tolerated dose (MTD) or the optimal biological dose (OBD) when a new dose level is added during an ongoing trial under a mo del-assisted framework, b y assigning informative prior information to the inserted dose. W e prop ose a h ybrid design that uses a non-informativ e mo del- assisted design at trial initiation and, up on dose insertion, applies an informative-prior extension only to the newly added dose. In addition, to address potential skeleton missp ecification, w e prop ose t w o adaptiv e extensions: (i) an online-weigh ting approac h that up dates the sk eleton o ver time, and (ii) a Bay esian-mixture approach that robustly combines multiple candidate sk eletons. W e ev aluate the prop osed metho ds through sim ulation studies. Keywor ds: Bayesian optimal interval design, non-informative design, informative design, optimal biolo gic al dose ∗ Address:1-13-27 Kasuga,Bunky o-ku,T oky o 112-8551, Japan. T el: +81-(0)3-3817-1949 E-Mail: mk o jima263@g.c h uo-u.ac.jp 1 1 In tro duction In recent y ears, mo del-assisted designs such as the Bay esian Optimal Interv al (BOIN) design [1] ha ve been increasingly adopted in oncology phase I trials. These designs can select the maxim um tolerated dose (MTD) accurately while remaining op erationally simple. Dose levels in oncology phase I studies are often selected based on nonclinical data when there is no prior h uman dosing exp erience, as in first-in-h uman trials. Ho wev er, if the initial dose selection based on nonclinical data prov es inadequate, it may become necessary to insert an additional dose lev el b et ween adjacen t dose levels during the ongoing trial. T o illustrate the concept with a simple example, as shown in Figure 1, let ϕ 1 denote the target toxicit y level (TTL). If no efficacy is observ ed Figure 1: An Example of the Study Motiv ation at dose level 3 and its toxicit y probabilit y is b elow ϕ 1 , whereas at dose level 4 the toxicit y probabilit y exceeds ϕ 1 with efficacy observed, it is natural to consider ev aluating an additional dose level b etw een dose levels 3 and 4. Next, we present three examples of suc h mid-trial dose insertion from actual clinical trials. 1. In a first-in-h uman Phase I trial of futibatinib (T AS-120), an intermediate 20 mg QD cohort w as added per a protocol amendmen t dated 15 May 2017 [2]. According to the proto col and the published rep ort, the Phase I QD dose-escalation ev aluated 4, 8, 16, 20, and 24 mg; 3/9 ev aluable patients had DL Ts at 24 mg during cycle 1, whereas 0/5 ev aluable patien ts had DL Ts at 20 mg. Consequently , 20 mg QD was determined as the maximum tolerated dose and supp orted as the recommended Phase I I dose in this program. 2. An op en-lab el phase 1/2 dose-escalation study of intratumourally administered INT230-6 initially planned six monotherapy cohorts—five intrapatien t dose-escalation cohorts (A1, B1, EA, EC, EC2) and a subsequently added fixed-dose cohort (EC3). In terms of max- im um total injection volume, the EC2 cohort allow ed up to 220 mL and was numerically the highest, whereas the subsequen tly added EC3 cohort used a maximum total volume of 175 mL p er treatment session. Although the study did not reach an MTD, the in ves- tigators added EC3 (sixth dose level; n = 9) to collect additional safety and preliminary 2 efficacy information [3]. F rom the publication, it is not entirely clear which dose regimen w as ultimately selected for further developmen t. 3. The SAP for the PF-04449913 (glasdegib) study B1371005 (NCT02038777) presp ecified the originally planned dose lev els and also allow ed dose insertion when clinically and scien tifically justified—sp ecifically , the insertion of an intermediate dose (e.g., 80 mg once daily) and the addition of a dose b elo w the planned minim um (e.g., 25 mg once daily). In practice, 25 mg once daily was added with the aim of assessing pharmaco dynamic effects, whereas 80 mg once daily was not added in B1371005 [4, 5]. Regarding statistical considerations for dose insertion, Hu et al. (2013) [6] prop osed a metho d to add a new dose level when the presp ecified doses are estimated to fall outside an acceptable toxicit y region. Guo et al. (2015) [7] prop osed a phase I/I I design, referred to as the T o xicity and Efficacy Based Dose Insertion Design (TEAMS), with the ob jectiv e of selecting the optimal biological dose (OBD). In TEAMS, dose insertion is triggered when the credible in terv al for the estimated optimal dose do es not contain any of the existing dose lev els, and the phase I comp onen t is implemented based on the mTPI design. Ho wev er, examples from actual clinical trials indicate that newly added dose lev els may b e selected in an ad ho c manner based on clinical and nonclinical considerations. More recently , George et al. (2026) [8] prop osed a general framew ork for mid-trial dose insertion in early-phase oncology com bination trials, where p osterior inference on the target-to xicit y contour is used to assess whether an y presp ecified dose com bination is close to the TTL; if not, new dose com binations are inserted and the mo del is up dated accordingly . Ho wev er, none of Hu et al. (2013) [6], Guo et al. (2015) [7], or George et al. (2026) [8] provides a principled approach to constructing prior information for an inserted dose b y b orrowing information from adjacen t doses. In the setting considered in this study , namely insertion of an intermediate dose, substantial exp erience has already accum ulated at the adjacen t doses, and toxicit y has also b een observ ed at doses higher than the inserted dose. Therefore, it is imp ortant to lev erage information from neighboring doses to construct prior information for the newly inserted intermediate dose. In this study , we in v estigate metho ds to improv e the op erating characteristics for selecting the MTD when new dose levels are added during an ongoing trial, b y b orrowing toxicit y infor- mation from the adjacen t dose lev els administered b efore and after the newly inserted dose. In addition, motiv ated by Pro ject Optimus [9] and the recen t shift in fo cus from the MTD alone to the selection of an optimal biological dose (OBD) based on utility that join tly considers toxicit y and efficacy , w e also describ e ho w the prop osed approach can b e extended to trials conducted under the Bay esian optimal interv al design for dose finding based on b oth efficacy and to xicit y outcomes (BOIN-ET) design [10]. This pap er is organized as follows. Section 2 presen ts the preliminaries. Section 3 describ es the prop osed metho ds. Section 4 presen ts the sim ulation settings and results. Section 5 con- cludes with a discussion. 2 Preliminaries In a Phase I oncology clinical trial, we assume a prespecified set of J dose lev els planned at the start of the trial. These dose lev els are determined based on nonclinical studies. The total planned sample size is denoted by N . When selection of the MTD is one of the primary ob jectives, the TTL is denoted by ϕ 1 . In this study , w e consider applying a model-assisted 3 design to a dose-escalation trial and assume that dose assignment is adaptively mo dified based on accumulating toxicit y outcomes. As illustrated in Figure 1, when a dose lev el is judged to require de-escalation b ecause of excessiv e toxicit y despite showing evidence of efficacy , while the next low er dose level exhibits neither to xicit y nor efficacy , we consider adding an intermediate dose during the trial. A key feature of our setting is that, at the time of dose insertion, treatmen t exp erience has already b een obtained at the existing dose levels, providing a small amoun t of information on toxicit y and efficacy . Therefore, for the newly added dose, w e propose a hybrid design that applies an informative mo del-assisted design incorp orating information from adjacent dose lev els, while the remaining dose levels con tinue to be go verned b y a non-informative mo del- assisted design. W e b egin with a brief review of representativ e non-informative mo del-assisted designs, in- cluding BOIN and BOIN-ET. W e then provide an o verview of their informative extensions, namely the Bay esian Optimal Interv al Design with Informative Prior (iBOIN) [11] and Incor- p orating historical information to improv e dose optimization design with toxicit y and efficacy endp oin ts (iBOIN-ET) designs [12]. The following notation is used throughout all designs. Let n j denote the num b er of patien ts treated at dose lev el j , and t j the n umber of patients who exp erience a dose-limiting toxicit y (DL T) at that dose level. The true DL T probability at dose level j is denoted by p j , and its estimate is ˆ p j = t j /n j . [BOIN] The BOIN design defines three hypotheses for the true toxicit y probabilit y p j , where ϕ 2 < ϕ 1 < ϕ 3 : equal to the TTL ( H 1 : p j = ϕ 1 ), less than the TTL ( H 2 : p j = ϕ 2 ), and greater than the TTL ( H 3 : p j = ϕ 3 ). It is an optimal design that minimizes the probability of making an incorrect dose adjustment under each hypothesis. As the optimal solution, decision b oundaries ( λ e , λ d ) are deriv ed, and dose adjustmen t is p erformed b y comparing the observ ed toxicit y probabilit y ˆ p j with these b oundaries. λ e = log 1 − ϕ 2 1 − ϕ 1 log n ϕ 1 (1 − ϕ 2 ) ϕ 2 (1 − ϕ 1 ) o , λ d = log 1 − ϕ 1 1 − ϕ 3 log n ϕ 3 (1 − ϕ 1 ) ϕ 1 (1 − ϕ 3 ) o , Sp ecifically , if ˆ p j ∈ ( λ e , λ d ), the next dose level remains j ; if ˆ p j ≤ λ e , the next dose level is j + 1; and if ˆ p j ≥ λ d , the next dose level is j − 1. [BOIN-ET] The BOIN-ET design is an extension of the BOIN design that incorp orates an efficacy threshold, allo wing dose assignment to b e guided by b oth safety and efficacy . Let the target efficacy probabilit y threshold b e denoted by η . F or dose level j , let u j denote the num b er of efficacy resp onses, q j the true efficacy probabilit y , and ˆ q j = u j /n j the observ ed efficacy probability . The dose assignmen t rules are as follows: if ˆ p j ≤ λ 1 and ˆ q j ≤ η , the next cohort is treated at dose j + 1; if ˆ p j ≤ λ 2 and ˆ q j > η , the next cohort remains at dose j ; if ˆ p j ≥ λ 2 , the next cohort is de-escalated to dose j − 1. In cases not cov ered b y these rules, the next cohort is assigned to the dose with the highest efficacy probability among ( j − 1 , j , j + 1). If tw o or more doses share the highest efficacy probability , one of them is randomly selected. The dose-escalation and de-escalation b oundaries ( λ 1 , λ 2 , η ) are obtained by minimizing the probability of incorrect 4 dose-assignmen t decisions under the follo wing six h yp otheses. H 11 j : p j = ϕ 1 and q j = δ 1 , H 12 j : p j = ϕ 1 and q j = δ 2 , H 21 j : p j = ϕ 2 and q j = δ 1 , H 22 j : p j = ϕ 2 and q j = δ 2 , H 31 j : p j = ϕ 3 and q j = δ 1 , H 32 j : p j = ϕ 3 and q j = δ 2 , where δ 1 denotes the probability corresp onding to the target efficacy , and δ 2 indicates that the efficacy probabilit y is lo wer than the target probabilit y . In this study , we consider a situation in whic h efficacy is observ ed at a certain dose level but dose de-escalation is required due to excessiv e toxicit y , whereas at the next low er dose lev el, no toxicit y is observ ed but no efficacy is observed either. Under this situation, w e consider inserting an additional dose lev el b etw een these t wo doses. Although the dose-adjustmen t designs in tro duced ab o ve are non-informativ e, in the setting considered in this study , there already exist dose levels for whic h treatmen t experience has b een accum ulated. Accordingly , w e propose a h ybrid design that leverages information obtained from previously treated dose lev els b y applying an informativ e prior to the newly added dose, while contin uing to use non- informativ e priors for the existing dose levels. W e first introduce designs that apply informative priors. T o b orrow information, it is necessary to sp ecify the sk eleton, which represen ts the prior distribution of toxicit y probabilities, and the prior effective sample size (PESS), which reflects the sample size of the prior distribution. Let the sk eleton of the newly inserted dose b e denoted b y r , and the PESS by s . The metho ds for determining r and s will b e prop osed later. [iBOIN] W e consider applying informativ e prior distributions to the probabilities asso ciated with each of the three hypotheses introduced in the BOIN design. Let π 1 denote the probability that h yp othesis H 1 holds, π 2 the probability that hypothesis H 2 holds, and π 3 the probability that h yp othesis H 3 holds. F or k = 1 , 2 , 3, the informative prior distribution π ∗ k is giv en as follo ws. π ∗ k = s X x =0 w 1 ( x, ϕ k ) s x ( r ) x (1 − r ) s − x , where w 1 ( x, ϕ k ) = ϕ x k (1 − ϕ k ) s − x P 3 k ′ =1 ϕ x k ′ (1 − ϕ k ′ ) s − x . The dose-escalation and de-escalation b oundaries are giv en as follo ws (in the BOIN design, π 1 = π 2 = π 3 = 1 / 3 was assumed). Note that in the follo wing, we presen t the b oundaries for a dose that is added during the trial. λ ∗ e = log 1 − ϕ 2 1 − ϕ 1 + 1 n log π ∗ 2 π ∗ 1 log n ϕ 1 (1 − ϕ 2 ) ϕ 2 (1 − ϕ 1 ) o , λ ∗ d = log 1 − ϕ 1 1 − ϕ 3 + 1 n log π ∗ 1 π ∗ 3 log n ϕ 3 (1 − ϕ 1 ) ϕ 1 (1 − ϕ 3 ) o , where n denotes the actual n umber of patients treated at the dose that was added during the trial. F or the dose to whic h iBOIN is applied, dose adjustmen t is conducted using λ ∗ e and λ ∗ d . In addition, to incorp orate prior information when selecting the MTD, we use ˆ p = t + sr n + s , where t denotes the num b er of observed DL Ts at the added dose. The PESS is recommended to select N 3 J or N 2 J [11]. [iBOIN-ET] In the iBOIN-ET design [12], it is necessary to sp ecify not only the sk eleton for toxicit y probabil- ities but also the s k eleton for efficacy probabilities, denoted b y v . As in the BOIN design, prior 5 information is incorp orated under the six h yp otheses. The prior information can b e calculated as follo ws. π km = s X x,y =0 w 1 ( x, ϕ k ) w 2 ( y , δ m ) s x ( r ) x (1 − r ) s − x s y ( v ) y (1 − v ) s − y , where w 2 ( y , δ m ) = δ y m (1 − δ m ) s − y P 2 m ′ =1 δ y m ′ (1 − δ m ′ ) s − y . In this pap er, w e adopt the M-iBOIN-ET design [12], in which the thresholds can b e calculated more easily , although the prop osed metho d can also b e applied to the J-iBOIN-ET design. The three thresholds are giv en as follo ws. λ ∗ e,E T = log 1 − ϕ 2 1 − ϕ 1 + 1 n log π ∗ 21 + π ∗ 22 π ∗ 11 + π ∗ 12 log n ϕ 1 (1 − ϕ 2 ) ϕ 2 (1 − ϕ 1 ) o , λ ∗ d,E T = log 1 − ϕ 1 1 − ϕ 3 + 1 n log π ∗ 11 + π ∗ 12 π ∗ 31 + π ∗ 32 log n ϕ 3 (1 − ϕ 1 ) ϕ 1 (1 − ϕ 3 ) o , η ∗ = log 1 − δ 2 1 − δ 1 + 1 n log π ∗ 12 + π ∗ 22 + π ∗ 32 π ∗ 11 + π ∗ 21 + π ∗ 31 log n δ 1 (1 − δ 2 ) δ 2 (1 − δ 1 ) o . The recommended PESS is N 2 J or N J [12]. 3 Prop osed metho d In this study , w e prop ose metho ds for determining the toxicit y and efficacy skeletons of a dose d ∗ added during the course of the trial based on the toxicit y and efficacy information from the existing dose levels. In addition, we prop ose a metho d for determining the effective sample size (ESS) of the posterior distribution, rather than the PESS, whic h tak es in to accoun t the n umbers of patien ts treated at other dose levels; accordingly , w e refer to this quan tity as ESS. W e first introduce the metho d for calculating the toxicit y skeleton. T o reflect all av ailable information from the existing dose lev els, the toxicit y skeleton is estimated by fitting Ba y esian Logistic Regression Mo del (BLRM) for the toxicit y probability p T . logit( p T ( d j )) = α + β log d j d ref (1) The skeleton for the newly added dose d ∗ is provided b y the mo del estimated using all the data a v ailable just b efore the addition of d ∗ as (1 + exp( − b α − ˆ β log ( d ∗ /d ref ))) − 1 , where b α and ˆ β are the p osterior mean, d ref is chosen as a clinically relev ant dose at whic h the MTD w as an ticipated, and was used as a scaling constant to facilitate prior sp ecification and numerical stabilit y . Because the BLRM is applied only when determining the dose sk eleton for newly added dose lev els, the transparency of the BOIN and BOIN-ET designs is not compromised, and the computational and analytical burden remains low er than that of fully mo del-based designs. F or the efficacy skeleton, since the probability of efficacy may not b e necessarily mono- tone increasing with dose, we consider by fitting a second-degree fractional p olynomial logistic regression mo del [13] for the efficacy probability p E , logit { p E ( d j ) } = α + β 1 f 1 d † j , k 1 + β 2 f 2 d † j , k 1 , k 2 , 6 where d † j = d j / ¯ d is the standardized dose, ¯ d denotes the a verage of all planned dose levels, and k 1 , k 2 ∈ {− 2 , − 1 , − 0 . 5 , 0 , 0 . 5 , 1 , 2 } are p ow er parameters. The basis functions f 1 ( · ) and f 2 ( · ) are defined as f 1 d † j , k 1 = log d † j , k 1 = 0 , d † j k 1 , k 1 = 0 , and f 2 d † j , k 1 , k 2 = n log d † j o 2 , k 1 = k 2 = 0 , d † j k 1 log d † j , k 1 = k 2 = 0 , log d † j , k 2 = 0 , k 1 = k 2 , d † j k 2 , k 2 = 0 , k 1 = k 2 . T o select the optimal p ow er parameters ( ˆ k 1 , ˆ k 2 ), we use the binomial deviance rather than the Ak aike Information Criterion, because the penalty term is constan t across candidate mo dels and therefore do es not affect model comparison. Sp ecifically , for eac h candidate pair ( k 1 , k 2 ), the mo del parameters ( α , β 1 , β 2 ) are estimated by maximum likelihoo d, and the deviance is defined as D ( k 1 , k 2 ) = − 2 n ℓ ( ˆ α, ˆ β 1 , ˆ β 2 | k 1 , k 2 ) − ℓ sat o , where ℓ ( ˆ α, ˆ β 1 , ˆ β 2 | k 1 , k 2 ) denotes the maximized binomial log-lik eliho o d under the fractional p olynomial mo del, and ℓ sat is the saturated log-lik eliho o d corresp onding to a mo del that assigns an unconstrained success probability to each observed dose level. The saturated log-likelihoo d do es not dep end on ( k 1 , k 2 ). The optimal p ow er parameters ( ˆ k 1 , ˆ k 2 ) are chosen as the pair minimizing D ( k 1 , k 2 ), and the resulting mo del is used to derive the efficacy skeleton. Next, since the outcome is binary , an ESS is required; therefore, w e introduce a metho d for calculating the ESS. Unlike the PESS used in the iBOIN and iBOIN-ET designs, we consider a data-dep endent ESS in this study . Accordingly , our approach is based on the approximation form ula using the first and second momen ts prop osed b y Zhou et al. (2021) [11]. W e first presen t the ESS for toxicit y , whic h is given as follo ws. Sp ecifically , after fitting the BLRM in (1) using all data av ailable immediately b efore the insertion of the new dose d ∗ , we obtain p osterior samples of the toxicit y probabilit y p T ( d ∗ ). Let µ ∗ T = E { p T ( d ∗ ) | D } , v ∗ T = V ar { p T ( d ∗ ) | D } , denote the p osterior mean and v ariance, resp ectively , where D represen ts the accumulated data prior to dose insertion. T o translate the posterior uncertaint y into an effectiv e prior sample size, w e appro ximate the p osterior distribution of p T ( d ∗ ) b y a Beta distribution. F or a Beta( a, b ) distribution, the mean and v ariance are given by µ = a a + b and v = µ (1 − µ ) a + b +1 . Solving for a + b yields a + b = µ (1 − µ ) v − 1. Accordingly , we define the ESS of to xicity for the inserted dose as n ∗ T = µ ∗ T (1 − µ ∗ T ) v ∗ T − 1 . 7 T o av oid excessiv e b orro wing and to impro v e robustness against p oten tial mo del missp eci- fication, following the approach adopted in the iBOIN and iBOIN-ET designs, we introduce a scaling factor γ 1 ∈ (0 , 1] and define the adjusted ESS as ˆ n ∗ T = γ 1 n ∗ T . Finally , to ensure numerical stability and to prev ent the prior information from o verwhelming the observed data, the ESS is truncated to the range 0 ≤ ˆ n ∗ T ≤ max j n j , where n j denotes the n umber of patien ts treated at dose level j prior to dose insertion. F or efficacy , w e calculate the ESS in the same wa y as for to xicit y . Sp ecifically , after fitting the efficacy model used to construct the efficacy skeleton to all data a v ailable immediately before the insertion of the new dose d ∗ , we obtain p osterior samples of the efficacy probability p E ( d ∗ ). Let µ ∗ E = E { p E ( d ∗ ) | D } , v ∗ E = V ar { p E ( d ∗ ) | D } , denote the p osterior mean and v ariance, resp ectively , where D represen ts the accumulated data prior to dose insertion. As in the to xicity case, we approximate the p osterior distribution of p E ( d ∗ ) b y a Beta distribution. Using the relationship b etw een the mean and v ariance of a Beta distribution, the ESS for efficacy is defined as n ∗ E = µ ∗ E (1 − µ ∗ E ) v ∗ E − 1 . The same scaling factor γ 2 ∈ (0 , 1] and truncation rule as those used for toxicit y are applied to n ∗ E . 3.1 Data-Driv en Up dating of the Sk eleton and ESS As treatment exp erience accum ulates at a newly added dose lev el, it ma y b ecome apparent that the initially sp ecified sk eleton differs materially from the underlying true toxicit y profile. In Ba yesian inference, even when the prior distribution is not well aligned with the data, the impact of the prior typically decreases as more data accrue. Ho wev er, in the setting considered in this study , an informativ e sk eleton is applied only to the single newly inserted dose, and Phase I oncology trials usually treat only a small num b er of patien ts at any given dose level (often on the order of 9–12). Under such limited sample sizes, discrepancies b etw een the skeleton and the observ ed data may remain influential, leading to biased inference and potentially misleading dose recommendations. T o address this issue, w e prop ose t w o approaches based on an online learning metho d and a Ba yesian mixture model. The first approach, referred to as the online up dating–based approac h, recalculates the skeleton using data obtained after dose insertion and adaptiv ely learns whether the previously sp ecified skeleton or the up dated sk eleton b etter explains the observed data. The second approach adopts a Ba yesian mixture approac h that com bines m ultiple candidate sk eletons, thereb y improving robustness to sk eleton misspecification. Below, w e describ e the pro cedure for up dating the toxicit y skeleton. Although online learning and Bay esian mixture are used to up date the mo del, such up dates are required only when dose-adjustment decisions are made for the newly inserted dose lev el. As a result, the prop osed approac h imp oses substan- tially less computational and operational burden than fully mo del-based designs that require 8 con tinuous up dating. Moreo v er, b ecause the framework is built up on iBOIN and iBOIN-ET, the simplicity and transparency inherent to mo del-assisted designs are preserved. The efficacy sk eleton can b e up dated in an analogous manner, and thus the detailed formulas are omitted. [ Online learning approac h ] W e formulate the selection of the skeleton for the inserted dose as an online learning problem with multiple candidate models. A t eac h up date time t , w e consider t w o candidate skeletons for the inserted dose d ∗ : (i) the previously s p ecified skeleton r ∗ 0 ,t , whic h remains unchanged from the last up date, and (ii) an up dated sk eleton r ∗ 1 ,t obtained from the current BLRM fit. Let y ∗ t denote the n umber of DL Ts observ ed among n ∗ t patien ts treated at dose d ∗ during the in terv al b etw een up dates. F or a candidate to xicit y probability p T ∈ (0 , 1), w e use the binomial logarithmic loss (negativ e log-lik eliho o d), ℓ t ( p T ) = − log Pr( Y ∗ t = y ∗ t | n ∗ t , p T ) = − y ∗ t log p T − ( n ∗ t − y ∗ t ) log(1 − p T ) + C t , where C t is a constant that do es not dep end on p T . The exp onen tially weigh ted forecaster, also kno wn as the Hedge algorithm [14], up dates the weigh ts assigned to the tw o candidate skeletons according to w k,t +1 = w k,t exp n − ℓ t r ∗ k,t o P j ∈{ 0 , 1 } w j,t exp n − ℓ t r ∗ j,t o , k ∈ { 0 , 1 } . The initial w eights w 0 , 1 and w 1 , 1 are assumed to b e p ositive and satisfy w 0 , 1 + w 1 , 1 = 1. The sk eleton used for information b orro wing at the next decision p oint is then defined as the con v ex com bination r ∗ t = w 0 ,t r ∗ 0 ,t + w 1 ,t r ∗ 1 ,t . This pro cedure corresp onds to a standard online learning strategy for probabilistic prediction under logarithmic loss [15, 16]. Moreov er, under logarithmic loss, the exp onential-w eight up- date coincides with Bay esian mo del a veraging (Ba y es mixture) when eac h candidate sk eleton is interpreted as a probabilistic mo del and the initial w eights w k, 1 are viewed as prior model w eights [15]. Alternativ ely , one may consider selecting a single skeleton from the candidate skeletons. In this case, at each up date time, a single skeleton can b e selected by choosing the candidate with the smaller cum ulativ e logarithmic loss (F ollo w-the-Leader, FTL): ˆ k t = arg min k ∈{ 0 , 1 } t − 1 X s =1 ℓ s r ∗ k,s , r ∗ t = r ∗ ˆ k t ,t . FTL (and closely related b est-exp ert selection rules) is a classical online learning approach [15, 16]. Because hard switc hing can be unstable under small sample sizes, soft up date strategies ma y be preferred for improv ed stabilit y . Switc hing p enalties or trac king v ariants (e.g., fixed- share or trac king the b est exp ert) can also b e introduced to limit frequent changes [17]. [ Ba yesian mixture approach ] In the up dating-based approac h, w e compare the up dated skeleton for the inserted dose with 9 the previously sp ecified skeleton to determine which b etter explains the observed data. In con trast, the mixture approach considers multiple candidate skeletons—including the skeleton for the inserted dose and those derived from adjacent dose levels—and ev aluates their relative supp ort from the observ ed data. The first sk eleton ( r 1 ) is deriv ed from equation (1). The second skeleton ( r 2 ) represents the toxicit y probabilit y at the dose level immediately ab o ve the newly added dose, and the third sk eleton ( r 3 ) represen ts the toxicit y probabilit y at the dose lev el immediately b elo w it. The mixture prior ( r w ) is defined as r w = w 1 r 1 + w 2 r 2 + w 3 r 3 , w 1 + w 2 + w 3 = 1 . W e place a Dirichlet prior on the mixing weigh ts ( w 1 , w 2 , w 3 ). Under a noninformativ e setting, w e use a uniform Diric hlet(1 , 1 , 1) prior. After administering the new dose d ∗ , let n ∗ and y ∗ denote the num b er of treated patients and the n um b er of observed to xicities, resp ectively . F or eac h candidate skeleton, the predictiv e lik eliho o d is defined as m k = p ( y ∗ | r k ), and the posterior w eights are computed as w post k = w prior k m k P 3 l =1 w prior l m l , k ∈ { 1 , 2 , 3 } . W e take m k = Pr( Y ∗ = y ∗ | n ∗ , r k ) under a Binomial( n ∗ , r k ) mo del. A single skeleton may b e selected b y choosing the candidate corresp onding to the largest p osterior weigh t. Alternatively , the mixture prior r w obtained b y replacing w k with w post k ma y b e used. F or each approach, b ecause the ESS of toxicit y reflects the amount of information acc um u- lated in the data, it can b e up dated at each up date time b y recalculating it using all curren tly a v ailable data via the same pro cedure describ ed ab o ve. T o ensure that the amount of b orro wed information do es not exceed that of the empirical data actually informing the skeleton, the ESS is capp ed at the largest sample size among the dose levels used in the skeleton estimation. 4 Sim ulation 4.1 Sim ulation configuration T o in vestigate the p erformance of the prop osed hybrid approaches of BOIN/iBOIN and BOIN- ET/iBOIN-ET, the true MTD selection rate and/or true OBD selection rate were compared with con ven tional BOIN and BOIN-ET. W e considered a phase I dose-finding setting with fiv e dose le v els d 1 , . . . , d 5 corresp onding to 300, 900, 1500, 2100, and 2400 mg, resp ectiv ely . The target toxicit y and efficacy probabilities were set to ϕ 1 = 0 . 30 and δ 2 = 0 . 5. The basic parameters of the BOIN and BOIN-ET designs were set as ϕ 2 = 0 . 6 ϕ 1 for BOIN/iBOIN design and ϕ 2 = 0 . 1 ϕ 1 for BOIN-ET/iBOIN-ET design, ϕ 3 = 1 . 4 ϕ 1 , and δ 2 = 0 . 6 δ 1 according to the recommended v alues [1, 10]. Assuming an a verage of six patients p er dose level, the initial total sample size was set to 24, and increased to 30 when a new dose level was added. Up to tw elv e patien ts were treated at eac h dose lev el, and the trial was terminated early if the decision w as to remain at the same dose level after treating t welv e patients. Dose levels at which the p osterior probabilit y that the to xicity probability exceeds ϕ 1 w as greater than 0.95 w ere eliminated, along with all higher dose lev els. Similarly , dose lev els w ere eliminated if the posterior probabilit y that the efficacy probability is b elo w δ 1 exceeded 0.99. F or the inserted dose, w e compared the p osterior to xicit y probability obtained by b orrowing from the s k eleton with the empirical 10 to xicity probabilit y estimated from the observ ed data. If the skeleton-based to xicit y probabilit y w as substantially smaller than the observ ed toxicit y probability , this indicated that the sk eleton underestimated the to xicity at the inserted dose. T o av oid inappropriate b orrowing in such situations, w e introduced a threshold c to quantify the discrepancy b et w een the tw o estimates. Sp ecifically , when ˆ p T − ˆ p T , b orrowing > c , where ˆ p T denotes the observ ed to xicity probability at the inserted dose, w e regarded the sk eleton-based estimate as inconsisten t with the data and did not use it for dose adjustment or MTD selection. W e examined four v alues c ∈ { 0 , 0 . 1 , 0 . 2 , 1 } . Larger v alues of c corresp ond to more p ermissiv e b orro wing (i.e., skeleton information is discarded less often when it underestimates toxicit y), and c = 1 effectively corresp onds to alwa ys b orrowing. W e set the ESS scaling factor to 1. F or the online learning approach, w e applied the Hedge algorithm. F or the BLRM, we assumed the prior distributions α ∼ Normal( µ α , σ 2 α ) , log( β ) ∼ Normal( µ β , σ 2 β ) . F or the Ba yesian-mixture approac h combining three candidate sk eletons r 1 , r 2 , r 3 , we assigned a Diric hlet prior to the mixing w eigh ts w = ( w 1 , w 2 , w 3 ): w ∼ Dirichlet(1 , 1 , 1) , w 1 + w 2 + w 3 = 1. F or the sim ulation study , we considered t wo broad types of cases: fixed cases, which are designed to b e intuitiv e and easy to in terpret, and random scenarios, whic h are included to mitigate the inheren t arbitrariness of fixed case sp ecifications. 4.1.1 Fixed case T o ev aluate the op erating characteristics of the proposed metho ds, w e generated data under the three fixed toxicit y and three fixed efficacy scenarios of true DL T and efficacy probabilities sho wn in T able 1. T able 1: T rue DL T and efficacy probabilities under the three simulation scenarios Scenario d 1 (300 mg) d 2 (900 mg) d 3 (1500 mg) d ∗ (2100 mg) d 4 (2400 mg) T o xicity T1 0.05 0.10 0.15 0.20 0.60 T2 0.05 0.10 0.15 0.30 0.60 T3 0.05 0.10 0.15 0.50 0.60 Efficacy E1 0.05 0.10 0.15 0.20 0.60 E2 0.05 0.10 0.15 0.30 0.60 E3 0.05 0.10 0.15 0.50 0.60 In all scenarios, the design incorp orated historical partial data that had been already ob- serv ed at the time of adaptation. Specifically , the num b er of treated patients is ( n 1 , n 2 , n 3 , n ∗ , n 4 ) = (3 , 3 , 6 , 0 , 6), the n umber of observ ed DL Ts is ( y T 1 , y T 2 , y T 3 , y ∗ T , y T 4 ) = (0 , 0 , 1 , 0 , 3), and the n umber of observ ed efficacy is ( y E 1 , y E 2 , y E 3 , y ∗ E , y E 4 ) = (0 , 0 , 0 , 0 , 3). W e assumed that a new in termediate dose, d ∗ = 2100 mg, w as inserted during the trial, and all sim ulations w ere initiated b y allo cating the next cohort of patients to this newly inserted dose level. 4.1.2 Random case T o eliminate arbitrariness in the sim ulation design, w e also conduct random scenario simulations. The construction of these random scenarios follows the sim ulation settings prop osed b y Liu and 11 Y uan [1]. The simulation setup is as follo ws. Only one dose lev el is added during the trial, and the total num b er of dose lev els after addition is five. When sp ecifying the true toxicit y probabilities, w e consider the structure consisting of five dose levels including the added one. 1. One dose level is randomly selected from levels 2 to 4 with equal probability and denoted b y j . 2. The true to xicit y probabilities at dose lev els j − 1 and j + 1 are sp ecified as follows: p j − 1 = Φ[ ε j − { ε j − z (2 ϕ − Φ( ε j )) } I ( ε j > z ( ϕ )) − ε 2 j − 1 ] , p j +1 = Φ[ ε j + { z (2 ϕ − Φ( ε j )) − ε j } I ( ε j < z ( ϕ )) + ε 2 j +1 ] , where ε j ∼ N ( z ( ϕ ) , σ 2 0 ), z ( · ) denotes the inv erse standard normal CDF, and ε j − 1 ∼ N ( µ 1 , σ 2 1 ), ε j +1 ∼ N ( µ 2 , σ 2 2 ). F or the remaining dose lev els, p j − k = Φ { z ( p j − k +1 ) − ε 2 j − k } , p j + l = Φ { z ( p j + l − 1 ) + ε 2 j + l } , where k and l are natural num b ers. 3. Dose assignmen t is p erformed using the four dose levels removing j . If the trial completes without an y dose de-escalation during dose assignment, the corresp onding simulation repli- cate is excluded from the analysis. If de-escalation o ccurs at a dose level g (with g ≥ 2), a new dose is inserted b etw een lev els g and g − 1. The true toxicit y probabilit y of the inserted dose ε ∗ is Φ( ε ∗ ), where ε ∗ ∼ N (( p g − p g − 1 ) / 2 , σ ∗ 2 ). W e assumed that µ 1 = ϕ − 0 . 5, µ 2 = ϕ + 0 . 5, σ 0 = σ ∗ = 0 . 05, σ 1 = σ 2 = 0 . 5. F or each sim ulated trial, we generated a v ector of true efficacy probabilities q = ( q 1 , . . . , q J ) under simple shap e constraints, without assuming any parametric dose–resp onse mo del [18]. Let q E denote the minimum clinically meaningful efficacy probabilit y and let q max b e an upp er b ound. A dose index ˜ d ∈ { 1 , . . . , J } was first sampled uniformly at random, and the efficacy probabilit y at that dose w as dra wn as q ˜ d ∼ Unif ( δ 1 , q max ) . Conditional on q ˜ d , the remaining q d v alues were generated using independent uniform draws constrained to satisfy the presp ecified efficacy shap e. W e considered t w o shap es. Monotone increasing efficacy . T o construct a nondecreasing efficacy profile, doses b elow d ∗ w ere filled in b y dra wing successively smaller v alues: q ˜ d − 1 ∼ Unif (0 , q ˜ d ) , q ˜ d − 2 ∼ Unif (0 , q ˜ d − 1 ) , . . . Doses ab o v e d ∗ w ere then generated to b e successively larger, truncated by q max : q ˜ d +1 ∼ Unif ( q ˜ d , q max ) , q ˜ d +2 ∼ Unif ( q ˜ d +1 , q max ) , . . . This pro cedure pro duces trial-to-trial v ariabilit y while enforcing the monotonicit y constrain t. Unimo dal efficacy . T o obtain a single-p eaked efficacy profile, we additionally sampled a p eak dose index d peak ∈ { 1 , . . . , J } uniformly at random. If d peak = d ∗ , we generated the p eak efficacy lev el from q d peak ∼ Unif ( q ˜ d , q max ) , 12 whereas if d peak = ˜ d the reference dose also served as the p eak. Efficacy probabilities were then generated out w ard from the p eak so that they decrease aw a y from d peak : q d peak − 1 ∼ Unif (0 , q d peak ) , q d peak − 2 ∼ Unif (0 , q d peak − 1 ) , . . . and similarly on the righ t side, q d peak +1 ∼ Unif (0 , q d peak ) , q d peak +2 ∼ Unif (0 , q d peak +1 ) , . . . When ˜ d and d peak differ, the ab ov e construction is applied after ensuring that the segment b et w een d ∗ and d peak remains within [ q ˜ d , q d peak ]. Ov erall, the resulting q satisfies a unimo dal constrain t with random spacing b etw een adjacen t efficacy lev els. In the random scenario simulations, w e retain the same data-generating mechanism for to xicity and efficacy as describ ed ab ov e. Dose insertion is triggered based on the observ ed efficacy outcomes: sp ecifically , an in termediate dose is added only when the observ ed efficacy probabilit y at the low er dose level is b elo w the efficacy threshold δ 1 , while the observed efficacy probabilit y at the higher dose level exceeds δ 1 . This criterion reflects the practical motiv ation of the prop osed metho d, namely , situations in which efficacy signals are observed at higher dose lev els but not at lo w er ones, prompting the consideration of an intermediate dose. 4.2 Sim ulation results F or the Fixed cases, we rep ort the p ercen tage of correct MTD selection. F or designs related to BOIN-ET, we additionally rep ort the p ercen tage of correct OBD selection. W e also summarize the selection p ercentages of each dose as the MTD, the av erage num b er of patien ts treated at eac h dose level, and, for designs related to BOIN-ET, the selection p e rcen tage of e ac h dose as the OBD. In the Supplemental Material, w e rep ort the p ercen tage of trials in whic h a dose higher than the true MTD was selected as the MTD. F or the random scenarios, w e similarly report the percentages of correct MTD and OBD selection. The Supplemental Material further includes the p ercentage of trials in which a dose higher than the true MTD was selected as the MTD. 4.2.1 Results for fixed case The sim ulation results for the BOIN-related designs are presented in Figure 2. Across all settings in Scenarios 1 and 2, the prop osed metho d achiev ed a higher p ercentage of correct MTD selection. When the inserted dose added during the trial was ov erly toxic, the prop osed metho d with the threshold c = 0 deomnstra y ed a higher probability of correct MTD selection comparable to the con v entional BOIN design. Next, the simulation results for the BOIN-ET-related designs are presen ted in Figure 3. Across all settings in Scenarios 1, the prop osed metho d achiev ed a higher probability of correct MTD selection. In Scenario 2, the prop osed metho ds demonstrated a probability of correct MTD selection comparable to that of the conv entional BOIN design. In Scenario 3, where the added intermediate dose was ov erly to xic, the prop osed metho d outp erformed the conv entional design for the Mixture approach particularly when cut = 0.1, 0.2, and 1. Figure 4 sho ws that the p ercen tage of correct OBD selection follo w ed similar patterns to those observ ed for the MTD. 13 76.7 68.9 64.2 87.2 86.1 90.1 90.1 75.3 75.5 85.0 85.0 63.6 55.6 36.2 36.2 88.5 87.1 87.1 87.1 75.5 76.2 76.2 76.2 62.4 55.6 55.6 55.6 92.7 90.2 89.9 90.0 85.2 84.3 84.0 86.6 61.7 46.1 45.6 32.1 0 25 50 75 100 Scenario T1 Scenario T2 Scenario T3 Correct MTD Selection (%) BOIN Hybrid (cut=0) Hybrid (cut=0.1) Hybrid (cut=0.2) Hybrid (cut=1) Mixture (cut=0) Mixture (cut=0.1) Mixture (cut=0.2) Mixture (cut=1) Online (cut=0) Online (cut=0.1) Online (cut=0.2) Online (cut=1) Figure 2: Percen tage of correct MTD selection for BOIN-related designs in fixed case 4.2.2 Results for random case Figure 5 presen ts the simulation results for the p ercentage of correct MTD selection under the random scenarios for the prop osed metho ds related to the BOIN design. Although the proposed metho d did not p erform w orse than the original BOIN design, no substantial improv ement was observ ed. Next, Figures 6 and 7 presents the results for the p ercentage of correct MTD selection, and Figures 8 and 9 presen ts the results for the percentage of correct OBD selection, for the BOIN-ET–related designs. Under an y efficacy profile assumption, it demonstrated MTD and OBD selection rates almost equiv alent to the BOIN-ET design. In addition, the Supplemental Material rep orts the prop ortion of trials judged to b e o v erly toxic for all designs under the random scenarios. 5 Discussion W e proposed a hybrid design that combines the BOIN/BOIN-ET designs with their informativ e extensions, iBOIN/iBOIN-ET, to accommo date mid-trial dose insertion in Phase I oncology trials using the data already observ ed at the time of insertion. T o our knowledge, no previous w ork has proposed a hybrid strategy that integrates a non-informativ e model-assisted design with an informative-prior counterpart in this setting, and this pap er is the first to apply suc h a framew ork. A key feature of our approach is that, for a newly inserted dose, w e lev erage information from other dose lev els with accumulated data to construct the skeleton and to quantify the strength of b orrowing via the ESS. W e proposed three approaches to determine the skeleton for the inserted dose: (i) a metho d based on the Bay esian logistic regression mo del (BLRM), 14 79.9 80.3 79.9 80.7 69.5 69.5 69.4 70.2 59.6 58.7 59.5 59.0 85.2 85.1 85.8 85.3 72.5 73.2 72.9 73.2 58.5 56.8 57.7 58.1 73.8 68.4 60.8 82.6 81.0 80.8 81.5 70.7 67.5 69.1 68.5 63.5 68.6 68.9 69.1 82.8 82.9 82.9 82.7 71.2 71.6 71.4 71.5 59.6 59.3 59.2 59.3 86.4 86.5 86.4 86.9 73.4 73.0 73.9 73.6 58.5 59.5 59.6 59.8 78.1 72.1 61.3 84.4 82.8 82.4 82.2 73.8 69.8 69.4 70.1 64.7 69.4 69.5 69.6 85.6 85.4 85.9 85.4 73.4 73.4 74.0 73.4 60.7 60.5 60.5 61.0 87.3 87.0 87.5 87.1 73.2 73.3 73.8 73.0 60.7 60.0 59.6 58.8 83.9 75.0 63.3 84.9 84.0 83.6 84.1 75.9 72.8 72.8 73.3 64.0 69.1 69.6 69.6 Scenario E1 Scenario E2 Scenario E3 Scenario T1 Scenario T2 Scenario T3 0 25 50 75 100 0 25 50 75 100 0 25 50 75 100 Correct MTD Selection (%) BOIN−ET Hybrid (cut=0) Hybrid (cut=0.1) Hybrid (cut=0.2) Hybrid (cut=1) Mixture (cut=0) Mixture (cut=0.1) Mixture (cut=0.2) Mixture (cut=1) Online (cut=0) Online (cut=0.1) Online (cut=0.2) Online (cut=1) Figure 3: Percen tage of correct MTD selection for BOIN-ET-related designs in fixed case 15 68.1 68.3 68.2 68.7 58.0 58.4 58.5 58.9 40.1 39.6 40.4 40.4 84.1 83.9 84.9 84.3 71.2 72.0 71.6 72.0 35.6 35.8 36.0 35.5 66.6 60.5 31.7 84.7 83.2 82.9 83.5 70.7 68.3 69.6 69.0 32.5 35.3 34.9 35.2 80.9 81.2 81.3 81.0 68.9 69.4 69.4 69.5 36.5 37.1 36.7 37.2 86.2 86.2 86.2 86.7 73.0 72.7 73.5 73.3 35.9 37.5 36.0 37.0 81.7 72.2 31.4 87.5 86.0 85.8 85.1 74.7 70.7 70.3 70.9 33.2 35.8 36.6 36.8 85.7 85.5 86.0 85.6 73.2 73.1 73.8 73.1 36.9 36.7 37.0 37.4 87.2 87.1 87.5 87.1 73.2 73.2 73.7 73.0 37.5 36.3 36.3 35.4 90.6 76.9 32.9 90.6 89.8 89.2 89.6 77.0 74.0 73.9 74.5 34.0 37.0 37.5 37.6 Scenario E1 Scenario E2 Scenario E3 Scenario T1 Scenario T2 Scenario T3 0 25 50 75 100 0 25 50 75 100 0 25 50 75 100 Correct OBD Selection (%) BOIN−ET Hybrid (cut=0) Hybrid (cut=0.1) Hybrid (cut=0.2) Hybrid (cut=1) Mixture (cut=0) Mixture (cut=0.1) Mixture (cut=0.2) Mixture (cut=1) Online (cut=0) Online (cut=0.1) Online (cut=0.2) Online (cut=1) Figure 4: Percen tage of correct OBD selection for BOIN-ET-related designs in fixed case 16 59.3 60.1 61.0 61.7 62.0 60.0 60.1 60.2 60.2 59.8 60.3 61.1 61.4 0 25 50 75 100 Correct MTD Selection (%) BOIN Hybrid (cut=0) Hybrid (cut=0.1) Hybrid (cut=0.2) Hybrid (cut=1) Mixture (cut=0) Mixture (cut=0.1) Mixture (cut=0.2) Mixture (cut=1) Online (cut=0) Online (cut=0.1) Online (cut=0.2) Online (cut=1) Figure 5: Percen tage of correct MTD selection for BOIN-related designs in random case 64.5 60.0 60.4 60.5 61.6 64.9 64.8 64.3 65.4 59.0 59.0 60.2 61.1 0 25 50 75 100 Correct MTD Selection (%) BOIN−ET Hybrid (cut=0) Hybrid (cut=0.1) Hybrid (cut=0.2) Hybrid (cut=1) Mixture (cut=0) Mixture (cut=0.1) Mixture (cut=0.2) Mixture (cut=1) Online (cut=0) Online (cut=0.1) Online (cut=0.2) Online (cut=1) Figure 6: P ercentage of correct MTD selection for BOIN-ET-related designs under monotonic in- creasing efficacy curv e in random case 17 65.0 61.1 60.4 60.8 61.7 65.6 64.8 65.8 66.7 65.4 64.7 65.2 66.1 0 25 50 75 100 Correct MTD Selection (%) BOIN−ET Hybrid (cut=0) Hybrid (cut=0.1) Hybrid (cut=0.2) Hybrid (cut=1) Mixture (cut=0) Mixture (cut=0.1) Mixture (cut=0.2) Mixture (cut=1) Online (cut=0) Online (cut=0.1) Online (cut=0.2) Online (cut=1) Figure 7: P ercentage of correct MTD selection for BOIN-ET-related designs under unimo dal efficacy curv e in random case 56.0 66.7 67.2 66.7 69.2 61.3 62.4 62.9 63.9 58.3 58.4 57.9 57.9 0 25 50 75 100 Correct OBD Selection (%) BOIN−ET Hybrid (cut=0) Hybrid (cut=0.1) Hybrid (cut=0.2) Hybrid (cut=1) Mixture (cut=0) Mixture (cut=0.1) Mixture (cut=0.2) Mixture (cut=1) Online (cut=0) Online (cut=0.1) Online (cut=0.2) Online (cut=1) Figure 8: Percen tage of correct OBD selection for BOIN-ET-related designs under monotonic in- creasing efficacy curv e in random case 18 62.2 66.4 65.9 66.7 68.5 57.0 59.6 59.6 60.5 62.1 60.7 60.7 63.9 0 25 50 75 100 Correct OBD Selection (%) BOIN−ET Hybrid (cut=0) Hybrid (cut=0.1) Hybrid (cut=0.2) Hybrid (cut=1) Mixture (cut=0) Mixture (cut=0.1) Mixture (cut=0.2) Mixture (cut=1) Online (cut=0) Online (cut=0.1) Online (cut=0.2) Online (cut=1) Figure 9: Percen tage of correct OBD selection for BOIN-ET-related designs under unimo dal efficacy curv e in random case (ii) a mixture approach that combines the B LRM-based estimate with the empirically observ ed to xicity/efficacy probabilities at the adjacent dose levels, and (iii) an online-learning approach that adaptively up dates the sk eleton b y incorp orating post-insertion data. Because the main con tribution of our metho d lies in estimating the skeleton and ESS for the inserted dose, the framew ork is not limited to BOIN/BOIN-ET. F or example, analogous hybrid designs can b e readily dev elop ed for other mo del-assisted designs, such as mo dified toxicit y probabilit y interv al (mTPI) [19]/imTPI [11] and Keyboard [20]/iKeyb oard [11], b y applying the same skeleton/ESS construction step to the newly added dose while retaining the original non-informative rules for the pre-sp ecified doses. Regarding the sim ulation results, for the BOIN/iBOIN h ybrid design, w e found that when the true toxicit y probabilit y of the inserted in termediate dose was at or below the TTL, the prop osed metho d achiev ed a higher probability of correct MTD selection. In con trast, when c w as close to 1, the con v entional BOIN design tended to yield a higher probabilit y of correct MTD selection when the inserted dose was o verly toxic (i.e., its true toxicit y probabilit y exceeded the TTL). Notably , when c = 0, the fixed-scenario results show ed that the proposed metho d p erformed comparably to the BOIN design under highly toxic settings, while outp erforming BOIN when the true toxicit y probabilit y of the intermediate dose w as at or b elow the TTL; a similar tendency w as also observ ed for the online-w eighting approach. Meanwhile, the Ba y esian- mixture approach was found to improv e MTD selection p erformance while con trolling excessive to xicity regardless of the v alue of c . Under the random scenarios, w e found that the prop osed metho ds did not p erform worse than the original BOIN design, although the improv emen t in correct MTD selection w as not substantial. F or BOIN-ET/iBOIN-ET, in the fixed scenarios, w e observed a slight p erformance deterioration in some settings when the inserted intermediate dose had a true to xicity probability at or below the TTL and high efficacy; ho w ever, in the other 19 scenarios, the prop osed metho ds demonstrated sup erior p erformance. F or the online-w eighting approac h, the performance was not stable, whic h we attribute to instabilit y in updating efficacy , whereas the h ybrid and Bay esian-mixture approac hes exhibited stable and fa vorable trends. In the random scenarios, under a monotonically increasing efficacy curv e, the h ybrid and Bay esian- mixture approac hes p erformed well, and under a unimo dal efficacy curve, the h ybrid approac h sho wed go o d p erformance. Finally , the sim ulations clearly indicated that excessiv e toxicit y was w ell con trolled. In conclusion, for the BOIN/iBOIN h ybrid design, setting the b orrowing threshold to c = 0 pro vided a fa vorable trade-off: it impro ved MTD selection when the inserted dose was at or b elo w the TTL while main taining performance comparable to BOIN in highly to xic settings. In addition, when using the Ba y esian-mixture approac h, we found that excessive toxicit y can b e largely av oided even without imp osing a b orrowing threshold. Moreo v er, for the BOIN- ET design, we confirmed that the prop osed metho d increases the probability of correct OBD selection while prev en ting excessive toxicit y . 20 References [1] Suyu Liu and Ying Y uan. Ba yesian optimal in terv al designs for phase i clinical trials. Journal of the R oyal Statistic al So ciety: Series C (Applie d Statistics) , 64(3):507–523, 2015. [2] R Bahleda, F Meric-Bernstam, L Go yal, B T ran, Y He, I Y amamiya, KA Benhadji, I Matos, and H-T Ark enau. Phase i, first-in-h uman study of futibatinib, a highly selective, irre- v ersible fgfr1–4 inhibitor in patien ts with adv anced solid tumors. A nnals of Onc olo gy , 31(10):1405–1412, 2020. [3] Jacob S Thomas, Lillian L Siu, Matthew Ingham, Nilofer S Azad, Christian F Mey er, An thony J Olszanski, Giles F Whalen, Luis H Camac ho, James S Hu, Diana L Hanna, et al. Safety and efficacy of intratumourally administered in t230-6 in adult patients with adv anced solid tumours: results from an op en-lab el phase 1/2 dose escalation study . EBioMe dicine , 121, 2025. [4] Clinical Statistics Group 1, Pfizer R&D Japan G.K. Proto col b1371005 statistical analysis plan (sap): A phase 1 study to ev aluate the safety , tolerability , efficacy , pharmacokinetics, and pharmaco dynamics of pf-04449913 (glasdegib), an oral hedgehog inhibitor, adminis- tered as a single agent in japanese patients with select hematologic malignancies and in com bination with intensiv e c hemotherap y , lo w-dose ara-c, or azacitidine in patients with acute m y eloid leukemia or high-risk my elo dysplastic syndrome. Statistical Analysis Plan, V ersion 4.0 (16-DEC-2019). Av ailable from ClinicalT rials.gov (NCT02038777) study do c- umen ts, Decem b er 2019. Accessed 2026-02-08. [5] Y osuk e Minami, Hironobu Minami, T oshihiro Miy amoto, Goic hi Y oshimoto, Y ukio Koba yashi, W ataru Munak ata, Y asushi Onishi, Masahiro Koba yashi, Mari Ikuta, Geoffrey Chan, et al. Phase i study of glasdegib (pf-04449913), an oral smo othened inhibitor, in japanese patien ts with select hematologic malignancies. Canc er Scienc e , 108(8):1628–1633, 2017. [6] Bo Hu, B Nebiyou Bekele, and Y uan Ji. Adaptiv e dose insertion in early phase clinical trials. Clinic al T rials , 10(2):216–224, 2013. [7] W en tian Guo, Y ang Ni, and Y uan Ji. T eams: toxicit y-and efficacy-based dose-insertion de- sign with adaptive mo del selection for phase i/ii d ose-escalation trials in oncology . Statistics in bioscienc es , 7(2):432–459, 2015. [8] M. George, I. W adsworth, and P . Mozgunov. A no vel metho d for inserting dose levels mid- trial in early-phase oncology com bination studies. Statistics in Me dicine , 45(3–5):e70417, F ebruary 2026. [9] U.S. F o o d and Drug Administration. Pro ject Optim us: FDA’s initiative to reform dose optimization and selection in oncology drug dev elopment. https://www.fda.gov/media/ 164555/download , 2023. Accessed: 2025-06-05. [10] Ken taro T akeda, Masatak a T aguri, and Satoshi Morita. Boin-et: Ba yesian optimal in terv al design for dose finding based on both efficacy and to xicit y outcomes. Pharmac eutic al statistics , 17(4):383–395, 2018. [11] Y anhong Zhou, J Jack Lee, Shunguang W ang, Stuart Bailey , and Ying Y uan. Incorp o- rating historical in formation to improv e phase i clinical trials. Pharmac eutic al statistics , 20(6):1017–1034, 2021. 21 [12] Y unqi Zhao, Rachael Liu, and Kentaro T ak eda. Incorp orating historical information to impro ve dose optimization design with to xicity and efficacy endp oints: ib oin-et. Pharma- c eutic al Statistics , 22(3):440–460, 2023. [13] P atrick Ro yston and Douglas G Altman. Regression using fractional p olynomials of con- tin uous cov ariates: parsimonious parametric mo delling. Journal of the R oyal Statistic al So ciety Series C: Applie d Statistics , 43(3):429–453, 1994. [14] Y oa v F reund and Robert E Schapire. A decision-theoretic generalization of on-line learning and an application to b o osting. Journal of c omputer and system scienc es , 55(1):119–139, 1997. [15] Nicolo Cesa-Bianc hi and G´ ab or Lugosi. Pr e diction, L e arning, and Games . Cambridge Univ ersity Press, 2006. [16] Shai Shalev-Sh w artz. Online learning and online conv ex optimization. F oundations and T r ends in Machine L e arning , 4(2):107–194, 2011. [17] Mark Herbster and Manfred K. W arm uth. T rac king the b est exp ert. Machine L e arning , 32(2):151–178, 1998. [18] Hao Sun, Hsin-Y u Lin, Jieqi T u, Rev athi Ananthakrishnan, and Eunhee Kim. Statisti- cal op erating characteristics of curren t early phase dose finding designs with toxicit y and efficacy in oncology . Journal of Biopharmac eutic al Statistics , pages 1–21, 2024. [19] Y uan Ji, Ping Liu, Yisheng Li, and B Nebiy ou Bek ele. A modified toxicit y probability in terv al metho d for dose-finding trials. Clinic al trials , 7(6):653–663, 2010. [20] F angrong Y an, Sumithra J Mandrek ar, and Ying Y uan. Keyb oard: a nov el ba yesian toxicit y probabilit y in terv al design for phase i clinical trials. Clinic al Canc er R ese ar ch , 23(15):3994– 4003, 2017. 22
Original Paper
Loading high-quality paper...
Comments & Academic Discussion
Loading comments...
Leave a Comment