An extension to reversible jump Markov chain Monte Carlo for change point problems with heterogeneous temporal dynamics
Detecting brief changes in time-series data remains a major challenge in fields where short-lived states carry meaning. In single-molecule localisation microscopy, this problem is particularly acute as fluorescent molecules used to tag protein oligom…
Authors: Emily Gribbin, Benjamin Davis, Daniel Rolfe
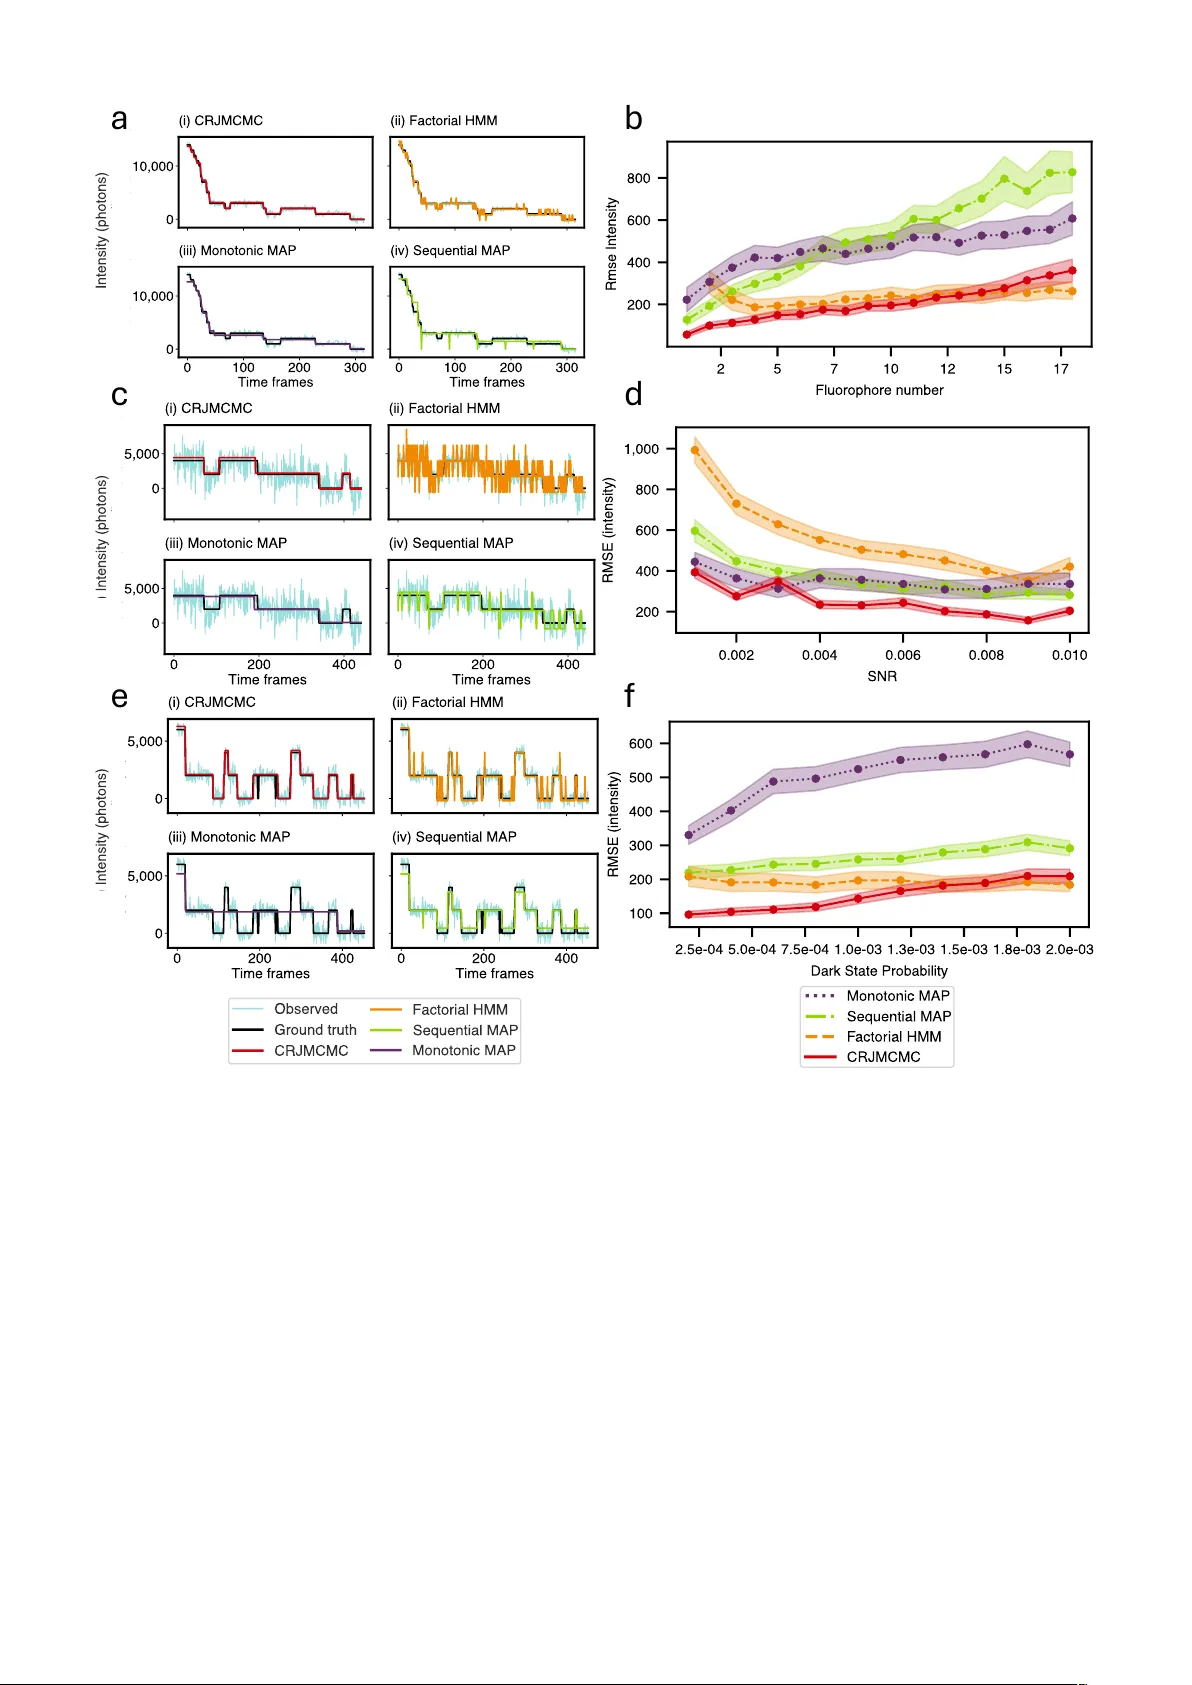
An extension to rev ersible jump Mark o v c hain Mon te Carlo for c hange p oin t problems with heterogeneous temp oral dynamics Emily Gribbin 1* , Benjamin Da vis 2 , Daniel Rolfe 2 , Hannah Mitc hell 1* 1* Mathematical Sciences Researc h Cen tre, Sc hool of Mathematics and Physics, Queen’s Univ ersit y Belfast Universit y Road, Belfast, BT7 1NN, Northern Ireland, United Kingdom. 2 OCTOPUS Group, Cen tral Laser F acilit y , Research Complex at Harwell, Science and T ec hnology F acilities Council, Appleton Lab oratory , Oxfordshire, O X11 0F A, England, United Kingdom. *Corresp onding author(s). E-mail(s): egribbin02@qub.ac.uk h.mitc hell@qub.ac.uk Abstract Detecting brief c hanges in time-series data remains a ma jor c hallenge in fields where short-lived states carry imp ortan t biological, ph ysical or op erational meaning. In single-molecule lo calisation microscopy , this problem is particularly acute as fluorescent molecules used to tag protein oligomers displa y heterogenous photophysical b eha viour that can complicate photobleach step analysis; a k ey step in resolving nanoscale protein organisation. Existing methods to p erform suc h analyses often require extensiv e filtering or prior calibration, and can fail to accu- rately accoun t for blinking or reversible dark states which ha ve the potential to con taminate downstream analysis pro cesses. In this pap er, an extension to RJMCMC is prop osed for change p oin t detection problems with hetero- geneous temporal dynamics. This approac h is applied to the problem of estimating per-frame activ e fluorophore coun ts from one-dimensional integrated in tensit y traces deriv ed from Fluorescence Lo calisation Imaging with Pho- tobleac hing (FLImP), where comp ound change p oint pair mo ves are in tro duced to b etter account for short-lived ev ents known as blinking and dark states. The approach is v alidated using b oth sim ulated and exp erimen tal data, demonstrating improv ed accuracy and robustness when compared with the curren t state-of-the-art photobleach step analysis metho ds and with the existing analysis approach for FLImP data. This Comp ound Reversible jump Mark ov chain Mon te Carlo (CRJMCMC) algorithm requires no prior calibration from lab elled data and minimal user input. It performs reliably across a wide range of fluorophore coun ts and signal-to-noise conditions, with signal- to-noise ratio (SNR) down to 0.001 and counts as high as sev enteen fluorophores, while also effectively estimating lo w coun ts t ypically observ ed in FLImP when studying EGFR oligomerisation. Bey ond single molecule imaging, this w ork has applications for a v ariety of time series change p oint detection problems with heterogeneous state p ersis- tence. F or example, electro corticograph y brain-state segmentation, fault detection in industrial pro cess monitoring, realised volatilit y in financial time series, sp eech segmentation and en vironmental sensor monitoring. Keyw ords: Reversible jump, Marko v c hain Mon te Carlo, c hange point detection, sup erresolution imaging, photobleach step analysis, single molecule localisation microscopy , time series 1 In tro duction Iden tifying change p oints in time-series data is fundamental to understanding dynamic systems in a v ariet y of appli- cations from financial markets to healthcare monitoring [ 1 ]. Reversible jump Marko v chain Monte Carlo (RJMCMC) offers a principled solution to suc h problems, enabling trans-dimensional estimation of the num ber and location of c hange p oints, and so is capable of mo delling discrete even ts embedded in contin uous, noisy data. How ever, when tem- p oral dynamics are heterogeneous within the model, short-liv ed lev el changes are often missed or mistakenly considered as noise or outliers, despite the potential to mark biologically , physically , or op erationally meaningful even ts [ 2 – 6 ]. Standard RJMCMC approaches often fail to account for short-lived even ts accurately for tw o main reasons. 1) Short-liv ed even ts are w eakly penalised in reversible jump Mark ov chain Monte Carlo, as their brief duration con tributes little to the o verall lik eliho o d, highligh ting a broader challenge in capturing heterogeneous temporal dynamics. 2) Mo delling these short-lived ev ents typically requires the addition of tw o closely spaced change points; one to enter 1 and one to exit the state. The first prop osed change p oin t often introduces a temp orary mismatc h with the observ ed data, reducing the model likelihoo d and, in the case of RJMCMC, resulting in a lo w acceptance probability . This mak es addition of b oth c hange p oin ts unlik ely unless an exhaustive search of p ossible configurations is performed. As a result, chains can exhibit p oor con vergence, with short-lived states inconsistently identified [ 2 ]. In cases where m ultiple c hange p oin ts can b e added simultaneously [ 7 ], the aforementioned problems p ersist as acceptance is unlikely unless both c hange p oin ts are simultaneously correctly placed, and so samplers remain inefficien t in the presence of short-liv ed even ts, as provisions are not made to explore closely-spaced changepoints. One field where this issue is particularly pronounced is photobleach step analysis in single molecule lo calisation microscop y . In photobleach step analysis, fluorescently tagged protein subunits are imaged o ver time. The small separations b et w een these sub-units (as low as 5nm to 50nm) lie w ell b elo w the diffraction limit of conv en tional ligh t microscop y ( ∼ 250nm) and so the fluorophore p oin t spread functions ov erlap appearing as a single point spread function, from which the individual fluorophores cannot b e resolved. Discrete changes in one-dimensional fluorescence in tensity traces are therefore used to coun t the num b er of activ e fluorophores p er-frame. In this field, data naturally tak es the form of step functions, corresp onding to discrete fluorophore counts. These counts can b e used to estimate the oligomeric distribution of protein p opulations in a sample, or, when considering the frame-wise active fluorophore coun t, to determine nanoscale protein separations and study protein oligomerisation. How ev er, the reliability of each application dep ends directly on the accuracy of the initial fluorophore coun ting [ 8 – 17 ]. In photobleac h step analysis, fluorophores most often reside in an activ e, fluorescent state and even tually mov e in to an irrev ersible, inactive, photobleached state. Ho w ever, fluorophores can also displa y complex photoph ysical behaviour, including short-lived ‘off ’ states known as blink states and longer-lived dark states [ 18 ], as visualised in Fig. 1 . These temp orary changes in fluorescence can lead to incorrect estimation of per-frame active fluorophore counts, or may force partial or complete exclusion of traces, particularly when such deviations are misclassified as noise or considered analytically intractable. This issue is especially pronounced during separation localisation, where accurate per-frame fluorophore counts are critical, and the misattribution of short lived states can compromise subsequent positional measuremen ts [ 9 , 19 – 21 ]. Sev eral approac hes to fluorophore counting in photobleach step analysis hav e b een prop osed. How ever, man y existing metho ds assume intensit y is monotonically decaying and so cannot accommo date blink or dark states [ 19 , 22 ]. Those that do supp ort reversibilit y often suffer from high computational demands [ 23 ] or limited scalability [ 24 ]. Certain approac hes address the unkno wn num b er of fluorophores, and consequently the unkno wn num b er of changepoints, by o verestimating this num ber and representing the presence or absence of eac h with a binary indicator [ 23 , 25 , 26 ]. This form ulation allo ws for c hangepoints to be identified but introduces inefficiencies in the estimation pro cess. Correctly iden tifying related intensit y parameters, namely single-fluorophore and bac kground intensit y , is also essential, yet existing metho ds often require prior user knowledge [ 23 ], fix intensit y parameters at the b eginning of analysis [ 24 ], or rely on calibration from lab elled traces [ 22 ], which are often not av ailable in this field. RJMCMC has b een applied to sev eral problems in fluorescence microscopy and related imaging contexts [ 27 , 28 ], ho w ever, these applications ha v e largely fo cused on spatial reconstruction problems and do not address one-dimensional integrated intensit y traces. In this pap er, an RJMCMC sampler for m ultiple c hange point analysis is proposed to estimate p er-frame activ e fluorophore counts in photobleac h step analysis, with a fo cus on short-lived blink and dark state s. Comp ound change p oin t mo v es are in tro duced to add or remo v e pairs of change p oin ts based on prior kno wledge of fluorophore transitions and dwell times. These mo ves av oid the low-lik eliho od intermediate state in single change point approaches, and allow pairs of c hange p oin ts to b e placed sufficiently close together with the guidance of an informed prop osal distribution, without requiring filtering or trace exclusion. In addition, intensit y parameters are initialised using b oth p opulation- and trace-lev el information and are up dated during analysis, reducing reliance on user-specified inputs and labelled calibration datasets. T o demonstrate the approac h, the Compound RJMCMC (CRJMCMC) method was developed for use with data derived from Fluorescence Lo calisation Imaging with Photobleaching (FLImP) [ 29 ]. FLImP uses photo- bleac h step analysis to resolve nanometre-scale separations within fluorescen tly lab elled membrane protein oligomers, suc h as the Epidermal Gro wth F actor Receptor (EGFR), to study c hanges in oligomerisation follo wing mutations in their DNA; a pro cess linked to the developmen t of cancers suc h as non-small cell lung cancer. Once p er-frame active fluorophore counts hav e b een obtained, this information can b e com bined with knowledge of the shap e of fluorophore p oin t spread functions to enable spatial localisation, and so accurate per-frame counts are essential [ 21 , 30 ]. More broadly , the CRJMCMC algorithm provides a generalisable approach for detecting brief, meaningful signal c hanges in time-series data, with p oten tial applications across biological, clinical, and engineering domains. This paper is structured as follows. Section 2 v alidates the CRJMCMC metho d using b oth simulated and exp eri- men tal FLImP data, comparing p erformance against leading alternativ es and the existing analysis approach for FLImP data. Section 3 presen ts a discussion of the broader implications and p otential extensions of the metho d. The metho ds are outlined in Section 4 ; Section 4.1 introduces the multiple change p oin t mo del developed for photobleach step anal- ysis. Section 4.2 outlines RJMCMC for change p oint detection in photobleach step analysis. Section 4.3 incorp orates the comp ound change p oin t mo ve designed to directly model short-liv ed dark states. Section 4.4 details the Gibbs 2 sampler for the intensit y parameters, and Sections 4.5 and 4.6 describ e the simulation of traces and the collection of exp erimen tal data, resp ectiv ely , for v alidation purp oses. blink state dark state Fluorescent Photobleached Blink Dark - state Active Inactive 0.001 0.010 0.990 0.970 0.030 1.000 0.969 0.010 0.020 a b Fig. 1 : Visualisation of complex photoph ysical b eha viour of fluorophores. (a) Marko v c hain describing flu- orophore state transitions. Fluorophores t ypically exist in one of four states: bright (fluorescent), blinking (short-term dark), long-liv ed dark, or photobleac hed, and they transition b et ween these as indicated b y the arrows. Bright fluo- rophores emit detectable photons; blinking and dark states inv olve temp orary loss of fluorescence, and photobleac hing is a permanent transition to an off-state. Probabilities presen ted here ha ve b een obtained from [ 29 ]. Note that there can b e m ultiple dark states, but for the purp oses of this study , this simplified model is implemen ted based on Alexa Fluor 488 fluorophores [ 21 ]. (b) Examples of blink and dark states. Blink and dark states are reversible even ts whic h pro duce temp orary drops in fluorescence that are visually indistinguishable from the irreversible photobleaching. Blink states are very short, t ypically only lasting 1-2 frames, whereas dark states are longer lived, with dwell time depending on the type of fluorophore used. 2 Results The CRJMCMC algorithm is v alidated on b oth simulated and exp erimental datasets where 18,600 datasets were used to b enc hmark the CRJMCMC algorithm against state-of-the-art alternatives describ ed in Bry an IV et al. (2022) [ 23 ], Garry et al. (2020) [ 22 ], and Tsekouras et al. (2016) [ 24 ]. The simulation study w as designed to span a range of conditions by v arying SNR, fluorophore num b er, single fluorophore photon count, and the frequencies and durations of blink and dark states. Default v alues included photon coun ts ranging from 500 to 2,000 per fluorophore, an SNR 3 b et w een 0.01 and 1, and fluorophore coun ts ranging from one to four. Emphasis w as placed on lo w er fluorophore coun ts that are most commonly observ ed in FLImP exp erimen ts, with typical scenarios inv olving tw o to four fluorophores p er complex, extended here to one to four, to include the study of monomer traces. This fo cus reflects the prev alence of small oligomeric states in proteins suc h as the EGFR, where dimers and tetramers dominate under physiological conditions [ 30 ]. Each condition w as then extended b eyond t ypical exp erimen tal v alues to assess robustness under more extreme scenarios. The full simulation study is provided in the Supplementary Information (S11). Exp erimen tal v alidation was p erformed using FLImP traces acquired from GA TT Aquan t DNA origami rulers [ 31 ], whic h consist of DNA rectangles con taining up to four binding sites lab elled with A TTO-647N fluorophores, and results were compared with those obtained from the existing analysis approach for FLImP data [ 21 ] in the absence of ground truth. 2.1 Comparison against other metho ds The p erformance of CRJMCMC is ev aluated against three alternativ e approaches; the sequential MAP change p oin t metho d from Tsekouras et al. (2016) [ 24 ]; the monotonic decay MAP change p oin t metho d from [ 22 ], calibrated using lab elled single-fluorophore traces; and the factorial hidden Marko v mo del (HMM) implemented via Marko v chain Mon te Carlo (MCMC) as describ ed in Bryan IV et al. (2022) [ 23 ], using the same initial estimates for the mean single-fluorophore intensit y as calculated in CRJMCMC (1) (2) . CRJMCMC was implemented using three indep enden t parallel c hains for eac h dataset. Eac h chain w as initialised with a unique seed and run for 20,000 iterations, with half of the iterations discarded as burn in. Conv ergence was assessed by considering pairs of c hains and calculating the p oten tial scale reduction factor for all parameters, using a threshold of 1 . 2. If conv ergence was not achiev ed, a further 10,000 iterations w ere p erformed until tw o c hains conv erged, up to a user defined maximum num ber of iterations. A detailed description of this con vergence criteria and an analysis of con v ergence and other MCMC diagnostics can be found in the Supplementary Information (S8, S10). Estimation of intensit y h yp erparameters, such as single fluorophore and bac kground in tensity , was carried out b y grouping all datasets with the same mean and SNR, in line with the assumption in photobleac h step analysis that fluorophores within a single exp erimen t p ossess similar photophysical prop erties (3) . The performance metric, the root mean square error (RMSE) b et ween the ground truth and estimated in tensity traces was computed across all frames for each method, and the 95% confidence in terv als included for eac h. This metric w as chosen to demonstrate p erformance o ver all parameters in each frame, rather than fo cusing solely on total fluorophore count. Additional p erformance metrics, suc h as per-frame active fluorophore accuracy and precision, are pro vided in the Supplementary Information (S11). Figure 2 shows b oth the RMSE and represen tative example results from each metho d as fluorophore counts, SNR, and short-lived state frequency are v aried. The graphs sho w intensit y against time frames, alongside the ground truth and predicted in tensity traces, based on the e stimated mean single fluorophore intensit y , µ f , the calculated num b er of active fluorophores in eac h frame, n i , derived from estimated c hange p oin t lo cations, and the estimated background, µ b . As shown in Fig. 2 (a) and 2 (b), at higher fluorophore counts, the p erformance of both MAP-based methods deteriorates, whereas CRJMCMC p erform comparably with the factorial HMM-MCMC approach, main taining lo w RMSE up to seven teen fluorophores. The monotonic MAP and sequen tial MAP approac hes tend to incorrectly estimate the mean fluorophore in tensity , leading to ov erestimated coun ts and larger errors. Strict priors, controlled by the scaling factors on µ f and µ b , ensure that CRJMCMC produces reliable estimates for these parameters, which guide con vergence to the correct n umber of active fluorophores. A t low fluorophore counts, the factorial HMM-MCMC sees an increase in RMSE and, for single-fluorophore traces, pro duces only flat traces corresponding to zero fluorophores in this region of the sim ulation study . Consequen tly , no results are obtained for such traces. This demonstrates its unsuitabilit y for estimation in smaller structures. In contrast, the CRJMCMC approach main tains low RMSE under the same conditions. Figures 2 (c) and 2 (d) show the results when SNR is v aried, and it can b e seen that CRJMCMC achiev es the low est RMSE, remaining robust down to an SNR of 0.001. The factorial HMM-MCMC sho wed substantial o verfitting at lo w SNR, with excessive state transitions leading to po orer p erformance. In con trast, the CRJMCMC algorithm av oids o verfitting by incorp orating priors on the n umber of c hange p oin ts. Figures 2 (e) and 2 (f ) show the results of v arying dark-state frequency , ac hieved by v arying probabilit y of transition- ing from the activ e bright state into the dark state. Additional metrics for v arying blink state frequency can b e found (1) The factorial HMM–MCMC metho d was applied to each dataset separately , rather than in parallel as multiple ROIs, as the traces are not constrained to b e of equal length and therefore do not satisfy this requirement of [ 23 ]. (2) It is imp ortan t to note that, at low fluorophore counts, the factorial HMM-MCMC approach frequently pro duced flat traces corresp onding to zero fluorophores. These traces have b een filtered from the analysis to av oid skewing the comparison, how ever this resulted in the exclusion of approximately 50% of all simulated traces, including 98% of one-fluorophore traces, 89% of tw o-fluorophore traces, and 37% of three-fluorophore traces. Giv en this high exclusion rate, the factorial HMM-MCMC method may be unsuitable for determining per-frame fluorophore coun ts in smaller oligomeric states, such as those encountered in the study of EGFR oligomerisation with imaging techniques such as FLImP . (3) As a result of this, the calibration carried out on the monotonic MAP algorithm in Garry et al. (2020) [ 22 ] produces the same in tensity parameters for all data in a p ool. 4 b d f a c e Fig. 2 : Performance of CRJMCMC across simulated in tegrated in tensit y traces. CRJMCMC is compared with previously published methods by [ 24 ] (green line), [ 22 ] (purple line), and [ 23 ] (orange line). Panels a , c , and e sho w represen tativ e in tegrated in tensity traces under increasing fluorophore n umber ( a ), decreasing SNR ( c ), and increasing frequency of short-liv ed states ( e ). Corresp onding a verage root mean squared error (RMSE) v alues and 95% confidence interv als are summarised in panels b , d , and f across each scenario. in the Supplemen tary Information (S11). Across all tested probabilities, CRJMCMC achiev ed low RMSE, p erforming comparably with the factorial HMM-MCMC approach at higher frequencies. As exp ected, the monotonic decay MAP metho d p erformed p oorly as frequency increased, due to its inability to detect rev ersible short-lived off states. In terms of computational cost, T able 1 sho ws the av erage run times across all sim ulations for eac h of the considered metho ds, where the CRJMCMC algorithm takes on av erage 89.31s ( ± 1.01) to complete a single trace, and the monotonic MAP and sequen tial MAP c hange point algorithms tak e on av erage 10.90s and 15.85s. How ever, the impro vemen t in p erformance pro vided b y the CRJMCMC method out weighs this additional computational cost. F urthermore, CRJMCMC remains o ver 3 times faster than the factorial HMM-MCMC metho d describ ed in Bryan IV et al. [ 23 ], which in volv es sampling across an expansiv e latent state space, and which has b een previously observed to incur a high computational cost of up to 900s per run [ 26 ]. All analyses w ere p erformed on Dell P ow erEdge R6525 5 T able 1 : Average run times and 95% confidence interv als (in seconds) across considered metho ds. Method Time (s) CRJMCMC 89.31 ( ± 1.01) F actorial HMM-MCMC 324.81 ( ± 7.50) Monotonic MAP 10.90 ( ± 0.35) Sequential MAP 15.84 ( ± 0.23) compute no des, and the CRJMCMC metho d was p erformed using CPU-based parallelism, thus further optimisation through including GPU acceleration is exp ected to lead to considerable gains in sp eed and scalabilit y . 2.2 Results on exp erimen tal data 370 FLImP selected traces with their estimated fluorophore counts were used as ground truth for v alidation, where trace selection and fluorophore level identification were p erformed using the FLImP pro cedure describ ed in Iyer et al. (2024) [ 21 ]. Two examples from DNA origami ruler traces are shown in Fig. 3 , comparing results from the CRJMCMC algorithm to the lab elled p ortions of the traces returned b y the existing analysis for FLImP data describ ed in Iy er et al. (2024) [ 21 ], used here as ground truth. T o assess p erformance of these datasets, frame-wise accuracy , precision, and sensitivit y were computed by comparing the estimated num b er of activ e fluorophores to the reference v alues provided b y the FLImP trac k selection algorithm. T rue positives and true negatives represent frames in whic h the estimated and FLImP fluorophore coun ts matc h when they are greater than zero, or equal to zero, respectively , and false positives and false negatives corresp ond to ov er- or underestimation of fluorophore num b ers, resp ectiv ely (4) . a b Fig. 3 : Analysed in tensit y traces from GA TT Aquant DNA origami rulers . ( a ) CRJMCMC (red) detects additional fluorophore levels exceeding those identified b y [ 21 ] (black). ( b ) CRJMCMC recov ers state transitions excluded by the filtering in Iyer et al. (2024) [ 21 ]. As shown in Fig. 3 the CRJMCMC algorithm ac hieves high frame-wise accuracy relative to the metho d in Iyer et al. (2024) [ 21 ], ev en in complex scenarios such as staggered fluorophore state transitions or short-liv ed state transitions. In these cases, the metho d in Iyer et al. (2024) [ 21 ] often discards substan tial p ortions of the trace during filtering, whereas the CRJMCMC algorithm retains and models a larger fraction of the data, capturing approximately 30% more frames. In addition, it can b e seen that the comp ound rev ersible jump approac h is able to identify additional lev els, and th us, higher-order complexes than are curren tly captured by [ 21 ], suggesting the presence of additional spurious fluorophores. T able 2 sho ws accuracy , precision, and sensitivity of CRJMCMC estimates across FLImP- lab elled portions of 370 integrated intensit y traces with tw o, three, and four identified fluorophore lev els. Owing to the absence of an indep endent ground truth, the metho d of [ 21 ] was used as a reference for these metrics. As this reference is imp erfect and is kno wn to be less efficien t and to exclude v alid observ ations, the v alues in T able 2 underrepresen t the full p erformance gains achiev ed by the CRJMCMC algorithm. Despite this, strong pe rformance is observed across all tested fluorophore lev els. (4) Specificity is omitted here as the FLImP algorithm currently do es not store zero-level information and so true negatives are not able to b e assessed. 6 Fluorophore Level 2 3 4 Accuracy 0.894 ( ± 0.037) 0.854 ( ± 0.050) 0.922 ( ± 0.044) Precision 0.911 ( ± 0.035) 0.891 ( ± 0.047) 0.955 ( ± 0.030) Sensitivity 0.947 ( ± 0.030) 0.927 ( ± 0.039) 0.967 ( ± 0.035) T able 2 : Summary of accuracy , precision, and sensitivity across traces with tw o, three, and four fluorophore levels iden tified, based on results from 370 FLImP-analysed tracks, with 95% confidence in terv als in brack ets. 3 Discussion In this pap er, an extended comp ound RJMCMC algorithm, termed CRJMCMC, was developed to enable robust estimation of change p oin t lo cations in the presence of short-lived states. Cen tral to this approac h is the introduction of mov es whic h prop ose or remov e pairs of c hange p oin ts jointly to capture short-liv ed but meaningful changes. In the con text of photobleach step analysis for the study of protein organisation at the nanoscale, using FLImP integrated in tensity traces [ 21 ], this algorithm improv es estimation of active fluorophore counts p er-frame, reducing the need for prior calibration or hea vy filtering. The CRJMCMC metho d was b enc hmarked against several state-of-the-art alternatives in photobleach step analysis, including sequen tial MAP c hange point detection [ 24 ], MAP with a monotonic deca y model [ 22 ], and a factorial HMM- MCMC approach [ 23 ]. Application to sim ulated integrated intensit y traces show ed impro ved p erformance across a range of fluorophore coun ts, SNR, and short-state transition frequencies. The CRJMCMC method remained robust up to sev enteen fluorophores and retained high p er-frame accuracy as SNR decreased as lo w as 0.001, where existing methods often o verfit the n umber of fluorophore transitions. CRJMCMC notably outp erformed metho ds at low fluorophore coun ts, demonstrating its suitability for the study of EGFR oligomerisation under physiological ligand concentrations, where smaller-order structures suc h as dimers and tetramers are most prev alen t [ 30 ]. F urther v alidation using DNA origami ruler data demonstrated that the CRJMCMC metho d recov ered appro x- imately 30% more usable frames than the existing analysis approac h for FLImP data [ 21 ], while maintaining p erformance under exp erimen tal v ariability . These gains w ere achiev ed without calibration traces, prior kno wledge of fluorophore brightness, or extensive pre-filtering. More usable frames directly improv es localisation precision b y pro viding more data p oin ts from which spatial separations b etw een fluorophores can b e inferred. In addition, the existing analysis approac h for FLImP data supp orts only traces containing tw o, three, or four fluorophore lev els [ 21 ]. This CRJMCMC algorithm expands this range, enabling accurate estimation of higher-order fluorophore counts, and in single molecule localisation microscop y , each additional fluorophore doubles the amoun t of structural information reco vered. This metho d th us impro v es data utilisation and increases the throughput of one-dimensional in tegrated in tensity traces obtained from FLImP . The CRJMCMC method also enables analysis of single fluorophore traces, which are currently ignored in the existing analysis approac h for FLImP data, as they do not provide fluorophore separation information [ 21 ]. Ho w ever, these traces still contain useful information ab out the con tents of a sample and can b e used to improv e lo calisation precision in single molecule imaging ov er STORM, as sho wn through Resolution Enhancement b y Sequen tial Imaging (RESI) describ ed in [ 32 ]. A limitation of this approach arises, ho wev er, when multiple fluorophores are active in a single frame, a case where FLImP is particularly well- suited. This CRJMCMC algorithm thus presen ts an opp ortunit y for seamless in tegration of FLImP and RESI, allo wing increased precision ov er a wide range of fluorophore counts, with the inclusion of single fluorophore traces. Automatic fluorophore coun t estimation from traces also enables more robust oligomer size determination across a p opulation of traces from a single acquisition, a pro cess that is typically p erformed manually . This capability is not curren tly pro vided by the existing analysis for FLImP data [ 21 ], y et is v aluable in its o wn right, e.g. to inform diagnostic and therap eutic applications [ 33 ] or for understanding cell functionality [ 34 ], and as a prepro cessing step to assess sample quality prior to downstream analysis, particularly when working with limited-access or exp ensiv e equipment. The CRJMCMC algorithm pro vides a robust, automatic metho d for estimating change p oin t lo cations and p er-frame active fluorophore coun ts from complex in tegrated intensit y traces. Key limitations of existing tools are addressed, including lack of consideration for short-lived dark states, reliance on calibration, extensive user input, and exclusion of informative data through heuristic filtering. CRJMCMC enables more complete and automated analy- sis of step-lik e time-series signals in photobleac h step analysis, with RMSE ov er time-signal traces seeing on av erage a t wo-fold improv emen t compared to existing methods. More broadly , the introduction of comp ound change p oint mo ves pro vides an approac h to b etter model short-lived states within RJMCMC to more precisely and more rapidly fit temp oral data with heterogeneous c hange p oin t distributions. With domain sp ecific knowledge of pro cesses underpin- ning the distribution of heterogeneous temp oral dynamics, this metho d has broad applications including ECG cardiac 7 arrh ythmias [ 35 ] and ion c hannel rec ordings [ 36 ] in biology , fault detection in engineering [ 37 ], traffic collision even ts [ 38 ], seismology [ 39 ], and sp eec h signal segmen tation [ 40 ]. Data and Co de av ailabilit y . Co de for trace simulation and implemen tation of CRJMCMC is av ailable up on reasonable request, as are the exp erimen tal DNA origami datasets used in analysis. Supplemen tary information. Supplementary information is a v ailable, including tables detailing the full sim u- lation study with additional metrics, MCMC diagnostics, sensitivit y analyses, and further information to supp ort implemen tation of CRJMCMC. Ac knowledgemen ts. This work w as funded by a Northern Ireland Departmen t for the Economy Collab orativ e Aw ard in Science and T echnology (DfE CAST) studentship, in collab oration with the Central Laser F acility OCTOPUS group at the Science and T echnology F acilities Council (STFC). Special thanks are given to Dr Sarah Needham for the preparation of DNA origami samples for FLImP imaging. 4 Metho ds 4.1 Multiple change p oin t mo del Supp ose that there are k change p oin ts at positions s 1 , . . . , s k , in time, where s 0 = 0 and s k +1 = L , the time of the final frame, so that s = ( s 0 , s 1 , . . . , s k , s k +1 ) (5) . It is assumed that the n umber of change p oin ts, k , is Poisson distributed with mean λ , constrained to the range 1 ≤ k ≤ k max , where k max is the maximum num b er of exp ected c hange p oints, c hosen prior to analysis as a v alue large enough to allow full exploration of the c hange p oin t parameter space. Giv en k , the lo cations, s 1 , s 2 . . . , s k are distributed as the k even-n umbered order statistics from a sample of 2 k + 1 p oin ts from the uniform distribution on ( s 0 , s k +1 ) [ 41 ]. As described in [ 41 ] and [ 42 ], this distribution minimises clustering of change p oin ts and p enalises the app earance of interv als b etw een change p oin ts where there are no data. The full deriv ation of the joint distribution of s 1 , s 2 , . . . , s k is describ ed in the Supplemen tary Information (S1), and is given by f ( s 1 , s 2 . . . , s k ) = (2 k + 1)! 1 ( s k +1 − s 0 ) 2 k +1 k Y i =0 ( s i +1 − s i ) . (1) Considering now the photobleach step analysis problem, the observ ed intensit y in eac h frame, denoted y i for i ∈ { 1 , . . . , N } , is mo delled as a Gaussian random v ariable whose mean and v ariance dep end on the num ber of activ e fluorophores, n i [ 9 , 19 , 43 ]. The Gaussian distribution is c hosen as it pro vides a tractable approximation to the Poisson distribution of photon emission, particularly when dealing with high photon coun ts such as those encoun tered in photobleac h step analysis, where the factorials in volv ed in the P oisson distribution make calculations infeasible [ 43 ]. The Gaussian distribution also allows for indep endent mo delling of fluorophore intensit y v ariance and background noise v ariance. Note that this approach could b e extended to other noise mo dels; ho wev er a Gaussian approximation to the noise is sufficient for the purp oses of this analysis. It is assumed that all fluorophores in a single trace contribute indep enden tly and iden tically; each emits the same a verage photon intensit y , µ f , and v ariance, σ 2 f (6) . Background noise is similarly assumed to be stationary , with constan t mean, µ b , and v ariance, σ 2 b , throughout each trace. The intensit y , y i , is thus giv en by y i ∼ N µ i , σ 2 i , where µ i = µ f n i + µ b and σ 2 i = σ 2 f n i + σ 2 b , where n i ∈ N is the n umber of active fluorophores in frame i (7) . This in tensit y is piecewise constan t in the dwelling, j , for j = 1 , . . . , k , b et ween tw o adjacen t change p oin ts, s j and s j +1 , as the num b er of active fluorophores, n j , is assumed constant in eac h dw elling, with c hange p oin ts representing the transition(s) b et ween bright and dark states. The in tensity level of each dwelling is therefore µ f n j + µ b , with n j calculated to b est fit the dwelling [ 19 ] (8) . In addition, it is not required that fluorophores all begin in an active state, but it is assumed that all fluorophores will ha ve photobleached b y the end of the trace, as this is part of the termination criteria in the FLImP image acquisition [ 21 ], and is widely accepted in the field of photobleac h step analysis. (5) Note that the time of the final frame, L , is distinct from the final frame, N , as it is p ossible change p oints o ccur at times in b et ween frames. (6) Alexa Fluor 488 fluorophores used in FLImP display only a single bright state and so there is a single mean intensit y µ f , rather than multiple bright states, as in Bryan IV et al. (2022) [ 23 ]. (7) Although fluorophores can transition over multiple frames, suggesting that fractional active counts may exist, here, the n i are fixed to non- negative integers, as interest lies in determining whether a fluorophore is detectably active or inactive. This binary classification is the more widely accepted definition of n i , and it is the form of information that will prov e useful in photobleach step analysis for both fluorophore counting and, in the case of FLImP , downstream lo calisation [ 13 ]. (8) Note here that the num b er of active fluorophores is calculated rather than the height b eing randomly allocated using a weigh ted geometric mean, as is the case in Green et al. (1995) [ 41 ], to fit within the constraint that n i are non-negative integers. 8 The mean single-fluorophore intensit y , µ f , and mean background intensit y , µ b , are b oth assumed to b e normally distributed with means η f and η b and v ariances ν f and ν b , resp ectiv ely , so that µ f ∼ N ( η f , ν f ) µ b ∼ N ( η b , ν b ) . The v ariances of single-fluorophore and background intensit y , σ 2 f and σ 2 b , are b oth assumed to follow inv erse- Gamma distributions, conjugate priors for the Gaussian distribution [ 44 ], with shape parameters α f and α b , and scale parameters β f and β b , resp ectiv ely , so that σ 2 f ∼ Inv-Gamma( α f , β f ) , σ 2 b ∼ Inv-Gamma( α b , β b ) . With all of the abov e parameters defined, the mo dels are defined b y the pair ( k , θ k ), where the vector of parameters to b e estimated, θ k , is given b y θ k = ( s , µ f , µ b , σ 2 f , σ 2 b ) . 4.2 Rev ersible jump for photobleac h step analysis Green (1995) [ 41 ] in troduced RJMCMC analysis, presen ting both the general framew ork and an application to one- dimensional multiple change p oin t problems using the coal mining disasters dataset [ 45 ]. RJMCMC extends the Metrop olis–Hastings algorithm b y enabling transitions betw een mo dels whose parameter spaces are of differen t dimen- sion while preserving detailed balance. Within a change p oint context, this corresp onds to mo dels with differen t n umbers of c hange p oin ts. Briefly , in Green (1995) [ 41 ], at each iteration a mov e is randomly selected from four p ossible options: birth, death, shift, or a heigh t change, with probabilities that dep end on the curren t num b er of change p oints, k . Birth and death mo ves are dimension c hanging and resp ectiv ely prop ose the addition or remov al of a single change point, together with a transformation of the associated heigh t parameters, suc h that detailed balance is preserved. Shift mov es main tain the num b er of change p oints and are p erformed by selecting an existing change p oin t at random and prop osing a new lo cation uniformly b et ween the neigh b ouring change points. Height mo v es update the heigh t of a randomly chosen segmen t b et ween t wo change points, while keeping all lo cations fixed. An adaptation of RJMCMC for photobleach step analysis is presented here, where the birth-death-shift structure dev elop ed by Green (1995) [ 41 ] is retained and the notation of Green (1995) [ 41 ] is follow ed throughout unless stated otherwise. As the num ber of activ e fluorophores, n i , is calculated directly from the data, a mov e to mo dify the height of a randomly c hosen change p oint is not required. Th us, this shift mov e probability , π k , is simply defined as π k = 1 − ( b k + d k ) for all k = 1 , . . . , k max , where b k and d k are the probabilities of prop osing birth and death mov es resp ectiv ely , b oth of whic h retain the definition in Green (1995) [ 41 ], of b k = c min 1 , P ( k + 1) P ( k ) and d k +1 = c min 1 , P ( k ) P ( k + 1) , where P ( k ) is the Poisson probability of there b eing k change p oin ts with mean λ , and c is the largest constant such that b k + d k ≤ 0 . 9 for all k = 1 , . . . , k max . A t each iteration, and for each possible c hange p oin t configuration prop osed, the heigh ts betw een c hange p oin ts are determined by first calculating the num b er of activ e fluorophores in each dwelling, n j , for j = 1 , . . . , k , and com bining this with the current v alues for the mean fluorophore intensit y and mean background in tensit y to get the height as µ f n j + µ b . The num b er of fluorophores in each dwelling is calculated by determining the optimal n j so that µ f n j + µ b pro vides the b est fit to the data in dw elling j , under the constrain t that there is a genuine change at each s j , i.e. n j = n j +1 for all j = 1 , . . . , k . A detailed description of the calculation of the n umber of activ e fluorophores in each dw elling is pro vided in the Supplementary Information (S3). The shift mov e retains the structure describ ed in Green (1995) [ 41 ], but in this adaptation, the new c hange p oin t lo cation, s ∗ j , is c hosen randomly from a predefined custom prop osal distribution, q ( s ∗ j | s ∗ j ∈ ( s j − 1 , s j +1 ), rather than a uniform distribution. This prop osal distribution is constructed in a preliminary analysis of the dataset by identifying regions where there is erratic b eha viour in the in tensity , and so is designed to improv e the o verall conv ergence of the sampler. A full description of the construction of this custom discrete distribution is provided in the Supplemen tary Information (S4) (9) . (9) A discretised distribution is chosen here for the c hange point locations to reflect the discrete time frames common in single molecule localisation microscopy , but note that the resolution can b e refined to a user-required precision. 9 The adapted shift acceptance probability is then calculated as follows, with the new addition of the prop osal ratio of lo cation probabilities, α shift = min 1 , ( s j +1 − s ∗ j )( s ∗ j − s j − 1 ) ( s j +1 − s j )( s j − s j − 1 ) × likelihoo d ratio . The likelihoo d ratio is determined using the Gaussian distribution ov er the data y = { y 1 , . . . , y N } , and the num b er of active fluorophores for b oth L ( y | k , θ ∗ k ) and L ( y | k , θ k ) are calculated from s ∗ and s , resp ectiv ely . The structure of the algorithm in Green (1995) [ 41 ] is retained for the birth mo v e, with the follo wing tw o main c hanges. 1) A new change p oin t lo cation, s ∗ j , is prop osed using the aforementioned custom distribution across all time frames. 2) Height is calculated by considering the b est-fit n umber of active fluorophores, n j , rather than randomly dra wn. The prior ratio for the adapted birth mov e then b ecomes P ( k + 1) P ( k ) × 2( k + 1)(2 k + 3) L 2 × ( s ∗ − s j )( s j +1 − s ∗ ) ( s j +1 − s j ) , with the new acceptance probability α birth = min 1 , prior ratio × likelihoo d ratio × d k b k q ( s ∗ )( k + 1) , where the uniform 1 /L term in Green (1995) [ 41 ] is replaced with q ( s ∗ ) from the custom prop osal distribution. In addition, as no additional heigh t parameter is in tro duced, no random v ariable, u is required. The adapted reverse death mo ve is simply p erformed by dra wing one of the existing c hange p oin ts at random, and its acceptance probability is giv en b y the recipro cal of the birth mov e with appropriate relab elling. Th us, detailed balance is therefore maintained solely through the proposed lo cation, s ∗ , and the uniform selection of a c hange p oin t to remo v e in the reverse death mo ve. Consequen tly , the Jacobian reduces to one, simplifying the acceptance probabilities for b oth birth and death mo ves. 4.3 Comp ound mov es for short-lived states Tw o comp ound c hange point mov es are no w in tro duced that simultaneously add or remov e tw o change p oints, which together create a short-lived state, in a single iteration. A short-lived state is defined as a pair of c hange points, s t 1 and s t 2 , which: 1. Are on av erage a maximum duration, τ , apart, such that | s t 1 − s t 2 | ≤ τ ; 2. Create a deviation from the current intensit y level, rather than a monotonically increasing or decreasing pattern. F or any tw o c hange p oin ts, the second requirement, that the pair creates a deviation, is simply determined by v erifying that the num b er of activ e fluorophores b efore and after the c hange points are equal, but distinct from the n umber in b et w een. How ever, the first requiremen t, that the tw o c hange p oints are sufficien tly close together, is more difficult to v erify without imposing a hard cut-off. T o address this, a test analogous to the accept-reject step of a Metrop olis-Hastings sampler is p erformed. It is assumed that the duration b et w een prop osed change points is a random v ariable, denoted D , and follows an exponential distribution, D ∼ exp( λ D ). The first requiremen t for a short-liv ed state is ev aluated for an observ ed separation d b et ween change p oints under this mo del. T o ensure that shorter durations, i.e. where d < τ , are lik ely to b e accepted, and longer durations are p enalised while av oiding a hard threshold, the probability that d is consistent with the assumed distribution of short-lived states is computed using the complement of the cumulativ e distribution function: α D = P ( D > d ) = exp( − λ D ) , where the rate λ D is chosen so that α D = p at a user-defined duration τ , and for a user-defined probability p which con trols the rate of deca y , where this τ is typically selected to represent the expected length of a short-liv ed state. This leads to: λ D = − log( p ) τ , with p ∈ (0 , 1) . The probability α D is then compared with a random draw u ∼ Unif(0 , 1). If u ≤ α D , the prop osed pair of change p oin ts is accepted as satisfying the duration requiremen t of a short-liv ed state. Unlik e hard thresholding, this approac h in tro duces tunable parameters p and τ to build-in prior knowledge while main taining flexibility . In order to add and remo ve short-lived states, a new parameter must be in tro duced whic h stores the num b er of c hange p oin ts associated with these states, denoted here as k t . This parameter is a subset of k so that k t ≤ k , and serv es as an additional mo del indicator so that the models are no w defined b y ( k , k t , θ k,k t ). 10 Assume, as b efore, that the num b er of change p oin ts, k , and the num b er of short-lived state change p oin ts, k t , are b oth dra wn from P oisson distributions with means λ and λ t , resp ectiv ely , conditioned on k ≤ k max and k t ≤ k . Tw o new mo ves are defined whic h resp ectiv ely add or remov e short-lived states by adding or removing tw o c hange p oin ts sim ultaneously and th us ha ve t wo new probabilities, a k,k t and r k,k t , whic h represent the probabilit y of prop osing eac h of these mov es. As prop osed b y [ 7 ], in order for detailed balance to hold in the case of short-lived state mov es, the probabilities of prop osing these mo ves must satisfy an analogous condition to that provided in Green (1995) [ 41 ], P ( k ) b k = P ( k + 1) d k +1 . (2) F or short-lived state mo ves this is given b elo w as P ( k ) P t ( k t ) a k,k t = P ( k + 2) P t ( k t + 2) r k +2 ,k t +2 (3) It is assumed that k and k t are indep endent, as k t can v ary even when k remains constant and vice versa; a change in one do es not necessarily lead to a c hange in the other. T o ensure equation ( 3 ) holds, a k,k t and r k,k t are defined as a k,k t = γ min 1 , P ( k + 2) P t ( k t + 2) P ( k ) P t ( k t ) and, r k +2 ,k t +2 = γ min 1 , P ( k ) P t ( k t ) P ( k + 2) P t ( k t + 2) , where γ is the largest constan t such that a k,k t + r k,k t ≤ 0 . 1 for all k and all k t . This definition ensures that equation ( 3 ) holds and so detailed balance is maintained. A full deriv ation of these definitions and this condition can b e found in the Supplementary Information (S2). T o accommodate the tw o new prop osal probabilities, the default maximum sum of b k + d k is reduced from the v alue of 0 . 9, defined in Green (1995) [ 41 ], to 0 . 5, and an additional constrain t that a k,k t + r k,k t ≤ 0 . 1 is in tro duced. Both of these thresholds are adjustable, dep ending on user requirements and the expected frequency of short-lived states, and in this case, were selected following sensitivity analysis detailed in the Supplementary Information (S9). Finally , the probability of prop osing a shift c hange p oin t mov e, denoted π k,k t , no w dep ends on b oth k and k t , and is defined so that b k + d k + a k,k t + r k,k t + π k,k t = 1 , for all k and k t . Adding tw o change p oin ts sim ultaneously is a tw o step pro cess: drawing the lo cation of the short-lived state, and dra wing the distance betw een c hange points (i.e. the duration of the short-lived state). The lo cations of the change p oin ts are chosen by first drawing the centre of the short-liv ed state, denoted ξ , from the custom prop osal distribution q (0 , L ). The duration, d , b et ween the tw o change p oin ts is then drawn from exp( λ D ). The lo cations of the new change p oin ts, denoted s ∗ t 1 and s ∗ t 2 , are then defined as s ∗ t 1 = ξ − d 2 , and s ∗ t 2 = ξ + d 2 . (4) Giv en the definition of a short-lived state, it is p ossible for multiple new short-lived states to emerge with non-zero probabilit y . This outcome may occur when the newly introduced change points are located sufficiently close to existing c hange p oin ts and generate the appropriate pattern. Therefore, a chec k is p erformed at each stage to determine if any additional short-lived states ha ve b een created and determine the prop osed v alue of k ∗ t accordingly . T o remo ve a short-liv ed state, tw o change p oin ts must b e remov ed simultaneously , selected randomly to preserve dimension matc hing. The first change p oint, s t 1 , is dra wn from the k t existing short-liv ed state change points. The n umber of v alid second change p oin ts among the remaining ( k t − 1); those that form a short-liv ed state with s t 1 , is denoted P remov e and is computed using X remov e = k t − 1 X i =1 1 ( s t 1 and s t i form a short-lived state ) , (5) b y c hecking all possibilities against the criteria for a short-liv ed state. The second c hange point is then c hosen uniformly from these p ossibilities. In the add short-lived state mov e, the dimensionalit y increases from k + 6 to k + 8 with the addition of s ∗ t 1 and s ∗ t 2 and dimension matching is achiev ed b y the inclusion of the tw o contin uous random num b ers, ξ and d , and in the reverse direction, by dra wing the lo cations of the tw o change p oin ts to b e remov ed. 11 Supp ose now without loss of generality , th at s t 1 and s t 2 lie within the in terv al ( s j , s j +1 ). The acceptance probabilit y , α t , is therefore defined by α t = min ( 1 , prior ratio × lik eliho o d ratio × prop osal ratio ) , where the prior ratio is given b y prior ratio = P ( k + 2) P ( k ) × P t ( k ∗ t ) P t ( k t ) × (2 k + 2)(2 k + 3)(2 k + 4)(2 k + 5) L 4 × ( s ∗ t 1 − s j )( s ∗ t 2 − s ∗ t 1 )( s j − s ∗ t 2 ) ( s j +1 − s j ) , and the prop osal ratio is defined by prop osal ratio = r k +2 ,k ∗ t a k,k t ( λ D e − λ D d ) q ( ξ ) k ∗ t P remov e , where λ D e − λ D d is the probability of dra wing the duration d , 1 /k ∗ t is the probability of c hoosing the first of the k ∗ t short-liv ed state c hange p oin t to remo ve, and 1 / P remov e is the probabilit y of c ho osing the second to b e remo v ed. As in the single change point death mo ve in Sec. 4.2 , defining the remov e short-liv ed state acceptance ratio is straigh tforw ard b y simply taking the recipro cal of α t with appropriate relab elling (10) . Finally , short-liv ed state c hange points remain part of the full set of c hange points and can therefore b e selected for remo v al in death mov es, or relo cation in shift mov es, or created in a birth mov e. These mo ves may thus alter the n umber of short-lived states, and the acceptance probabilities must b e adjusted accordingly . F or example, a shift mov e ma y create or destroy a short-liv ed state depending on whether the new location of a c hange p oin t satisfies the required pro ximity and pattern conditions. In suc h cases, the v alue of k t increases or decreases by one, without changing the o verall dimensionality; only the lab elling of change p oin ts as short-lived states is altered. The acceptance probabilities for birth, death, and shift mov es are thus updated to include the ratio P ( k t ) /P ( k ∗ t ) to account for these effects. Hyp erparameters λ , λ t , and τ are dep enden t on the underlying system dynamics and were defined following sensitivit y analysis within ranges reflective of the established b eha viour from Alexa Fluor 488 fluorophores, with a maxim um v alue of k max = 50. These hyperparameters can all b e adjusted accordingly to suit application, and the remaining tunable h yp erparameters w ere selected based on the same structured sensitivity analysis, in which root mean square error on estimated intensit y , accuracy , and precision w ere used as p erformance metrics. F ull parameter ranges, acceptable subsets, and final chosen v alues are pro vided in the Supplementary Information (S9). 4.4 Gibbs sampling for fluorophore and bac kground intensit y parameters A t eac h iteration, following the chosen c hange point mov e, all in tensit y parameters, µ f , µ b , σ 2 f , and σ 2 b , are up dated in a Gibbs sampling approac h; up dating the v alue of eac h parameter one by one while holding the others fixed, as is the case in [ 23 ]. The v alues of the hyperparameters η f , ν 2 f , η b , ν 2 b , α f , β f and α b , β b are linked to both the prop erties of the fluo- rophores and the exp erimen tal conditions of the imaging pro cess. These can differ widely b et w een exp eriments and are often difficult for non-technical users to determine or predict in order to set manually . It is therefore essential to pro- duce reliable v alues for these intensit y hyperparameters with minimal user input. This is addressed here by calculating these hyperparameters during a pre-pro cessing step prior to analysis, detailed in the Supplementary Information (S5). In tensity traces that exhibit high noise levels, frequent state transitions, or a large num b er of fluorophores are more lik ely to pro duce less reliable estimates for these hyperparameters. T o address this issue, it is assumed, where appropriate, that experimental conditions remain constan t either across an en tire experimental setup or video, or within subsets of traces that share similar prop erties. Where sufficien t data are av ailable, the calculated v alues of the h yp erparameters are p ooled and a weigh ted a verage is then computed, where eac h trace is weigh ted in prop ortion with its noise level, so that traces with lo wer noise contribute more heavily to the estimate [ 46 ]. Whether the noise b e due to high background, high fluorophore coun t, or increased frequency of short-lived states, this p o oling allows weak er or noisier intensit y traces to b e supp orted by information from more reliable traces. The en tire sampling pro cess, from estimating hyperparameters to carrying out the Gibbs sampling, is outlined in the diagram in Fig. 4 . (10) The Jacobian in this case simplifie s to one and therefore do es not appear in the acceptance probability . T o see this, consider only the parameters affected by the move and use the definitions of s ∗ t 1 and s ∗ t 2 from equation( 4 ). The Jacobian is given by ∂ ( s ∗ t 1 , s ∗ t 2 ) ∂ ( ξ, d ) = ∂ s ∗ t 1 ∂ ξ ∂ s ∗ t 1 ∂ d ∂ s ∗ t 2 ∂ ξ ∂ s ∗ t 2 ∂ d = 1 − 0 . 5 1 0 . 5 = 1 . 12 Rep e a t S t e p s 1 - 2 fo r a ll d a ta se ts in e xp e r im e n t In p u t : I n te n sity d a ta fo r a ll t r a c ks in a si ng l e F LI m P ex pe r im en t . 1) Con st r u c t cu sto m p r o p o s a l d istr i b u ti o n 2) E stim a t e p e r - d a ta se t h y p e r p a r a m e t e r s u sing p e a ks o f cu st o m d ist r ib u tio n 3) P o o l h y pe rp ar am ete rs acr oss dat ase ts u sing we i g h t e d m e a n s Ou t p u t : P o o l e d i n te n sity h y p e r p a r a m e t e r s : , , , , 4) Car r y o u t CR JM C M C it e r a tio n s p e r d a t a se t u sin g p o o l e d h yp e r p a r a m e t e r s 5) Upd a te c h a n g e p o int n u m b e r a n d /o r loca ti o n 6) Upd a te i n te n sity p a r a m e te r s , , , Ou t p u t : A c tive flu o r o p h o r e s in e a ch f r a m e , Rep e a t S t e p s 5 - 6 u n til c o n v e r g e n ce Fig. 4 : Sc hematic of the pipeline used to estimate p opulation-lev el h yp erparameters and how it feeds in to CRJMCMC iterations. Hyp erparameters gov erning the prior distributions are estimated during a pre- pro cessing step and po oled across traces within each exp erimen t to accoun t for shared exp erimental conditions and mitigate the influence of noisy data. In CRJMCMC, at eac h iteration, a change p oin t mo v e is carried out, follo wing b y an up date of the contin uous parameters for fluorophore and bac kground mean and v ariance ( µ f , µ b , σ 2 f , σ 2 b ) using Gibbs-sampling. White : Population-lev el, Grey : Dataset-level. 4.5 Sim ulation Eac h fluorophore w as mo delled as a discrete time Mark ov pro cess with fluorescen t, dark, blink, and photobleached states. Default transition probabilities w ere defined using prior knowledge of the expected time spent in each state, and the full transition matrix for this is pro vided in the Supplemen tary Information (S7). In tensities were sampled from a P oisson distribution, and background noise w as mo delled as the sum of Poisson and Gaussian comp onents with equal mean and v ariance. F ollowing simulation, the mean background w as subtracted to replicate the baseline correction applied during FLImP processing. T races w ere truncated at a random time after all fluorophores photobleached to mirror the acquisition pro cess used in FLImP experiments and frames were binned at a 20 µ s resolution. A wide range of parameters were simulated to ev aluate p erformance under different conditions. Within eac h parameter set, the follo wing defaults were applied, reflecting t ypical ranges in FLImP: single fluorophore intensit y levels of 500, 1,000, or 2,000 photons, fluorophore counts ranging from one to four, and bac kground levels adjusted to achiev e 0.01, 0.1, or 1.0 SNR. T en replicates were generated for each parameter set, pro ducing 18,600 traces in total. The full set of v aried parameters, including blink and dark state properties can b e found in the Supplementary Information (S7). 13 4.6 Acquisition of DNA origami rulers Samples were imaged using an ONI Nanoimager S microscop e equipp ed with a 1.49 NA oil immersion ob jective and op erated using Nanoimager soft ware using the previously describ ed FLImP acquisition metho dology [ 21 ]. Briefly , the microscop e was automatically focused and at each ( x, y ) position in a 4mm square with 0.1mm step, a tile-scan a video acquisition w as recorded with 20 ms exp osure and T otal Internal Reflection Fluorescence (TIRF) illumination. Additional details on sample lab elling and tracking pro cedures are provided in Iyer et al. (2024) [ 21 ]. References [1] Aminikhanghahi, S., Co ok, D.J.: A surv ey of metho ds for time series change p oint detection. Knowledge and Information Systems 51 (2), 339–367 (2017) https://doi.org/10.1007/s10115- 016- 0987- z [2] Wyse, J., F riel, N., Rue, H.: Approximate sim ulation-free Bay esian inference for m ultiple changepoint models with dep endence within segments. Bay esian Analysis 6 (4), 501–528 (2011) h ttps://doi.org/10.1214/11- BA620 [3] Gy armati-Szab´ o, J., Bogachev, L.V., Chen, H.: Modelling threshold exceedances of air p ollution concentrations via non-homogeneous Poisson pro cess with multiple change-points. Atmospheric Environmen t 45 (31), 5493–5503 (2011) https://doi.org/10.1016/j.atmosen v.2011.06.049 [4] Lu, Z., Banerjee, M., Mic hailidis, G.: Intelligen t sampling for multiple change-points in exceedingly long time series with rate guaran tees (2020). [5] Casini, A., P erron, P .: Contin uous record asymptotics for change-point mo dels. Journal of Time Series Analysis (2025) https://doi.org/10.1111/jtsa.12821 [6] Girgaonk ar, R.: Mitigation methods for instrumen tal artifacts in gravitational w av e data. Master’s thesis, The Univ ersity of T exas Rio Grande V alley (2024). Av ailable from Sc holarW orks @ UTRGV. https://sc holarworks. utrgv.edu/etd/1514 [7] Rotondi, R.: On the influence of the proposal distributions on a reversible jump mcmc algorithm applied to the detection of multiple change-points. Computational Statistics & Data Analysis 40 (3), 633–653 (2002) https: //doi.org/10.1016/S0167- 9473(02)00055- 5 [8] Hummert, J., Yserentan t, K., Fink, T., Euchner, J., Ho, Y.X., T ashev, S.A., Herten, D.-P .: Photobleaching step analysis for robust determination of protein complex stoic hiometries. Molecular Biology of the Cell 32 (21), 35 (2021) https://doi.org/10.1091/m b c.E20- 09- 0568 [9] Chen, Y., Deffenbaugh, N.C., Anderson, C.T., Hanco c k, W.O.: Molecular coun ting b y photobleac hing in protein complexes with man y subunits: b est practices and application to the cellulose synthesis com- plex. Molecular Biology of the Cell 25 (22), 3630–3642 (2014) https://doi.org/10.1091/m b c.e14- 06- 1146 h ttps://doi.org/10.1091/mbc.e14-06-1146 . PMID: 25232006 [10] Aran t, R.J., Ulbrich, M.H.: Deciphering the subunit comp osition of multimeric proteins b y counting photobleac h- ing steps. ChemPhysChem 15 (4), 600–605 (2014) h ttps://doi.org/10.1002/cphc.201301092 [11] Blunc k, R.: Determining stoic hiometry of ion c hannel complexes using single subunit counting. In: Minor, D.L., Colecraft, H.M. (eds.) Ion Channels: Channel Production and Optical Metho ds. Methods in Enzymology , vol. 653, pp. 377–404. Academic Press, Amsterdam (2021). https://doi.org/10.1016/bs.mie.2021.02.017 [12] Chen, Y., M ¨ uller, J.D.: Determining the stoichiometry of protein hetero complexes in living cells with fluorescence fluctuation sp ectroscop y . Pro ceedings of the National Academy of Sciences 104 (9), 3147–3152 (2007) h ttps://doi. org/10.1073/pnas.0606557104 [13] Leak e, M.C., Chandler, J.H., W adhams, G.H., Bai, F., Berry , R.M., Armitage, J.P .: Stoic hiometry and turnov er in single, functioning mem brane protein complexes. Nature 443 (7109), 355–358 (2006) https://doi.org/10.1038/ nature05135 [14] Singh, A., V an Slyke, A.L., Sirenko, M., Song, A., Kammermeier, P .J., Zipfel, W.R.: Stoic hiometric analysis of protein complexes b y cell fusion and single molecule imaging. Scientific Rep orts 10 (1), 14866 (2020) https: //doi.org/10.1038/s41598- 020- 71630- 6 14 [15] V erdaasdonk, J.S., La wrimore, J., Blo om, K.: Determining absolute protein num b ers by quan titative fluorescence microscop y . In: W aters, J.C., Wittman, T. (eds.) Quantitativ e Imaging in Cell Biology . Metho ds in Cell Biology , v ol. 123, pp. 347–365. Academic Press, Amsterdam (2014). h ttps://doi.org/10.1016/B978- 0- 12- 420138- 5.00019- 7 [16] Zhang, H., Guo, P .: Single molecule photobleac hing (smpb) technology for counting of rna, dna, protein and other molecules in nanoparticles and biological complexes b y tirf instrumen tation. Methods 67 (2), 169–176 (2014) h ttps://doi.org/10.1016/j.ymeth.2014.01.010 . Nucleic Acids Nanotechnology [17] Ulbric h, M.H.: Counting molecules: T ow ard quan titative imaging. In: Tinnefeld, P ., Eggeling, C., Hell, S.W. (eds.) F ar-Field Optical Nanoscopy , pp. 263–291. Springer, Berlin, Heidelb erg (2015). https://doi.org/10.1007/ 4243 2011 36 [18] Aspelmeier, T., Egner, A., Munk, A.: Mo dern statistical challenges in high-resolution fluorescence microscopy . Ann ual Review of Statistics and Its Application 2 (V olume 2, 2015), 163–202 (2015) https://doi.org/10.1146/ ann urev- statistics- 010814- 020343 [19] Lee, A., Tsekouras, K., Calderon, C., Bustamante, C., Press´ e, S.: Unrav eling the thousand word picture: An in tro duction to sup er-resolution data analysis. Chemical Reviews 117 (11), 7276–7330 (2017) https://doi.org/10. 1021/acs.c hemrev.6b00729 [20] Rollins, G.C., Shin, J.Y., Bustamante, C., Press ´ e, S.: Sto c hastic approac h to the molecular counting problem in superresolution microscopy . Proceedings of the National Academ y of Sciences 112 (2), 110–118 (2015) h ttps: //doi.org/10.1073/pnas.1408071112 https://www.pnas.org/doi/pdf/10.1073/pnas.1408071112 [21] Iy er, R.S., Needham, S.R., Galdadas, I., Davis, B.M., Rob erts, S.K., Man, R.C.H., Zanetti-Domingues, L.C., Clark e, D.T., F ruh wirth, G.O., P arker, P .J., Rolfe, D.J., Gerv asio, F.L., Martin-F ernandez, M.L.: Drug-resistant egfr mutations promote lung cancer b y stabilizing interfaces in ligand-free kinase-active egfr oligomers. Nature Comm unications 15 (1), 2130 (2024) https://doi.org/10.1038/s41467- 024- 46284- x [22] Garry , J., Li, Y., Shew, B., Gradinaru, C.C., Rutenberg, A.D.: Bay esian coun ting of photobleaching steps with ph ysical priors. The Journal of Chemical Physics 152 (2), 024110 (2020) https://doi.org/10.1063/1.5132957 [23] Bry an IV, J.S., Sgouralis, I., Press´ e, S.: Diffraction-limited molecular cluster quan tification with bay esian non- parametrics. Nature Computational Science 2 (2), 102–111 (2022) https://doi.org/10.1038/s43588- 022- 00197- 1 [24] Tsek ouras, K., Custer, T.C., Jashnsaz, H., W alter, N.G., Press ´ e, S.: A no vel metho d to accurately lo cate and coun t large num b ers of steps b y photobleac hing. Molecular Biology of the Cell 27 (22), 3601–3615 (2016) https: //doi.org/10.1091/m b c.E16- 06- 0404 . PMID: 27654946 [25] W allgren, R.: Ba y esian inference frameworks for fluorescence microscop y data analysis. Master’s thesis, Arizona State Universit y (2019) [26] Mattamira, C., W ard, A., Krishnan, S.T., Lamic hhane, R., Barrera, F.N., Sgouralis, I.: Ba yesian analysis and efficien t algorithms for single-molecule fluorescence data and step counting. Biophysical Journal 124 (19), 3161– 3173 (2025) https://doi.org/10.1016/j.bp j.2025.08.014 [27] Soubies, E., Blanc-F´ eraud, L., Sc haub, S., Aubert, G.: A 3D model with shape prior information for biological structures reconstruction using m ultiple-angle total in ternal reflection fluorescence microscopy . In: 2014 IEEE 11th International Symp osium on Biomedical Imaging (ISBI), pp. 608–611 (2014). h ttps://doi.org/10.1109/ISBI. 2014.6867944 [28] F azel, M.: Bay esian analysis of single molecule fluorescence microscop y data. Do ctoral dissertation, Universit y of New Mexico, Albuquerque, NM (July 2020). Chair: Keith Lidke; Committee members: Diane Lidke, Victor Acosta, James Thomas. h ttps://digitalrep ository .unm.edu/phyc etds/232 [29] Needham, S.R., Hirsc h, M., Rolfe, D.J., Clarke, D.T., Zanetti-Domingues, L.C., W areham, R., al.: Measuring EGFR separations on cells with ∼ 10 nm resolution via Fluorophore Localization Imaging with Photobleaching. PLoS ONE 8 (5), 62331 (2013) https://doi.org/10.1371/journal.pone.0062331 [30] Needham, S.R., Roberts, S.K., Arkhip o v, A., Mysore, V.P ., Tynan, C.J., Zanetti-Domingues, L.C., Kim, E.T., Losasso, V., Korov esis, D., Hirsch, M., et al. : Egfr oligomerization organizes kinase-active dimers into comp eten t 15 signalling platforms. Nature comm unications 7 (1), 13307 (2016) [31] GA TT Aquant DNA Nanotechnologies: GA TT A-STORM Nanoruler. https://www.gattaquan t.com/pro ducts/ lo calization- based/gatta- storm- nanoruler.h tml . Accessed: 2024-05-02 (2024) [32] Reinhardt, S.C.M., Masullo, L.A., Baudrexel, I., Steen, P .R., Ko w alewski, R., Eklund, A.S., Strauss, S., Unterauer, E.M., Schlic hthaerle, T., Strauss, M.T., Klein, C., Jungmann, R.: ˚ Angstr¨ om-resolution fluorescence microscop y . Nature 617 (7962), 711–716 (2023) https://doi.org/10.1038/s41586- 023- 05925- 9 [33] Kulenk ampff, K., W olf P erez, A.-M., Sormanni, P ., Habchi, J., V endruscolo, M.: Quan tifying misfolded protein oligomers as drug targets and biomarkers in alzheimer and parkinson diseases. Nature Reviews Chemistry 5 (4), 277–294 (2021) https://doi.org/10.1038/s41570- 021- 00254- 9 [34] Danielli, L., Li, X., T uller, T., Daniel, R.: Quantifying the distribution of protein oligomerization degree reflects cellular information capacit y . Scientific Rep orts 10 (1), 17689 (2020) h ttps://doi.org/10.1038/s41598- 020- 74811- 5 [35] Ha yter, E.A., W ehrens, S.M.T., V an Dongen, H.P .A., Stangherlin, A., Gaddameedhi, S., Cro oks, E., Barron, N.J., V enetucci, L.A., O’Neill, J.S., Brown, T.M., Skene, D.J., T rafford, A.W., Bec htold, D.A.: Distinct circadian mec hanisms go vern cardiac rh ythms and susceptibilit y to arrhythmia. Nature Comm unications 12 (1), 2472 (2021) h ttps://doi.org/10.1038/s41467- 021- 22788- 8 [36] Mortensen, M., Smart, T.G.: Single-c hannel recording of ligand-gated ion channels. Nature Protocols 2 (11), 2826–2841 (2007) https://doi.org/10.1038/nprot.2007.403 [37] Ethabet, H., Dadi, L., Aoun, M., Ra ¨ ıssi, T.: Sensor fault detection based on l ∞ in terv al observ er for uncertain con tinuous-time switc hed linear systems. Pro ceedings of the Institution of Mechanical Engineers, Part I: Journal of Systems and Con trol Engineering 239 (8), 1452–1465 (2025) https://doi.org/10.1177/09596518251334865 [38] V oroneck a ja, I.: Automatic arc hitecture selection for hierarchical mixture of exp erts mo dels. Phd thesis, Univ ersit y of Glasgow, Glasgo w, UK (2023). https://doi.org/10.5525/gla.thesis.83492 . Sup ervisors: Dr. Nema Dean and Dr. Ludger Evers. [39] T rnkoczy , A.: Understanding and parameter setting of ST A/L T A trigger algorithm. In: Bormann, P . (ed.) New Man ual of Seismological Observ atory Practice (NMSOP), pp. 1–20. Deutsches GeoF orsch ungsZen trum GFZ, P otsdam (2009). h ttps://doi.org/10.2312/GFZ.NMSOP r1 IS 8.1 . Online edition [40] Protsero v, S.D., Shishkin, A.G.: Segmentation of noisy sp eec h signals. Scientific and T ec hnical Information Pro cessing 49 (5), 356–363 (2022) https://doi.org/10.3103/S0147688222050100 [41] Green, P .J.: Reversible jump marko v chain monte carlo computation and bay esian mo del determination. Biometrik a 82 (4), 711–732 (1995) https://doi.org/10.2307/2337340 [42] Benson, A., F riel, N.: Adaptive mcmc for m ultiple c hangep oin t analysis with applications to large datasets. Electronic Journal of Statistics 12 (2), 3365–3396 (2018) https://doi.org/10.1214/18- EJS1418 [43] Lak o wicz, J.R.: Principles of Fluorescence Sp ectroscop y , 3rd edn., p. 954. Springer, New Y ork, NY (2006). https: //doi.org/10.1007/978- 0- 387- 46312- 4 . Springer-V erlag US, eBo ok ISBN: 978-0-387-46312-4 [44] Gelman, A.: Prior distributions for v ariance parameters in hierarchical mo dels (commen t on article b y Bro wne and Drap er). Bay esian Analysis 1 (3), 515–534 (2006) https://doi.org/10.1214/06- BA117A [45] Raftery , A.E., Akman, V.E.: Ba yesian analysis of a p oisson pro cess with a change-point. Biometrik a 73 (1), 85–89 (1986) h ttps://doi.org/10.1093/biomet/73.1.85 https://academic.oup.com/biomet/article- p df/73/1/85/682374/73-1-85.pdf [46] P ersson, F., Lind ´ en, M., Unoson, C., Elf, J.: Extracting intracellular diffusiv e states and transition rates from single-molecule tracking data. Nature Metho ds 10 (3), 265–269 (2013) https://doi.org/10.1038/nmeth.2367 [47] Balakrishnan, N., Cohen, A.C. (eds.): Order Statistics and Inference: Estimation Metho ds. Academic Press, San Diego, CA (1990). h ttps://doi.org/10.1016/C2009- 0- 22411- 1 . https://doi.org/10.1016/C2009-0-22411-1 [48] Kalafut, B., Visscher, K.: An ob jective, mo del-indep enden t method for detection of non-uniform steps in noisy 16 signals. Computer Physics Comm unications 179 (10), 716–723 (2008) https://doi.org/10.1016/j.cpc.2008.06.008 S Supplemen tary Information S1 Ev en-n umbered order statistics It can b e sho wn that, for a sample X 1 , X 2 , . . . , X n of indep enden t and identically distributed random v ariables from a general contin uous distribution, the join t probabilit y density function of the order statistics is giv en b y f X (1) ,...,X ( n ) ( x 1 , . . . , x n ) = n ! n Y i =1 f X i ( x i ) , (A1) pro vided x 1 < x 2 < · · · < x n , and that each x i lies within the constraints of the original distribution from which the sample is drawn [ 47 ]. The change p oin t lo cations, s 1 , . . . , s k , in b oth [ 41 ] and this comp ound change p oin t adaptation, are c hosen to be distributed as the even-n um b ered order statistics from a sample of 2 k + 1 p oin ts, denoted { x i } 2 k +1 i =1 , from the uniform distribution on ( s 0 , s k +1 ), such that s 1 = x 2 , s 2 = x 4 , . . . , s k = x 2 k . T o deriv e the joint probability distribution f X (2) ,...,X (2 k ) ( x 2 , . . . , x 2 k ), denoted as f ( s 1 , . . . , s k ), all the o dd-num bered order statistics, X (1) , X (3) , . . . , X (2 k +1) , must b e integrated out to obtain f ( s 1 , . . . , s k ) = Z ∞ −∞ · · · Z ∞ −∞ Z ∞ −∞ f X (1) ,X (3) ...,X (2 k +1) ( x 1 , . . . , x n ) dx 1 dx 3 . . . dx 2 k +1 . The original joint probabilit y distribution function is constrained by x 1 < x 2 < · · · < x 2 k +1 and the x i are drawn from a uniform distribution on ( s 0 , s k +1 ), meaning s 0 < x 1 < x 2 < · · · < x 2 k +1 < s k +1 . It follows that s 0 < x 1 < x 2 , x 2 < x 3 < x 4 , . . . x 2 k < x 2 k +1 < s k +1 . The limits of in tegration therefore b ecome f ( s 1 , . . . , s k ) = Z s k +1 x 2 k · · · Z x 4 x 2 Z x 2 s 0 f X (1) ,X (3) ...,X (2 k +1) ( x 1 , . . . , x 2 k +1 ) dx 1 dx 3 . . . dx 2 k +1 . Recall that s 1 = x 2 , s 2 = x 4 , . . . , s k = x 2 k , and so f ( s 1 , . . . , s k ) = Z s k +1 s k · · · Z s 2 s 1 Z s 1 s 0 f X (1) ,X (3) ...,X (2 k +1) ( x 1 , . . . , x 2 k +1 ) dx 1 dx 3 . . . dx 2 k +1 . Substituting the expression for f X (1) ,...,X (2 k +1) ( x 1 , . . . , x 2 k +1 ) from equation ( A1 ), f ( s 1 , . . . , s k ) = Z s k +1 s k · · · Z s 2 s 1 Z s 1 s 0 (2 k + 1)! f X (1) , f X (3) . . . , f X (2 k +1) ( x 2 k +1 ) dx 1 dx 3 . . . dx 2 k +1 . As each X i is drawn from a uniform distribution on ( s 0 , s k +1 ), f X i ( x i ) = 1 s k +1 − s 0 for all i = 1 , . . . , (2 k + 1) . It follows that f ( s 1 , . . . , s k ) = (2 k + 1)! 1 ( s k +1 − s 0 ) 2 k +1 Z s k +1 s k · · · Z s 2 s 1 Z s 1 s 0 dx 1 dx 3 . . . dx 2 k +1 . 17 Ev aluating the in tegrals provides f ( s 1 , . . . , s k ) = (2 k + 1)! 1 ( s k +1 − s 0 ) 2 k +1 ( s k +1 − s k ) . . . ( s 2 − s 1 ) ( s 1 − s 0 ) , Or more concisely , f ( s 1 , . . . , s k ) = (2 k + 1)! ( s k +1 − s 0 ) 2 k +1 k Y i =0 ( s i +1 − s i ) , as seen in Eq. (1) in Sec. 5.1. In the case of a shift mov e in comp ound RJMCMC (CRJMCMC), where the lo cation s j is prop osed to shift to s ∗ j , the prior ratio is constructed as f ( s 1 , . . . s j − 1 , s ∗ j , s j +1 , . . . , s k ) f ( s 1 , . . . s j − 1 , s j , s j +1 , . . . , s k ) . Substituting in the expression for the join t distribution in each case gives, (2 k + 1)! ( s k +1 − s 0 ) 2 k +1 ( s 1 − s 0 ) . . . s ∗ j − s j − 1 s j +1 − s ∗ j . . . ( s k +1 − s k ) (2 k + 1)! ( s k +1 − s 0 ) 2 k +1 ( s 1 − s 0 ) . . . ( s j − s j − 1 ) ( s j +1 − s j ) . . . ( s k +1 − s k ) . Therefore, f ( s 1 , . . . s j − 1 , s ∗ j , s j +1 , . . . , s k ) f ( s 1 , . . . s j − 1 , s j , s j +1 , . . . , s k ) = s ∗ j − s j − 1 s j +1 − s ∗ j ( s j − s j − 1 ) ( s j +1 − s j ) . Consider now the case of a birth mov e, where a new c hange p oint, s ∗ , has b een added the n umber of change points has increased to k + 1. Supp ose, without loss of generalit y , that the new c hange p oin t lies in the interv al b et ween s j and s j +1 . The joint distribution of the k + 1 c hange p oin ts then b ecomes f ( s 1 , . . . , s j , s ∗ , s j +1 , . . . , s k ) = (2 k + 3)! ( s k +1 − s 0 ) 2 k +3 ( s 1 − s 0 ) . . . ( s ∗ − s j ) ( s j +1 − s ∗ ) . . . ( s k +1 − s k ) . The prior ratio on change p oin t lo cations for the birth mo ve is therefore f ( s 1 , . . . , s j , s ∗ , s j +1 , . . . , s k ) f ( s 1 , . . . , s j , s j +1 , . . . , s k ) = (2 k + 3)! ( s k +1 − s 0 ) 2 k +3 ( s 1 − s 0 ) . . . ( s ∗ − s j ) ( s j +1 − s ∗ ) . . . ( s k +1 − s k ) (2 k + 1)! ( s k +1 − s 0 ) 2 k +1 ( s 1 − s 0 ) . . . ( s j +1 − s j ) . . . ( s k +1 − s k ) . Simplifying this, f ( s 1 , . . . , s j , s ∗ , s j +1 , . . . , s k ) f ( s 1 , . . . , s j , s j +1 , . . . , s k ) = (2 k + 3)(2 k + 2) ( s ∗ − s j ) ( s j +1 − s ∗ ) ( s k +1 − s 0 ) 2 ( s j +1 − s j ) . Recall that s k +1 = L and s 0 = 0, and so f ( s 1 , . . . , s j , s ∗ , s j +1 , . . . , s k ) f ( s 1 , . . . , s j , s j +1 , . . . , s k ) = (2 k + 3)(2 k + 2) L 2 ( s ∗ − s j ) ( s j +1 − s ∗ ) ( s j +1 − s j ) . Finally , consider the case of an add short-lived state mov e, where t w o consecutive change points, s ∗ 1 and s ∗ 2 , are added where s ∗ 1 < s ∗ 2 , and so the n um b er of c hange p oin ts has increased from k to k + 2. Without loss of generalit y , supp ose again these lie in the interv al b etw een s j and s j +1 . The joint distribution of the prop osed k + 2 change p oin ts then b ecomes f ( s 1 , . . . , s j , s ∗ t 1 , s ∗ t 2 , s j +1 , . . . , s k ) = (2 k + 5)! ( s k +1 − s 0 ) 2 k +5 ( s 1 − s 0 ) . . . s ∗ t 1 − s j s ∗ t 2 − s ∗ t 1 s j +1 − s ∗ t 2 . . . ( s k +1 − s k ) . 18 The prior ratio for the add short-liv ed state mov e is therefore f ( s 1 , . . . , s j , s ∗ t 1 , s ∗ t 2 , s j +1 , . . . , s k ) f ( s 1 , . . . , s j , s j +1 , . . . , s k ) = (2 k + 5)! ( s k +1 − s 0 ) 2 k +5 ( s 1 − s 0 ) . . . s ∗ t 1 − s j s ∗ t 2 − s ∗ t 1 s j +1 − s ∗ t 2 . . . ( s k +1 − s k ) (2 k + 1)! ( s k +1 − s 0 ) 2 k +1 ( s 1 − s 0 ) . . . ( s j +1 − s j ) . . . ( s k +1 − s k ) . Simplifying, f ( s 1 , . . . , s j , s ∗ t 1 , s ∗ t 2 , s j +1 , . . . , s k ) f ( s 1 , . . . , s j , s j +1 , . . . , s k ) = (2 k + 5)(2 k + 4)(2 k + 3)(2 k + 2) ( s k +1 − s 0 ) 4 × s ∗ t 1 − s j s ∗ t 2 − s ∗ t 1 s j +1 − s ∗ t 2 ( s j +1 − s j ) . Using again the fact that s k +1 = L and s 0 = 0, f ( s 1 , . . . , s j , s ∗ t 1 , s ∗ t 2 , s j +1 , . . . , s k ) f ( s 1 , . . . , s j , s j +1 , . . . , s k ) = (2 k + 5)(2 k + 4)(2 k + 3)(2 k + 2) L 4 × s ∗ t 1 − s j s ∗ t 2 − s ∗ t 1 s j +1 − s ∗ t 2 ( s j +1 − s j ) . S2 Pro of of detailed balance for short-lived states In order for detailed balance to hold in the case of short-liv ed state mo ves, the probabilities of prop osing the add and remo ve short-lived states mo ves when there are k c hange p oints and k t short-liv ed state c hange p oin ts, denoted a k,k t and r k,k t resp ectiv ely , must satisfy an analogous condition to P ( k ) b k = P ( k + 1) d k +1 , where b k = c min 1 , P ( k + 1) P ( k ) and d k +1 = c min 1 , P ( k ) P ( k + 1) , for tw o c hange p oin t mov es, giv en b elo w as P ( k ) P t ( k t ) a k,k t = P ( k + 2) P t ( k t + 2) r k +2 ,k t +2 (A2) where P t ( k t ) is the P oisson probability of k t short-liv ed state change points with mean λ t . T o ensure equation this holds, define the probabilities a k,k t and r k,k t as follows a k,k t = γ min 1 , P ( k + 2) P t ( k t + 2) P ( k ) P t ( k t ) and r k +2 ,k t +2 = γ min 1 , P ( k ) P t ( k t ) P ( k + 2) P t ( k t + 2) , where γ is the largest constant suc h that a k,k t + r k,k t ≤ 0 . 1 for all k and all k t . This definition ensures that equation ( A2 ) holds and so detailed balance is maintained. T o see this, consider, for example, first the case where P ( k + 2) P t ( k t + 2) > P ( k ) P t ( k t ). The probabilities a k,k t and r k +2 ,k t +2 then b ecome a k,k t = γ × 1 , and r k +2 ,k t +2 = γ × P ( k ) P t ( k t ) P ( k + 2) P t ( k t + 2) . Similarly , in the case where P ( k + 2) P t ( k t + 2) < P ( k ) P t ( k t ), it follows that a k,k t = γ × P ( k + 2) P t ( k t + 2) P ( k ) P t ( k t ) , and r k +2 ,k t +2 = γ × 1 , b oth of which satisfy equation ( A2 ). 19 S3 Calculating the n um b er of active fluorophores The n umber of activ e fluorophores in eac h frame is determined by calculating the mean intensit y , ¯ y j , from the data within each section, j , betw een change points s j and s j +1 , for j = 0 , . . . , k , and finding the num b er of active fluorophores, n j , which minimises the difference | ¯ y − ( µ f n j + µ b ) | suc h that n j ∈ N . It is assumed that the num b er of active fluorophores remains constant within eac h section, with n j represen ting all frames in section j . As n j represen ts a discrete count of fluorophores, it can only take non-negative in teger v alues [ 13 ]. An issue that may arise is that the same ‘b est fit’ v alue of n j is calculated for consecutiv e sections, indicating no change in the underlying mo del has o ccurred, ev en when a change p oint is presen t. This issue can result in an o verestimation of the n umber of change p oin ts, many of whic h w ould b e redundant. T o address this issue, a forced p erturbation of n j is applied at each c hange p oint. In each section, j , the mean in tensity is calculated, and the corresponding n umber of fluorophores, n j , is determined, where it is noted that this process is carried out from the end of the trace to the beginning to prioritise sections of the data where there are less fluorophores, and so less v ariability , exp ected. If n j = n j − 1 , the num b er of activ e fluorophores in the current section, n j , is either increased or decreased by one, dep ending on which option minimises | ¯ y j − ( µ f n j + µ b ) | : n j = ( n j + 1 , if ¯ y j − µ f ( n j + 1) + µ b < ¯ y j − µ f ( n j − 1) + µ b n j − 1 , otherwise S4 Custom prop osal distribution A custom prop osal distribution is designed to improv e the ov erall conv ergence of c hange p oin t mov es in CRJMCMC and is constructed b y p erforming a preliminary analysis of the data and identifying regions where there is erratic b eha viour in the intensit y . This pro cess b egins by estimating the SNR of the intensit y profile using the mean intensit y of the entire dataset, divided by its standard deviation. The dataset is then divided into windows, and the z -score of the difference in mean in tensity betw een windows is determined, assuming a mean of zero and a v ariance given b y the recipro cal of the signal-to-noise ratio. The use of data windows, rather than individual differences ensures that small, but significan t, c hanges (e.g., photobleaching or dark states) are not smoothed out or merged with nearb y minor fluctuations, as can b e the case with edge-preserving smo othing and linear filters [ 19 ]. The prop osal distribution is then formed by adding Gaussian probabilit y distribution functions to a uniform distribution ov er all times, with Gaussian means centred at the midp oin t of eac h window and v ariances prop ortional to the corresp onding windo w z -scores. The distribution is then normalised. F or computational efficiency , the prop osal distribution is discretised at a user-defined time resolution, defining the p ossible c hange p oin t lo cations. T o improv e the efficiency further, the probabilities for eac h of these p ossible v alues are pre-calculated for lo ok-up purp oses when calculating acceptance probabilities. S5 Determining intensit y mean and v ariance h yp erparameters The hyperparameters η f , ν 2 f , η b , ν 2 b , α f , β f and α b , β b , are calculated in a pre-pro cessing step using the peaks of the c hange p oin t lo cation proposal distribution, q (0 , L ), which identifies candidate lo cations for change p oints. A filter is applied at this stage to remov e candidate c hange p oin ts where the difference in mean in tensity b et w een sections is insufficien t. This filter is guided b y a heuristic low er b ound on fluorophore in tensity , whic h may either b e set b y the user or estimated from prop erties of the data, for example using the mode intensit y scaled b y a multiplier taken here to b e 0.9. In practice, an y sensible metho d for iden tifying a lo wer b ound would b e suitable. With increased data, the influence of the sp ecific c hoice b ecomes negligible. Using these candidate lo cations the mean single fluorophore in tensit y , η f , is calculated as the mean in tensity difference b et ween sections at these estimated change p oin ts. The mean background in tensity h yp erparameter, η b , is calculated as the mean intensit y of the final section, under the assumption that all fluorophores hav e photobleached b y the end of the trace and only background noise remains [ 9 , 20 ]. The shap e and scale hyperparameters for single-fluorophore v ariance, α f , and β f , are calculated using the assump- tion that fluorophore intensit y follows a Poisson distribution, and so v ariance should equal mean intensit y . Therefore, α f is set equal to η f , and to ensure the mo de of the distribution is at α f , β f = η f ( α f + 1). F or background v ariance h yp erparameters, α b and β b , α b is set as the final section v ariance, and β b is fixed so that this final section v ariance is the mo de of this distribution. As discussed in Sec. 5.4, the calculated hyperparameter v alues are po oled across all traces within a single video or exp erimen tal setup. A w eighted a verage is then calculated based on the noise lev els within these traces, so that less noisy traces are w eighted more heavily than noisy traces [ 46 ]. F or relatively homogenous trace p opulations these w eights can b e set as the inv erse of trace v ariance. F or p opulations with a large amount of heterogeneity , the weigh t 20 can be c hosen to b e the inv erse of the a verage window v ariance, maxim um photon intensit y , and length of trace, to manage v ariability due to increased fluorophore num b er, increased dark states, and bac kground noise. The v ariance hyperparameters ν 2 f and ν 2 b and the prop osal distribution standard deviations for µ f and µ b are calculated prop ortionally to the w eighted a verages of η f and η b , resp ectiv ely using a scaling factor to ensure the priors on these v alues are strong. S6 Alternativ e Metho ds S6.1 Tsek ouras et al. (2016) Tsek ouras et al. [ 24 ] mo dels active fluorophore count by considering step coun ts, K , and even t lo cations, s = { s 1 , . . . , s K } , with Gaussian lik eliho o d for intensit y with mean and v ariance µ i and σ 2 i in each frame i given by µ i = n i µ f + µ b , σ 2 i = n i σ 2 f + σ 2 b , where µ f and σ 2 f represen t mean and v ariance of single fluorophore in tensity , and µ b and σ 2 b represen t mean and v ariance of bac kground intensit y , resp ectiv ely , and n i is the num b er of active fluorophores in frame i . This approac h allo ws b oth mean and v ariance to scale with the num ber of active fluorophores, but all intensit y parameters are fixed prior to analysis rather than up dated dynamically . The parameter set is defined as θ = ( s , K, m, ar r , µ f , µ b , σ 2 f , σ 2 b , γ ) , where m is the n umber of even ts and arr is the arrangement count, whic h stores the possible w ays that m ev ents can com bine to produce K observed steps. In this approac h, an even t corresp onds to a single fluorophore transition from activ e to inactive or vice v ersa, while a step corresp onds to any discrete in tensity c hange. Sev eral even ts may therefore o ccur simultaneously and yet app ear as a single step. The inclusion of ar r ensures that ov erlapping or even opp osing even ts are explicitly accounted for and prev ents bias to ward mo dels with large num b ers of sim ultaneous ev ents whic h could otherwise cancel one another out. In theory , this ev ent–step approac h is capable of describing rev ersible dark state transitions as w ell as multiple photobleaching even ts, although the method is demonstrated on monotonic intensit y traces [ 24 ]. A hierarchical prior is applied to preven t ov erfitting, with Poisson and exp onen tial distributions used for K and m . The negative log posterior is calculated for all candidate mo dels, with the minim um c hosen as the optimal solution. The pro cess is deterministic and requires brute force ev aluation of multiple mo dels, which limits computational scalability . T o mitigate computational cost, a three stage approac h is used: (i) estimation of µ f , µ b , σ 2 f , and σ 2 b p er trace using an adaptation of the c hange point method in [ 48 ], (ii) sequen tial exclusion of implausible models by dividing traces in to windo ws and estimating the most lik ely step num b er via Gaussian lik eliho o d maximisation, and (iii) minimisation of the negative log posterior within each windo w to determine the optimal solution. The metho d was applied to syn thetic and exp erimen tal datasets and was shown to recov er fluorophore counts even at lo w signal-to-noise, although it tends to misidentify even ts near window b oundaries. This approac h is in principle capable of describing short-lived blinking and dark states, and o v erlapping even ts, but its reliance on fixed intensit y parameters makes results dependent on the qualit y of the trace and the deterministic optimisation limits scalability across exp erimental conditions. S6.2 Garry et al. (2020) Garry et al. [ 22 ] in tro duces an approach where the v ariable to b e estimated is the n umber of activ e fluorophores in eac h frame n i , with a Gaussian likelihoo d given by µ i = v n i + a, σ 2 i = σ 2 1 n i + σ 2 0 , where v is the single fluorophore mean in tensity , a is the bac kground intensit y , σ 2 1 and σ 2 0 are the corresp onding v ariances. The prior distribution on the num b er of fluorophores takes a binomial form P ( { n i } ) = N − 1 Y i =1 n i − 1 ! n i !( n i − 1 − n i )! q n i (1 − q ) n i − 1 − n i , with surviv al probabilit y q = exp( − ∆ t/τ ), where τ is the single fluorophore lifetime. This prior enforces monotonic deca y in the intensit y mo del b y considering only photobleaching ev ents. Maxim um a p osteriori estimates are obtained via golden section search ov er candidate n 0 v alues. The parameters v , a , q , σ 2 0 , and σ 2 1 are fixed for a dataset, requiring calibration either from extensive simulations or from exp erimen tal 21 traces containing known single fluorophores. This calibration step is essen tial for analysis but ma y not be feasible in all exp erimen tal settings, where the required information is not a v ailable. The method w as tested on syn thetic and exp erimen tal photobleac hing data and sho w ed high computational effi- ciency . Ho wev er, it assumes all fluorophores are brigh t at the b eginning of the trace, requires calibration data, and cannot account for short-liv ed blinking or reversible dark state transitions. S6.3 Bry an et al. (2022) Bry an IV et al. [ 23 ] prop oses a fully Ba yesian approach formulated as a factorial hidden Marko v model (FHMM). Eac h fluorophore is represen ted by a hidden Marko v chain with states active ( σ A ), dark ( σ D ), or photobleached ( σ B ). The state of fluorophore k in region r at time n is denoted s k,r n , with transitions describ ed b y a transition matrix π , and initial states dra wn from π 0 = ( π 0 ,A , π 0 ,D ). This FHMM structure enables simultaneous mo delling of both the n umber of fluorophores present and their individual photophysical tra jectories. The mean intensit y at time n in region r is given by µ r n = µ r B + K r X k =1 µ s k,r n − 1 , where µ r B is bac kground and µ s k,r n − 1 equals µ A for the active state and zero otherwise. T o address the unkno wn fluorophore coun t, a Bay esian nonparametric sc heme is emplo yed by introducing K ≫ K r candidate fluorophores, eac h with load b k,r ∼ Bernoulli γ K + γ + 1 , that indicates whether the fluorophore contributes to the observed intensit y . Fluorophores with b k,r = 0 are kno wn as virtual and do not contribute to the ov erall intensit y , but they m ust still b e track ed during inference. This treatment allo ws the true fluorophore num ber to be estimated but the increased state space of the FHMM, which is the main source of computational inefficiency . The observed brightness is mo delled as w r n | s 1: K,r n , b 1: K,r , µ r A , µ r B ∼ Gamma 1 2 µ r B + K X k =1 b k,r µ s k,r n , 2 G ! , where G accounts for camera noise c haracteristics. P osterior inference is p erformed using Gibbs sampling. Eac h parameter is sampled conditionally on the others, enabling estimation of b oth the underlying fluorophore count and their state tra jectories, as well as background, tran- sition probabilities, and fluorophore brightness. This provides b oth p oin t estimates and credible interv als, quantifying uncertain ty in the num b er of fluorophores and their dynamics. This approach explicitly models dark state transitions and allows intensit y parameters to b e up dated during analysis, in contrast to earlier fixed parameter metho ds. It do es not require all fluorophores to start in the brigh t state and remains accurate up to a reported 100 fluorophores. Ho wev er, the FHMM structure, combined with the large n umber of virtual fluorophores, creates a very high dimensional p osterior, making inference substantially slow er than deterministic approaches, even though many of the v ariables do not contribute directly to the solution. S7 Sim ulating in tensit y profiles The behaviour of fluorophores in FLImP can eac h be described by a Mark ov chain which transitions b et w een the activ e fluorescen t ‘on’ state, σ A , where they are emitting photons, the p ossible transien t ‘off ’ blink and dark states, denoted σ B and σ D resp ectiv ely , and even tually mo ves in to the absorbing photobleac hed state, σ P . A sequence of states is sim ulated for each fluorophore from this underlying discrete-time Marko v c hain with state space S = { σ A , σ B , σ D , σ P } and a typical transition matrix, P , giv en by P = P AA P AB P AD P AP P B A P B B P B D P B P P DA P DB P DD P DP P P A P P B P P D P P P = 0 . 9991 0 . 0002 0 . 0002 0 . 0005 0 . 1 , 000 0 . 9000 0 . 0000 0 . 0000 0 . 0200 0 . 0000 0 . 9800 0 . 0000 0 . 0000 0 . 0000 0 . 0000 1 . 0000 This transition matrix is altered to allow v ariation in the duration of blink and dark states, the frequency of blink and dark states, and the time to photobleach even ts. Duration of blink and dark states are con trolled by v arying the 22 durations dur blink and dur dark and calculating P B B = 1 − 1 dur blink and P DD = 1 − 1 dur dark , and setting P AB = 1 dur blink and P AD = 1 dur dark . The frequencies of blink and dark states are controlled b y v arying P AB and P AD , and the time-to-photobleach is con trolled by v arying P AP , so that P AA = 1 − P AB − P AD − P AP . Once the states ha v e b een sim ulated, fluorophore in tensity is in dep enden tly drawn from a Poisson distribution for each activ e fluorophore in each time frame, and background noise compromised of Gaussian and Poisson comp onen ts added for each time frame, measured in microseconds. Finally , 20 µ s bins are used to mimic the time-resolution observed in FLImP . S8 Con v ergence testing T o ensure conv ergence of chains for each dataset during CRJMCMC, the con vergence of eac h parameter, or sets of parameters, is examined in blo c ks until all ha ve reac hed an appropriate level of con vergence. This is determined according to the p oten tial scale reduction factor and the m ultiv ariate p oten tial scale reduction factor, with a maxim um v alue of 1.2 allow ed in each case. P arameters are sequen tially tested, b eginning with the num b er of c hange p oin ts, k , as this affects the length of the v ector of change point lo cations, s , which complicates the sequential testing of con v ergence. Therefore, first the the p otential scale reduction factor for parameter, k , is calculated, discarding half of the iterations as burn-in. If this parameter has reached a sufficien t lev el of con v ergence, the mode n umber of change p oints, k , in each chain is then determined and the iterations which con tain the corresp onding num b er of c hange p oin ts retained (11) . This allows comparison of traces for the first change p oin t lo cations, second change p oint lo cations etc., so that they corresp ond across and within chains. As the n umber of iterations with the mo de length of s may not b e equal in eac h chain, the final minim um num ber of mo de-length s from both chains is used. This ensures that the resulting set of traces ha v e the same dimension, which allows calculation of the p oten tial scale reduction factor for each of the change p oin t lo cations in s (12) . Finally the intensit y parameters, µ f , µ b , σ 2 f and σ b 2 , are tested, and provided all of the abov e meet the criteria, the chains are then terminated and the results sav ed, otherwise, the chains pro ceed from their last iteration and carry out an additional 10,000 iterations until con vergence or user-defined maximum num ber of iterations. (11) If the mode num ber of c hange points in each c hain do not matc h, it is assumed that the c hains ha ve not appropriately converged, and iterations are contin ued. (12) By calculating conv ergence for b oth k and s , there is no need to calculate conv ergence for k t , as this will hav e conv erged if b oth k and s hav e conv erged. 23 T able A1 : Final non-significant parameter ranges retained after sensi- tivit y analysis. P arameter P ossible Range Chosen V alue Custom Distribution Base V ariance 250 - 60,000 10,000 Custom Distribution Window Size 10 - 50 10 Scaling F actor for ν f 0.001 - 0.100 0.005 Scaling F actor for ν b 0.001 - 1.0 1.0 Birth-Death Max. Probability ( c ) 0.01 - 0.9 0.5 Short-Lived State Max. Probability ( γ ) 0.005 - 0.500 0.1 Change Poin t Number Poisson Mean ( λ ) 1 - 20 2.5 Short-Lived State Poisson Mean ( λ t ) 0.0005 - 6 0.001 Short-Lived State Max. Duration ( τ ) 1 - 30 10 Short-Lived Accept Probability ( p ) 0.1 - 0.9 0.5 S9 Sensitivit y analysis A structured sensitivit y analysis w as p erformed to ev aluate the robustness of the CRJMCMC algorithm to user- defined hyperparameters. Parameters were v aried individually across broad ranges while holding all others fixed at pre-sp ecified default v alues listed in T able A1 . P erformance was measured using root mean square error (RMSE), accuracy , and precision, av eraged ov er 100 sim ulated datasets spanning one to four fluorophores, a signal-to-noise ratio (SNR) of 0.1, and single fluorophore in tensity of 1,000 photons. The range of v alues ev aluated and the av erage p erformance of each parameter can b e found in T ables A2 to A11 with 95% confidence interv als pro vided in brac kets. F or eac h parameter, a one wa y analysis of v ariance (ANOV A) w as p erformed as a single test across all parameter v alues sim ultaneously , to determine whether v ariation in that h yp erparameter pro duced an y o verall difference among group means in the a veraged p erformance metrics (RMSE, accuracy , and precision). Statistical significance was assessed at the 95% lev el ( α = 0 . 05). The null hypothesis in eac h case w as of global equalit y among a verage RMSE for all parameter v alues, with an alternativ e that the a v erage RMSEs are not all equal, e.g. allowing µ i to b e the av erage RMSE for λ with v alue i , a test on the full set of parameter v alues has H 0 : µ 1 = µ 1 . 5 = · · · = µ 20 H 1 : µ i ’s not all equal. P arameter sets showing a significant effect in RMSE were then examined by iterativ ely excluding the most p o orly p er- forming parameter v alues and repeating the same global ANO V A, un til no further significan t effect w as detected. After remo v al of all parameter v alues asso ciated with a statistically significant degradation in p erformance, the remaining subsets were retained as acceptable ranges. These represent configurations for which no statistically significan t differ- ence in group means was observed at the 95% lev el in RMSE. The F -statistic and corresponding p -v alues produced for the full and reduced parameter sets are included in T ables A2 to A11 . T able A1 presen ts the final reduced ranges for all parameters, and the sp ecific v alues used in analysis for this paper (13) (14) . (13) The scaling factors for ν f and ν b were allowed to decrease within the allowed ranges to ν f = 0 . 0025 and ν b = 0 . 005 when analysing DNA origami to enforce stricter prior distributions on the intensit y parameters. (14) λ and λ t were allow ed to increase within the allowed ranges to λ = 10 and λ t = 5 when varying frequency of blink and dark states to encourage more flexible prop osals of short-lived states. 24 T able A2 : Custom Prop osal Distribution Base V ariance Sensitivit y analysis results rep orting RMSE, precision, and accu- racy across a range of v alues for the base v ariance of the custom prop osal distribution. An ANO V A test ov er RMSE for the full parameter set produced F (12 , 1287) = 10 . 46, p < 5 . 58e-20; for the reduced parameter set in T able A1 , F (9 , 990) = 1 . 83, p = 0 . 06. V alue RMSE (Intensit y) Accuracy Precision 10.0 106.189 ( ± 8 . 98) 0.988 ( ± 1 . 96 e − 3) 0.972 ( ± 2 . 05 e − 2) 50.0 92.314 ( ± 8 . 48) 0.990 ( ± 1 . 72 e − 3) 0.975 ( ± 2 . 05 e − 2) 100.0 88.032 ( ± 8 . 65) 0.991 ( ± 1 . 78 e − 3) 0.977 ( ± 2 . 05 e − 2) 250.0 77.146 ( ± 8 . 36) 0.993 ( ± 1 . 73 e − 3) 0.978 ( ± 2 . 06 e − 2) 500.0 72.325 ( ± 8 . 24) 0.994 ( ± 1 . 63 e − 3) 0.979 ( ± 2 . 06 e − 2) 1000.0 64.938 ( ± 6 . 97) 0.995 ( ± 1 . 27 e − 3) 0.981 ( ± 2 . 06 e − 2) 2000.0 68.848 ( ± 6 . 63) 0.996 ( ± 1 . 25 e − 3) 0.981 ( ± 2 . 06 e − 2) 3000.0 71.316 ( ± 6 . 51) 0.995 ( ± 1 . 17 e − 3) 0.981 ( ± 2 . 05 e − 2) 5000.0 67.978 ( ± 6 . 50) 0.996 ( ± 1 . 15 e − 3) 0.981 ( ± 2 . 05 e − 2) 10000.0 67.951 ( ± 6 . 31) 0.996 ( ± 1 . 09 e − 3) 0.983 ( ± 1 . 85 e − 2) 20000.0 67.083 ( ± 6 . 58) 0.996 ( ± 1 . 15 e − 3) 0.982 ( ± 2 . 06 e − 2) 40000.0 77.453 ( ± 6 . 32) 0.996 ( ± 1 . 30 e − 3) 0.981 ( ± 2 . 06 e − 2) 60000.0 77.573 ( ± 5 . 03) 0.996 ( ± 8 . 21 e − 4) 0.982 ( ± 2 . 05 e − 2) T able A3 : Custom Distribution Window Size Sensitivity analysis results rep orting RMSE, precision, and accuracy across a range of v alues for the window size of the custom prop osal distribution. Analysis of v ariance (ANOV A) o ver RMSE for the full parameter set pro duced F (6 , 693) = 18 . 80, p = 2 . 47e-20; for the reduced parameter set in T able A1 , F (5 , 594) = 1 . 15, p = 0 . 33. V alue RMSE (Intensit y) Accuracy Precision 5.0 101.423 ( ± 7 . 51) 0.993 ( ± 4 . 22 e − 3) 0.977 ( ± 2 . 17 e − 2) 10.0 68.284 ( ± 6 . 43) 0.996 ( ± 1 . 10 e − 3) 0.982 ( ± 2 . 06 e − 2) 15.0 59.583 ( ± 7 . 04) 0.996 ( ± 1 . 13 e − 3) 0.982 ( ± 1 . 85 e − 2) 20.0 61.270 ( ± 7 . 11) 0.996 ( ± 1 . 15 e − 3) 0.981 ( ± 2 . 05 e − 2) 30.0 57.550 ( ± 6 . 76) 0.996 ( ± 9 . 67 e − 4) 0.982 ( ± 2 . 05 e − 2) 40.0 59.523 ( ± 7 . 29) 0.996 ( ± 1 . 17 e − 3) 0.983 ( ± 1 . 85 e − 2) 50.0 58.708 ( ± 7 . 60) 0.995 ( ± 1 . 26 e − 3) 0.982 ( ± 2 . 06 e − 2) T able A4 : Scaling F actor for ν f Sensitivit y analysis results rep orting RMSE, precision, and accuracy across a range of v al- ues for the ν f scaling factor. Analysis of v ariance (ANO V A) o ver RMSE for the full parameter set pro duced F (9 , 990) = 12 . 40, p = 8 . 93e-19; for the reduced parameter set in T able A1 , F (3 , 396) = 0 . 86, p = 0 . 46. V alue RMSE (Intensit y) Accuracy Precision 0.001 91.590 ( ± 7 . 20) 0.996 ( ± 1 . 08 e − 3) 0.981 ( ± 2 . 05 e − 2) 0.002 86.815 ( ± 7 . 27) 0.995 ( ± 1 . 44 e − 3) 0.981 ( ± 2 . 06 e − 2) 0.005 68.548 ( ± 6 . 30) 0.996 ( ± 1 . 09 e − 3) 0.982 ( ± 2 . 06 e − 2) 0.010 56.199 ( ± 7 . 21) 0.996 ( ± 1 . 17 e − 3) 0.981 ( ± 2 . 06 e − 2) 0.0200 49.512 ( ± 8 . 01) 0.996 ( ± 1 . 20 e − 3) 0.982 ( ± 2 . 06 e − 2) 0.0500 47.164 ( ± 7 . 54) 0.903 ( ± 4 . 02 e − 2) 0.812 ( ± 7 . 42 e − 2) 0.1000 47.861 ( ± 11 . 51) 0.703 ( ± 5 . 69 e − 2) 0.454 ( ± 9 . 63 e − 2) 0.2000 75.277 ( ± 20 . 85) 0.630 ( ± 5 . 80 e − 2) 0.342 ( ± 9 . 29 e − 2) 0.5000 115.758 ( ± 25 . 52) 0.546 ( ± 5 . 05 e − 2) 0.205 ( ± 7 . 73 e − 2) 1.0000 109.100 ( ± 21 . 40) 0.541 ( ± 4 . 98 e − 2) 0.200 ( ± 7 . 60 e − 2) 25 T able A5 : Scaling F actor for ν b Sensitivit y analysis results rep orting RMSE, precision, and accuracy across a range of v al- ues for the ν b scaling factor. Analysis of v ariance (ANO V A) ov er RMSE for the full parameter set produced F (9 , 990) = 5 . 68e − 2 , p = 1 . 00. V alue RMSE (Intensit y) Accuracy Precision 0.001 68.032 ( ± 6 . 31) 0.996 ( ± 1 . 09 e − 3) 0.982 ( ± 2 . 06 e − 2) 0.002 68.929 ( ± 6 . 23) 0.996 ( ± 1 . 11 e − 3) 0.982 ( ± 2 . 06 e − 2) 0.005 68.301 ( ± 6 . 35) 0.996 ( ± 1 . 13 e − 3) 0.982 ( ± 2 . 06 e − 2) 0.01 68.826 ( ± 6 . 47) 0.996 ( ± 1 . 15 e − 3) 0.982 ( ± 2 . 06 e − 2) 0.02 67.725 ( ± 6 . 24) 0.996 ( ± 1 . 09 e − 3) 0.982 ( ± 2 . 06 e − 2) 0.05 66.959 ( ± 6 . 26) 0.996 ( ± 1 . 08 e − 3) 0.982 ( ± 2 . 06 e − 2) 0.1 68.695 ( ± 6 . 31) 0.996 ( ± 1 . 12 e − 3) 0.981 ( ± 2 . 06 e − 2) 0.2 68.286 ( ± 6 . 58) 0.996 ( ± 1 . 17 e − 3) 0.981 ( ± 2 . 06 e − 2) 0.5 66.933 ( ± 6 . 35) 0.996 ( ± 1 . 12 e − 3) 0.982 ( ± 2 . 06 e − 2) 1.0 69.079 ( ± 6 . 29) 0.996 ( ± 1 . 09 e − 3) 0.982 ( ± 2 . 06 e − 2) T able A6 : Birth-Death Max. Probabilit y (c) Sensitivity analysis results rep orting RMSE, precision, and accuracy across a range of v alues for the maxim um allow ed mo ve probabilit y for birth and death mov es, c . Analysis of v ariance (ANO V A) o v er RMSE for the full parameter set pro duced F (6 , 693) = 0 . 69, p = 0 . 65. V alue RMSE (Intensit y) Accuracy Precision 0.01 64.084 ( ± 5 . 83) 0.996 ( ± 9 . 12 e − 4) 0.984 ( ± 1 . 85 e − 2) 0.05 65.012 ( ± 6 . 03) 0.996 ( ± 9 . 57 e − 4) 0.982 ( ± 2 . 05 e − 2) 0.10 64.753 ( ± 6 . 27) 0.996 ( ± 1 . 08 e − 3) 0.982 ( ± 2 . 06 e − 2) 0.25 66.552 ( ± 6 . 37) 0.996 ( ± 1 . 12 e − 3) 0.982 ( ± 2 . 06 e − 2) 0.50 69.887 ( ± 6 . 33) 0.996 ( ± 1 . 09 e − 3) 0.981 ( ± 2 . 06 e − 2) 0.75 69.144 ( ± 6 . 67) 0.996 ( ± 1 . 16 e − 3) 0.982 ( ± 2 . 06 e − 2) 0.90 70.471 ( ± 6 . 32) 0.995 ( ± 1 . 09 e − 3) 0.982 ( ± 1 . 85 e − 2) T able A7 : Short-Lived State Max. Probability ( γ ) Sensi- tivit y analysis results rep orting RMSE, precision, and accuracy across a range of v alues for the maximum allow ed mov e proba- bilit y for add and remov e short-liv ed state mo ves, γ . Analysis of v ariance (ANO V A) o v er RMSE for the full parameter set pro- duced F (9 , 990) = 6 . 23, p = 1 . 28e-8; for the reduced parameter set in T able A1 , F (8 , 891) = 0 . 72, p = 0 . 67. V alue RMSE (Intensit y) Accuracy Precision 0.001 99.497 ( ± 13 . 92) 0.986 ( ± 4 . 58 e − 3) 0.968 ( ± 2 . 12 e − 2) 0.005 76.203 ( ± 8 . 47) 0.994 ( ± 1 . 78 e − 3) 0.979 ( ± 2 . 06 e − 2) 0.010 69.370 ( ± 6 . 58) 0.996 ( ± 1 . 05 e − 3) 0.981 ( ± 2 . 05 e − 2) 0.025 68.237 ( ± 6 . 94) 0.996 ( ± 1 . 30 e − 3) 0.981 ( ± 2 . 06 e − 2) 0.050 70.586 ( ± 7 . 14) 0.995 ( ± 1 . 43 e − 3) 0.981 ( ± 2 . 06 e − 2) 0.100 68.406 ( ± 6 . 27) 0.996 ( ± 1 . 09 e − 3) 0.982 ( ± 2 . 06 e − 2) 0.200 69.238 ( ± 6 . 58) 0.996 ( ± 1 . 17 e − 3) 0.981 ( ± 2 . 05 e − 2) 0.300 66.775 ( ± 6 . 33) 0.996 ( ± 1 . 14 e − 3) 0.982 ( ± 2 . 06 e − 2) 0.400 67.236 ( ± 6 . 61) 0.996 ( ± 1 . 17 e − 3) 0.982 ( ± 2 . 06 e − 2) 0.500 66.375 ( ± 6 . 30) 0.996 ( ± 1 . 15 e − 3) 0.982 ( ± 2 . 06 e − 2) 26 T able A8 : Change Poin t Number P oisson Mean ( λ ) Sensitivit y analysis results rep orting RMSE, precision, and accuracy across a range of v alues for the mean num b er of change p oin ts, λ . An ANO V A test ov er RMSE for the full parameter set pro duced F (12 , 1287) = 0 . 29, p = 0 . 99. V alue RMSE (Intensit y) Accuracy Precision 1.0 65.345 ( ± 5 . 81) 0.996 ( ± 8 . 99 e − 4) 0.983 ( ± 2 . 05 e − 2) 1.5 69.089 ( ± 6 . 58) 0.996 ( ± 1 . 17 e − 3) 0.981 ( ± 2 . 05 e − 2) 2.0 63.839 ( ± 6 . 26) 0.996 ( ± 1 . 14 e − 3) 0.982 ( ± 2 . 06 e − 2) 2.5 65.659 ( ± 6 . 09) 0.996 ( ± 9 . 74 e − 4) 0.982 ( ± 2 . 05 e − 2) 3.0 68.135 ( ± 6 . 93) 0.996 ( ± 1 . 36 e − 3) 0.981 ( ± 2 . 06 e − 2) 4.0 64.960 ( ± 6 . 18) 0.996 ( ± 9 . 75 e − 4) 0.982 ( ± 2 . 05 e − 2) 5.0 65.289 ( ± 6 . 25) 0.996 ( ± 1 . 08 e − 3) 0.982 ( ± 2 . 06 e − 2) 6.0 67.623 ( ± 6 . 39) 0.996 ( ± 1 . 06 e − 3) 0.982 ( ± 2 . 05 e − 2) 8.0 66.044 ( ± 6 . 08) 0.996 ( ± 1 . 02 e − 3) 0.982 ( ± 2 . 05 e − 2) 10.0 64.918 ( ± 6 . 62) 0.996 ( ± 1 . 13 e − 3) 0.982 ( ± 2 . 06 e − 2) 12.0 65.273 ( ± 6 . 52) 0.996 ( ± 1 . 17 e − 3) 0.983 ( ± 1 . 98 e − 2) 15.0 63.912 ( ± 5 . 81) 0.997 ( ± 8 . 93 e − 4) 0.984 ( ± 1 . 75 e − 2) 20.0 63.294 ( ± 5 . 58) 0.997 ( ± 7 . 96 e − 4) 0.984 ( ± 1 . 75 e − 2) T able A9 : Short-Lived State Poisson Mean ( λ t ) Sensi- tivit y analysis results rep orting RMSE, precision, and accuracy across a range of v alues for the mean n umber of short-liv ed state change p oin ts, λ t . An ANOV A test ov er RMSE for the full parameter set pro duced F (14 , 1485) = 0 . 27, p = 1 . 00. V alue RMSE (Intensit y) Accuracy Precision 0.0005 65.130 ( ± 6 . 02) 0.996 ( ± 9 . 42 e − 4) 0.983 ( ± 2 . 05 e − 2) 0.001 65.078 ( ± 6 . 19) 0.996 ( ± 9 . 81 e − 4) 0.983 ( ± 2 . 06 e − 2) 0.005 64.184 ( ± 6 . 03) 0.996 ( ± 9 . 39 e − 4) 0.983 ( ± 2 . 05 e − 2) 0.01 63.919 ( ± 5 . 97) 0.996 ( ± 9 . 28 e − 4) 0.983 ( ± 2 . 06 e − 2) 0.025 63.820 ( ± 5 . 96) 0.996 ( ± 9 . 31 e − 4) 0.983 ( ± 2 . 05 e − 2) 0.05 64.915 ( ± 6 . 01) 0.996 ( ± 9 . 36 e − 4) 0.983 ( ± 2 . 05 e − 2) 0.1 65.299 ( ± 6 . 05) 0.996 ( ± 9 . 46 e − 4) 0.983 ( ± 2 . 05 e − 2) 0.25 63.599 ( ± 6 . 05) 0.996 ( ± 9 . 42 e − 4) 0.983 ( ± 2 . 05 e − 2) 0.5 62.902 ( ± 5 . 95) 0.997 ( ± 9 . 28 e − 4) 0.983 ( ± 2 . 06 e − 2) 1.0 62.116 ( ± 5 . 83) 0.997 ( ± 9 . 09 e − 4) 0.983 ( ± 2 . 06 e − 2) 2.0 61.880 ( ± 5 . 44) 0.997 ( ± 7 . 80 e − 4) 0.983 ( ± 2 . 05 e − 2) 3.0 62.763 ( ± 5 . 64) 0.997 ( ± 8 . 25 e − 4) 0.983 ( ± 2 . 05 e − 2) 4.0 62.246 ( ± 5 . 86) 0.997 ( ± 8 . 61 e − 4) 0.983 ( ± 2 . 05 e − 2) 5.0 60.610 ( ± 5 . 35) 0.997 ( ± 7 . 38 e − 4) 0.983 ( ± 2 . 05 e − 2) 6.0 62.073 ( ± 5 . 28) 0.997 ( ± 7 . 41 e − 4) 0.983 ( ± 2 . 05 e − 2) 27 T able A10 : Short-Lived State Max. Duration ( τ ) Sensi- tivit y analysis results rep orting RMSE, precision, and accuracy across a range of v alues for the mean num ber of short-liv ed state change p oin ts, τ . An ANOV A test o v er RMSE for the full parameter set pro duced F (19 , 1980) = 5 . 03, p = 7 . 00e-12; for the reduced parameter set in T able A1 , F (12 , 1287) = 1 . 42, p = 0 . 15 V alue RMSE (Intensit y) Accuracy Precision 1.0 60.434 ( ± 4 . 99) 0.997 ( ± 6 . 91 e − 4) 0.984 ( ± 2 . 05 e − 2) 2.0 62.206 ( ± 5 . 13) 0.997 ( ± 7 . 18 e − 4) 0.984 ( ± 2 . 05 e − 2) 3.0 63.108 ( ± 5 . 52) 0.997 ( ± 7 . 86 e − 4) 0.983 ( ± 2 . 05 e − 2) 4.0 63.111 ( ± 5 . 47) 0.997 ( ± 8 . 01 e − 4) 0.983 ( ± 2 . 05 e − 2) 5.0 63.999 ( ± 5 . 77) 0.997 ( ± 9 . 06 e − 4) 0.983 ( ± 2 . 05 e − 2) 6.0 65.474 ( ± 6 . 21) 0.996 ( ± 1 . 04 e − 3) 0.982 ( ± 2 . 06 e − 2) 8.0 66.204 ( ± 6 . 39) 0.996 ( ± 1 . 11 e − 3) 0.982 ( ± 2 . 06 e − 2) 10.0 67.647 ( ± 6 . 34) 0.996 ( ± 1 . 10 e − 3) 0.982 ( ± 2 . 06 e − 2) 12.0 66.939 ( ± 6 . 47) 0.996 ( ± 1 . 08 e − 3) 0.982 ( ± 2 . 05 e − 2) 15.0 68.498 ( ± 6 . 63) 0.996 ( ± 1 . 16 e − 3) 0.983 ( ± 1 . 85 e − 2) 20.0 70.443 ( ± 7 . 20) 0.995 ( ± 1 . 43 e − 3) 0.982 ( ± 1 . 85 e − 2) 25.0 73.362 ( ± 7 . 65) 0.994 ( ± 1 . 67 e − 3) 0.980 ( ± 1 . 86 e − 2) 30.0 71.314 ( ± 7 . 56) 0.995 ( ± 1 . 65 e − 3) 0.980 ( ± 2 . 07 e − 2) 40.0 75.116 ( ± 8 . 58) 0.994 ( ± 2 . 18 e − 3) 0.977 ( ± 2 . 08 e − 2) 50.0 79.032 ( ± 10 . 21) 0.992 ( ± 3 . 07 e − 3) 0.976 ( ± 1 . 90 e − 2) 60.0 83.350 ( ± 11 . 32) 0.991 ( ± 3 . 42 e − 3) 0.975 ( ± 1 . 91 e − 2) 70.0 87.127 ( ± 12 . 57) 0.989 ( ± 4 . 37 e − 3) 0.972 ( ± 1 . 97 e − 2) 80.0 86.589 ( ± 11 . 85) 0.990 ( ± 4 . 17 e − 3) 0.971 ( ± 2 . 16 e − 2) 90.0 87.157 ( ± 12 . 56) 0.989 ( ± 4 . 42 e − 3) 0.971 ( ± 2 . 16 e − 2) 100.0 91.734 ( ± 13 . 80) 0.987 ( ± 4 . 76 e − 3) 0.968 ( ± 2 . 17 e − 2) T able A11 : Short-Lived State Accept Probability (p) Sensitivit y analysis results rep orting RMSE, precision, and accuracy across a range of v alues for the target acceptance prob- abilit y for short-liv ed state duration, p . An ANO V A test ov er RMSE for the full parameter set pro duced F (8 , 891) = 0 . 43, p = 0 . 91. V alue RMSE (Intensit y) Accuracy Precision 0.1 64.121 ( ± 5 . 73) 0.997 ( ± 8 . 88 e − 4) 0.983 ( ± 2 . 05 e − 2) 0.2 65.702 ( ± 6 . 17) 0.996 ( ± 1 . 09 e − 3) 0.982 ( ± 2 . 06 e − 2) 0.3 66.186 ( ± 5 . 94) 0.996 ( ± 9 . 29 e − 4) 0.982 ( ± 2 . 05 e − 2) 0.4 66.073 ( ± 6 . 22) 0.996 ( ± 1 . 08 e − 3) 0.982 ( ± 2 . 06 e − 2) 0.5 68.187 ( ± 6 . 33) 0.996 ( ± 1 . 10 e − 3) 0.982 ( ± 2 . 06 e − 2) 0.6 66.588 ( ± 6 . 12) 0.996 ( ± 9 . 61 e − 4) 0.982 ( ± 2 . 05 e − 2) 0.7 66.299 ( ± 6 . 76) 0.996 ( ± 1 . 31 e − 3) 0.982 ( ± 2 . 06 e − 2) 0.8 68.991 ( ± 6 . 00) 0.996 ( ± 9 . 64 e − 4) 0.982 ( ± 1 . 85 e − 2) 0.9 71.120 ( ± 6 . 72) 0.995 ( ± 1 . 23 e − 3) 0.981 ( ± 2 . 05 e − 2) 28 S10 MCMC diagnostics Parameter MCSE ESS PSRF k 0.018 ( ± 2.00e-03) 54.011 ( ± 1.05e+01) 1.009 ( ± 2.78e-03) s 0.052 ( ± 5.58e-03) 23.420 ( ± 2.98e+00) 1.017 ( ± 2.86e-03) µ f 0.178 ( ± 1.03e-02) 1469.062 ( ± 1.55e+01) 1.051 ( ± 1.80e-02) µ b 0.104 ( ± 7.57e-03) 1539.736 ( ± 8.14e+00) 1.011 ( ± 2.62e-03) σ 2 f 0.034 ( ± 2.87e-03) 1153.320 ( ± 8.24e+00) 1.034 ( ± 5.14e-03) σ 2 b 0.151 ( ± 1.77e-02) 1138.445 ( ± 1.00e+01) 1.048 ( ± 6.76e-03) T able A12 : MCMC diagnostics summary p er parameter. V alues sho w the mean and 95% confidence interv al ( ± ) across runs for in tensity parameters, for k and s , the 5% trimmed mean, and 95% p ercen tile confidence interv al based on 1,000 b o otstrap resamples. T able A12 shows diagnostic results for the estimated parameters from 3,600 simulated intensit y traces spanning one to four fluorophores, mean intensities of 500, 1,000, and 2,000 photons, and SNR of 0.01, 0.1, and 1, all of which are typical for data deriv ed from FLImP . Chains were terminated at 20,000 iterations to enable consistent ev aluation and comparison of con vergence b eha viour across parameters. The intensit y parameters µ f , µ b , σ f , and σ b , denoting fluorophore and bac kground in tensit y mean and v ariance, exhibit higher effectiv e sample sizes (ESS > 1 , 000) in comparison to the change p oin t parameters. The num b er of c hange p oin ts, k , and their locations, s (av eraged across all lo cations), show ed substantially low er ESS (54.0 and 23.4, respectively) suggesting p osterior stickiness. Ho w ever, this b eha viour is consistent with the expected structure of change point mo dels in MCMC, where the lik eliho od tends to dominate the p osterior, and prop osed c hanges to k or s often lead to large shifts in likelihoo d; once the correct change point configuration is identified, the sampler rarely deviates, resulting in high posterior stability but limited exploration in later iterations. As such, the decreased ESS for change p oint parameters follows the exp ected pattern for m ultiple c hange point mo dels. In light of this p osterior stic kiness, a 5% trimmed mean and 95% confidence in terv als based on 1,000 b ootstrap resamples w ere used for the a verage PSRF for k and s . All parameters estimated hav e PSRF v alues close to 1.0, indicating efficien t mixing and stable p osterior estimates. Finally , Mon te Carlo standard errors (MCSEs) remained lo w for all parameters, further supp orting the numerical stabilit y of the p osterior estimates, ev en where sampling efficiency was reduced for c hange p oin t-related v ariables. T o demonstrate the performance of CRJMCMC in terms of con vergence metrics, Fig. A1 , Fig. A2 , and Fig. A3 respectively present an example of the p osterior k ernel densit y estimates of c hange point lo cations with the corresp onding sim ulated integrated in tensity trace pro vided for comparison, and the p osterior kernel densit y estimates and trace plots for the intensit y parameters. The trace plots exhibit go o d mixing and the p osterior distributions show clear p eaks, reflective of the conv ergence diagnostics in T able A12 . 29 a b Fig. A1 : Posterior estimates of c hange point lo cations and corresponding simulated intensit y trace. ( a ) P osterior k ernel densit y estimates (standard deviation of 2) for c hange point lo cations, conditioned on the num b er of change p oin ts, from a single Marko v chain with 20,000 iterations following a burn-in of 10,000 iterations. ( b ) Corresp onding simulated intensit y trace (turquoise), CRJMCMC mo del estimation (red line), with four fluorophores and an SNR of 0.1. 30 a b c d Fig. A2 : Posterior k ernel density estimates (standard deviation of 2) for the intensit y parameters (a) µ f , (b) µ b , (c) σ 2 f , and (d) σ 2 b from a single Marko v chain with 20,000 iterations follo wing a burn-in of 10,000 iterations. Parameters were estimated from a simulated integrated intensit y trace with four fluorophores, mean single fluorophore intensit y of 1,000 photons, and an SNR of 0.1. 31 a b c d Fig. A3 : T race plots for the intensit y parameters (a) µ f , (b) µ b , (c) σ 2 f , and (d) σ 2 b obtained from tw o indep enden t, parallel Marko v c hains (red and turquoise), each run for 20,000 iterations following a burn-in of 10,000 iterations. Parameters were estimated from a simulated integrated intensit y trace with four fluorophores, mean single fluorophore intensit y of 1,000 photons, and an SNR of 0.1. 32 S11 Additional simulation results T o ev aluate p erformance of the CRJMCMC algorithm across a wide range of conditions, an extensiv e simulation study of approximately 18,600 indep enden t sim ulated intensit y traces was performed by v arying fluorophore num ber, SNR, single-fluorophore intensit y ( µ f ), dark-state frequency and duration, blink-state frequency and duration. P erformance was assessed using multiple metrics: av erage accuracy , precision, sensitivit y , and sp ecificit y , and Cohen’s k appa of the estimated active fluorophore count in eac h frame; RMSE of total estimated intensit y; and absolute error in intensit y parameters µ f , µ b , σ 2 f , and σ 2 b . The metho ds compared include the CRJMCMC, monotonic decay MAP [ 22 ] (15) , sequential MAP estimation [ 24 ], and factorial HMM-MCMC [ 23 ] (16) . F or each considered parameter v alue, the b est-performing metho d is indicated in b old and 95% confidence in terv als are provided in brac kets. S11.1 V arying SNR T able A13 : Accuracy SNR CRJMCMC F actorial HMM Monotonic MAP Sequential MAP 0.001 0.832 ( ± 2.53e-2) 0.422 ( ± 2.72e-2) 0.765 ( ± 3.64e-2) 0.637 ( ± 4.31e-2) 0.002 0.909 ( ± 1.73e-2) 0.503 ( ± 3.29e-2) 0.856 ( ± 2.57e-2) 0.719 ( ± 4.45e-2) 0.003 0.876 ( ± 2.35e-2) 0.554 ( ± 3.71e-2) 0.903 ( ± 1.79e-2) 0.773 ( ± 4.28e-2) 0.004 0.956 ( ± 9.35e-3) 0.588 ( ± 4.01e-2) 0.874 ( ± 2.06e-2) 0.781 ( ± 4.47e-2) 0.005 0.931 ( ± 1.74e-2) 0.640 ( ± 3.99e-2) 0.877 ( ± 2.14e-2) 0.796 ( ± 4.30e-2) 0.006 0.944 ( ± 1.42e-2) 0.644 ( ± 4.57e-2) 0.884 ( ± 2.17e-2) 0.841 ( ± 3.74e-2) 0.007 0.975 ( ± 4.73e-3) 0.677 ( ± 4.48e-2) 0.911 ( ± 1.77e-2) 0.825 ( ± 4.40e-2) 0.008 0.959 ( ± 1.24e-2) 0.655 ( ± 4.66e-2) 0.904 ( ± 1.87e-2) 0.843 ( ± 4.27e-2) 0.009 0.982 ( ± 3.28e-3) 0.740 ( ± 5.05e-2) 0.891 ( ± 1.98e-2) 0.885 ( ± 3.38e-2) 0.01 0.972 ( ± 8.81e-3) 0.720 ( ± 5.18e-2) 0.892 ( ± 2.08e-2) 0.849 ( ± 4.19e-2) T able A14 : Precision SNR CRJMCMC F actorial HMM Monotonic MAP Sequential MAP 0.001 0.960 ( ± 1.52e-2) 0.542 ( ± 5.05e-2) 0.910 ( ± 2.79e-2) 0.857 ( ± 3.52e-2) 0.002 0.975 ( ± 6.71e-3) 0.663 ( ± 4.38e-2) 0.916 ( ± 2.11e-2) 0.886 ( ± 2.95e-2) 0.003 0.989 ( ± 2.78e-3) 0.802 ( ± 4.70e-2) 0.933 ( ± 1.93e-2) 0.884 ( ± 3.62e-2) 0.004 0.984 ( ± 4.41e-3) 0.775 ( ± 5.23e-2) 0.910 ( ± 1.99e-2) 0.902 ( ± 3.09e-2) 0.005 0.989 ( ± 3.09e-3) 0.805 ( ± 5.15e-2) 0.904 ( ± 2.25e-2) 0.873 ( ± 4.36e-2) 0.006 0.991 ( ± 2.48e-3) 0.867 ( ± 3.79e-2) 0.898 ( ± 2.48e-2) 0.930 ( ± 2.87e-2) 0.007 0.989 ( ± 2.53e-3) 0.860 ( ± 4.62e-2) 0.926 ( ± 2.03e-2) 0.899 ( ± 3.89e-2) 0.008 0.992 ( ± 1.75e-3) 0.883 ( ± 3.12e-2) 0.919 ( ± 2.02e-2) 0.925 ( ± 3.06e-2) 0.009 0.992 ( ± 1.81e-3) 0.872 ( ± 4.47e-2) 0.897 ( ± 2.26e-2) 0.930 ( ± 3.22e-2) 0.01 0.992 ( ± 2.37e-3) 0.930 ( ± 2.75e-2) 0.910 ( ± 2.18e-2) 0.877 ( ± 4.64e-2) (15) As a result of p ooling intensit y parameters with the same mean and SNR, the calibration carried out on the monotonic MAP algorithm in Garry et al. (2020) [ 22 ] produces the same intensit y parameters for all data in a p ool. (16) Due to the distribution used to mo del intensit y in Bryan IV et al. (2022) [ 23 ], this method do es not produce directly comparable estimates of σ 2 f and σ 2 b ; v ariance-based p erformance metrics are therefore rep orted only for the remaining Gaussian-based methods. 33 T able A15 : Sensitivity SNR CRJMCMC F actorial HMM Monotonic MAP Sequential MAP 0.001 0.788 ( ± 3.56e-2) 0.423 ( ± 4.78e-2) 0.756 ( ± 4.68e-2) 0.590 ( ± 5.71e-2) 0.002 0.900 ( ± 2.15e-2) 0.527 ( ± 5.52e-2) 0.885 ( ± 3.15e-2) 0.707 ( ± 5.62e-2) 0.003 0.837 ( ± 3.15e-2) 0.486 ( ± 5.45e-2) 0.930 ( ± 2.12e-2) 0.764 ( ± 5.43e-2) 0.004 0.952 ( ± 1.24e-2) 0.572 ( ± 6.40e-2) 0.898 ( ± 3.21e-2) 0.776 ( ± 5.76e-2) 0.005 0.918 ( ± 2.23e-2) 0.632 ( ± 6.30e-2) 0.921 ( ± 2.79e-2) 0.808 ( ± 5.43e-2) 0.006 0.931 ( ± 1.91e-2) 0.605 ( ± 6.63e-2) 0.948 ( ± 2.10e-2) 0.824 ( ± 5.27e-2) 0.007 0.976 ( ± 6.72e-3) 0.666 ( ± 6.31e-2) 0.946 ( ± 2.06e-2) 0.844 ( ± 5.10e-2) 0.008 0.951 ( ± 1.60e-2) 0.631 ( ± 6.52e-2) 0.945 ( ± 2.29e-2) 0.824 ( ± 5.73e-2) 0.009 0.983 ( ± 4.09e-3) 0.735 ( ± 6.72e-2) 0.960 ( ± 1.79e-2) 0.874 ( ± 4.86e-2) 0.01 0.966 ( ± 1.19e-2) 0.658 ( ± 6.62e-2) 0.930 ( ± 2.59e-2) 0.840 ( ± 5.67e-2) T able A16 : Sp ecificity SNR CRJMCMC F actorial HMM Monotonic MAP Sequential MAP 0.001 0.916 ( ± 2.03e-2) 0.512 ( ± 5.17e-2) 0.794 ( ± 5.00e-2) 0.812 ( ± 3.67e-2) 0.002 0.920 ( ± 1.97e-2) 0.568 ( ± 5.47e-2) 0.760 ( ± 4.70e-2) 0.821 ( ± 3.40e-2) 0.003 0.965 ( ± 1.01e-2) 0.743 ( ± 4.84e-2) 0.796 ( ± 4.81e-2) 0.814 ( ± 3.83e-2) 0.004 0.941 ( ± 1.77e-2) 0.701 ( ± 5.84e-2) 0.744 ( ± 5.09e-2) 0.851 ( ± 3.11e-2) 0.005 0.964 ( ± 9.43e-3) 0.713 ( ± 5.55e-2) 0.745 ( ± 4.90e-2) 0.827 ( ± 3.67e-2) 0.006 0.968 ( ± 9.01e-3) 0.777 ( ± 5.58e-2) 0.730 ( ± 5.60e-2) 0.884 ( ± 2.54e-2) 0.007 0.952 ( ± 1.34e-2) 0.746 ( ± 5.37e-2) 0.780 ( ± 4.70e-2) 0.841 ( ± 3.96e-2) 0.008 0.971 ( ± 7.71e-3) 0.796 ( ± 4.89e-2) 0.759 ( ± 5.16e-2) 0.885 ( ± 2.91e-2) 0.009 0.969 ( ± 7.44e-3) 0.775 ( ± 5.42e-2) 0.713 ( ± 5.35e-2) 0.897 ( ± 2.16e-2) 0.01 0.974 ( ± 7.58e-3) 0.889 ( ± 3.86e-2) 0.767 ( ± 5.20e-2) 0.877 ( ± 3.00e-2) T able A17 : Cohen’s Kappa SNR CRJMCMC F actorial HMM Monotonic MAP Sequential MAP 0.001 0.718 ( ± 3.61e-2) 0.175 ( ± 2.46e-2) 0.597 ( ± 5.48e-2) 0.433 ( ± 5.47e-2) 0.002 0.837 ( ± 2.71e-2) 0.267 ( ± 3.15e-2) 0.733 ( ± 4.11e-2) 0.552 ( ± 5.82e-2) 0.003 0.793 ( ± 3.34e-2) 0.330 ( ± 4.21e-2) 0.812 ( ± 3.36e-2) 0.629 ( ± 5.40e-2) 0.004 0.925 ( ± 1.34e-2) 0.383 ( ± 4.99e-2) 0.767 ( ± 3.73e-2) 0.657 ( ± 6.01e-2) 0.005 0.886 ( ± 2.49e-2) 0.455 ( ± 5.29e-2) 0.763 ( ± 4.10e-2) 0.681 ( ± 5.65e-2) 0.006 0.907 ( ± 2.14e-2) 0.488 ( ± 5.56e-2) 0.790 ( ± 3.90e-2) 0.747 ( ± 5.04e-2) 0.007 0.956 ( ± 8.07e-3) 0.511 ( ± 5.81e-2) 0.833 ( ± 3.27e-2) 0.724 ( ± 6.07e-2) 0.008 0.934 ( ± 1.65e-2) 0.506 ( ± 5.44e-2) 0.806 ( ± 3.92e-2) 0.757 ( ± 5.62e-2) 0.009 0.966 ( ± 5.42e-3) 0.611 ( ± 6.39e-2) 0.790 ( ± 3.80e-2) 0.798 ( ± 4.81e-2) 0.01 0.953 ( ± 1.20e-2) 0.606 ( ± 6.20e-2) 0.809 ( ± 3.70e-2) 0.770 ( ± 5.45e-2) T able A18 : RMSE (Intensit y) SNR CRJMCMC F actorial HMM Monotonic MAP Sequen tial MAP 0.001 393.289 ( ± 28.50) 993.374 ( ± 64.72) 444.889 ( ± 45.91) 596.800 ( ± 53.96) 0.002 276.356 ( ± 21.12) 730.395 ( ± 52.94) 363.919 ( ± 45.71) 447.926 ( ± 30.42) 0.003 347.860 ( ± 27.29) 628.971 ( ± 50.45) 313.393 ( ± 43.92) 399.312 ( ± 32.40) 0.004 235.003 ( ± 20.36) 552.839 ( ± 45.67) 364.077 ( ± 47.11) 371.847 ( ± 30.54) 0.005 231.331 ( ± 18.19) 504.345 ( ± 45.01) 356.689 ( ± 53.52) 336.586 ( ± 26.81) 0.006 243.781 ( ± 24.80) 481.861 ( ± 44.90) 336.267 ( ± 48.10) 313.339 ( ± 29.47) 0.007 202.684 ( ± 21.11) 451.174 ( ± 46.84) 309.228 ( ± 43.81) 324.446 ( ± 31.43) 0.008 186.865 ( ± 16.87) 401.145 ( ± 34.12) 311.436 ( ± 45.85) 287.048 ( ± 25.43) 0.009 157.462 ( ± 15.28) 352.856 ( ± 31.29) 337.149 ( ± 52.42) 293.587 ( ± 30.78) 0.01 204.535 ( ± 19.66) 421.204 ( ± 44.54) 336.401 ( ± 51.88) 281.923 ( ± 25.64) 34 T able A19 : Absolute Error ( µ f ) SNR CRJMCMC F actorial HMM Monotonic MAP Sequential MAP 0.001 198.637 ( ± 14.42) 198.357 ( ± 14.87) 122.405 ( ± 3.59) 364.098 ( ± 71.66) 0.002 130.461 ( ± 8.30) 132.549 ( ± 8.81) 145.176 ( ± 18.35) 259.664 ( ± 46.21) 0.003 254.351 ( ± 11.28) 247.675 ( ± 14.42) 128.588 ( ± 15.14) 217.050 ( ± 41.51) 0.004 135.848 ( ± 7.45) 135.500 ( ± 10.06) 167.031 ( ± 19.89) 237.149 ( ± 51.88) 0.005 138.376 ( ± 11.59) 137.638 ( ± 14.09) 127.419 ( ± 14.58) 210.388 ( ± 56.30) 0.006 145.070 ( ± 16.91) 140.853 ( ± 23.07) 99.658 ( ± 14.98) 177.086 ( ± 52.56) 0.007 127.039 ( ± 9.95) 123.776 ( ± 15.67) 141.237 ( ± 16.25) 164.994 ( ± 36.44) 0.008 86.603 ( ± 13.54) 87.838 ( ± 18.02) 130.927 ( ± 14.64) 172.466 ( ± 38.87) 0.009 76.039 ( ± 4.80) 78.872 ( ± 7.53) 133.531 ( ± 8.76) 181.845 ( ± 73.34) 0.01 133.005 ( ± 10.46) 148.218 ( ± 18.83) 141.545 ( ± 15.50) 207.375 ( ± 72.23) T able A20 : Absolute Error ( µ b ) SNR CRJMCMC F actorial HMM Monotonic MAP Sequential MAP 0.001 43.392 ( ± 5.51) 584.159 ( ± 95.42) 112.093 ( ± 5.75) 303.985 ( ± 66.03) 0.002 33.745 ( ± 4.37) 402.923 ( ± 69.73) 94.819 ( ± 14.19) 195.645 ( ± 29.90) 0.003 38.345 ( ± 7.77) 260.311 ( ± 50.71) 95.116 ( ± 9.74) 158.459 ( ± 32.74) 0.004 30.437 ( ± 5.31) 259.669 ( ± 46.31) 133.497 ( ± 17.85) 158.674 ( ± 26.29) 0.005 16.634 ( ± 2.08) 259.286 ( ± 47.00) 120.460 ( ± 12.23) 117.930 ( ± 22.98) 0.006 14.727 ( ± 3.44) 220.746 ( ± 37.99) 48.175 ( ± 6.20) 93.836 ( ± 19.32) 0.007 42.691 ( ± 5.17) 203.564 ( ± 46.24) 100.532 ( ± 11.28) 116.607 ( ± 24.12) 0.008 14.151 ( ± 3.22) 174.564 ( ± 38.93) 86.568 ( ± 9.17) 101.169 ( ± 20.09) 0.009 16.449 ( ± 4.71) 141.806 ( ± 34.30) 94.023 ( ± 6.23) 108.792 ( ± 41.88) 0.01 32.667 ( ± 5.45) 144.796 ( ± 31.39) 78.550 ( ± 5.72) 95.012 ( ± 18.84) T able A21 : Absolute Error ( σ 2 f ) SNR CRJMCMC Monotonic MAP Sequential MAP 0.001 517.012 ( ± 40.32) 1.20e+6 ( ± 1.14e+5) 318.283 ( ± 51.89) 0.002 351.567 ( ± 13.22) 6.40e+5 ( ± 6.44e+4) 460.007 ( ± 73.23) 0.003 501.893 ( ± 32.62) 4.27e+5 ( ± 4.42e+4) 563.708 ( ± 80.78) 0.004 328.746 ( ± 9.90) 3.39e+5 ( ± 3.62e+4) 646.804 ( ± 90.30) 0.005 379.851 ( ± 15.68) 2.65e+5 ( ± 2.80e+4) 683.374 ( ± 88.47) 0.006 343.601 ( ± 39.84) 2.42e+5 ( ± 2.68e+4) 734.462 ( ± 91.78) 0.007 353.738 ( ± 31.45) 1.95e+5 ( ± 2.09e+4) 769.817 ( ± 92.13) 0.008 293.944 ( ± 20.16) 1.89e+5 ( ± 2.17e+4) 786.695 ( ± 93.87) 0.009 252.127 ( ± 21.44) 1.67e+5 ( ± 1.82e+4) 799.185 ( ± 94.79) 0.01 298.946 ( ± 27.58) 1.78e+5 ( ± 2.25e+4) 817.943 ( ± 96.52) T able A22 : Absolute Error ( σ 2 b ) SNR CRJMCMC Monotonic MAP Sequential MAP 0.001 4.94e+4 ( ± 4.72e+3) 8.31e+4 ( ± 2.43e+3) 1.17e+6 ( ± 1.12e+5) 0.002 3.35e+4 ( ± 2.36e+3) 6.34e+4 ( ± 5.82e+3) 5.83e+5 ( ± 5.60e+4) 0.003 5.27e+4 ( ± 9.11e+3) 8.55e+4 ( ± 1.71e+4) 3.88e+5 ( ± 3.73e+4) 0.004 2.84e+4 ( ± 4.58e+3) 9.25e+4 ( ± 1.89e+4) 2.91e+5 ( ± 2.80e+4) 0.005 3.90e+4 ( ± 3.28e+3) 9.07e+4 ( ± 1.60e+4) 2.33e+5 ( ± 2.24e+4) 0.006 1.59e+4 ( ± 1.04e+3) 4.06e+4 ( ± 9.83e+3) 1.94e+5 ( ± 1.87e+4) 0.007 4.48e+4 ( ± 1.46e+3) 7.80e+4 ( ± 1.60e+4) 1.66e+5 ( ± 1.60e+4) 0.008 1.04e+4 ( ± 1.02e+3) 6.22e+4 ( ± 8.49e+3) 1.45e+5 ( ± 1.40e+4) 0.009 3.14e+4 ( ± 6.25e+3) 8.13e+4 ( ± 1.45e+4) 1.29e+5 ( ± 1.24e+4) 0.01 1.69e+4 ( ± 1.31e+3) 6.45e+4 ( ± 9.81e+3) 1.16e+5 ( ± 1.12e+4) 35 S11.2 V arying Fluorophore Number T able A23 : Accuracy Fluorophore num ber CRJMCMC F actorial HMM Monotonic MAP Sequential MAP 1 0.995 ( ± 3.56e-3) 0.951 ( ± 1.85e-2) 0.963 ( ± 1.91e-2) 2 0.991 ( ± 2.67e-3) 0.718 ( ± 7.07e-2) 0.910 ( ± 2.19e-2) 0.914 ( ± 3.85e-2) 3 0.984 ( ± 5.85e-3) 0.801 ( ± 5.80e-2) 0.892 ( ± 2.08e-2) 0.885 ( ± 4.78e-2) 4 0.978 ( ± 7.58e-3) 0.831 ( ± 4.31e-2) 0.844 ( ± 2.19e-2) 0.872 ( ± 4.70e-2) 5 0.967 ( ± 1.29e-2) 0.790 ( ± 4.88e-2) 0.798 ( ± 2.43e-2) 0.812 ( ± 5.76e-2) 6 0.953 ( ± 1.97e-2) 0.817 ( ± 4.40e-2) 0.738 ( ± 2.20e-2) 0.729 ( ± 6.31e-2) 7 0.951 ( ± 1.86e-2) 0.842 ( ± 3.90e-2) 0.704 ( ± 2.25e-2) 0.570 ( ± 7.55e-2) 8 0.949 ( ± 1.90e-2) 0.820 ( ± 4.15e-2) 0.670 ( ± 2.23e-2) 0.542 ( ± 7.42e-2) 9 0.950 ( ± 1.47e-2) 0.815 ( ± 4.01e-2) 0.654 ( ± 2.26e-2) 0.504 ( ± 7.12e-2) 10 0.927 ( ± 2.48e-2) 0.806 ( ± 3.90e-2) 0.641 ( ± 2.12e-2) 0.465 ( ± 7.69e-2) 11 0.928 ( ± 2.17e-2) 0.768 ( ± 4.48e-2) 0.627 ( ± 2.20e-2) 0.364 ( ± 6.41e-2) 12 0.923 ( ± 2.21e-2) 0.797 ( ± 4.55e-2) 0.617 ( ± 2.24e-2) 0.384 ( ± 6.93e-2) 13 0.901 ( ± 2.56e-2) 0.776 ( ± 4.74e-2) 0.603 ( ± 2.22e-2) 0.299 ( ± 6.03e-2) 14 0.909 ( ± 2.09e-2) 0.793 ( ± 4.00e-2) 0.592 ( ± 1.99e-2) 0.230 ( ± 4.80e-2) 15 0.891 ( ± 2.63e-2) 0.797 ( ± 4.00e-2) 0.583 ( ± 2.13e-2) 0.177 ( ± 3.53e-2) 16 0.863 ( ± 2.75e-2) 0.783 ( ± 3.81e-2) 0.584 ( ± 2.18e-2) 0.203 ( ± 3.78e-2) 17 0.845 ( ± 2.80e-2) 0.777 ( ± 4.02e-2) 0.560 ( ± 1.93e-2) 0.154 ( ± 2.56e-2) 18 0.823 ( ± 3.16e-2) 0.792 ( ± 4.13e-2) 0.541 ( ± 2.42e-2) 0.157 ( ± 2.81e-2) 19 0.795 ( ± 3.82e-2) 0.753 ( ± 4.78e-2) 0.548 ( ± 2.38e-2) 0.139 ( ± 2.44e-2) 20 0.789 ( ± 3.27e-2) 0.782 ( ± 3.82e-2) 0.541 ( ± 2.23e-2) 0.114 ( ± 1.56e-2) T able A24 : Precision Fluorophore num ber CRJMCMC F actorial HMM Monotonic MAP Sequential MAP 1 0.997 ( ± 1.35e-3) 0.968 ( ± 1.60e-2) 0.963 ( ± 2.37e-2) 2 0.994 ( ± 1.74e-3) 0.914 ( ± 5.02e-2) 0.934 ( ± 2.17e-2) 0.955 ( ± 2.87e-2) 3 0.993 ( ± 1.71e-3) 0.927 ( ± 4.07e-2) 0.912 ( ± 1.94e-2) 0.942 ( ± 4.26e-2) 4 0.992 ( ± 2.02e-3) 0.971 ( ± 1.74e-2) 0.850 ( ± 2.54e-2) 0.937 ( ± 3.91e-2) 5 0.990 ( ± 2.58e-3) 0.976 ( ± 1.23e-2) 0.790 ( ± 2.73e-2) 0.911 ( ± 4.90e-2) 6 0.991 ( ± 2.29e-3) 0.981 ( ± 8.49e-3) 0.715 ( ± 2.72e-2) 0.832 ( ± 6.35e-2) 7 0.985 ( ± 2.72e-3) 0.975 ( ± 9.79e-3) 0.683 ( ± 2.61e-2) 0.745 ( ± 8.59e-2) 8 0.980 ( ± 1.02e-2) 0.975 ( ± 1.02e-2) 0.634 ( ± 2.83e-2) 0.777 ( ± 8.14e-2) 9 0.975 ( ± 7.73e-3) 0.974 ( ± 7.68e-3) 0.617 ( ± 2.79e-2) 0.741 ( ± 8.64e-2) 10 0.979 ( ± 8.80e-3) 0.972 ( ± 8.37e-3) 0.615 ( ± 2.40e-2) 0.625 ( ± 9.91e-2) 11 0.976 ( ± 7.45e-3) 0.968 ( ± 1.11e-2) 0.597 ( ± 2.55e-2) 0.580 ( ± 9.96e-2) 12 0.969 ( ± 9.30e-3) 0.964 ( ± 1.11e-2) 0.588 ( ± 2.60e-2) 0.574 ( ± 0.10) 13 0.949 ( ± 2.26e-2) 0.969 ( ± 8.27e-3) 0.570 ( ± 2.66e-2) 0.565 ( ± 0.10) 14 0.960 ( ± 1.01e-2) 0.960 ( ± 1.19e-2) 0.565 ( ± 2.42e-2) 0.401 ( ± 0.10) 15 0.949 ( ± 1.81e-2) 0.952 ( ± 1.36e-2) 0.544 ( ± 2.68e-2) 0.260 ( ± 9.40e-2) 16 0.922 ( ± 2.75e-2) 0.951 ( ± 1.30e-2) 0.547 ( ± 2.71e-2) 0.395 ( ± 0.10) 17 0.907 ( ± 2.54e-2) 0.946 ( ± 1.64e-2) 0.531 ( ± 2.29e-2) 0.332 ( ± 9.93e-2) 18 0.883 ( ± 3.30e-2) 0.951 ( ± 1.53e-2) 0.503 ( ± 2.71e-2) 0.396 ( ± 0.10) 19 0.861 ( ± 3.82e-2) 0.949 ( ± 1.63e-2) 0.510 ( ± 2.71e-2) 0.264 ( ± 9.53e-2) 20 0.862 ( ± 3.78e-2) 0.944 ( ± 1.76e-2) 0.509 ( ± 2.57e-2) 0.157 ( ± 7.87e-2) 36 T able A25 : Sensitivity Fluorophore num ber CRJMCMC F actorial HMM Monotonic MAP Sequential MAP 1 0.994 ( ± 7.84e-3) 0.946 ( ± 3.35e-2) 0.981 ( ± 9.21e-3) 2 0.992 ( ± 4.14e-3) 0.652 ( ± 0.14) 0.920 ( ± 3.54e-2) 0.918 ( ± 4.84e-2) 3 0.984 ( ± 8.36e-3) 0.767 ( ± 7.86e-2) 0.936 ( ± 2.84e-2) 0.853 ( ± 6.58e-2) 4 0.979 ( ± 9.08e-3) 0.810 ( ± 5.41e-2) 0.937 ( ± 2.52e-2) 0.851 ( ± 6.49e-2) 5 0.969 ( ± 1.54e-2) 0.760 ( ± 5.93e-2) 0.959 ( ± 1.88e-2) 0.790 ( ± 7.55e-2) 6 0.953 ( ± 2.35e-2) 0.793 ( ± 5.17e-2) 0.937 ( ± 2.15e-2) 0.722 ( ± 8.30e-2) 7 0.956 ( ± 2.13e-2) 0.836 ( ± 4.48e-2) 0.954 ( ± 1.64e-2) 0.487 ( ± 9.61e-2) 8 0.959 ( ± 2.06e-2) 0.803 ( ± 4.94e-2) 0.951 ( ± 2.08e-2) 0.456 ( ± 9.40e-2) 9 0.961 ( ± 1.85e-2) 0.787 ( ± 4.93e-2) 0.937 ( ± 2.24e-2) 0.398 ( ± 9.13e-2) 10 0.936 ( ± 2.75e-2) 0.783 ( ± 4.78e-2) 0.934 ( ± 2.18e-2) 0.376 ( ± 9.37e-2) 11 0.936 ( ± 2.70e-2) 0.744 ( ± 5.38e-2) 0.946 ( ± 2.00e-2) 0.273 ( ± 8.32e-2) 12 0.938 ( ± 2.61e-2) 0.787 ( ± 5.33e-2) 0.937 ( ± 2.04e-2) 0.288 ( ± 8.50e-2) 13 0.934 ( ± 2.39e-2) 0.763 ( ± 5.53e-2) 0.940 ( ± 2.47e-2) 0.191 ( ± 7.20e-2) 14 0.931 ( ± 2.61e-2) 0.786 ( ± 4.89e-2) 0.936 ( ± 2.40e-2) 0.108 ( ± 5.52e-2) 15 0.922 ( ± 2.97e-2) 0.794 ( ± 4.79e-2) 0.939 ( ± 2.25e-2) 4.93e-2 ( ± 3.58e-2) 16 0.911 ( ± 2.98e-2) 0.779 ( ± 4.66e-2) 0.929 ( ± 2.07e-2) 6.91e-2 ( ± 3.72e-2) 17 0.911 ( ± 3.17e-2) 0.777 ( ± 4.94e-2) 0.937 ( ± 1.91e-2) 3.22e-2 ( ± 2.23e-2) 18 0.905 ( ± 3.17e-2) 0.797 ( ± 4.91e-2) 0.931 ( ± 2.11e-2) 2.89e-2 ( ± 2.10e-2) 19 0.899 ( ± 3.74e-2) 0.760 ( ± 5.47e-2) 0.951 ( ± 1.70e-2) 2.38e-2 ( ± 1.79e-2) 20 0.894 ( ± 3.19e-2) 0.792 ( ± 4.32e-2) 0.944 ( ± 2.10e-2) 6.21e-3 ( ± 5.12e-3) T able A26 : Sp ecificity Fluorophore num ber CRJMCMC F actorial HMM Monotonic MAP Sequential MAP 1 0.992 ( ± 3.54e-3) 0.905 ( ± 4.38e-2) 0.936 ( ± 2.52e-2) 2 0.980 ( ± 5.89e-3) 0.821 ( ± 0.15) 0.823 ( ± 5.10e-2) 0.926 ( ± 2.88e-2) 3 0.972 ( ± 7.38e-3) 0.899 ( ± 4.76e-2) 0.710 ( ± 5.68e-2) 0.961 ( ± 1.01e-2) 4 0.960 ( ± 1.16e-2) 0.929 ( ± 3.24e-2) 0.601 ( ± 5.36e-2) 0.916 ( ± 2.65e-2) 5 0.944 ( ± 1.42e-2) 0.933 ( ± 2.89e-2) 0.440 ( ± 4.79e-2) 0.905 ( ± 2.60e-2) 6 0.950 ( ± 1.25e-2) 0.936 ( ± 2.24e-2) 0.389 ( ± 3.64e-2) 0.847 ( ± 3.98e-2) 7 0.914 ( ± 1.76e-2) 0.899 ( ± 3.50e-2) 0.295 ( ± 3.50e-2) 0.904 ( ± 3.05e-2) 8 0.911 ( ± 2.03e-2) 0.905 ( ± 3.06e-2) 0.297 ( ± 3.44e-2) 0.913 ( ± 2.95e-2) 9 0.879 ( ± 2.78e-2) 0.908 ( ± 1.97e-2) 0.281 ( ± 3.54e-2) 0.908 ( ± 3.18e-2) 10 0.884 ( ± 2.33e-2) 0.881 ( ± 2.76e-2) 0.251 ( ± 3.09e-2) 0.913 ( ± 3.12e-2) 11 0.870 ( ± 2.86e-2) 0.884 ( ± 3.42e-2) 0.222 ( ± 2.88e-2) 0.911 ( ± 4.03e-2) 12 0.827 ( ± 3.10e-2) 0.860 ( ± 3.34e-2) 0.224 ( ± 2.89e-2) 0.913 ( ± 3.48e-2) 13 0.821 ( ± 4.16e-2) 0.864 ( ± 3.41e-2) 0.212 ( ± 2.73e-2) 0.959 ( ± 2.17e-2) 14 0.815 ( ± 3.59e-2) 0.844 ( ± 4.08e-2) 0.211 ( ± 2.97e-2) 0.982 ( ± 1.52e-2) 15 0.794 ( ± 4.03e-2) 0.813 ( ± 4.22e-2) 0.196 ( ± 2.45e-2) 0.996 ( ± 5.68e-3) 16 0.718 ( ± 5.01e-2) 0.817 ( ± 4.05e-2) 0.205 ( ± 3.05e-2) 0.998 ( ± 2.31e-3) 17 0.672 ( ± 5.34e-2) 0.795 ( ± 4.65e-2) 0.188 ( ± 2.55e-2) 0.998 ( ± 2.47e-3) 18 0.643 ( ± 5.42e-2) 0.810 ( ± 4.62e-2) 0.180 ( ± 3.04e-2) 0.981 ( ± 2.55e-2) 19 0.590 ( ± 5.52e-2) 0.807 ( ± 4.66e-2) 0.172 ( ± 2.70e-2) 0.998 ( ± 2.99e-3) 20 0.588 ( ± 5.93e-2) 0.771 ( ± 4.57e-2) 0.160 ( ± 2.15e-2) 1.000 ( ± 2.72e-13) 37 T able A27 : Cohen’s Kappa Fluorophore num ber CRJMCMC F actorial HMM Monotonic MAP Sequential MAP 1 0.987 ( ± 8.31e-3) 0.868 ( ± 4.70e-2) 0.922 ( ± 2.85e-2) 2 0.982 ( ± 5.37e-3) 0.523 ( ± 8.33e-2) 0.823 ( ± 4.32e-2) 0.870 ( ± 5.19e-2) 3 0.972 ( ± 9.41e-3) 0.710 ( ± 7.68e-2) 0.804 ( ± 3.82e-2) 0.826 ( ± 6.74e-2) 4 0.966 ( ± 1.06e-2) 0.762 ( ± 5.62e-2) 0.761 ( ± 3.25e-2) 0.820 ( ± 6.24e-2) 5 0.952 ( ± 1.73e-2) 0.728 ( ± 6.00e-2) 0.700 ( ± 3.39e-2) 0.746 ( ± 7.46e-2) 6 0.939 ( ± 2.46e-2) 0.769 ( ± 5.34e-2) 0.641 ( ± 2.85e-2) 0.643 ( ± 8.00e-2) 7 0.934 ( ± 2.39e-2) 0.798 ( ± 4.73e-2) 0.594 ( ± 2.83e-2) 0.452 ( ± 9.26e-2) 8 0.933 ( ± 2.39e-2) 0.775 ( ± 5.01e-2) 0.568 ( ± 2.64e-2) 0.424 ( ± 9.09e-2) 9 0.933 ( ± 1.94e-2) 0.767 ( ± 4.79e-2) 0.542 ( ± 2.50e-2) 0.379 ( ± 8.56e-2) 10 0.910 ( ± 2.98e-2) 0.762 ( ± 4.63e-2) 0.545 ( ± 2.42e-2) 0.350 ( ± 9.11e-2) 11 0.906 ( ± 2.70e-2) 0.725 ( ± 5.01e-2) 0.523 ( ± 2.32e-2) 0.231 ( ± 7.39e-2) 12 0.904 ( ± 2.62e-2) 0.756 ( ± 5.24e-2) 0.523 ( ± 2.32e-2) 0.257 ( ± 8.12e-2) 13 0.876 ( ± 3.18e-2) 0.734 ( ± 5.43e-2) 0.511 ( ± 2.21e-2) 0.166 ( ± 6.95e-2) 14 0.887 ( ± 2.51e-2) 0.752 ( ± 4.61e-2) 0.492 ( ± 2.09e-2) 8.95e-2 ( ± 5.49e-2) 15 0.865 ( ± 3.10e-2) 0.754 ( ± 4.72e-2) 0.485 ( ± 2.07e-2) 3.83e-2 ( ± 3.72e-2) 16 0.832 ( ± 3.27e-2) 0.740 ( ± 4.37e-2) 0.487 ( ± 2.11e-2) 6.17e-2 ( ± 3.96e-2) 17 0.814 ( ± 3.25e-2) 0.738 ( ± 4.63e-2) 0.472 ( ± 1.91e-2) 1.82e-2 ( ± 2.24e-2) 18 0.787 ( ± 3.60e-2) 0.754 ( ± 4.66e-2) 0.449 ( ± 2.21e-2) 2.17e-2 ( ± 2.51e-2) 19 0.761 ( ± 4.20e-2) 0.716 ( ± 5.24e-2) 0.467 ( ± 2.17e-2) 1.14e-2 ( ± 2.18e-2) 20 0.751 ( ± 3.62e-2) 0.744 ( ± 4.35e-2) 0.457 ( ± 2.04e-2) -1.08e-2 ( ± 1.28e-2) T able A28 : RMSE (Intensit y) Fluorophore num ber CRJMCMC F actorial HMM Monotonic MAP Sequential MAP 1 57.044 ( ± 12.54) 222.602 ( ± 56.54) 127.374 ( ± 26.99) 2 99.923 ( ± 16.04) 305.033 ( ± 47.16) 307.408 ( ± 48.72) 192.383 ( ± 29.05) 3 112.639 ( ± 16.83) 221.391 ( ± 47.88) 374.771 ( ± 53.43) 261.920 ( ± 30.43) 4 128.240 ( ± 19.97) 186.222 ( ± 37.43) 422.380 ( ± 57.08) 297.973 ( ± 38.54) 5 149.067 ( ± 20.77) 193.479 ( ± 34.73) 420.114 ( ± 50.59) 331.332 ( ± 45.61) 6 153.467 ( ± 24.05) 200.481 ( ± 37.51) 447.837 ( ± 52.94) 381.757 ( ± 44.66) 7 175.111 ( ± 22.66) 203.311 ( ± 34.35) 465.888 ( ± 58.72) 458.918 ( ± 52.91) 8 169.177 ( ± 23.35) 223.868 ( ± 38.05) 439.805 ( ± 50.40) 494.185 ( ± 65.07) 9 192.596 ( ± 23.71) 229.434 ( ± 35.47) 464.405 ( ± 55.38) 509.249 ( ± 59.65) 10 195.482 ( ± 27.55) 242.481 ( ± 39.12) 467.761 ( ± 56.95) 526.136 ( ± 63.61) 11 207.815 ( ± 27.15) 231.324 ( ± 37.43) 512.269 ( ± 61.16) 606.068 ( ± 63.47) 12 232.700 ( ± 29.97) 249.846 ( ± 40.92) 502.743 ( ± 64.45) 600.572 ( ± 64.74) 13 242.542 ( ± 31.58) 254.852 ( ± 40.13) 492.527 ( ± 60.13) 656.165 ( ± 76.83) 14 257.380 ( ± 36.37) 248.139 ( ± 43.12) 493.769 ( ± 61.18) 701.931 ( ± 80.84) 15 276.617 ( ± 40.93) 259.804 ( ± 37.11) 516.198 ( ± 67.52) 796.570 ( ± 104.10) 16 314.380 ( ± 43.74) 254.302 ( ± 37.96) 524.532 ( ± 67.83) 738.108 ( ± 83.44) 17 337.936 ( ± 49.07) 269.251 ( ± 38.91) 544.625 ( ± 66.15) 824.405 ( ± 102.14) 18 361.340 ( ± 52.65) 263.085 ( ± 39.12) 569.489 ( ± 77.34) 827.563 ( ± 94.91) 19 387.883 ( ± 60.15) 269.658 ( ± 41.72) 553.374 ( ± 67.17) 907.537 ( ± 116.88) 20 409.685 ( ± 60.01) 266.597 ( ± 38.54) 547.573 ( ± 66.96) 899.149 ( ± 106.08) 38 T able A29 : Absolute Error ( µ f ) Fluorophore num ber CRJMCMC F actorial HMM Monotonic MAP Sequential MAP 1 40.232 ( ± 7.46) 197.612 ( ± 22.96) 51.747 ( ± 20.05) 2 36.441 ( ± 7.22) 73.995 ( ± 2.92) 197.612 ( ± 22.96) 99.454 ( ± 30.50) 3 32.826 ( ± 6.55) 50.057 ( ± 10.80) 197.612 ( ± 22.96) 120.700 ( ± 46.88) 4 30.808 ( ± 6.51) 43.351 ( ± 8.26) 197.612 ( ± 22.96) 142.878 ( ± 53.58) 5 29.570 ( ± 6.14) 44.679 ( ± 8.02) 197.612 ( ± 22.96) 193.831 ( ± 72.61) 6 26.700 ( ± 5.83) 45.729 ( ± 8.04) 197.612 ( ± 22.96) 185.159 ( ± 47.69) 7 25.036 ( ± 5.41) 45.825 ( ± 7.98) 197.612 ( ± 22.96) 385.877 ( ± 107.00) 8 27.865 ( ± 8.16) 45.735 ( ± 8.02) 197.612 ( ± 22.96) 381.483 ( ± 92.77) 9 26.770 ( ± 6.11) 45.680 ( ± 8.00) 197.612 ( ± 22.96) 539.994 ( ± 134.95) 10 29.112 ( ± 7.90) 46.285 ( ± 8.12) 197.612 ( ± 22.96) 535.765 ( ± 132.40) 11 29.898 ( ± 7.55) 45.675 ( ± 8.23) 197.612 ( ± 22.96) 617.461 ( ± 123.29) 12 28.552 ( ± 9.06) 45.801 ( ± 8.06) 197.612 ( ± 22.96) 629.283 ( ± 139.42) 13 39.366 ( ± 12.79) 45.853 ( ± 8.18) 197.612 ( ± 22.96) 678.492 ( ± 140.59) 14 29.893 ( ± 7.84) 45.235 ( ± 8.31) 197.612 ( ± 22.96) 915.784 ( ± 155.05) 15 34.946 ( ± 8.52) 46.686 ( ± 8.28) 197.612 ( ± 22.96) 1195.297 ( ± 215.81) 16 41.560 ( ± 13.44) 46.097 ( ± 8.23) 197.612 ( ± 22.96) 1085.686 ( ± 197.31) 17 40.067 ( ± 10.07) 46.039 ( ± 8.11) 197.612 ( ± 22.96) 1297.846 ( ± 234.19) 18 48.533 ( ± 13.56) 46.266 ( ± 8.39) 197.612 ( ± 22.96) 1218.119 ( ± 185.16) 19 58.329 ( ± 16.21) 46.074 ( ± 8.43) 197.612 ( ± 22.96) 1520.609 ( ± 289.07) 20 61.277 ( ± 15.85) 44.949 ( ± 8.42) 197.612 ( ± 22.96) 1602.078 ( ± 242.64) T able A30 : Absolute Error ( µ b ) Fluorophore num ber CRJMCMC F actorial HMM Monotonic MAP Sequential MAP 1 1.846 ( ± 0.26) 125.419 ( ± 15.70) 29.109 ( ± 8.82) 2 1.899 ( ± 0.28) 129.775 ( ± 75.96) 125.419 ( ± 15.70) 61.939 ( ± 21.08) 3 2.087 ( ± 0.34) 134.443 ( ± 39.92) 125.419 ( ± 15.70) 77.166 ( ± 26.76) 4 2.071 ( ± 0.33) 94.801 ( ± 27.72) 125.419 ( ± 15.70) 80.290 ( ± 27.11) 5 2.091 ( ± 0.35) 81.820 ( ± 22.63) 125.419 ( ± 15.70) 94.617 ( ± 32.43) 6 2.064 ( ± 0.34) 65.613 ( ± 17.16) 125.419 ( ± 15.70) 124.668 ( ± 35.58) 7 2.164 ( ± 0.36) 72.524 ( ± 20.97) 125.419 ( ± 15.70) 215.338 ( ± 48.75) 8 2.223 ( ± 0.41) 78.535 ( ± 21.67) 125.419 ( ± 15.70) 230.260 ( ± 50.23) 9 2.006 ( ± 0.34) 62.114 ( ± 17.92) 125.419 ( ± 15.70) 280.960 ( ± 68.49) 10 2.116 ( ± 0.38) 66.776 ( ± 20.52) 125.419 ( ± 15.70) 322.581 ( ± 70.94) 11 2.195 ( ± 0.37) 60.488 ( ± 14.95) 125.419 ( ± 15.70) 390.096 ( ± 88.45) 12 2.056 ( ± 0.37) 66.780 ( ± 20.02) 125.419 ( ± 15.70) 379.813 ( ± 79.40) 13 2.572 ( ± 0.61) 79.043 ( ± 25.68) 125.419 ( ± 15.70) 424.542 ( ± 75.98) 14 2.073 ( ± 0.40) 62.167 ( ± 19.43) 125.419 ( ± 15.70) 632.409 ( ± 94.65) 15 2.406 ( ± 0.46) 71.787 ( ± 17.27) 125.419 ( ± 15.70) 666.226 ( ± 108.09) 16 2.191 ( ± 0.43) 64.716 ( ± 19.29) 125.419 ( ± 15.70) 631.265 ( ± 110.00) 17 2.063 ( ± 0.35) 63.535 ( ± 19.51) 125.419 ( ± 15.70) 727.811 ( ± 106.23) 18 2.117 ( ± 0.38) 55.194 ( ± 13.01) 125.419 ( ± 15.70) 676.649 ( ± 102.69) 19 2.119 ( ± 0.38) 70.920 ( ± 19.34) 125.419 ( ± 15.70) 741.827 ( ± 123.02) 20 2.184 ( ± 0.42) 57.206 ( ± 16.39) 125.419 ( ± 15.70) 931.464 ( ± 138.03) 39 T able A31 : Absolute Error ( σ 2 f ) Fluorophore num ber CRJMCMC Monotonic MAP Sequen tial MAP 1 141.128 ( ± 23.52) 1.00e+5 ( ± 2.10e+4) 987.109 ( ± 121.73) 2 151.465 ( ± 22.64) 1.00e+5 ( ± 2.10e+4) 956.398 ( ± 121.64) 3 160.725 ( ± 23.08) 1.00e+5 ( ± 2.10e+4) 930.863 ( ± 121.14) 4 167.165 ( ± 21.96) 1.00e+5 ( ± 2.10e+4) 914.852 ( ± 117.93) 5 208.067 ( ± 27.06) 1.00e+5 ( ± 2.10e+4) 905.167 ( ± 122.89) 6 191.950 ( ± 24.79) 1.00e+5 ( ± 2.10e+4) 875.565 ( ± 116.47) 7 238.445 ( ± 33.77) 1.00e+5 ( ± 2.10e+4) 798.253 ( ± 112.32) 8 243.377 ( ± 42.20) 1.00e+5 ( ± 2.10e+4) 832.505 ( ± 120.35) 9 320.488 ( ± 73.30) 1.00e+5 ( ± 2.10e+4) 804.926 ( ± 128.46) 10 269.639 ( ± 39.69) 1.00e+5 ( ± 2.10e+4) 742.313 ( ± 111.83) 11 303.645 ( ± 51.97) 1.00e+5 ( ± 2.10e+4) 689.541 ( ± 113.27) 12 456.609 ( ± 102.02) 1.00e+5 ( ± 2.10e+4) 714.939 ( ± 119.83) 13 337.236 ( ± 59.17) 1.00e+5 ( ± 2.10e+4) 709.604 ( ± 113.83) 14 459.056 ( ± 87.67) 1.00e+5 ( ± 2.10e+4) 603.231 ( ± 110.90) 15 523.255 ( ± 121.45) 1.00e+5 ( ± 2.10e+4) 585.507 ( ± 98.89) 16 644.336 ( ± 125.88) 1.00e+5 ( ± 2.10e+4) 527.525 ( ± 91.32) 17 902.432 ( ± 298.50) 1.00e+5 ( ± 2.10e+4) 567.845 ( ± 103.94) 18 1388.145 ( ± 545.85) 1.00e+5 ( ± 2.10e+4) 517.590 ( ± 90.42) 19 1630.814 ( ± 671.62) 1.00e+5 ( ± 2.10e+4) 510.637 ( ± 93.93) 20 1530.795 ( ± 570.91) 1.00e+5 ( ± 2.10e+4) 452.523 ( ± 86.73) T able A32 : Absolute Error ( σ 2 b ) Fluorophore num ber CRJMCMC Monotonic MAP Sequential MAP 1 5111.172 ( ± 1304.41) 1.05e+5 ( ± 2.11e+4) 4.30e+4 ( ± 1.32e+4) 2 5101.044 ( ± 1300.60) 1.05e+5 ( ± 2.11e+4) 4.30e+4 ( ± 1.32e+4) 3 5049.544 ( ± 1301.37) 1.05e+5 ( ± 2.11e+4) 4.30e+4 ( ± 1.32e+4) 4 5158.560 ( ± 1292.64) 1.05e+5 ( ± 2.11e+4) 4.30e+4 ( ± 1.32e+4) 5 5069.890 ( ± 1300.40) 1.05e+5 ( ± 2.11e+4) 4.30e+4 ( ± 1.32e+4) 6 5162.050 ( ± 1321.38) 1.05e+5 ( ± 2.11e+4) 4.34e+4 ( ± 1.33e+4) 7 5074.580 ( ± 1300.47) 1.05e+5 ( ± 2.11e+4) 4.29e+4 ( ± 1.32e+4) 8 5164.130 ( ± 1302.15) 1.05e+5 ( ± 2.11e+4) 4.29e+4 ( ± 1.32e+4) 9 5311.145 ( ± 1308.95) 1.05e+5 ( ± 2.11e+4) 4.28e+4 ( ± 1.32e+4) 10 5095.458 ( ± 1341.65) 1.05e+5 ( ± 2.11e+4) 4.40e+4 ( ± 1.35e+4) 11 5860.811 ( ± 1616.50) 1.05e+5 ( ± 2.11e+4) 4.42e+4 ( ± 1.35e+4) 12 4974.284 ( ± 1311.54) 1.05e+5 ( ± 2.11e+4) 4.35e+4 ( ± 1.34e+4) 13 5173.438 ( ± 1343.05) 1.05e+5 ( ± 2.11e+4) 4.42e+4 ( ± 1.35e+4) 14 5295.717 ( ± 1423.54) 1.05e+5 ( ± 2.11e+4) 4.53e+4 ( ± 1.39e+4) 15 5233.999 ( ± 1296.26) 1.05e+5 ( ± 2.11e+4) 4.55e+4 ( ± 1.39e+4) 16 4863.771 ( ± 1295.20) 1.05e+5 ( ± 2.11e+4) 4.42e+4 ( ± 1.37e+4) 17 5175.174 ( ± 1298.02) 1.05e+5 ( ± 2.11e+4) 4.37e+4 ( ± 1.36e+4) 18 4957.937 ( ± 1326.99) 1.05e+5 ( ± 2.11e+4) 4.55e+4 ( ± 1.41e+4) 19 4576.203 ( ± 1226.41) 1.05e+5 ( ± 2.11e+4) 4.56e+4 ( ± 1.41e+4) 20 5193.248 ( ± 1436.95) 1.05e+5 ( ± 2.11e+4) 4.57e+4 ( ± 1.41e+4) 40 S11.3 V arying Single Fluorophore Intensit y T able A33 : Accuracy Mean Fluorophore Intensit y ( µ f ) CRJMCMC F actorial HMM Monotonic MAP Sequential MAP 2500 0.989 ( ± 7.58e-3) 0.923 ( ± 4.98e-2) 0.912 ( ± 1.91e-2) 0.960 ( ± 1.94e-2) 3000 0.992 ( ± 1.82e-3) 0.915 ( ± 5.46e-2) 0.903 ( ± 2.09e-2) 0.962 ( ± 1.98e-2) 3500 0.995 ( ± 1.18e-3) 0.910 ( ± 4.95e-2) 0.905 ( ± 2.09e-2) 0.976 ( ± 1.11e-2) 4000 0.993 ( ± 1.90e-3) 0.863 ( ± 6.68e-2) 0.927 ( ± 1.77e-2) 0.964 ( ± 2.06e-2) 4500 0.994 ( ± 1.30e-3) 0.965 ( ± 2.97e-2) 0.892 ( ± 2.30e-2) 0.967 ( ± 2.11e-2) 5000 0.992 ( ± 3.52e-3) 0.974 ( ± 3.79e-2) 0.891 ( ± 1.86e-2) 0.976 ( ± 1.02e-2) 6000 0.992 ( ± 3.72e-3) 0.937 ( ± 4.57e-2) 0.892 ( ± 2.25e-2) 0.945 ( ± 2.73e-2) 7000 0.994 ( ± 1.93e-3) 0.912 ( ± 5.49e-2) 0.909 ( ± 1.90e-2) 0.952 ( ± 2.74e-2) 8000 0.994 ( ± 1.81e-3) 0.834 ( ± 6.72e-2) 0.915 ( ± 1.80e-2) 0.961 ( ± 2.14e-2) 9000 0.993 ( ± 3.43e-3) 0.978 ( ± 3.57e-2) 0.901 ( ± 1.89e-2) 0.961 ( ± 2.12e-2) 10000 0.992 ( ± 2.70e-3) 0.967 ( ± 3.95e-2) 0.904 ( ± 2.15e-2) 0.968 ( ± 1.60e-2) T able A34 : Precision Mean Fluorophore Intensit y ( µ f ) CRJMCMC F actorial HMM Monotonic MAP Sequential MAP 2500 0.992 ( ± 4.76e-3) 0.995 ( ± 4.25e-3) 0.920 ( ± 2.01e-2) 0.962 ( ± 2.80e-2) 3000 0.993 ( ± 2.11e-3) 0.991 ( ± 6.22e-3) 0.912 ( ± 2.19e-2) 0.970 ( ± 2.28e-2) 3500 0.996 ( ± 1.28e-3) 0.986 ( ± 1.14e-2) 0.915 ( ± 2.14e-2) 0.975 ( ± 1.74e-2) 4000 0.993 ( ± 3.08e-3) 0.993 ( ± 2.96e-3) 0.939 ( ± 1.66e-2) 0.971 ( ± 2.22e-2) 4500 0.994 ( ± 1.85e-3) 0.996 ( ± 2.57e-3) 0.888 ( ± 2.57e-2) 0.966 ( ± 2.65e-2) 5000 0.993 ( ± 3.72e-3) 0.992 ( ± 6.76e-3) 0.922 ( ± 1.72e-2) 0.984 ( ± 7.41e-3) 6000 0.992 ( ± 5.15e-3) 0.992 ( ± 9.32e-3) 0.920 ( ± 2.10e-2) 0.962 ( ± 2.84e-2) 7000 0.995 ( ± 1.94e-3) 0.996 ( ± 2.03e-3) 0.926 ( ± 1.91e-2) 0.984 ( ± 1.24e-2) 8000 0.994 ( ± 2.42e-3) 0.999 ( ± 9.96e-4) 0.936 ( ± 1.73e-2) 0.969 ( ± 2.40e-2) 9000 0.993 ( ± 4.56e-3) 0.997 ( ± 1.19e-3) 0.922 ( ± 1.86e-2) 0.975 ( ± 2.18e-2) 10000 0.991 ( ± 6.05e-3) 0.998 ( ± 1.42e-3) 0.915 ( ± 2.33e-2) 0.967 ( ± 2.54e-2) T able A35 : Sensitivity Mean Fluorophore Intensit y ( µ f ) CRJMCMC F actorial HMM Monotonic MAP Sequential MAP 2500 0.993 ( ± 7.43e-3) 0.897 ( ± 6.90e-2) 0.949 ( ± 2.25e-2) 0.951 ( ± 3.26e-2) 3000 0.997 ( ± 1.38e-3) 0.896 ( ± 7.27e-2) 0.960 ( ± 1.90e-2) 0.972 ( ± 1.95e-2) 3500 0.997 ( ± 1.15e-3) 0.889 ( ± 6.47e-2) 0.950 ( ± 2.46e-2) 0.981 ( ± 1.63e-2) 4000 0.997 ( ± 1.14e-3) 0.844 ( ± 7.81e-2) 0.948 ( ± 2.50e-2) 0.973 ( ± 2.26e-2) 4500 0.998 ( ± 9.50e-4) 0.957 ( ± 4.05e-2) 0.972 ( ± 1.36e-2) 0.974 ( ± 2.10e-2) 5000 0.996 ( ± 2.43e-3) 0.969 ( ± 4.73e-2) 0.915 ( ± 2.96e-2) 0.979 ( ± 1.66e-2) 6000 0.996 ( ± 2.06e-3) 0.931 ( ± 5.48e-2) 0.917 ( ± 2.94e-2) 0.935 ( ± 3.78e-2) 7000 0.998 ( ± 1.10e-3) 0.896 ( ± 6.66e-2) 0.952 ( ± 2.21e-2) 0.957 ( ± 2.94e-2) 8000 0.997 ( ± 1.80e-3) 0.764 ( ± 9.87e-2) 0.939 ( ± 2.39e-2) 0.957 ( ± 3.12e-2) 9000 0.997 ( ± 1.96e-3) 0.976 ( ± 4.45e-2) 0.943 ( ± 2.03e-2) 0.966 ( ± 2.37e-2) 10000 0.997 ( ± 1.35e-3) 0.959 ( ± 5.12e-2) 0.947 ( ± 1.99e-2) 0.966 ( ± 2.59e-2) 41 T able A36 : Sp ecificity Mean Fluorophore Intensit y ( µ f ) CRJMCMC F actorial HMM Monotonic MAP Sequential MAP 2500 0.975 ( ± 1.18e-2) 0.982 ( ± 8.07e-3) 0.782 ( ± 4.70e-2) 0.961 ( ± 1.26e-2) 3000 0.974 ( ± 7.90e-3) 0.969 ( ± 1.73e-2) 0.749 ( ± 5.45e-2) 0.943 ( ± 2.10e-2) 3500 0.979 ( ± 7.00e-3) 0.960 ( ± 1.89e-2) 0.768 ( ± 4.91e-2) 0.950 ( ± 1.84e-2) 4000 0.975 ( ± 7.12e-3) 0.974 ( ± 1.09e-2) 0.824 ( ± 4.32e-2) 0.953 ( ± 1.95e-2) 4500 0.976 ( ± 6.41e-3) 0.980 ( ± 1.33e-2) 0.713 ( ± 5.48e-2) 0.951 ( ± 2.13e-2) 5000 0.971 ( ± 1.14e-2) 0.980 ( ± 1.06e-2) 0.763 ( ± 4.84e-2) 0.955 ( ± 1.66e-2) 6000 0.977 ( ± 7.46e-3) 0.983 ( ± 1.15e-2) 0.794 ( ± 4.77e-2) 0.950 ( ± 2.11e-2) 7000 0.973 ( ± 9.36e-3) 0.980 ( ± 8.84e-3) 0.772 ( ± 5.30e-2) 0.960 ( ± 1.65e-2) 8000 0.979 ( ± 8.14e-3) 0.995 ( ± 3.50e-3) 0.803 ( ± 4.52e-2) 0.960 ( ± 1.61e-2) 9000 0.974 ( ± 9.95e-3) 0.988 ( ± 5.80e-3) 0.760 ( ± 5.12e-2) 0.961 ( ± 1.71e-2) 10000 0.977 ( ± 6.66e-3) 0.991 ( ± 5.35e-3) 0.796 ( ± 5.04e-2) 0.968 ( ± 1.26e-2) T able A37 : Cohen’s Kappa Mean Fluorophore Intensit y ( µ f ) CRJMCMC F actorial HMM Monotonic MAP Sequential MAP 2500 0.982 ( ± 9.96e-3) 0.888 ( ± 6.61e-2) 0.829 ( ± 3.71e-2) 0.936 ( ± 2.66e-2) 3000 0.986 ( ± 3.31e-3) 0.886 ( ± 7.11e-2) 0.810 ( ± 4.09e-2) 0.943 ( ± 2.45e-2) 3500 0.991 ( ± 2.17e-3) 0.876 ( ± 6.25e-2) 0.827 ( ± 3.69e-2) 0.958 ( ± 1.42e-2) 4000 0.988 ( ± 3.19e-3) 0.820 ( ± 8.35e-2) 0.861 ( ± 3.43e-2) 0.946 ( ± 2.55e-2) 4500 0.989 ( ± 2.70e-3) 0.950 ( ± 4.06e-2) 0.811 ( ± 3.87e-2) 0.952 ( ± 2.30e-2) 5000 0.986 ( ± 5.11e-3) 0.965 ( ± 4.63e-2) 0.793 ( ± 3.59e-2) 0.957 ( ± 1.52e-2) 6000 0.986 ( ± 5.61e-3) 0.915 ( ± 5.72e-2) 0.804 ( ± 4.01e-2) 0.920 ( ± 3.46e-2) 7000 0.989 ( ± 3.01e-3) 0.883 ( ± 6.85e-2) 0.818 ( ± 4.05e-2) 0.932 ( ± 3.39e-2) 8000 0.988 ( ± 3.79e-3) 0.765 ( ± 9.03e-2) 0.834 ( ± 3.60e-2) 0.944 ( ± 2.65e-2) 9000 0.987 ( ± 5.12e-3) 0.973 ( ± 4.35e-2) 0.807 ( ± 3.83e-2) 0.943 ( ± 2.75e-2) 10000 0.986 ( ± 4.92e-3) 0.956 ( ± 5.06e-2) 0.834 ( ± 3.56e-2) 0.951 ( ± 2.11e-2) T able A38 : RMSE (Intensit y) Mean Fluorophore Intensit y ( µ f ) CRJMCMC F actorial HMM Monotonic MAP Sequential MAP 2500 200.097 ( ± 28.55) 415.751 ( ± 98.97) 628.370 ( ± 70.90) 400.187 ( ± 49.98) 3000 205.919 ( ± 28.66) 434.567 ( ± 91.98) 800.514 ( ± 93.67) 476.566 ( ± 52.92) 3500 185.768 ( ± 28.74) 419.673 ( ± 98.16) 912.644 ( ± 102.98) 507.382 ( ± 56.51) 4000 246.755 ( ± 35.11) 491.216 ( ± 81.19) 918.931 ( ± 108.06) 598.142 ( ± 67.34) 4500 265.010 ( ± 38.99) 383.874 ( ± 86.54) 1173.019 ( ± 131.83) 644.343 ( ± 75.29) 5000 299.303 ( ± 46.54) 446.804 ( ± 75.13) 1400.842 ( ± 149.65) 672.707 ( ± 69.30) 6000 366.830 ( ± 59.34) 573.633 ( ± 121.11) 1660.218 ( ± 182.36) 1006.087 ( ± 127.37) 7000 392.509 ( ± 64.61) 544.614 ( ± 116.54) 1749.898 ( ± 214.46) 1046.020 ( ± 160.93) 8000 432.652 ( ± 74.58) 418.990 ( ± 120.95) 1946.677 ( ± 232.84) 1114.101 ( ± 144.98) 9000 506.888 ( ± 88.53) 656.327 ( ± 108.99) 2448.902 ( ± 258.99) 1270.088 ( ± 202.81) 10000 670.213 ( ± 86.46) 797.136 ( ± 147.38) 2516.834 ( ± 307.01) 1370.989 ( ± 189.97) T able A39 : Absolute Error ( µ f ) Mean Fluorophore Intensit y ( µ f ) CRJMCMC F actorial HMM Monotonic MAP Sequen tial MAP 2500 92.456 ( ± 17.25) 167.598 ( ± 40.47) 307.156 ( ± 11.67) 183.827 ( ± 81.47) 3000 40.967 ( ± 9.14) 113.990 ( ± 47.73) 337.979 ( ± 17.37) 151.537 ( ± 54.03) 3500 27.236 ( ± 4.19) 46.752 ( ± 14.22) 464.887 ( ± 12.57) 131.957 ( ± 48.75) 4000 67.487 ( ± 10.30) 147.427 ( ± 32.33) 453.002 ( ± 12.39) 219.697 ( ± 98.98) 4500 39.567 ( ± 5.08) 66.285 ( ± 7.94) 683.396 ( ± 39.74) 194.478 ( ± 90.63) 5000 65.178 ( ± 10.34) 119.621 ( ± 15.96) 530.292 ( ± 24.68) 212.838 ( ± 85.57) 6000 77.110 ( ± 16.80) 154.828 ( ± 29.76) 730.679 ( ± 12.64) 480.586 ( ± 215.75) 7000 49.635 ( ± 6.67) 92.558 ( ± 25.16) 694.530 ( ± 8.09) 436.868 ( ± 230.12) 8000 44.089 ( ± 11.16) 70.469 ( ± 17.02) 772.964 ( ± 21.51) 456.540 ( ± 231.17) 9000 78.536 ( ± 19.31) 125.722 ( ± 45.94) 1230.972 ( ± 43.25) 507.301 ( ± 252.92) 10000 190.571 ( ± 45.38) 372.793 ( ± 78.44) 1176.837 ( ± 87.12) 532.644 ( ± 280.81) 42 T able A40 : Absolute Error ( µ b ) Mean Fluorophore Intensit y ( µ f ) CRJMCMC F actorial HMM Monotonic MAP Sequential MAP 2500 10.226 ( ± 1.72) 138.274 ( ± 41.39) 224.912 ( ± 11.11) 53.851 ( ± 13.06) 3000 9.250 ( ± 1.07) 132.551 ( ± 50.73) 272.931 ( ± 14.64) 64.746 ( ± 16.42) 3500 14.464 ( ± 2.17) 220.525 ( ± 87.68) 387.326 ( ± 10.30) 69.441 ( ± 23.07) 4000 21.301 ( ± 3.97) 205.028 ( ± 67.27) 355.590 ( ± 17.73) 77.228 ( ± 16.64) 4500 9.769 ( ± 1.40) 198.949 ( ± 85.79) 518.807 ( ± 30.25) 77.627 ( ± 18.04) 5000 22.211 ( ± 3.37) 210.969 ( ± 80.08) 453.217 ( ± 24.65) 93.542 ( ± 31.37) 6000 5.313 ( ± 0.79) 260.387 ( ± 107.52) 627.836 ( ± 8.89) 122.637 ( ± 32.62) 7000 32.324 ( ± 4.34) 279.608 ( ± 114.08) 615.900 ( ± 20.53) 88.285 ( ± 22.31) 8000 17.176 ( ± 4.02) 282.480 ( ± 109.01) 648.068 ( ± 21.30) 113.641 ( ± 31.29) 9000 11.376 ( ± 2.13) 266.212 ( ± 104.27) 1055.900 ( ± 44.34) 98.115 ( ± 17.79) 10000 11.042 ( ± 2.57) 197.809 ( ± 75.89) 1024.176 ( ± 87.26) 119.798 ( ± 26.15) T able A41 : Absolute Error ( σ 2 f ) Mean Fluorophore Intensit y ( µ f ) CRJMCMC Monotonic MAP Sequen tial MAP 2500 326.502 ( ± 62.39) 2.21e+5 ( ± 3.39e+4) 2167.009 ( ± 40.60) 3000 498.846 ( ± 53.44) 2.55e+5 ( ± 3.66e+4) 2577.513 ( ± 54.49) 3500 228.689 ( ± 24.66) 3.05e+5 ( ± 3.23e+4) 3080.264 ( ± 50.55) 4000 306.179 ( ± 33.18) 4.17e+5 ( ± 6.50e+4) 3550.075 ( ± 57.28) 4500 196.153 ( ± 21.60) 6.39e+5 ( ± 4.12e+4) 4021.892 ( ± 68.64) 5000 287.478 ( ± 38.52) 4.62e+5 ( ± 3.59e+4) 4471.697 ( ± 68.46) 6000 247.734 ( ± 29.69) 5.77e+5 ( ± 5.03e+4) 5345.374 ( ± 81.84) 7000 359.877 ( ± 43.28) 5.39e+5 ( ± 8.43e+4) 6347.272 ( ± 85.64) 8000 538.248 ( ± 36.75) 9.25e+5 ( ± 1.07e+5) 7232.221 ( ± 108.39) 9000 346.772 ( ± 12.67) 1.54e+6 ( ± 1.33e+5) 8128.666 ( ± 126.56) 10000 589.268 ( ± 142.68) 1.44e+6 ( ± 2.10e+5) 9119.923 ( ± 121.92) T able A42 : Absolute Error ( σ 2 b ) Mean Fluorophore Intensit y ( µ f ) CRJMCMC Monotonic MAP Sequential MAP 2500 5.35e+4 ( ± 1.13e+4) 3.04e+5 ( ± 6.08e+3) 9.22e+4 ( ± 2.00e+4) 3000 1.83e+4 ( ± 1.51e+3) 4.18e+5 ( ± 1.61e+4) 1.11e+5 ( ± 2.41e+4) 3500 1.61e+4 ( ± 1.93e+3) 6.37e+5 ( ± 1.92e+4) 1.29e+5 ( ± 2.81e+4) 4000 2.27e+4 ( ± 2.97e+3) 7.58e+5 ( ± 1.49e+4) 1.48e+5 ( ± 3.21e+4) 4500 4.01e+4 ( ± 6.85e+3) 1.12e+6 ( ± 4.45e+4) 1.66e+5 ( ± 3.61e+4) 5000 7.26e+4 ( ± 1.32e+4) 1.10e+6 ( ± 5.26e+4) 1.85e+5 ( ± 4.01e+4) 6000 2.46e+4 ( ± 2.59e+3) 1.91e+6 ( ± 3.55e+4) 2.21e+5 ( ± 4.81e+4) 7000 1.52e+5 ( ± 2.53e+4) 2.20e+6 ( ± 5.10e+4) 2.58e+5 ( ± 5.62e+4) 8000 1.53e+5 ( ± 1.87e+4) 2.76e+6 ( ± 9.80e+4) 2.95e+5 ( ± 6.42e+4) 9000 2.10e+5 ( ± 2.93e+4) 4.82e+6 ( ± 1.20e+5) 3.32e+5 ( ± 7.22e+4) 10000 1.19e+5 ( ± 7.12e+3) 4.78e+6 ( ± 2.71e+5) 3.53e+5 ( ± 8.02e+4) 43 S11.4 V arying Dark State T ransition Probabilit y T able A43 : Accuracy Dark State Probability CRJMCMC F actorial HMM Monotonic MAP Sequential MAP 0.0002 0.983 ( ± 4.58e-3) 0.808 ( ± 3.50e-2) 0.895 ( ± 1.17e-2) 0.913 ( ± 1.81e-2) 0.0004 0.983 ( ± 3.92e-3) 0.850 ( ± 2.87e-2) 0.842 ( ± 1.45e-2) 0.883 ( ± 2.12e-2) 0.0006 0.981 ( ± 3.66e-3) 0.851 ( ± 2.79e-2) 0.787 ( ± 1.42e-2) 0.880 ( ± 2.08e-2) 0.0008 0.978 ( ± 4.36e-3) 0.854 ( ± 2.94e-2) 0.772 ( ± 1.42e-2) 0.877 ( ± 2.03e-2) 0.001 0.970 ( ± 5.26e-3) 0.873 ( ± 2.20e-2) 0.748 ( ± 1.46e-2) 0.862 ( ± 2.05e-2) 0.0012 0.960 ( ± 6.49e-3) 0.867 ( ± 2.58e-2) 0.732 ( ± 1.50e-2) 0.873 ( ± 1.92e-2) 0.0014 0.953 ( ± 7.06e-3) 0.849 ( ± 2.71e-2) 0.726 ( ± 1.39e-2) 0.865 ( ± 1.88e-2) 0.0016 0.954 ( ± 6.26e-3) 0.848 ( ± 2.90e-2) 0.726 ( ± 1.46e-2) 0.872 ( ± 1.80e-2) 0.0018 0.944 ( ± 7.04e-3) 0.885 ( ± 2.16e-2) 0.702 ( ± 1.34e-2) 0.851 ( ± 1.88e-2) 0.002 0.944 ( ± 6.83e-3) 0.891 ( ± 2.05e-2) 0.721 ( ± 1.28e-2) 0.877 ( ± 1.54e-2) T able A44 : Precision Dark State Probability CRJMCMC F actorial HMM Monotonic MAP Sequential MA P 0.0002 0.992 ( ± 3.36e-3) 0.959 ( ± 1.65e-2) 0.906 ( ± 1.29e-2) 0.934 ( ± 1.98e-2) 0.0004 0.989 ( ± 3.90e-3) 0.963 ( ± 1.12e-2) 0.855 ( ± 1.59e-2) 0.920 ( ± 2.24e-2) 0.0006 0.987 ( ± 3.48e-3) 0.960 ( ± 1.07e-2) 0.806 ( ± 1.74e-2) 0.907 ( ± 2.48e-2) 0.0008 0.981 ( ± 5.09e-3) 0.941 ( ± 1.87e-2) 0.789 ( ± 1.83e-2) 0.899 ( ± 2.61e-2) 0.001 0.970 ( ± 6.88e-3) 0.947 ( ± 1.86e-2) 0.759 ( ± 1.89e-2) 0.892 ( ± 2.57e-2) 0.0012 0.957 ( ± 8.55e-3) 0.941 ( ± 1.42e-2) 0.728 ( ± 2.04e-2) 0.907 ( ± 2.33e-2) 0.0014 0.944 ( ± 9.72e-3) 0.934 ( ± 1.97e-2) 0.716 ( ± 1.97e-2) 0.860 ( ± 2.97e-2) 0.0016 0.946 ( ± 8.38e-3) 0.925 ( ± 2.10e-2) 0.712 ( ± 2.06e-2) 0.872 ( ± 2.71e-2) 0.0018 0.932 ( ± 1.01e-2) 0.919 ( ± 2.33e-2) 0.683 ( ± 2.08e-2) 0.846 ( ± 3.16e-2) 0.002 0.924 ( ± 1.05e-2) 0.928 ( ± 1.80e-2) 0.691 ( ± 2.07e-2) 0.858 ( ± 2.93e-2) T able A45 : Sensitivity Dark State Probability CRJMCMC F actorial HMM Monotonic MAP Sequential MAP 0.0002 0.983 ( ± 5.11e-3) 0.775 ( ± 4.48e-2) 0.944 ( ± 1.31e-2) 0.906 ( ± 2.56e-2) 0.0004 0.983 ( ± 4.48e-3) 0.815 ( ± 4.13e-2) 0.895 ( ± 1.85e-2) 0.857 ( ± 3.17e-2) 0.0006 0.982 ( ± 4.00e-3) 0.797 ( ± 4.49e-2) 0.843 ( ± 2.18e-2) 0.836 ( ± 3.39e-2) 0.0008 0.981 ( ± 3.71e-3) 0.801 ( ± 4.51e-2) 0.797 ( ± 2.39e-2) 0.809 ( ± 3.65e-2) 0.001 0.974 ( ± 4.61e-3) 0.817 ( ± 3.90e-2) 0.765 ( ± 2.48e-2) 0.794 ( ± 3.68e-2) 0.0012 0.965 ( ± 5.79e-3) 0.800 ( ± 4.50e-2) 0.732 ( ± 2.59e-2) 0.784 ( ± 3.71e-2) 0.0014 0.956 ( ± 6.97e-3) 0.748 ( ± 5.36e-2) 0.708 ( ± 2.71e-2) 0.761 ( ± 3.84e-2) 0.0016 0.954 ( ± 6.65e-3) 0.756 ( ± 5.27e-2) 0.676 ( ± 2.77e-2) 0.767 ( ± 3.76e-2) 0.0018 0.941 ( ± 7.65e-3) 0.809 ( ± 4.65e-2) 0.626 ( ± 2.77e-2) 0.705 ( ± 4.12e-2) 0.002 0.927 ( ± 9.93e-3) 0.786 ( ± 4.87e-2) 0.591 ( ± 2.84e-2) 0.735 ( ± 3.85e-2) 44 T able A46 : Sp ecificity Dark State Probability CRJMCMC F actorial HMM Monotonic MAP Sequential MAP 0.0002 0.978 ( ± 4.32e-3) 0.919 ( ± 2.39e-2) 0.750 ( ± 2.91e-2) 0.922 ( ± 1.41e-2) 0.0004 0.979 ( ± 4.64e-3) 0.931 ( ± 1.83e-2) 0.689 ( ± 3.17e-2) 0.929 ( ± 1.32e-2) 0.0006 0.977 ( ± 4.40e-3) 0.929 ( ± 2.10e-2) 0.642 ( ± 3.24e-2) 0.940 ( ± 1.07e-2) 0.0008 0.970 ( ± 7.41e-3) 0.935 ( ± 2.02e-2) 0.663 ( ± 3.10e-2) 0.946 ( ± 1.02e-2) 0.001 0.963 ( ± 8.22e-3) 0.942 ( ± 1.76e-2) 0.656 ( ± 3.06e-2) 0.936 ( ± 1.25e-2) 0.0012 0.953 ( ± 9.58e-3) 0.943 ( ± 1.37e-2) 0.656 ( ± 3.07e-2) 0.957 ( ± 7.95e-3) 0.0014 0.947 ( ± 9.61e-3) 0.947 ( ± 1.73e-2) 0.672 ( ± 2.94e-2) 0.955 ( ± 8.26e-3) 0.0016 0.949 ( ± 8.89e-3) 0.947 ( ± 1.67e-2) 0.702 ( ± 2.80e-2) 0.956 ( ± 6.95e-3) 0.0018 0.941 ( ± 9.39e-3) 0.946 ( ± 1.42e-2) 0.692 ( ± 2.81e-2) 0.966 ( ± 5.83e-3) 0.002 0.950 ( ± 7.27e-3) 0.957 ( ± 1.20e-2) 0.740 ( ± 2.61e-2) 0.963 ( ± 6.90e-3) T able A47 : Cohen’s Kappa Dark State Probability CRJMCMC F actorial HMM Monotonic MAP Sequential MAP 0.0002 0.970 ( ± 7.00e-3) 0.734 ( ± 4.45e-2) 0.807 ( ± 2.12e-2) 0.862 ( ± 2.52e-2) 0.0004 0.969 ( ± 6.31e-3) 0.778 ( ± 4.01e-2) 0.709 ( ± 2.54e-2) 0.812 ( ± 3.12e-2) 0.0006 0.967 ( ± 6.02e-3) 0.767 ( ± 4.27e-2) 0.603 ( ± 2.60e-2) 0.801 ( ± 3.25e-2) 0.0008 0.962 ( ± 6.99e-3) 0.768 ( ± 4.36e-2) 0.564 ( ± 2.64e-2) 0.781 ( ± 3.43e-2) 0.001 0.948 ( ± 8.68e-3) 0.785 ( ± 3.73e-2) 0.527 ( ± 2.60e-2) 0.754 ( ± 3.50e-2) 0.0012 0.931 ( ± 1.03e-2) 0.778 ( ± 4.09e-2) 0.486 ( ± 2.59e-2) 0.761 ( ± 3.46e-2) 0.0014 0.916 ( ± 1.16e-2) 0.726 ( ± 4.91e-2) 0.461 ( ± 2.50e-2) 0.735 ( ± 3.59e-2) 0.0016 0.916 ( ± 1.07e-2) 0.730 ( ± 4.95e-2) 0.458 ( ± 2.57e-2) 0.744 ( ± 3.47e-2) 0.0018 0.897 ( ± 1.22e-2) 0.777 ( ± 4.35e-2) 0.393 ( ± 2.26e-2) 0.689 ( ± 3.82e-2) 0.002 0.888 ( ± 1.32e-2) 0.771 ( ± 4.40e-2) 0.400 ( ± 2.20e-2) 0.726 ( ± 3.49e-2) T able A48 : RMSE (Intensit y) Dark State Probability CRJMCMC F actorial HMM Monotonic MAP Sequential MAP 0.0002 96.159 ( ± 9.45) 208.172 ( ± 28.88) 330.254 ( ± 27.41) 219.171 ( ± 19.10) 0.0004 104.273 ( ± 11.23) 190.977 ( ± 26.77) 402.450 ( ± 32.32) 227.333 ( ± 17.41) 0.0006 110.827 ( ± 10.40) 190.825 ( ± 25.92) 487.643 ( ± 35.81) 243.075 ( ± 18.84) 0.0008 118.673 ( ± 12.69) 183.435 ( ± 23.23) 496.102 ( ± 35.26) 245.441 ( ± 19.51) 0.001 143.073 ( ± 15.35) 196.564 ( ± 26.03) 524.170 ( ± 35.57) 258.085 ( ± 18.70) 0.0012 165.286 ( ± 16.68) 196.965 ( ± 24.93) 550.993 ( ± 37.04) 260.527 ( ± 17.96) 0.0014 181.403 ( ± 18.58) 185.150 ( ± 22.71) 558.939 ( ± 36.34) 278.958 ( ± 19.67) 0.0016 189.011 ( ± 18.56) 188.927 ( ± 25.30) 567.783 ( ± 38.44) 288.496 ( ± 22.38) 0.0018 209.741 ( ± 20.64) 191.211 ( ± 21.64) 597.291 ( ± 38.97) 308.925 ( ± 23.69) 0.002 208.908 ( ± 20.58) 183.785 ( ± 20.35) 567.583 ( ± 35.87) 291.069 ( ± 21.68) T able A49 : Absolute Error ( µ f ) Dark State Probability CRJMCMC F actorial HMM Monotonic MAP Sequential MAP 0.0002 34.794 ( ± 3.49) 48.536 ( ± 6.04) 197.612 ( ± 11.43) 132.357 ( ± 30.43) 0.0004 39.387 ( ± 6.23) 48.476 ( ± 6.28) 197.612 ( ± 11.43) 142.262 ( ± 23.40) 0.0006 40.129 ( ± 4.95) 49.795 ( ± 6.22) 197.612 ( ± 11.43) 176.327 ( ± 31.03) 0.0008 45.746 ( ± 6.62) 49.717 ( ± 6.23) 197.612 ( ± 11.43) 204.618 ( ± 36.24) 0.001 56.318 ( ± 9.42) 50.355 ( ± 6.16) 197.612 ( ± 11.43) 224.785 ( ± 32.65) 0.0012 66.231 ( ± 10.90) 50.886 ( ± 6.18) 197.612 ( ± 11.43) 240.937 ( ± 34.71) 0.0014 74.841 ( ± 11.82) 48.959 ( ± 6.22) 197.612 ( ± 11.43) 286.957 ( ± 38.45) 0.0016 76.762 ( ± 12.28) 48.701 ( ± 6.07) 197.612 ( ± 11.43) 284.937 ( ± 43.23) 0.0018 85.628 ( ± 12.83) 50.799 ( ± 6.09) 197.612 ( ± 11.43) 355.474 ( ± 45.08) 0.002 84.633 ( ± 12.98) 49.609 ( ± 6.03) 197.612 ( ± 11.43) 341.898 ( ± 47.38) 45 T able A50 : Absolute Error ( µ b ) Dark State Probability CRJMCMC F actorial HMM Monotonic MAP Sequential MAP 0.0002 2.011 ( ± 0.15) 100.896 ( ± 21.27) 125.419 ( ± 7.82) 51.088 ( ± 9.96) 0.0004 2.089 ( ± 0.20) 76.453 ( ± 15.59) 125.419 ( ± 7.82) 74.043 ( ± 11.49) 0.0006 2.150 ( ± 0.20) 74.251 ( ± 16.27) 125.419 ( ± 7.82) 105.995 ( ± 18.23) 0.0008 2.174 ( ± 0.23) 71.477 ( ± 14.46) 125.419 ( ± 7.82) 115.722 ( ± 18.13) 0.001 2.270 ( ± 0.26) 76.242 ( ± 16.62) 125.419 ( ± 7.82) 121.142 ( ± 17.52) 0.0012 2.531 ( ± 0.30) 74.204 ( ± 16.85) 125.419 ( ± 7.82) 135.115 ( ± 17.38) 0.0014 2.965 ( ± 0.40) 63.560 ( ± 13.62) 125.419 ( ± 7.82) 164.587 ( ± 19.42) 0.0016 2.709 ( ± 0.34) 75.228 ( ± 17.51) 125.419 ( ± 7.82) 166.732 ( ± 21.98) 0.0018 3.126 ( ± 0.42) 63.876 ( ± 12.54) 125.419 ( ± 7.82) 190.722 ( ± 21.76) 0.002 3.473 ( ± 0.53) 60.814 ( ± 10.99) 125.419 ( ± 7.82) 169.458 ( ± 18.28) T able A51 : Absolute Error ( σ 2 f ) Dark State Probability CRJMCMC Monotonic MAP Sequen tial MAP 0.0002 150.586 ( ± 11.30) 1.00e+5 ( ± 1.05e+4) 944.253 ( ± 59.71) 0.0004 154.391 ( ± 11.51) 1.00e+5 ( ± 1.05e+4) 934.212 ( ± 60.98) 0.0006 164.108 ( ± 11.71) 1.00e+5 ( ± 1.05e+4) 891.287 ( ± 59.94) 0.0008 165.487 ( ± 12.33) 1.00e+5 ( ± 1.05e+4) 884.851 ( ± 59.36) 0.001 178.896 ( ± 13.83) 1.00e+5 ( ± 1.05e+4) 878.237 ( ± 61.59) 0.0012 181.592 ( ± 13.67) 1.00e+5 ( ± 1.05e+4) 849.967 ( ± 60.40) 0.0014 185.061 ( ± 14.67) 1.00e+5 ( ± 1.05e+4) 836.801 ( ± 60.40) 0.0016 188.125 ( ± 15.53) 1.00e+5 ( ± 1.05e+4) 828.147 ( ± 58.74) 0.0018 184.277 ( ± 14.47) 1.00e+5 ( ± 1.05e+4) 805.474 ( ± 57.21) 0.002 180.423 ( ± 12.82) 1.00e+5 ( ± 1.05e+4) 809.599 ( ± 58.95) T able A52 : Absolute Error ( σ 2 b ) Dark State Probability CRJMCMC Monotonic MAP Sequential MAP 0.0002 5104.466 ( ± 648.30) 1.05e+5 ( ± 1.05e+4) 4.30e+4 ( ± 6.55e+3) 0.0004 5530.521 ( ± 789.97) 1.05e+5 ( ± 1.05e+4) 4.30e+4 ( ± 6.55e+3) 0.0006 5756.135 ( ± 850.71) 1.05e+5 ( ± 1.05e+4) 4.32e+4 ( ± 6.60e+3) 0.0008 7107.958 ( ± 1333.75) 1.05e+5 ( ± 1.05e+4) 4.30e+4 ( ± 6.57e+3) 0.001 8700.974 ( ± 1653.71) 1.05e+5 ( ± 1.05e+4) 4.30e+4 ( ± 6.57e+3) 0.0012 1.21e+4 ( ± 2.61e+3) 1.05e+5 ( ± 1.05e+4) 4.31e+4 ( ± 6.60e+3) 0.0014 1.35e+4 ( ± 2.66e+3) 1.05e+5 ( ± 1.05e+4) 4.30e+4 ( ± 6.59e+3) 0.0016 1.49e+4 ( ± 2.94e+3) 1.05e+5 ( ± 1.05e+4) 4.29e+4 ( ± 6.57e+3) 0.0018 1.88e+4 ( ± 3.68e+3) 1.05e+5 ( ± 1.05e+4) 4.28e+4 ( ± 6.55e+3) 0.002 1.74e+4 ( ± 3.24e+3) 1.05e+5 ( ± 1.05e+4) 4.25e+4 ( ± 6.59e+3) 46 S11.5 V arying Dark State Duration T able A53 : Accuracy Dark State Duration CRJMCMC F actorial HMM Monotonic MAP Sequential MAP 100 0.990 ( ± 2.38e-3) 0.805 ( ± 3.52e-2) 0.886 ( ± 1.26e-2) 0.910 ( ± 1.96e-2) 200 0.988 ( ± 3.10e-3) 0.840 ( ± 3.14e-2) 0.886 ( ± 1.33e-2) 0.910 ( ± 2.00e-2) 300 0.991 ( ± 2.52e-3) 0.833 ( ± 3.12e-2) 0.900 ( ± 1.23e-2) 0.927 ( ± 1.65e-2) 400 0.992 ( ± 2.43e-3) 0.874 ( ± 2.59e-2) 0.901 ( ± 1.16e-2) 0.938 ( ± 1.51e-2) 500 0.992 ( ± 2.17e-3) 0.865 ( ± 2.65e-2) 0.916 ( ± 1.13e-2) 0.950 ( ± 1.25e-2) 600 0.993 ( ± 2.34e-3) 0.894 ( ± 2.22e-2) 0.914 ( ± 1.04e-2) 0.950 ( ± 1.25e-2) 700 0.993 ( ± 2.38e-3) 0.889 ( ± 2.50e-2) 0.916 ( ± 1.04e-2) 0.950 ( ± 1.26e-2) 800 0.992 ( ± 2.74e-3) 0.894 ( ± 2.34e-2) 0.935 ( ± 8.28e-3) 0.942 ( ± 1.44e-2) 900 0.994 ( ± 1.49e-3) 0.908 ( ± 1.95e-2) 0.932 ( ± 9.37e-3) 0.952 ( ± 1.34e-2) 1000 0.994 ( ± 1.78e-3) 0.900 ( ± 2.12e-2) 0.938 ( ± 9.13e-3) 0.949 ( ± 1.38e-2) T able A54 : Precision Dark State Duration CRJMCMC F actorial HMM Monotonic MAP Sequential MAP 100 0.995 ( ± 8.22e-4) 0.958 ( ± 1.48e-2) 0.907 ( ± 1.33e-2) 0.927 ( ± 2.24e-2) 200 0.994 ( ± 1.25e-3) 0.954 ( ± 1.45e-2) 0.908 ( ± 1.51e-2) 0.937 ( ± 2.05e-2) 300 0.991 ( ± 3.57e-3) 0.947 ( ± 1.79e-2) 0.917 ( ± 1.55e-2) 0.922 ( ± 2.30e-2) 400 0.993 ( ± 1.77e-3) 0.935 ( ± 2.02e-2) 0.913 ( ± 1.74e-2) 0.945 ( ± 1.82e-2) 500 0.994 ( ± 1.16e-3) 0.929 ( ± 2.44e-2) 0.915 ( ± 1.78e-2) 0.939 ( ± 2.04e-2) 600 0.993 ( ± 2.01e-3) 0.927 ( ± 2.32e-2) 0.925 ( ± 1.57e-2) 0.949 ( ± 1.74e-2) 700 0.994 ( ± 1.00e-3) 0.907 ( ± 2.74e-2) 0.924 ( ± 1.53e-2) 0.956 ( ± 1.52e-2) 800 0.994 ( ± 9.31e-4) 0.920 ( ± 2.48e-2) 0.945 ( ± 1.30e-2) 0.951 ( ± 1.69e-2) 900 0.991 ( ± 3.53e-3) 0.909 ( ± 2.47e-2) 0.941 ( ± 1.34e-2) 0.956 ( ± 1.57e-2) 1000 0.993 ( ± 1.06e-3) 0.923 ( ± 2.35e-2) 0.934 ( ± 1.37e-2) 0.934 ( ± 2.05e-2) T able A55 : Sensitivity Dark State Duration CRJMCMC F actorial HMM Monotonic MAP Sequential MAP 100 0.991 ( ± 3.01e-3) 0.754 ( ± 4.91e-2) 0.910 ( ± 1.84e-2) 0.896 ( ± 2.70e-2) 200 0.986 ( ± 4.97e-3) 0.774 ( ± 4.67e-2) 0.863 ( ± 2.26e-2) 0.884 ( ± 2.91e-2) 300 0.990 ( ± 3.25e-3) 0.747 ( ± 4.63e-2) 0.822 ( ± 2.72e-2) 0.890 ( ± 2.84e-2) 400 0.990 ( ± 3.15e-3) 0.793 ( ± 4.50e-2) 0.796 ( ± 2.85e-2) 0.890 ( ± 2.80e-2) 500 0.989 ( ± 3.66e-3) 0.722 ( ± 5.05e-2) 0.797 ( ± 2.84e-2) 0.899 ( ± 2.71e-2) 600 0.988 ( ± 4.08e-3) 0.772 ( ± 4.64e-2) 0.770 ( ± 2.92e-2) 0.906 ( ± 2.51e-2) 700 0.989 ( ± 3.49e-3) 0.792 ( ± 4.51e-2) 0.769 ( ± 2.91e-2) 0.902 ( ± 2.59e-2) 800 0.988 ( ± 4.76e-3) 0.787 ( ± 4.41e-2) 0.786 ( ± 2.92e-2) 0.891 ( ± 2.74e-2) 900 0.988 ( ± 5.23e-3) 0.792 ( ± 4.35e-2) 0.766 ( ± 2.96e-2) 0.906 ( ± 2.56e-2) 1000 0.990 ( ± 2.73e-3) 0.762 ( ± 4.67e-2) 0.783 ( ± 2.91e-2) 0.911 ( ± 2.49e-2) 47 T able A56 : Sp ecificity Dark State Duration CRJMCMC F actorial HMM Monotonic MAP Sequential MAP 100 0.981 ( ± 3.31e-3) 0.918 ( ± 2.35e-2) 0.770 ( ± 2.96e-2) 0.941 ( ± 1.17e-2) 200 0.983 ( ± 3.43e-3) 0.930 ( ± 2.13e-2) 0.837 ( ± 2.62e-2) 0.944 ( ± 1.37e-2) 300 0.986 ( ± 2.72e-3) 0.942 ( ± 2.10e-2) 0.869 ( ± 2.39e-2) 0.948 ( ± 1.19e-2) 400 0.989 ( ± 2.63e-3) 0.947 ( ± 1.87e-2) 0.896 ( ± 2.01e-2) 0.965 ( ± 9.22e-3) 500 0.989 ( ± 3.11e-3) 0.955 ( ± 1.74e-2) 0.903 ( ± 2.07e-2) 0.965 ( ± 9.55e-3) 600 0.992 ( ± 2.14e-3) 0.956 ( ± 1.76e-2) 0.922 ( ± 1.83e-2) 0.963 ( ± 1.04e-2) 700 0.989 ( ± 2.86e-3) 0.941 ( ± 2.23e-2) 0.924 ( ± 1.79e-2) 0.968 ( ± 8.49e-3) 800 0.989 ( ± 2.41e-3) 0.947 ( ± 2.07e-2) 0.942 ( ± 1.31e-2) 0.966 ( ± 8.58e-3) 900 0.991 ( ± 2.16e-3) 0.941 ( ± 2.18e-2) 0.938 ( ± 1.58e-2) 0.970 ( ± 8.53e-3) 1000 0.991 ( ± 2.40e-3) 0.948 ( ± 1.92e-2) 0.930 ( ± 1.62e-2) 0.960 ( ± 1.12e-2) T able A57 : Cohen’s k appa Dark State Duration CRJMCMC F actorial HMM Monotonic MAP Sequential MAP 100 0.982 ( ± 3.62e-3) 0.714 ( ± 4.78e-2) 0.776 ( ± 2.47e-2) 0.860 ( ± 2.69e-2) 200 0.979 ( ± 4.70e-3) 0.752 ( ± 4.37e-2) 0.775 ( ± 2.58e-2) 0.849 ( ± 2.98e-2) 300 0.983 ( ± 3.90e-3) 0.722 ( ± 4.43e-2) 0.766 ( ± 2.70e-2) 0.861 ( ± 2.72e-2) 400 0.983 ( ± 3.96e-3) 0.764 ( ± 4.29e-2) 0.754 ( ± 2.78e-2) 0.875 ( ± 2.50e-2) 500 0.984 ( ± 3.45e-3) 0.716 ( ± 4.60e-2) 0.766 ( ± 2.73e-2) 0.884 ( ± 2.46e-2) 600 0.984 ( ± 3.98e-3) 0.757 ( ± 4.23e-2) 0.756 ( ± 2.64e-2) 0.891 ( ± 2.23e-2) 700 0.983 ( ± 3.44e-3) 0.760 ( ± 4.34e-2) 0.754 ( ± 2.66e-2) 0.889 ( ± 2.29e-2) 800 0.984 ( ± 4.14e-3) 0.768 ( ± 4.04e-2) 0.787 ( ± 2.54e-2) 0.878 ( ± 2.47e-2) 900 0.983 ( ± 4.87e-3) 0.760 ( ± 4.08e-2) 0.770 ( ± 2.55e-2) 0.895 ( ± 2.24e-2) 1000 0.985 ( ± 2.94e-3) 0.747 ( ± 4.21e-2) 0.781 ( ± 2.52e-2) 0.884 ( ± 2.41e-2) T able A58 : RMSE (Intensit y) Dark State Duration CRJMCMC F actorial HMM Monotonic MAP Sequential MAP 100 86.561 ( ± 7.35) 195.302 ( ± 28.78) 335.776 ( ± 26.70) 212.959 ( ± 19.92) 200 85.647 ( ± 7.79) 183.114 ( ± 24.68) 332.739 ( ± 27.42) 203.899 ( ± 17.82) 300 79.306 ( ± 7.41) 179.497 ( ± 26.86) 319.680 ( ± 27.32) 196.956 ( ± 19.50) 400 76.715 ( ± 6.97) 177.778 ( ± 26.22) 310.556 ( ± 24.60) 192.779 ( ± 17.33) 500 71.987 ( ± 7.16) 181.401 ( ± 27.19) 303.032 ( ± 26.68) 173.004 ( ± 17.48) 600 68.101 ( ± 6.61) 166.976 ( ± 24.23) 298.008 ( ± 25.09) 184.477 ( ± 19.48) 700 70.143 ( ± 6.49) 178.370 ( ± 26.02) 305.843 ( ± 25.61) 170.433 ( ± 17.63) 800 72.255 ( ± 7.29) 171.180 ( ± 24.38) 272.832 ( ± 21.46) 180.992 ( ± 19.22) 900 66.435 ( ± 5.87) 170.326 ( ± 23.15) 274.208 ( ± 23.45) 157.167 ( ± 14.46) 1000 65.959 ( ± 6.79) 178.315 ( ± 23.42) 258.724 ( ± 20.41) 168.438 ( ± 17.68) T able A59 : Absolute Error ( µ f ) Dark State Duration CRJMCMC F actorial HMM Monotonic MAP Sequential MAP 100 34.859 ( ± 3.45) 47.059 ( ± 6.17) 197.612 ( ± 11.43) 128.809 ( ± 28.03) 200 35.128 ( ± 3.49) 48.650 ( ± 6.05) 197.612 ( ± 11.43) 117.456 ( ± 26.30) 300 36.420 ( ± 4.14) 47.619 ( ± 6.18) 197.612 ( ± 11.43) 125.027 ( ± 28.98) 400 36.325 ( ± 3.62) 48.816 ( ± 6.07) 197.612 ( ± 11.43) 153.151 ( ± 42.32) 500 35.258 ( ± 3.51) 48.984 ( ± 6.20) 197.612 ( ± 11.43) 125.242 ( ± 32.45) 600 35.761 ( ± 3.63) 48.485 ( ± 6.18) 197.612 ( ± 11.43) 114.124 ( ± 24.28) 700 35.617 ( ± 3.52) 49.650 ( ± 6.04) 197.612 ( ± 11.43) 136.518 ( ± 35.05) 800 35.320 ( ± 3.55) 46.608 ( ± 6.19) 197.612 ( ± 11.43) 147.769 ( ± 42.77) 900 35.916 ( ± 3.82) 48.653 ( ± 5.93) 197.612 ( ± 11.43) 124.691 ( ± 35.83) 1000 35.065 ( ± 3.48) 48.432 ( ± 6.06) 197.612 ( ± 11.43) 119.168 ( ± 28.88) 48 T able A60 : Absolute Error ( µ b ) Dark State Duration CRJMCMC F actorial HMM Monotonic MAP Sequen tial MAP 100 1.972 ( ± 0.15) 93.016 ( ± 21.78) 125.419 ( ± 7.82) 64.582 ( ± 14.98) 200 1.990 ( ± 0.15) 84.744 ( ± 17.38) 125.419 ( ± 7.82) 60.278 ( ± 10.97) 300 1.978 ( ± 0.16) 80.863 ( ± 20.50) 125.419 ( ± 7.82) 61.474 ( ± 17.66) 400 1.933 ( ± 0.16) 76.470 ( ± 17.79) 125.419 ( ± 7.82) 63.065 ( ± 12.16) 500 1.857 ( ± 0.15) 87.327 ( ± 22.77) 125.419 ( ± 7.82) 48.341 ( ± 11.68) 600 1.915 ( ± 0.15) 65.743 ( ± 13.86) 125.419 ( ± 7.82) 63.981 ( ± 18.25) 700 1.881 ( ± 0.15) 94.571 ( ± 22.47) 125.419 ( ± 7.82) 55.969 ( ± 14.10) 800 1.835 ( ± 0.15) 84.729 ( ± 17.62) 125.419 ( ± 7.82) 55.054 ( ± 14.44) 900 1.860 ( ± 0.16) 83.881 ( ± 20.59) 125.419 ( ± 7.82) 41.626 ( ± 8.28) 1000 1.741 ( ± 0.15) 97.560 ( ± 19.10) 125.419 ( ± 7.82) 51.145 ( ± 15.00) T able A61 : Absolute Error ( σ 2 f ) Dark State Duration CRJMCMC Monotonic MAP Sequen tial MAP 100 155.748 ( ± 11.50) 1.00e+5 ( ± 1.05e+4) 952.979 ( ± 61.08) 200 153.378 ( ± 11.37) 1.00e+5 ( ± 1.05e+4) 955.482 ( ± 60.79) 300 153.960 ( ± 11.45) 1.00e+5 ( ± 1.05e+4) 960.732 ( ± 60.30) 400 157.250 ( ± 11.98) 1.00e+5 ( ± 1.05e+4) 950.258 ( ± 59.96) 500 154.664 ( ± 11.55) 1.00e+5 ( ± 1.05e+4) 972.159 ( ± 61.42) 600 156.675 ( ± 11.64) 1.00e+5 ( ± 1.05e+4) 958.384 ( ± 60.13) 700 158.131 ( ± 11.46) 1.00e+5 ( ± 1.05e+4) 955.211 ( ± 60.67) 800 155.007 ( ± 11.49) 1.00e+5 ( ± 1.05e+4) 959.003 ( ± 61.43) 900 156.743 ( ± 11.74) 1.00e+5 ( ± 1.05e+4) 970.147 ( ± 60.49) 1000 155.813 ( ± 11.48) 1.00e+5 ( ± 1.05e+4) 962.804 ( ± 61.32) T able A62 : Absolute Error ( σ 2 b ) Dark State Duration CRJMCMC Monotonic MAP Sequen tial MAP 100 5114.609 ( ± 649.89) 1.05e+5 ( ± 1.05e+4) 4.30e+4 ( ± 6.55e+3) 200 5075.337 ( ± 646.95) 1.05e+5 ( ± 1.05e+4) 4.30e+4 ( ± 6.55e+3) 300 5046.379 ( ± 647.37) 1.05e+5 ( ± 1.05e+4) 4.30e+4 ( ± 6.55e+3) 400 5036.540 ( ± 647.17) 1.05e+5 ( ± 1.05e+4) 4.30e+4 ( ± 6.55e+3) 500 5049.224 ( ± 650.18) 1.05e+5 ( ± 1.05e+4) 4.31e+4 ( ± 6.57e+3) 600 5019.918 ( ± 648.15) 1.05e+5 ( ± 1.05e+4) 4.30e+4 ( ± 6.55e+3) 700 4998.026 ( ± 649.68) 1.05e+5 ( ± 1.05e+4) 4.36e+4 ( ± 6.62e+3) 800 4986.017 ( ± 648.01) 1.05e+5 ( ± 1.05e+4) 4.32e+4 ( ± 6.58e+3) 900 4973.805 ( ± 647.42) 1.05e+5 ( ± 1.05e+4) 4.27e+4 ( ± 6.53e+3) 1000 4946.114 ( ± 646.41) 1.05e+5 ( ± 1.05e+4) 4.34e+4 ( ± 6.63e+3) 49 S11.6 V arying Blink State T ransition Probabilit y T able A63 : Accuracy Blink State Probability CRJMCMC F actorial HMM Monotonic MAP Sequential MAP 0.0002 0.984 ( ± 4.03e-3) 0.814 ( ± 3.48e-2) 0.898 ( ± 1.20e-2) 0.917 ( ± 1.91e-2) 0.0004 0.982 ( ± 4.13e-3) 0.822 ( ± 3.49e-2) 0.894 ( ± 1.22e-2) 0.901 ( ± 2.13e-2) 0.0006 0.980 ( ± 4.57e-3) 0.814 ( ± 3.32e-2) 0.894 ( ± 1.16e-2) 0.903 ( ± 1.95e-2) 0.0008 0.978 ( ± 4.20e-3) 0.813 ( ± 3.21e-2) 0.889 ( ± 1.15e-2) 0.896 ( ± 2.04e-2) 0.001 0.978 ( ± 4.43e-3) 0.807 ( ± 3.55e-2) 0.889 ( ± 1.13e-2) 0.907 ( ± 1.87e-2) 0.0012 0.977 ( ± 3.53e-3) 0.806 ( ± 3.44e-2) 0.886 ( ± 1.12e-2) 0.915 ( ± 1.70e-2) 0.0014 0.973 ( ± 4.47e-3) 0.794 ( ± 3.47e-2) 0.880 ( ± 1.14e-2) 0.881 ( ± 2.13e-2) 0.0016 0.973 ( ± 4.08e-3) 0.804 ( ± 3.51e-2) 0.884 ( ± 1.10e-2) 0.900 ( ± 1.82e-2) 0.0018 0.968 ( ± 5.11e-3) 0.815 ( ± 3.43e-2) 0.880 ( ± 1.08e-2) 0.896 ( ± 1.87e-2) 0.002 0.965 ( ± 5.36e-3) 0.807 ( ± 3.29e-2) 0.873 ( ± 1.13e-2) 0.877 ( ± 2.13e-2) T able A64 : Precision Blink State Probability CRJMCMC F actorial HMM Monotonic MAP Sequential MAP 0.0002 0.993 ( ± 2.42e-3) 0.951 ( ± 1.48e-2) 0.909 ( ± 1.27e-2) 0.939 ( ± 1.94e-2) 0.0004 0.990 ( ± 3.02e-3) 0.959 ( ± 1.76e-2) 0.905 ( ± 1.29e-2) 0.948 ( ± 1.75e-2) 0.0006 0.987 ( ± 6.39e-3) 0.953 ( ± 1.96e-2) 0.897 ( ± 1.36e-2) 0.926 ( ± 2.11e-2) 0.0008 0.989 ( ± 1.75e-3) 0.964 ( ± 1.16e-2) 0.898 ( ± 1.23e-2) 0.935 ( ± 1.69e-2) 0.001 0.986 ( ± 2.28e-3) 0.948 ( ± 1.96e-2) 0.897 ( ± 1.23e-2) 0.942 ( ± 1.65e-2) 0.0012 0.985 ( ± 2.02e-3) 0.966 ( ± 1.02e-2) 0.893 ( ± 1.17e-2) 0.932 ( ± 1.79e-2) 0.0014 0.981 ( ± 3.81e-3) 0.955 ( ± 1.55e-2) 0.880 ( ± 1.22e-2) 0.919 ( ± 2.02e-2) 0.0016 0.983 ( ± 2.07e-3) 0.965 ( ± 1.28e-2) 0.892 ( ± 1.15e-2) 0.934 ( ± 1.54e-2) 0.0018 0.978 ( ± 3.41e-3) 0.952 ( ± 1.49e-2) 0.884 ( ± 1.14e-2) 0.932 ( ± 1.57e-2) 0.002 0.976 ( ± 3.17e-3) 0.950 ( ± 1.52e-2) 0.877 ( ± 1.21e-2) 0.921 ( ± 1.69e-2) T able A65 : Sensitivity Blink State Probability CRJMCMC F actorial HMM Monotonic MAP Sequential MAP 0.0002 0.984 ( ± 4.65e-3) 0.799 ( ± 4.39e-2) 0.949 ( ± 1.29e-2) 0.918 ( ± 2.43e-2) 0.0004 0.984 ( ± 4.49e-3) 0.784 ( ± 4.65e-2) 0.948 ( ± 1.38e-2) 0.892 ( ± 2.78e-2) 0.0006 0.978 ( ± 7.67e-3) 0.787 ( ± 4.30e-2) 0.951 ( ± 1.23e-2) 0.907 ( ± 2.50e-2) 0.0008 0.981 ( ± 4.96e-3) 0.789 ( ± 3.96e-2) 0.948 ( ± 1.29e-2) 0.910 ( ± 2.53e-2) 0.001 0.980 ( ± 5.51e-3) 0.780 ( ± 4.74e-2) 0.939 ( ± 1.51e-2) 0.904 ( ± 2.62e-2) 0.0012 0.982 ( ± 4.06e-3) 0.787 ( ± 4.12e-2) 0.945 ( ± 1.28e-2) 0.929 ( ± 2.10e-2) 0.0014 0.980 ( ± 4.77e-3) 0.751 ( ± 4.73e-2) 0.953 ( ± 1.22e-2) 0.881 ( ± 2.91e-2) 0.0016 0.980 ( ± 4.81e-3) 0.774 ( ± 4.39e-2) 0.941 ( ± 1.49e-2) 0.909 ( ± 2.51e-2) 0.0018 0.978 ( ± 5.71e-3) 0.796 ( ± 4.42e-2) 0.946 ( ± 1.43e-2) 0.911 ( ± 2.46e-2) 0.002 0.975 ( ± 6.13e-3) 0.789 ( ± 4.17e-2) 0.947 ( ± 1.28e-2) 0.898 ( ± 2.70e-2) 50 T able A66 : Sp ecificity Blink State Probability CRJMCMC F actorial HMM Monotonic MAP Sequential MAP 0.0002 0.980 ( ± 3.88e-3) 0.898 ( ± 2.67e-2) 0.752 ( ± 2.91e-2) 0.927 ( ± 1.38e-2) 0.0004 0.969 ( ± 4.82e-3) 0.917 ( ± 2.41e-2) 0.741 ( ± 2.91e-2) 0.924 ( ± 1.43e-2) 0.0006 0.967 ( ± 4.86e-3) 0.901 ( ± 2.62e-2) 0.729 ( ± 2.81e-2) 0.902 ( ± 1.52e-2) 0.0008 0.959 ( ± 5.37e-3) 0.912 ( ± 2.32e-2) 0.717 ( ± 2.83e-2) 0.886 ( ± 1.70e-2) 0.001 0.954 ( ± 6.02e-3) 0.896 ( ± 2.89e-2) 0.715 ( ± 2.84e-2) 0.893 ( ± 1.28e-2) 0.0012 0.947 ( ± 6.36e-3) 0.904 ( ± 2.47e-2) 0.696 ( ± 2.78e-2) 0.875 ( ± 1.60e-2) 0.0014 0.939 ( ± 7.31e-3) 0.901 ( ± 2.40e-2) 0.678 ( ± 2.73e-2) 0.871 ( ± 1.50e-2) 0.0016 0.937 ( ± 7.69e-3) 0.918 ( ± 1.89e-2) 0.697 ( ± 2.69e-2) 0.864 ( ± 1.50e-2) 0.0018 0.927 ( ± 9.27e-3) 0.895 ( ± 2.67e-2) 0.675 ( ± 2.78e-2) 0.862 ( ± 1.47e-2) 0.002 0.924 ( ± 8.18e-3) 0.883 ( ± 2.66e-2) 0.670 ( ± 2.68e-2) 0.844 ( ± 1.60e-2) T able A67 : Cohen’s Kappa Blink State Probability CRJMCMC F actorial HMM Monotonic MAP Sequential MAP 0.0002 0.972 ( ± 6.40e-3) 0.740 ( ± 4.37e-2) 0.812 ( ± 2.21e-2) 0.871 ( ± 2.63e-2) 0.0004 0.967 ( ± 6.99e-3) 0.746 ( ± 4.49e-2) 0.806 ( ± 2.17e-2) 0.848 ( ± 2.86e-2) 0.0006 0.962 ( ± 8.47e-3) 0.736 ( ± 4.35e-2) 0.803 ( ± 2.09e-2) 0.846 ( ± 2.69e-2) 0.0008 0.961 ( ± 6.67e-3) 0.736 ( ± 4.16e-2) 0.796 ( ± 2.08e-2) 0.845 ( ± 2.67e-2) 0.001 0.960 ( ± 6.94e-3) 0.718 ( ± 4.73e-2) 0.788 ( ± 2.12e-2) 0.848 ( ± 2.66e-2) 0.0012 0.959 ( ± 6.06e-3) 0.726 ( ± 4.42e-2) 0.783 ( ± 2.12e-2) 0.864 ( ± 2.32e-2) 0.0014 0.951 ( ± 7.51e-3) 0.708 ( ± 4.55e-2) 0.773 ( ± 2.07e-2) 0.819 ( ± 2.81e-2) 0.0016 0.953 ( ± 6.27e-3) 0.722 ( ± 4.49e-2) 0.781 ( ± 2.02e-2) 0.840 ( ± 2.54e-2) 0.0018 0.944 ( ± 7.63e-3) 0.741 ( ± 4.40e-2) 0.766 ( ± 2.10e-2) 0.832 ( ± 2.61e-2) 0.002 0.939 ( ± 8.58e-3) 0.726 ( ± 4.31e-2) 0.760 ( ± 2.03e-2) 0.810 ( ± 2.82e-2) T able A68 : RMSE (Intensit y) Blink State Probability CRJMCMC F actorial HMM Monotonic MAP Sequential MAP 0.0002 95.756 ( ± 9.49) 206.083 ( ± 29.50) 320.888 ( ± 26.70) 204.349 ( ± 16.06) 0.0004 109.221 ( ± 9.67) 196.092 ( ± 26.40) 335.789 ( ± 28.58) 222.640 ( ± 18.38) 0.0006 117.603 ( ± 10.24) 208.006 ( ± 27.43) 330.506 ( ± 26.65) 227.267 ( ± 16.92) 0.0008 123.950 ( ± 9.84) 216.836 ( ± 27.57) 345.400 ( ± 27.15) 234.685 ( ± 18.26) 0.001 125.502 ( ± 10.60) 211.665 ( ± 29.17) 340.260 ( ± 25.95) 236.841 ( ± 18.52) 0.0012 134.470 ( ± 10.70) 220.990 ( ± 30.94) 361.757 ( ± 28.16) 235.393 ( ± 16.71) 0.0014 147.959 ( ± 11.50) 225.627 ( ± 27.15) 366.681 ( ± 28.68) 255.921 ( ± 18.22) 0.0016 148.542 ( ± 11.35) 230.403 ( ± 27.04) 359.388 ( ± 26.88) 257.996 ( ± 18.39) 0.0018 156.818 ( ± 12.37) 216.836 ( ± 24.82) 364.570 ( ± 27.04) 261.189 ( ± 18.44) 0.002 169.746 ( ± 11.98) 240.738 ( ± 29.90) 378.549 ( ± 27.47) 274.241 ( ± 18.55) T able A69 : RMSE ( µ f ) Blink State Probability CRJMCMC F actorial HMM Monotonic MAP Sequential MAP 0.0002 34.831 ( ± 3.55) 47.742 ( ± 6.24) 197.612 ( ± 11.43) 94.812 ( ± 19.88) 0.0004 35.346 ( ± 3.49) 47.896 ( ± 6.35) 197.612 ( ± 11.43) 114.844 ( ± 26.69) 0.0006 36.034 ( ± 3.50) 47.635 ( ± 6.25) 197.612 ( ± 11.43) 113.072 ( ± 22.69) 0.0008 36.620 ( ± 3.40) 47.895 ( ± 6.26) 197.612 ( ± 11.43) 107.356 ( ± 19.12) 0.001 37.512 ( ± 3.35) 48.746 ( ± 6.29) 197.612 ( ± 11.43) 125.825 ( ± 25.91) 0.0012 38.088 ( ± 3.33) 48.221 ( ± 6.28) 197.612 ( ± 11.43) 105.084 ( ± 19.51) 0.0014 39.921 ( ± 3.50) 48.146 ( ± 6.13) 197.612 ( ± 11.43) 153.099 ( ± 29.54) 0.0016 41.259 ( ± 3.60) 49.071 ( ± 6.33) 197.612 ( ± 11.43) 124.605 ( ± 24.15) 0.0018 42.622 ( ± 4.14) 48.979 ( ± 6.41) 197.612 ( ± 11.43) 122.137 ( ± 21.69) 0.002 41.014 ( ± 3.35) 49.276 ( ± 6.16) 197.612 ( ± 11.43) 135.502 ( ± 23.33) 51 T able A70 : RMSE ( µ b ) Blink State Probability CRJMCMC F actorial HMM Monotonic MAP Sequen tial MAP 0.0002 1.960 ( ± 0.15) 102.221 ( ± 19.60) 125.419 ( ± 7.82) 48.418 ( ± 8.33) 0.0004 1.975 ( ± 0.15) 77.794 ( ± 17.01) 125.419 ( ± 7.82) 60.742 ( ± 13.25) 0.0006 2.026 ( ± 0.16) 88.235 ( ± 21.27) 125.419 ( ± 7.82) 60.017 ( ± 13.92) 0.0008 1.961 ( ± 0.15) 91.385 ( ± 17.96) 125.419 ( ± 7.82) 55.550 ( ± 12.76) 0.001 1.941 ( ± 0.15) 97.280 ( ± 20.23) 125.419 ( ± 7.82) 58.025 ( ± 11.46) 0.0012 1.996 ( ± 0.16) 96.187 ( ± 21.66) 125.419 ( ± 7.82) 48.571 ( ± 8.75) 0.0014 2.008 ( ± 0.20) 100.101 ( ± 20.06) 125.419 ( ± 7.82) 52.208 ( ± 9.27) 0.0016 1.990 ( ± 0.16) 92.314 ( ± 18.58) 125.419 ( ± 7.82) 51.962 ( ± 9.26) 0.0018 1.988 ( ± 0.17) 89.128 ( ± 16.08) 125.419 ( ± 7.82) 63.241 ( ± 13.25) 0.002 1.968 ( ± 0.15) 106.701 ( ± 20.75) 125.419 ( ± 7.82) 56.098 ( ± 10.27) T able A71 : RMSE ( σ 2 f ) Blink State Probability CRJMCMC Monotonic MAP Sequen tial MAP 0.0002 149.324 ( ± 11.26) 1.00e+5 ( ± 1.05e+4) 958.005 ( ± 60.94) 0.0004 155.707 ( ± 11.08) 1.00e+5 ( ± 1.05e+4) 944.689 ( ± 59.55) 0.0006 159.297 ( ± 11.19) 1.00e+5 ( ± 1.05e+4) 924.086 ( ± 58.32) 0.0008 169.885 ( ± 11.76) 1.00e+5 ( ± 1.05e+4) 928.404 ( ± 58.07) 0.001 171.152 ( ± 11.31) 1.00e+5 ( ± 1.05e+4) 925.448 ( ± 59.53) 0.0012 175.570 ( ± 11.56) 1.00e+5 ( ± 1.05e+4) 919.007 ( ± 57.27) 0.0014 183.315 ( ± 12.39) 1.00e+5 ( ± 1.05e+4) 908.008 ( ± 57.01) 0.0016 185.828 ( ± 13.31) 1.00e+5 ( ± 1.05e+4) 888.744 ( ± 55.36) 0.0018 200.396 ( ± 15.97) 1.00e+5 ( ± 1.05e+4) 889.010 ( ± 56.27) 0.002 201.165 ( ± 15.73) 1.00e+5 ( ± 1.05e+4) 889.032 ( ± 55.96) T able A72 : RMSE ( σ 2 b ) Blink State Probability CRJMCMC Monotonic MAP Sequen tial MAP 0.0002 5102.806 ( ± 649.52) 1.05e+5 ( ± 1.05e+4) 4.30e+4 ( ± 6.55e+3) 0.0004 5101.180 ( ± 649.80) 1.05e+5 ( ± 1.05e+4) 4.30e+4 ( ± 6.55e+3) 0.0006 5119.167 ( ± 649.40) 1.05e+5 ( ± 1.05e+4) 4.30e+4 ( ± 6.55e+3) 0.0008 5117.055 ( ± 647.88) 1.05e+5 ( ± 1.05e+4) 4.30e+4 ( ± 6.55e+3) 0.001 5135.074 ( ± 648.51) 1.05e+5 ( ± 1.05e+4) 4.30e+4 ( ± 6.55e+3) 0.0012 5244.069 ( ± 673.46) 1.05e+5 ( ± 1.05e+4) 4.30e+4 ( ± 6.55e+3) 0.0014 5271.402 ( ± 730.17) 1.05e+5 ( ± 1.05e+4) 4.32e+4 ( ± 6.58e+3) 0.0016 5373.979 ( ± 749.55) 1.05e+5 ( ± 1.05e+4) 4.33e+4 ( ± 6.60e+3) 0.0018 5374.809 ( ± 707.63) 1.05e+5 ( ± 1.05e+4) 4.30e+4 ( ± 6.57e+3) 0.002 5185.132 ( ± 649.01) 1.05e+5 ( ± 1.05e+4) 4.31e+4 ( ± 6.57e+3) 52 S11.7 V arying Blink State Duration T able A73 : Accuracy Blink State Duration CRJMCMC F actorial HMM Monotonic MAP Sequential MAP 2 0.984 ( ± 3.54e-3) 0.830 ( ± 3.10e-2) 0.888 ( ± 1.22e-2) 0.909 ( ± 1.98e-2) 3 0.983 ( ± 3.98e-3) 0.810 ( ± 3.33e-2) 0.883 ( ± 1.20e-2) 0.915 ( ± 1.81e-2) 4 0.983 ( ± 3.57e-3) 0.812 ( ± 3.55e-2) 0.888 ( ± 1.19e-2) 0.901 ( ± 1.99e-2) 5 0.984 ( ± 2.98e-3) 0.814 ( ± 3.33e-2) 0.875 ( ± 1.24e-2) 0.902 ( ± 1.98e-2) 6 0.984 ( ± 2.96e-3) 0.833 ( ± 3.14e-2) 0.883 ( ± 1.19e-2) 0.909 ( ± 1.96e-2) 7 0.984 ( ± 2.80e-3) 0.815 ( ± 3.27e-2) 0.889 ( ± 1.15e-2) 0.910 ( ± 1.94e-2) 8 0.984 ( ± 3.01e-3) 0.825 ( ± 3.18e-2) 0.883 ( ± 1.15e-2) 0.923 ( ± 1.66e-2) 9 0.986 ( ± 3.41e-3) 0.801 ( ± 3.51e-2) 0.876 ( ± 1.18e-2) 0.904 ( ± 2.04e-2) 10 0.983 ( ± 3.51e-3) 0.790 ( ± 3.53e-2) 0.868 ( ± 1.16e-2) 0.912 ( ± 1.85e-2) T able A74 : Precision Blink State Duration CRJMCMC F actorial HMM Monotonic MAP Sequential MAP 2 0.991 ( ± 1.96e-3) 0.971 ( ± 1.04e-2) 0.898 ( ± 1.34e-2) 0.940 ( ± 1.81e-2) 3 0.992 ( ± 1.46e-3) 0.951 ( ± 1.76e-2) 0.894 ( ± 1.28e-2) 0.939 ( ± 1.80e-2) 4 0.990 ( ± 1.81e-3) 0.959 ( ± 1.41e-2) 0.896 ( ± 1.25e-2) 0.926 ( ± 2.11e-2) 5 0.989 ( ± 2.11e-3) 0.965 ( ± 9.82e-3) 0.888 ( ± 1.33e-2) 0.924 ( ± 2.18e-2) 6 0.992 ( ± 1.41e-3) 0.958 ( ± 1.37e-2) 0.883 ( ± 1.31e-2) 0.948 ( ± 1.70e-2) 7 0.989 ( ± 3.28e-3) 0.962 ( ± 1.48e-2) 0.895 ( ± 1.24e-2) 0.938 ( ± 1.88e-2) 8 0.991 ( ± 1.37e-3) 0.958 ( ± 1.81e-2) 0.899 ( ± 1.24e-2) 0.937 ( ± 1.89e-2) 9 0.993 ( ± 1.44e-3) 0.961 ( ± 1.09e-2) 0.883 ( ± 1.40e-2) 0.944 ( ± 1.74e-2) 10 0.992 ( ± 1.49e-3) 0.960 ( ± 1.49e-2) 0.877 ( ± 1.30e-2) 0.946 ( ± 1.73e-2) T able A75 : Sensitivity Blink State Duration CRJMCMC F actorial HMM Monotonic MAP Sequential MAP 2 0.987 ( ± 4.35e-3) 0.802 ( ± 4.00e-2) 0.941 ( ± 1.43e-2) 0.908 ( ± 2.58e-2) 3 0.985 ( ± 5.53e-3) 0.794 ( ± 4.31e-2) 0.943 ( ± 1.28e-2) 0.919 ( ± 2.37e-2) 4 0.986 ( ± 4.49e-3) 0.787 ( ± 4.48e-2) 0.946 ( ± 1.32e-2) 0.896 ( ± 2.71e-2) 5 0.988 ( ± 3.51e-3) 0.776 ( ± 4.50e-2) 0.926 ( ± 1.59e-2) 0.895 ( ± 2.72e-2) 6 0.986 ( ± 3.72e-3) 0.808 ( ± 4.24e-2) 0.953 ( ± 1.22e-2) 0.900 ( ± 2.67e-2) 7 0.988 ( ± 3.04e-3) 0.786 ( ± 4.19e-2) 0.948 ( ± 1.29e-2) 0.906 ( ± 2.61e-2) 8 0.986 ( ± 3.71e-3) 0.792 ( ± 4.33e-2) 0.932 ( ± 1.38e-2) 0.925 ( ± 2.27e-2) 9 0.988 ( ± 4.06e-3) 0.770 ( ± 4.42e-2) 0.943 ( ± 1.48e-2) 0.902 ( ± 2.68e-2) 10 0.985 ( ± 4.45e-3) 0.757 ( ± 4.55e-2) 0.936 ( ± 1.40e-2) 0.899 ( ± 2.62e-2) 53 T able A76 : Sp ecificity Blink State Duration CRJMCMC F actorial HMM Monotonic MAP Sequential MAP 2 0.965 ( ± 6.04e-3) 0.929 ( ± 2.02e-2) 0.738 ( ± 2.94e-2) 0.918 ( ± 1.42e-2) 3 0.967 ( ± 5.80e-3) 0.894 ( ± 3.16e-2) 0.722 ( ± 2.93e-2) 0.917 ( ± 1.46e-2) 4 0.965 ( ± 6.47e-3) 0.914 ( ± 2.46e-2) 0.726 ( ± 2.77e-2) 0.916 ( ± 1.40e-2) 5 0.963 ( ± 6.96e-3) 0.918 ( ± 2.31e-2) 0.711 ( ± 3.01e-2) 0.918 ( ± 1.47e-2) 6 0.965 ( ± 6.48e-3) 0.911 ( ± 2.43e-2) 0.695 ( ± 2.87e-2) 0.924 ( ± 1.39e-2) 7 0.964 ( ± 7.26e-3) 0.916 ( ± 2.42e-2) 0.714 ( ± 2.90e-2) 0.918 ( ± 1.41e-2) 8 0.968 ( ± 5.72e-3) 0.912 ( ± 2.61e-2) 0.723 ( ± 2.81e-2) 0.916 ( ± 1.35e-2) 9 0.969 ( ± 5.84e-3) 0.911 ( ± 2.29e-2) 0.679 ( ± 3.08e-2) 0.914 ( ± 1.37e-2) 10 0.966 ( ± 7.31e-3) 0.912 ( ± 2.83e-2) 0.672 ( ± 2.98e-2) 0.931 ( ± 1.02e-2) T able A77 : Cohen’s Kappa Blink State Duration CRJMCMC F actorial HMM Monotonic MAP Sequential MAP 2 0.972 ( ± 5.46e-3) 0.752 ( ± 4.18e-2) 0.796 ( ± 2.23e-2) 0.858 ( ± 2.76e-2) 3 0.972 ( ± 5.65e-3) 0.730 ( ± 4.47e-2) 0.788 ( ± 2.18e-2) 0.871 ( ± 2.48e-2) 4 0.970 ( ± 5.58e-3) 0.734 ( ± 4.65e-2) 0.798 ( ± 2.09e-2) 0.849 ( ± 2.67e-2) 5 0.972 ( ± 4.52e-3) 0.736 ( ± 4.43e-2) 0.771 ( ± 2.21e-2) 0.849 ( ± 2.74e-2) 6 0.972 ( ± 4.72e-3) 0.758 ( ± 4.29e-2) 0.779 ( ± 2.16e-2) 0.857 ( ± 2.73e-2) 7 0.971 ( ± 4.85e-3) 0.730 ( ± 4.38e-2) 0.795 ( ± 2.03e-2) 0.857 ( ± 2.71e-2) 8 0.972 ( ± 4.83e-3) 0.743 ( ± 4.26e-2) 0.778 ( ± 2.16e-2) 0.877 ( ± 2.31e-2) 9 0.974 ( ± 4.96e-3) 0.723 ( ± 4.40e-2) 0.762 ( ± 2.26e-2) 0.849 ( ± 2.84e-2) 10 0.971 ( ± 5.42e-3) 0.700 ( ± 4.66e-2) 0.747 ( ± 2.26e-2) 0.859 ( ± 2.58e-2) T able A78 : RMSE (Intensit y) Blink State Duration CRJMCMC F actorial HMM Monotonic MAP Sequen tial MAP 2 105.515 ( ± 9.57) 200.591 ( ± 27.15) 341.053 ( ± 28.91) 212.780 ( ± 16.93) 3 107.537 ( ± 10.00) 209.636 ( ± 30.57) 348.783 ( ± 27.68) 218.256 ( ± 17.63) 4 106.911 ( ± 10.36) 201.637 ( ± 29.06) 355.994 ( ± 29.44) 224.195 ( ± 19.00) 5 110.600 ( ± 10.35) 201.830 ( ± 26.72) 361.472 ( ± 28.82) 228.255 ( ± 17.50) 6 111.810 ( ± 10.07) 213.978 ( ± 32.79) 350.483 ( ± 27.32) 218.766 ( ± 17.63) 7 110.140 ( ± 10.38) 203.793 ( ± 28.22) 336.454 ( ± 26.22) 214.781 ( ± 16.58) 8 108.431 ( ± 9.75) 192.753 ( ± 27.02) 354.212 ( ± 26.01) 219.265 ( ± 17.24) 9 100.538 ( ± 9.13) 182.187 ( ± 22.97) 353.465 ( ± 27.65) 221.569 ( ± 17.67) 10 105.797 ( ± 9.40) 199.145 ( ± 28.89) 370.022 ( ± 27.99) 222.148 ( ± 17.65) T able A79 : Absolute Error ( µ f ) Blink State Duration CRJMCMC F actorial HMM Monotonic MAP Sequential MAP 2 35.688 ( ± 3.57) 47.850 ( ± 6.30) 197.612 ( ± 11.43) 99.386 ( ± 18.02) 3 34.845 ( ± 3.37) 47.711 ( ± 6.37) 197.612 ( ± 11.43) 105.767 ( ± 21.93) 4 36.025 ( ± 3.58) 47.994 ( ± 6.15) 197.612 ( ± 11.43) 141.004 ( ± 30.40) 5 36.908 ( ± 3.58) 49.173 ( ± 6.36) 197.612 ( ± 11.43) 124.222 ( ± 23.79) 6 35.867 ( ± 3.48) 48.088 ( ± 6.47) 197.612 ( ± 11.43) 126.927 ( ± 26.47) 7 37.568 ( ± 4.30) 47.304 ( ± 6.12) 197.612 ( ± 11.43) 111.278 ( ± 18.91) 8 35.548 ( ± 3.46) 47.485 ( ± 6.57) 197.612 ( ± 11.43) 103.568 ( ± 21.63) 9 34.641 ( ± 3.47) 46.069 ( ± 6.13) 197.612 ( ± 11.43) 107.485 ( ± 19.53) 10 35.790 ( ± 3.43) 46.127 ( ± 6.06) 197.612 ( ± 11.43) 109.321 ( ± 20.15) 54 T able A80 : Absolute Error ( µ b ) Blink State Duration CRJMCMC F actorial HMM Monotonic MAP Sequential MAP 2 2.012 ( ± 0.16) 89.628 ( ± 17.43) 125.419 ( ± 7.82) 58.818 ( ± 10.83) 3 1.987 ( ± 0.16) 110.150 ( ± 24.30) 125.419 ( ± 7.82) 48.262 ( ± 9.18) 4 1.989 ( ± 0.15) 102.997 ( ± 22.53) 125.419 ( ± 7.82) 56.538 ( ± 12.30) 5 2.031 ( ± 0.16) 91.435 ( ± 18.86) 125.419 ( ± 7.82) 59.323 ( ± 10.29) 6 1.935 ( ± 0.16) 109.195 ( ± 25.12) 125.419 ( ± 7.82) 55.472 ( ± 9.96) 7 1.977 ( ± 0.16) 102.141 ( ± 21.51) 125.419 ( ± 7.82) 66.811 ( ± 12.87) 8 1.972 ( ± 0.15) 74.796 ( ± 15.59) 125.419 ( ± 7.82) 46.925 ( ± 7.67) 9 2.037 ( ± 0.16) 69.739 ( ± 11.03) 125.419 ( ± 7.82) 60.507 ( ± 11.91) 10 2.062 ( ± 0.17) 97.767 ( ± 21.07) 125.419 ( ± 7.82) 56.165 ( ± 10.37) T able A81 : Absolute Error ( σ 2 f ) Blink State Duration CRJMCMC Monotonic MAP Sequen tial MAP 2 166.913 ( ± 13.31) 1.00e+5 ( ± 1.05e+4) 940.641 ( ± 59.90) 3 164.881 ( ± 13.31) 1.00e+5 ( ± 1.05e+4) 933.875 ( ± 59.36) 4 167.931 ( ± 12.40) 1.00e+5 ( ± 1.05e+4) 928.549 ( ± 59.50) 5 173.295 ( ± 13.53) 1.00e+5 ( ± 1.05e+4) 936.075 ( ± 60.43) 6 177.134 ( ± 16.60) 1.00e+5 ( ± 1.05e+4) 925.992 ( ± 58.86) 7 176.564 ( ± 14.61) 1.00e+5 ( ± 1.05e+4) 935.868 ( ± 59.48) 8 168.515 ( ± 14.32) 1.00e+5 ( ± 1.05e+4) 929.535 ( ± 59.12) 9 166.059 ( ± 15.71) 1.00e+5 ( ± 1.05e+4) 937.670 ( ± 60.72) 10 178.308 ( ± 17.90) 1.00e+5 ( ± 1.05e+4) 935.167 ( ± 59.96) T able A82 : Absolute Error ( σ 2 b ) Blink State Duration CRJMCMC Monotonic MAP Sequen tial MAP 2 5143.676 ( ± 649.71) 1.05e+5 ( ± 1.05e+4) 4.30e+4 ( ± 6.55e+3) 3 5106.216 ( ± 648.00) 1.05e+5 ( ± 1.05e+4) 4.30e+4 ( ± 6.55e+3) 4 5162.335 ( ± 649.91) 1.05e+5 ( ± 1.05e+4) 4.30e+4 ( ± 6.55e+3) 5 5157.008 ( ± 652.04) 1.05e+5 ( ± 1.05e+4) 4.31e+4 ( ± 6.57e+3) 6 5188.974 ( ± 652.42) 1.05e+5 ( ± 1.05e+4) 4.31e+4 ( ± 6.57e+3) 7 5247.210 ( ± 664.89) 1.05e+5 ( ± 1.05e+4) 4.30e+4 ( ± 6.55e+3) 8 5132.078 ( ± 649.30) 1.05e+5 ( ± 1.05e+4) 4.31e+4 ( ± 6.57e+3) 9 5151.273 ( ± 647.08) 1.05e+5 ( ± 1.05e+4) 4.30e+4 ( ± 6.55e+3) 10 5101.915 ( ± 650.55) 1.05e+5 ( ± 1.05e+4) 4.30e+4 ( ± 6.55e+3) 55
Original Paper
Loading high-quality paper...
Comments & Academic Discussion
Loading comments...
Leave a Comment