Visual Insights into Agentic Optimization of Pervasive Stream Processing Services
Processing sensory data close to the data source, often involving Edge devices, promises low latency for pervasive applications, like smart cities. This commonly involves a multitude of processing services, executed with limited resources; this setup…
Authors: Boris Sedlak, Víctor Casamayor Pujol, Schahram Dustdar
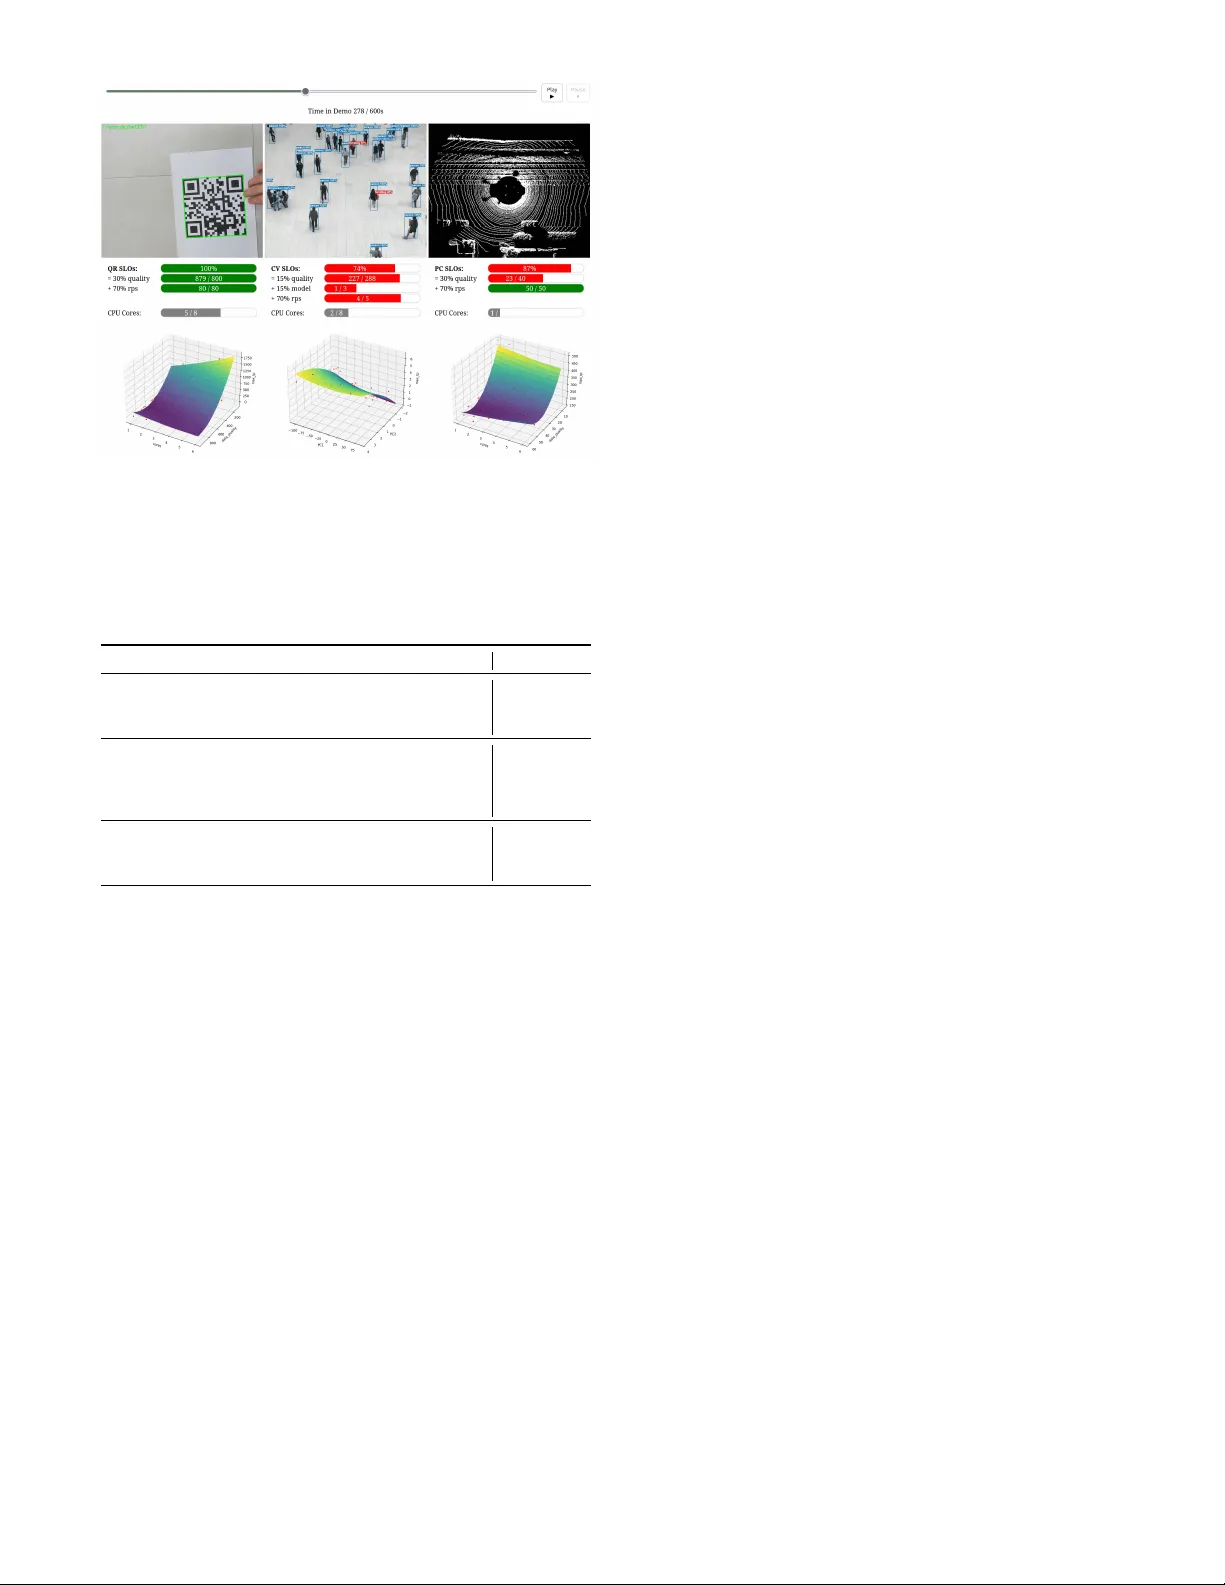
Accepted for publication at IEEE Percom Demo T rack 2026 V isual Insights into Agentic Optimization of Perv asi v e Stream Processing Services Boris Sedlak ∗ , V ´ ıctor Casamayor Pujol ∗ , Schahram Dustdar ∗ † ∗ Distributed Intelligence and Systems-Engineering Group, Universitat Pompeu Fabra, Barcelona, Spain Email: { boris.sedlak, victor .casamayor , schahram.dustdar } @upf.edu † Distributed Systems Group, TU W ien, V ienna, Austria Abstract —Processing sensory data close to the data sour ce— often in volving Edge de vices—promises lo w latency f or pervasiv e applications, like smart cities. This commonly inv olves a multi- tude of processing services, executed with limited resour ces; this setup faces three pr oblems: first, the application demand and the resour ce av ailability fluctuate, so the service execution must scale dynamically to sustain processing r equirements (e.g ., latency); second, each service permits differ ent actions to adjust its oper - ation, so they require individual scaling policies; third, without a higher -lev el mediator , services would cannibalize any resour ces of services co-located on the same device. This demo first presents a platf orm f or context-awar e autoscaling of stream processing services that allows de velopers to monitor and adjust the ser vice execution acr oss multiple service-specific parameters. W e then connect a scaling agent to these interfaces that gradually builds an understanding of the processing en vironment by exploring each service’ s action space; the agent then optimizes the service execution according to this knowledge. Participants can re visit the demo contents as video summary and introductory poster , or build a custom agent by extending the artifact repository . Index T erms —Stream Processing, A utoscaling, Service Level Objectives, Elasticity , Edge Computing, Regression Analysis I . I N T RO D U C T I O N Sensory data is used for fueling and optimizing pervasi ve applications, from autonomous driving [1] to smart cities [2]. This is supported by the growing computational po wer of embedded devices and Edge servers that support low-latency processing close to the data source. The precise requirements how this processing must be done are specified through Service Lev el Objectiv es (SLOs); real-time applications—like point cloud mapping [3]—might specify a maximum target latency . Y et, resources on Edge serv ers are limited, whereas client demand is fluctuating; this inevitably leads to situations where resources do not suf fice to satisfy SLOs across multiple com- peting clients and applications. T o ensure SLO fulfillment, au- toscaling solutions—like Kubernetes [4]—have specialized in adjusting applications according to varying demand; howe ver , the default mechanism is provisioning additional resources. Also, it cannot be assumed that computation can be of floaded to nearby devices [5]. As the context changes dynamically and services cannot rely on predefined mechanisms (e.g., offloading or resource scaling), the processing services must autonomously find actions that optimize their SLO fulfillment. T o facilitate the transition to flexible and context-a ware autoscaling of processing services, we developed a two-fold approach [6]: MUD AP—our Multi-Dimensional Autoscaling Platform—supports fine-grained adjustments of the service ex ecution and the allocated resources; notably , this permits dynamic adjustments to service-specific parameters, like the size of Machine Learning (ML) models or input tensors. Sec- ond, we presented RASK, a scaling agent that uses Regression Analysis of Structural Kno wledge to interpret the effect of dif- ferent parameter assignments on the SLO fulfillment, and then infer optimal scaling actions. T ogether , they enable flexible processing services that scale dif ferent parameters according to the conte xt—a beha vior called multi-dimensional elasticity [7]. Thus, services can trade off less critical aspects (e.g., client experience) to sustain critical SLOs (e.g., latency). This demo first introduces the architecture of MUD AP and RASK; next, we design a scaling agent that uses these inter- faces to optimize the performance of three stream processing services, co-located on an Edge device. T o provide insights into this operation, we visualize the agent’ s understanding of the processing en vironment and show how its internal model and the SLO fulfillment improve parallel. W e complement this with an introductory poster [8] for quickly con ve ying the high-lev el idea; additionally , we host the demo application at a public URL, provide a video summary [9] to it, and share an artifact repository [10] for revisiting the demo contents. I I . S O L U T I O N A R C H I T E C T U R E In the following, we present an architecture for context- aware autoscaling of stream processing services, in volving two components: MUD AP and RASK. MUD AP exposes service-specific parameters for fine-grained adjustments of the processing en vironment, while RASK uses the interfaces for interpreting and optimizing the environment. Later , we visualize the RASK agent’ s internal models and show how increasingly accurate world models improve decision-making. A. Autoscaling Platform (MUDAP) The MUD AP platform is introduced in Figure 1 in four steps: 1 It streams and buf fers sensory data (e.g., video frames) at a nearby device, where multiple containerized processing services run. 2 The data is processed, e.g., by running video inference. 3 It continuously exports processing metrics to a time-series DB; this includes metrics about service ex ecutions (e.g., latency or data quality ) and the associated resources (e.g., CPU limit ). These variables describe a ser- vice’ s state space; those variable that can be directly adjusted / service ? quality = X / resources ? cores = Y Service Container 1 Time-Series DB CPU RAM Buffer Processing endpoint param assignment Service Container n metrics query service states scale service n Data Sources metrics API Description Scaling Agent scale service 1 2 1 3 4 Fig. 1: Architecture of the MUDAP platform [6]: sensor data is 1 buf fered and 2 processed by containerized services; 3 service and container states (i.e., processing metrics) are collected in a time-series DB. Lastly , 4 a scaling agent interprets these states, develops a policy , and adjusts service configurations and their containers through a REST API. Time-Series DB query service states scale n services V ariable Relations T ab. Metrics service cores latency QR-1 2.8 13ms CV -1 5.2 80ms Reg. Functions Numerical Solver Model Size Cores min max Parameter Bounds Latency Throughput Service Level Obj. train input 1 2 Model Size = 2 Cores = 3.2 infer n parameter assignments Regression Analysis of Structural Knowledge 3 Fig. 2: Conceptual sequence of RASK algorithm [6]: 1 create a tabular structure from time-series data and train regression functions; 2 supply functions, SLOs, and parameter bounds to numerical solver; 3 optimize parameter assignments for all monitored services and adjust v alues through MUD AP API. form the action space. For example, video resolution (i.e., data quality ) can be scaled dynamically . T o inv oke actions for a service (e.g., change its data quality ) we offer a REST API in the container . 4 It optimizes service ex ecution by coupling an agent to these interfaces. This allows arbitrary implementations of autoscalers; in our case, the RASK agent. B. Autoscaling Agent (RASK) T o optimize the ex ecution of pervasi ve stream processing services, we present RASK alongside Figure 2 in three steps: 1 The agent models the behavior of the processing en viron- ment by fitting regression functions, using tabular metrics from the time-series data and domain knowledge about variable relations 1 . This tells the agent how its interventions (e.g., changing data quality or r esour ces ) affect processing (e.g., infer ence latency ). 2 F or all services executed on the device, the agent collects the regression models, their SLOs, and the parameter bounds. 3 The agent combines these factors into a global optimization function, uses a numerical solver to infer parameter assignments for all service, and adjusts the values through the API provided by MUD AP . By using this architecture, autonomous scaling agents can optimize the execution across multiple co-located processing services, thus supporting decentralized and robust operation. In the demo setup we will bring up more details on how the agent explores the solution space to dev elop an accurate understanding of the variable relations. I I I . D E M O C O N T E N T S The demo contains a multitude of contents that allow the participants to interact with it during the demo session, as well as afterw ards. In the following, we present the contents in the same order in which participants should consume them. A. Intr oductory P oster Ideally , participants read the introductory poster [8] before switching to the visual demo of the agentic service optimiza- tion. Thus, they are already roughly aware of the problem domain, the solution’ s objecti ves and architecture, and the organization of the visual demo contents. Also, they can read at their own pace, ask questions that come up, or fall back to the poster when in doubt of the presented visual contents. B. V isual Demo of Operation Afterward, participants move to the visual demo of the scaling agent’ s operation, with three main parts: 1) Experimental Setup: The visual demo covers an au- toscaling agent that optimizes the ex ecution of three stream processing services: we implement a QR code reader, a Computer V ision (CV) service using Y olov8, and a Point Cloud (PC) mapper; Figure 3 shows an exemplary service output in the top row . T o achiev e SLO fulfillment, the scaling agent adjusts the resource allocation between services, and each service’ s parameters. As shown in T able I, variables have viable bounds and a step size. F or all three services, the agent can adjust the data quality and the allocated CPU resources from a limited global budget of 8 cores ; the CV service also allows changing the Y olov8 model size . Lastly , the completion rate of processed items cannot be directly set, but depends on the other variables—this is the domain knowledge we supply to the agent. According to variables’ importance to the system operation, we assign SLO thresholds and weights to them. The demo covers a duration of 600s; in the first 300s, the scaling agent randomly explores the solution space to create an understanding of the processing en vironment, in the second 300s, the agent exploits the best configurations known. The 1 For simplicity , we supply v ariable relations according to expert kno wledge. Howe ver, the relation can equally be extracted through structural learning. Fig. 3: Snapshot of the visual demo: For three processing services, we display their current service output, their SLO fulfillment, and the regression model that the RASK agent learns through interventions with the autoscaling platform. T ABLE I: Service variables for the QR, CV , and PC service; SLO targets and their w eights (i.e., importance) included. Service V ariable Descript. Bounds Step SLO w QR cor es CPU quota (0 , 8) float – – data quality Image size [10 2 , 10 3 ] ± 1 ≥ 800 0.5 completion Rate finish [0 , 1] – ≥ 1 . 0 1.0 CV cor es CPU quota (0 , 8) float – – data quality Image size [128 , 320] ± 32 ≥ 288 0.2 model size Y olov8[n/.] [1 , 4] ± 1 ≥ 3 0.2 completion Rate finish [0 , 1] – ≥ 1 1.0 PC cor es CPU quota (0 , 8) float – – data quality Lidar range [6 , 60] ± 1 ≥ 40 0.5 completion Rate finish [0 , 1] – ≥ 1 1.0 agent operates in cycles—e very 10s, it collects metrics, builds the regression models, and infers an autoscaling policy . 2) V isual Animation: Figure 3 shows the demo screen: on the top, the current time in the experiment and the control for the playback are displayed. T o create a fluent animation, the playback is accelerated by × 10 ; hence, the entire demo lasts 60s, and every second the configuration and SLO ful- fillment are updated. Each column shows the service output, the SLO fulfillment, and the agent’ s regression model—its understanding of how to achieve high completion by adjusting the a v ailable parameters. Interested readers can access the public demo application [11] to track the agent’ s progress. 3) Results: The e xperimental demo shows ho w operating the RASK agent for 300s—equiv alent to 30 interventions in the en vironment—suf fices to improves global SLO fulfillment from 56% to 98%. This is considerably sample-efficient when compared with contemporary RL approaches, like Q-learning. In the later 300s, the agent k eeps stable, high SLO fulfillment by adjusting the parameters along the Pareto front of optimal assignments; this behavior is also tracked in the video. C. Explanatory V ideo The video summary [9] contains a technical explanation of the paper’ s methodology using the introductory poster , and a showcase of the visual demo progress. This allo ws conference participants and other researchers to revisit the contents. D. Artifact Repository The artifact repository [10] (published under CC BY -NC- SA license) in vites researchers to reuse the existing processing en vironment—including the three services—and couple their custom implementation of a scaling agent. Also, to support researchers in creating their o wn autoscaling platform, it shows how to expose arbitrary scaling parameters for their services. I V . C O N C L U S I O N This paper presented a solution for context-a ware autoscal- ing of stream processing applications under strict resource limits. Our approach lets scaling agents explore services’ action space, build a model of the processing en vironment, and gradually optimize the service execution. Scaling agents run directly on the Edge device, thus increasing the autonomy and robustness of pervasi ve processing services. W e created a visual demonstration of the execution of our scaling agent: in under 30 iterations, it dev elops an accurate en vironmental model, fulfilling SLOs of three co-located services o ver 98%. W e accompany the demo with an introductory poster, an explanation video, and an artifact repository—researchers can revisit and extend these contents at their own pace. A C K N O W L E D G M E N T This work is partially supported by CNS2023-144359 and the European Union NextGenerationEU/PR TR under MI- CIU/AEI/10.13039/501100011033. R E F E R E N C E S [1] L. Liu, C. Chen, Q. Pei, S. Maharjan, and Y . Zhang, “V ehicular edge computing and networking: A survey , ” Mobile networks and applica- tions , vol. 26, no. 3, pp. 1145–1168, 2021. [2] M. De Donno, K. T ange, and N. Dragoni, “F oundations and Evolution of Modern Computing Paradigms: Cloud, IoT, Edge, and Fog, ” IEEE Access , vol. 7, pp. 150 936–150 948, 2019. [3] Z. Liu, Q. Li, X. Chen, C. W u, S. Ishihara, J. Li, and Y . Ji, “Point Cloud V ideo Streaming: Challenges and Solutions, ” IEEE Network , vol. 35, no. 5, pp. 202–209, Sep. 2021. [4] K. Labs. (2023, May). [Online]. A vailable: https://kubernetes.io/blog/ 2023/05/12/in- place- pod- resize- alpha/ [5] G. Quattrocchi, E. Incerto, R. Pinciroli, C. T rubiani, and L. Baresi, “ Au- toscaling Solutions for Cloud Applications Under Dynamic W orkloads, ” IEEE T ransactions on Services Computing , May 2024. [6] B. Sedlak, P . Raith, A. Morichetta, V . C. Pujol, and S. Dustdar, “Multi-Dimensional Autoscaling of Stream Processing Services on Edge Devices, ” Oct. 2025. [Online]. A vailable: https://arxi v .org/abs/ 2510.06882 [7] B. Sedlak, A. Morichetta, P . Raith, V . C. Pujol, and S. Dustdar , “T ow ards Multi-dimensional Elasticity for Pervasi ve Stream Processing Services, ” in 2025 IEEE P erCom W orkshops , 2025. [8] B. Sedlak, “Percom Demo Introductory Poster. ” [Online]. A vailable: https://borissedlak.github .io/uploads/poster- percom- demo.pdf [9] ——, “Explanation V ideo for Demo Showcase. ” [Online]. A vailable: https://borissedlak.github .io/percom- demo- 2026/video/ [10] ——, “Elastic W orkbench Artifact Repository. ” [Online]. A vailable: https://github .com/borissedlak/elastic- workbench/tree/percom- demo [11] ——, “Elastic W orkbench Public Demo Application. ” [Online]. A vailable: https://borissedlak.github.io/percom- demo- 2026/
Original Paper
Loading high-quality paper...
Comments & Academic Discussion
Loading comments...
Leave a Comment