Quantifying the limits of human athletic performance: A Bayesian analysis of elite decathletes
Because the decathlon tests many facets of athleticism, including sprinting, throwing, jumping, and endurance, many consider it to be the ultimate test of athletic ability. On this view, estimating the maximal decathlon score and understanding what i…
Authors: ** - *주 저자*: **
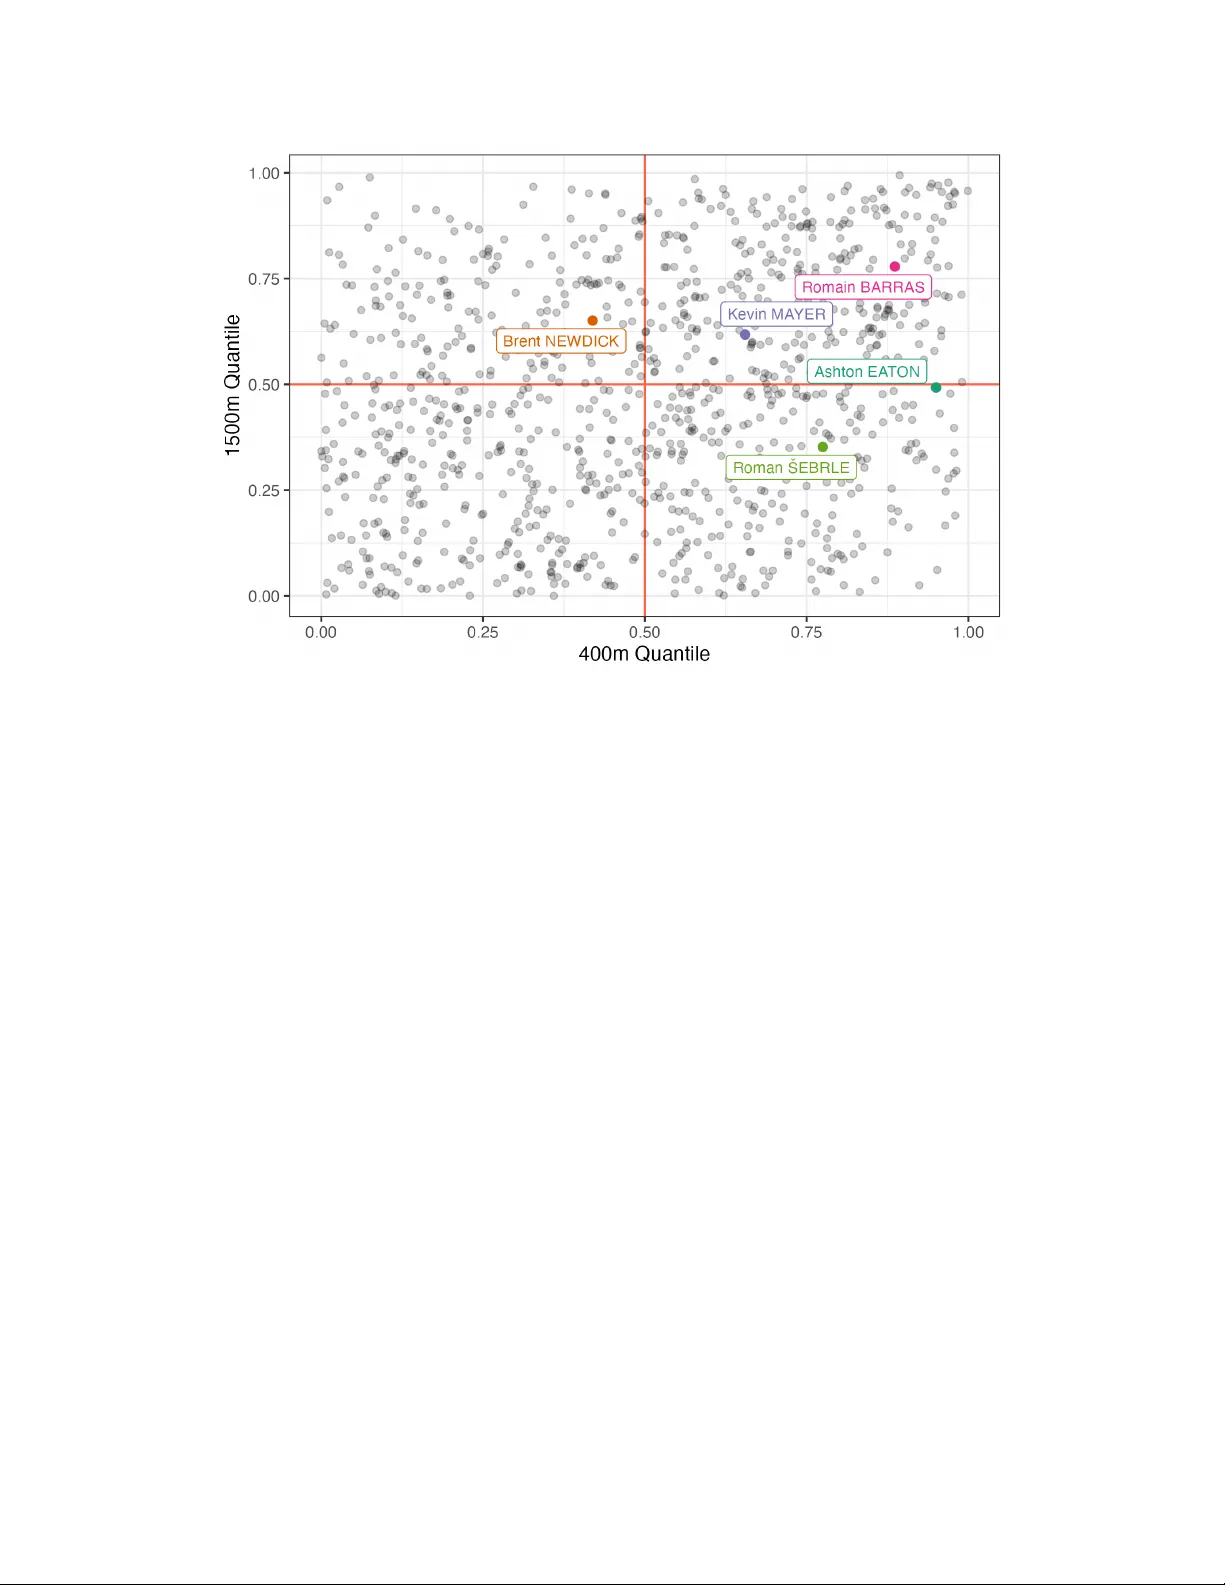
Quan tifying the limits of h uman athletic p erformance: A Ba y esian analysis of elite decathletes P aul-Hieu V. Nguy en ∗ James M. Smoliga † Ben ton Lindaman ‡ Sameer K. Deshpande § F ebruary 20, 2026 Abstract Because the decathlon tests man y facets of athleticism, including sprinting, thro wing, jump- ing, and endurance, man y consider it to b e the ultimate test of athletic ability . On this view, estimating the maximal decathlon score and understanding what it w ould take to ach ieve that score provides insight into the upp er limits of h uman athletic p oten tial. T o this end, w e de- v elop a Bay esian comp osition mo del for forecasting how individual athletes p erform in each of the 10 decathlon ev ents of time. Besides capturing p oten tial non-linear temp oral trends in p erformance, our mo del carefully captures the dep endence betw een p erformance in an even t and all preceding even ts. Using our mo del, we can simulate and ev aluate the distribution of the maximal p ossible scores and identify profiles of athletes who could realistically attain scores approac hing this limit. 1 In tro duction 1.1 Motiv ation: realistic max decathlon score The decathlon is a com bined track-and-field even t consisting of ten disciplines spread ov er t wo da ys. These even ts test multiple facets of athletic abilit y , including sprinting, jumping, throwing, tec hnique, and endurance. The decathlon is widely regarded as the ultimate test of athletic ability due to its div ersity of even ts and demand on b oth the b o dy and mind. The order of ev ents is consisten t for each decathlon. Day one emphasizes explosiveness — athletes comp ete in the 100m, long jump (LJ), shot put (SP), high jump (HJ), and 400m — while day tw o fo cuses on tec hnique and endurance, featuring the 110m hurdles, discus throw (DT), p ole v ault (PV), jav elin throw (JT), and 1500m. Decathletes earn p oints based on their p erformance in each discipline based on a scoring table dev elop ed by the W orld Athletics. Their ov erall decathlon score is the sum of each ev ent’s p oints. The scoring system is in tentionally designed to reward versatilit y: excelling in only a single discipline is insufficient to guarantee a top decathlon score. ∗ Departmen t of Statistics, Univ ersity of Wisconsin–Madison. pvnguyen5@wisc.edu † Departmen t of Rehabilitation Science, T ufts Universit y . james.smoliga@tufts.edu ‡ Departmen t of Rehabilitation Science, T ufts Universit y . benton.lindaman@tufts.edu § Departmen t of Statistics, Univ ersity of Wisconsin–Madison. sameer.deshpande@wisc.edu 1 More sp ecifically , let Y e measure an decathlete’s p erformance in even t e. F or track ev ents (i.e., the 100m, 400m, 110m h urdles, or 1500m), Y e is a time and smaller v alues of Y e corresp ond to b etter p erformance. F or all others (i.e., LJ, SP , HG, DT, PV, and JT), Y e is distance and larger v alues corresp ond to b etter p erformance. Decathletes earn a e − ( b e − Y e ) c e p oin ts for track ev ents and a e − ( Y e − b e ) c e p oin ts for all other even ts, where a e , b e , and c e are even t-specific co efficients (see T able A2 ). Figure 1: T op decathlon scores from 2001-2022. W e highlight the previous w orld record holders and scores. All decathlon p erformances greater than 8500 are included in this graph (n = 126). Figure 1 sho ws the b est decathlon scores from 2001 to 2022, with world records b y Roman ˇ Serble (2001), Ash ton Eaton (2012 and 2015), and Kevin May er (2019). These athletes differ in their ev ent-specific strengths, with ˇ Serble excelling in jumping even ts, Eaton excelling in sprinting, and Ma yer doing well across all disciplines. Ma y er broke the previous world record by roughly eight y p oin ts. Given these trends, w e ask whether a new p erformance threshold, say another eight y p oin t increase for a 9200 p oin t total, is realistically attainable, and what combination of even t abilities w ould b e required to achiev e 9200 p oints. Based on W orld A thletics scoring table, if a decathlete managed to attain w orld-record p erformance in eac h individual ev en t, their score w ould be 12,676. Of course, it is unrealistic to expect an athlete to perform at a w orld-record level in all ten disciplines. If, on the other hand, a decathlete managed to attain the highest score in eac h even t that has ever b e en observe d sp e cific al ly in a de c athlon , their score wou ld b e 10,669. Even this hypothetical is unrealistic as it requires a decathlete to attain p eak performance in all disciplines at exactly the same time. Intuitiv ely , w e w ould expect individual ev ent p erformance to v ary with age ( Villaro el et al. , 2011 ), with p erformance p eaking in different 2 ev ents at different times. Motiv ated by this, we build age curv es for individual decathlete’s p erformances in eac h discipline. By applying W orld A thletics’ scoring table to forecasted individual even t p erformances, we can predict an individual decathlete’s o verall score o ver the course of their career. T o capture the in ter-even t dep endencies, we sp ecifically fit c omp ositional age curves in whic h p erformance in one discipline dep ends not only on a non-linear function of age but also on p erformance in the im- mediately preceding disciplines. That is, our mo del for LJ p erformance dep ends on the observ ed 100m. W e tak e a Bay esian approach, which allows us to quantify and propagate uncertaint y ab out forecasted discipline p erformance through to final decathlon score in a coheren t fashion. 1.2 Related Literature The ma jority of prior researc h on the decathlon has been descriptiv e in nature fo cusing on clustering differen t disciplines ( Cox and Dunn , 2002 ; W o olf et al. , 2007 ; W alker and Caddigan , 2015 ) and creating archet yp es of decathletes who perform similarly across different discipline clusters ( Dziadek et al. , 2022 ; Kenny et al. , 2005 ; V an Damme et al. , 2002 ). Co x and Dunn ( 2002 ), for instance, applied hierarchical clustering to group decathlon even ts, broadly separating the track disciplines and field disciplines, with ja velin as an outlier. W o olf et al. ( 2007 ) used cluster analysis based on p ersonal b est p erformances of elite decathletes and suggest trac k athletes may ha ve a scoring adv antage. Other authors hav e p erformed principle comp onen t analysis (PCA) to analyze decathlon p erformance. Park and Zatsiorsky ( 2011 ) used PCA to iden tify laten t structures across ev ents while Dziadek et al. ( 2022 ) track ed ho w the structure of the decathlon shifts ov er an athlete’s career and found that athletes broadly shift from generalists to sp ecializing in particular even ts. Sev eral authors hav e attempted to iden tify trade-offs b et ween sp ecializing in different disciplines. V an Damme et al. ( 2002 ) found evidence of antagonistic traits, as w ell as tradeoffs b etw een sp ecialist and generalist phenotypes. Aoki et al. ( 2015 ) found ph ysiological differences b etw een athletes sp ecializing in sprin ting and jumping, though their analysis is not directly focused on the decathlon. W alker and Caddigan ( 2015 ); Kenn y et al. ( 2005 ) argue that there is no evidence of even t trade-offs when lo oking at the subp opulation of elite decathlon p erformers: top athletes p erform uniformly w ell across all even ts, and they found p ositive correlation b et ween all decathlon ev ents. F ewer studies ha ve explored the decathlon from a predictive standp oin t. Battles et al. ( 2025 ) use gamma regression to mo del an athlete’s career b est using early-career decathlon p erformances. They found that the results from PV, JT, LJ, and SP were esp ecially predictiv e of future p erfor- mance. T o the b est of our knowledge, Wimmer et al. ( 2011 ) is the only other Bay esian analysis of decathlon data. They fit semi-parametric laten t v ariable mo dels to cluster disciplines and mo del the effects of age, season, and year on decathlon results. Age-p erformance relationships ha ve also b een explored outside of the decathlon. Researchers hav e sough t to identify ages for p eak p erformance in ho c key ( Sch uck ers et al. , 2023 ; Brander et al. , 2014 ), baseball ( F air , 2008 ), golf ( Baker and McHale , 2023 ), and the triathlon ( Villaro el et al. , 2011 ). Griffin et al. ( 2022 ) use a Bay esian analysis to mo del individual sprinting and weigh tlifting ev ents. 3 1.3 Our contributions W e in tro duce a comp ositional Bay esian mo del to accoun t for the multi-ev en t, dep endent nature of the decathlon. W e mo del an athlete’s scores in an even t as a function of the athlete’s age, their preceding-even t scores within the same decathlon, and athlete-sp ecific random intercepts. W e compare multiple mo dels, with v arying levels of flexibility and gran ularity , in an extensiv e set of exp erimen ts. W e show that comp ositional mo dels accurately predict decathlon scores and allow for greater interpretabilit y , enabling researchers to study relationships b et ween ev ents, than simpler mo dels. Using our probabilistic mo dels, we obtain p ersonalized decathlon and even t-sp ecific age curv es to develop training programs, set goals for comp etitions, and mo del p oten tial for future success. W e further develop several real and syn thetic athlete profiles, based on latent abilities in each individual decathlon even t, and we simulate decathlon p erformances to inv estigate the distribution of decathlon scores from these athlete profiles. Through these simulations, we show that breaking the 9200 p oin t threshold is unlik ely , but still p ossible. 2 Data and Mo del 2.1 Data Our dataset con tains the ov erall score and the results from each individual discipline from all completed decathlons b etw een 2001 and 2022. These data were initially pro vided b y W orld Athletics and w ere later analyzed and distributed by Battles et al. ( 2025 ) 1 . The data contains observ ations from all decathlon p erformances with ov erall scores greater than 7000 for 2001-2008, greater than 6600 for 2009, and ab o ve 6400 for the years 2010-2022. W e further truncated the data to include p erformances from only those decathletes who scored 6400 p oints or more at least four times. This threshold is somewhat low er than Battles et al. ( 2025 ), who k ept only those decathletes who completed a decathlon in at least four seasons, and allo ws us to mo del a wider range of dev elopment tra jectories. W e standardized each individual discipline’s p erformance to ha ve a mean of zero and standard deviation of one. Our final dataset includes 8668 decathlon p erformances from 1007 unique decathletes. 2.2 Mo deling decathlon p erformance o ver time T o predict how a decathlete’s o verall scores evolv e ov er the course of their career and to accoun t for the fact that we ha ve multiple observ ations p er decathlete, we can fit a simple age curv e with decathlete-sp ecific random intercepts. Letting P i,j b e the total score earned by decathlete i in decathlon j , a simple starting mo del asserts P i,j = ˜ α i + X d ˜ β d · ϕ d (age i,j ) + ϵ i,j , ϵ i,j ∼ N (0 , σ ) , (1) where ˜ α i is an decathlete-sp ecific random intercept, { ϕ 1 ( · ) , . . . , ϕ D ( · ) } is some pre-sp ecified basis of non-linear functions of age, and age i,j is the age of decathlete i when they completed decathlon j . T o fit this mo del, we tak e a Bay esian approach based on the follo wing relatively w eakly informative 1 The data is av ailable at https://github.com/Battles186/DecathlonCareerBest.git 4 priors, whic h w e specify after standardizing the observ ed P i,j v alues to ha ve mean zero and v ariance one: ˜ α i ∼ N ( µ ˜ α , σ ˜ α ) µ ˜ α ∼ N (0 , 1) σ 2 ˜ α ∼ In v. Gamma (2 , 1) ˜ β d ∼ N (0 , 1) ˜ σ 2 ∼ In v. Gamma (2 , 1) While it is relativ ely straigh tforward to fit the age curves in Equation ( 1 ) and to use them to iden tify when a giv en decathlete’s p erformance will p eak, simply mo deling the ov erall p oin ts provides no insigh t into how a giv en decathlete can obtain that p eak. That is, with such a simple mo del, it is imp ossible to determine whether a decathlete’s forecasted p erformance is due to improv ed p erformance in any particular discipline. So, we instead mo del the outcomes of the individual ev ents. Sp ecifically , let Y i,j,e record the p erformance of decathlete i in discipline (hereafter “ev en t”) e in decathlon j. Then a natural mo del for individual even t p erformances asserts for each i, j and e that Y i,j,e = α i,e + D X d =1 β d,e ϕ d (age i,j ) + ϵ i,j,e ; ϵ i,j,e ∼ N (0 , σ e ) , (2) where the α i,e ’s are random intercepts sp ecific to each combination of athlete and ev ent. Because the mo del in Equation ( 2 ) features ev ent-specific basis co efficien ts β e,d , it is flexible enough to allo w the temp oral evolution of individual even t p erformances to v ary across ev ents. In other words, the mo del in Equation ( 2 ) allows for decathletes to obtain p eak p erformance in differen t disciplines at differen t times. T o fit the mo del in Equation ( 2 ), we sp ecify the priors α i,e ∼ N ( µ α , σ α ) µ α ∼ N (0 , 1) σ 2 α ∼ In v. Gamma (2 , 1) β d,e ∼ N (0 , 1) σ 2 e ∼ In v. Gamma (2 , 1) Despite its intuitiv e app eal, the mo del in Equation ( 2 ) implicitly assumes that p erformance in each ev ent is indep enden t of p erformance in all other ev ents. Given the sequential nature of the decathlon — namely , the even ts are run in the same, fixed order — it is natural to suspect that individual even t p erformances are not indep enden t due to factors like fatigue and even t similarity . F or instance, it is plausible that a decathlete’s p erformance in the 100m may impact their p erformance in the 400m, which tak es place on the same da y . T o better capture inter-ev ent dependencies, we propose a c omp ositional elab oration of the mo del in Equation ( 2 ) in whic h p erformance in each ev ent depends on p erformance in all preceding even ts: Y i,j,e = α i,e + D X d =1 β d,e ϕ d (age i,j ) + e − 1 X m =1 γ m,e Y i,j,m + ϵ i,j,e ; ϵ i,j,e ∼ N (0 , σ e ) . (3) 5 T o illustrate the difference b et w een the mo dels in Equation ( 2 ) and Equation ( 3 ), consider mo deling shot put (SP) p erformance. Whereas the simple mo del in Equation ( 2 ) only uses decathlete age and iden tity to mo del SP p erformance, the comp osition mo del in Equation ( 3 ) additionally accounts for p erformance in the long jump (LJ) and 100m, which tak e place immediately b efore SP . In this con text, the co efficien t γ 100 m,S P captures, up to scaling, the conditional correlation b etw een 100m p erformance and SP performance holding age and LJ performance fixed. If there is a p ositiv e (resp. negativ e) conditional correlation — that is, if running a faster 100m is asso ciated with achieving longer (resp. shorter) shot put distances — we would exp ect γ 100 m,S P to b e negative (resp. positive). On the other hand, if there is essen tially no conditional dep endence b et ween sprinting and shot putting abilities, w e w ould exp ect γ S P, 100 m to b e close to zero. W e sp ecify analogous priors for the parameters in Equation ( 3 ) as we did for Equation ( 2 ): α i,e ∼ N ( µ α , σ α ) µ α ∼ N (0 , 1) σ 2 α ∼ In v. Gamma (2 , 1) β d,e ∼ N (0 , 1) γ m,e ∼ N (0 , 1) σ 2 e ∼ In v. Gamma (2 , 1) 3 P osterior inference and sim ulated p erformance 3.1 Mo del comparison and v alidation Mo del comparison . W e fit eac h model using the rstan ( Stan Dev elopment T eam , 2025 ) in terface to Stan . W e used the pac k age defaults, simulating four Marko v chains for 2,000 iterations each and discarding the first 1,000 iterates as “burn-in.” W e p erformed a 10-fold cross-v alidation study to compare the predictiv e p erformance of t wo versions of each model, one that set { ϕ d } to b e a cubic p olynomial basis and one that set { ϕ d } to b e a cubic splines basis with in terior knots at age deciles. W e compared the out-of-sample predictive accuracy on real decathlon data for each version of each mo del in tw o w ays. First, whic h w e call the “general” case, w e created ten 90%-10% training/testing splits where individual decathlete observ ations w ere randomly held out in the test set. In the second framew ork, w hic h we call the “tail” case, w e held out just the last observed decathlon for a random 10% of the decathletes. Generally sp eaking, all mo dels ac hieved very similar out-of-sample mean square errors in b oth cases; see T ables A3 and A4 for full tabulations. In the general case, the a verage out-of-sample standardized mean square error (SMSE 2 ) for the baseline p oints mo del in Equation ( 1 ) w as 0.234 and 0.235 using the cubic p olynomial and cubic splines basis. Both versions of the simple (Equation ( 2 )) and comp ositional (Equation ( 3 )) models ac hieved mean out-of-sample SMSEs of 0.235. In the “tail” case, we found that the baseline p oin ts mo del with cubic p olynomial basis had ever-so-sligh tly smaller SMSE than the compositional model with the same non-linearities (0.358 vs 0.362). In this setting, w e found that mo deling the age-even t relationship with a cubic p olynomial tends to p erform slightly better than m odeling with a spline. 2 Standardized mean square error is the mean square error divided by the v ariance of the test set resp onses. 6 Although our comp ositional mo del with a cubic p olynomial basis had slightly worse predictiv e p erformance than the baseline mo del for ov erall p oin ts, it provides muc h more insigh t into the underlying inter-ev en t dynamics. T o supp ort this c hoice further, we conducted t wo additional sim- ulation studies that v erify the ability of the comp ositional model to detect inter-ev en t dep endencies when present. Abilit y to recov er mo del parameters. First, we demonstrate that the comp ositional mo del w as p o w ered to recov er the mo del parameters. At a high-level, we fixed v alues of all parameters in Equation ( 3 ), generated 200 synthetic datasets of the same size as our decathlon dataset, fit our mo del to those syn thetic datasets, and assessed ho w w ell w e estimated the data-generating parameter v alues. W e specifically assessed the exten t to which the 95% p osterior credible interv als for each parameter co vered the true data-generating parameter v alues. Generally sp eaking, with the exceptions of parameters for JT and PV (90.5%) the v ast ma jorit y of the interv als displa yed near- nominal 95% co verage; see T able A5 for a full tabulation. Ov erall, the high co verage across virtually all predictors suggests that the mo del is well-calibrated for recov ering inter-ev ent relationships. P osterior predictiv e c hec ks. Once w e fit our simple and comp ositional mo del with cubic p oly- nomial basis, w e generated 2,000 decathlon datasets from the posterior predictiv e distribution using the same athletes and ages as in the observed data. Using these simulated datasets, we computed the posterior predictive correlation b et ween every pair of individual even ts. Figure 2 shows the p osterior predictive distribution of these correlations for selected pairs of even ts for b oth mo dels. W e see that the true observed in ter-even t correlation lies squarely in the middle of the p osterior predictiv e distribution corresp onding to the comp ositional mo del. In sharp contrast, the simple mo del, whic h do es not explicitly mo del inter-ev en t dep endencies, induces p osterior predictive dis- tributions o ver correlations that are concen trated a wa y from and w eak er than the actually observ ed correlations. 3.2 Studying inter-ev ent relationships T o b etter understand the relationship b et w een any tw o even ts, we can examine the p osterior dis- tributions of their mo deled co efficient. Figure 3 displa ys the distributions of the effect of the 100m sprin t on 1500m p erformance. Our mo del estimates this relationship to b e antagonistic. That is, an improv emen t of 0.1 second in the 100m, after accounting for age and the sequential effects of preceding even ts, is asso ciated with an exp ected increase of .45 min utes in the 1500m. Before proceeding, we pause to stress that these associations are not necessarily causal. A p ositiv e co efficien t b et ween the 100m and long jump ma y arise from shared underlying attributes or an emphasis on, say , aerobic training, rather than a direct transfer of skill from one even t to another. This is particularly relev ant given that our dataset consists only of top decathlon p erformances, where athletes must be comp etitiv e across all even ts. Sp ecialists who excel in only one or tw o ev ents but underp erform in the remaining even ts are unlikely to app ear in this data. Consequently , these co efficien ts may b e b etter interpreted as indicators of general p erformance patterns at the elite level rather than isolated even t-on-ev ent effects. 3.3 Sim ulating decathlon p erformance ov er time W e can forecast the entire arc of an individual decathlete’s career with a p osterior predictive sim ulation. Specifically , for a given athlete, i , p osterior sample, s , and age, w e simulate a single 7 Figure 2: Bo xplots depicting the p osterior predictiv e correlations for the simple and c ompositional mo dels ov er 2000 simulated datasets b etw een the 100m and long jump (top) and jav elin and long jump (b ottom). F or each mo del, the 25th, 50th, and 75th p ercen tile is mark ed in the b oxplot. The empirical correlation from the observed data is marked with a red line. decathlon p erformance as follows. First, w e sim ulate their 100m p erformance at that age b y drawing Y ⋆ ( s ) i, 100 m ∼ N α ( s ) i, 100 m + D X d =1 β ( s ) d, 100 m ϕ d (age) , σ ( s ) 100 m ! . Then, ha ving sim ulated their 100m p erformance time at that age, we can simulate their long jump p erformance b y dra wing Y ⋆ ( s ) i,LJ ∼ N α ( s ) i,LJ + D X d =1 β ( s ) d,LJ ϕ d (age) + γ ( s ) 100 m,LJ Y ⋆ ( s ) i, 100 m , σ ( s ) LJ ! , where Y ⋆ ( s ) i, 100 m is the just-simulated 100m performance. W e then con tinue this pro cess, simulating the p erformance in even t e using the corresp onding p osterior samples and the simulated p erformances from the previous even ts: Y ( s ) i,e ∼ N α ( s ) i,e + D X d =1 β ( s ) d,e ϕ d (age) + e − 1 X m =1 γ ( s ) m,e Y ( s ) i,j,m , σ ( s ) e ! . A t the end, w e obtain a single sample from the posterior predictive distribution of p erformance in eac h even t of a single decathlon, whic h we can then conv ert into a single o verall score using 8 Figure 3: Histogram of p osterior draws of β asso ciated with 100m for prediction of 1500m. T able A2 . Repeating this for every age in a fixed grid, and with ev ery sample from the p osterior distribution of the mo del parameters, yields a p osterior distribution o ver each decathlete’s age curv e. Imp ortan tly , our p osterior predictiv e sim ulation strategy propagates and com bines not only uncertain ty ab out mo del parameters but the inherent v ariability in actual ev ent p erformance. Figure 4 sho ws the p oin t-wise p osterior predictiv e mean and 95% uncertaint y interv als for sev eral decathletes’ age curves. Ash ton Eaton, Romain Barras and Brendt Newdick are highlighted in Figure 4 to compare progressions of decathletes with p erformances consisten tly across our age range. Reassuringly , the observed p erformances tend to lie within the p oint-wise 95% predictiv e in terv als. W e also see b enefits of mo deling eac h even t individually . The shap es of each age curve differ for different even ts. SP distances impro ve steadily ov er time while 400m times improv e and then degrade ov er time. F urther, while athletes displa y their p eak SP distances in the later stages of their careers, their 400m times are predicted to p eak in their early-20’s. 3.4 Measuring latent skill Recall that our mo dels assume that for eac h ev ent, random athlete in tercepts are dra wn from a laten t normal population with ev ent-specific means and v ariances. This p opulation, in some sense, captures the range of latent abilit y in eac h even t, and the decathletes in our analysis can b e viewed as a sample from the underlying p opulation. T o ev aluate athlete-sp ecific latent skill in an ev en t, we use the p osterior distribution of athlete-lev el random in tercepts from our hierarc hical mo del. Since slop es for age and other co v ariates are shared 9 (a) Shot Put (b) 400m Figure 4: P osterior predictive shotput (left) and 400m (righ t) interv als for selected athletes. The shaded areas represent the 95% p osterior predictiv e in terv al for eac h respective mo del, and the solid line depicts the p osterior mean. Each dot represents an observ ation for a given athlete. Greater distances for shot put and faster times for the 400m corresp ond to more p oints. across athletes, these intercepts capture p ersistent athlete-level differences in even t p erformance. F or any giv en athlete in our sample, w e assess their latent skill in eac h ev ent by computing the z-score and p ercentile associated with their even t-intercept within the ov erall p osterior distribution of athlete random intercepts. Figure 5 visualizes the p osterior distribution of the Ashton Eaton’s and Kevin May er’s p ercen tile within the latent p opulation of skill in eac h discipline. W e find that Eaton is among the elite at the 100m, LJ, and 400m, while May er is generally b etter than Eaton on the Da y 2 even ts (hurdles, DT, PV, JT, and 1500m). Figure 6 plots the p osterior mean quantile for eac h decathlete’s latent skill in the 400m and 1500m. W e find that Eaton ranks ab o ve the 90th-p ercentile in terms of his latent 400m skill but is in the middle-of-the-pac k for the 1500m. May er, by contrast, is ab o ve av erage in b oth ev ents but not to a large degree. Their examples suggest that achieving high decathlon scores do es not require elite p erformance in all even ts. 3.5 A thlete Profiles - Breaking 9200 In Section 3.4 , we calculated the mean p osterior ev ent-in tercept p ercentiles in each ev ent for selected athletes in our sample. W e refer to this collection of p osterior mean p ercentiles as a decathlete’s pr ofile . T able 1 sho ws the profiles for the fiv e decathletes with the highest scores in our dataset. Giv en an y profile (i.e., an y combination of 10 quantiles), we can simulate a career’s worth of decathlons for a hypothetical decathlete with that profile using a pro cedure very similar to the one describ ed in Section 3.3 . Sp ecifically , for eac h p osterior sample s, we set the random intercept α s e to the corresp onding quantile of the N µ ( s ) e , σ 2( s ) α,e distribution. Then, w e simulate 2 decathlons for every year b etw een the ages 19 and 30, and compute the prop ortion of simulations where this 10 Figure 5: Boxplots of quantiles for even t intercepts for Ashton Eaton and Kevin May er across 4000 MCMC samples. athlete breaks 9200 p oints. F or instance, to simulate the career of a decathlete with Asthon Eaton’s profile — that is, someone who is elite in the 100m, long jump, and 400m but slightly below av erage in the shot put and ja velin toss — w e would sample the the 99.9%-quan tile for the 100m intercept, the 94%-quan tile for the LJ, and so on. W e find that an athlete with Eaton’s profile broke 9200 p oin ts in just 6% of our p osterior samples while decathletes with Kevin Ma yer’s and Roman ˇ Sebrle’s profiles resp ectiv ely break 9200 with p osterior probabilities of 7% and 10%. W e rep eat this pro cedure for the v arious synthetic athlete profiles. W e consider an athlete that sp ecializes in the Da y 1 even ts, with 95th p ercen tile intercepts in the first five even ts and 50th p ercen tile intercepts in the last five even ts. This athlete breaks 9200 p oin ts in only 2% of our sim ulations. The analogous Day 2 sp ecialist never brok e 9200 in our simulations. P erhaps unsurprisingly , an unrealistic “unicorn” athlete, who is consistently 95th p ercentile across all ten even ts, do es break the 9200 mark in virtually all of our simulations. But the somewhat more realistic “go od” decathlete, who consisten tly p erforms at the 80th p ercen tile across all even ts, almost nev er breaks 9200. Figure 7 sho ws histograms for the highest scores in eac h sim ulated career for these synthetic athletes. There is minimal ov erlap for their max scores at their resp ectiv e skill lev els, with the “unicorn” athlete’s av erage high score b eing 9561 p oints and the “go o d” athlete’s a verage high score at 8671. So, returning to our original question, we conclude that breaking 9200, while technically feasible, is highly unlikely and would b e an extremely impressive feat. 11 Figure 6: Mean p osterior in tercept p ercen tiles in the 400m and 1500m for all athletes, with selected athletes highlighted. The 50th p ercen tile for each ev ent is marked with a red line. 4 Discussion In this pap er, we dev elop ed a new comp ositional Bay esian mo del that can predict ov erall decathlon scores and individual discipline p erformance ov er the course of a decathlete’s career. W e show ed that our comp ositional mo del b etter captured in ter-even t dep endencies than simpler alternatives. Using our mo del, we introduced a profile for each decathlete, whic h summarizes their laten t skill in an easily-interpretable wa y . Examining these profiles revealed that elite decathlon p erformance tend not to arise from elite p erformance across all ten disciplines. Rather, the top decathletes tend to b e elite at only a few ev ents (e.g., Ashton Eaton) or go o d but not elite in man y (e.g., Kevin Ma yer). Based on p osterior predictive simulations of sev eral synthetic decathlete profiles, w e concluded that breaking the 9200 p oint limit is unlik ely . There are sev eral p oten tial extensions to our ov erall mo deling. First, we w ere unable to account for imp ortan t v ariables that affect decathlon performance like temp erature, wind sp eeds, and sho e and surface technology . That said, it is conceptually straightforw ard to elab orate the mo del in Equation ( 3 ) to include additional cov ariates. More substantiv ely , we fit each ev ent-specific mo del separately , which renders the ev ent-specific intercepts for a giv en athlete indep enden t a p osteriori . A b etter wa y to capture latent inter-ev ent dep endence would b e to fit a single mo del for all even t p erformances in which the v ector of athlete-sp ecific random in tercepts was drawn from a normal p opulation with non-diagonal cov ariance matrix. Additionally , as noted b y Sc huc k ers et al. ( 2023 ), our analysis may b e sub ject to a certain amount of selection bias, as only the most successful decathletes are observ ed at the extremes of the age range considered. While this is certainly of 12 Figure 7: Histogram of greatest decathlon p erformances for synthetic athletes, excellent (green) and go od (purple), across 4000 simulated careers. The vertical line depicts the a verage highest score for eac h syn thetic athlete. T able 1: Profiles of last world record holders and synthetic athletes. Entries consist of each even t’s in tercept p ercen tile. W e calculate the prop ortion of sim ulated careers in which an athlete with the giv en profile breaks 9200 p oints. Name 100m LJ SP HJ 400m 110mH DT PV JT 1500m 9200? K. May er 0.88 0.94 0.91 0.85 0.66 0.85 0.88 0.92 0.93 0.62 7.7 A. Eaton 1.00 0.94 0.40 0.60 0.95 0.78 0.65 0.74 0.44 0.49 5.65 R. ˇ Sebrle 0.91 1.00 0.92 0.94 0.77 0.55 0.79 0.57 0.95 0.35 10.325 D. W arner 1.00 0.71 0.52 0.67 0.57 0.90 0.82 0.26 0.77 0.44 1.825 R. Dvo ˇ r´ ak 0.92 0.95 0.97 0.55 0.69 0.74 0.44 0.34 0.96 0.67 0.6 Da y 1 0.95 0.95 0.95 0.95 0.95 0.50 0.50 0.50 0.50 0.50 2.4 Da y 2 0.50 0.50 0.50 0.50 0.50 0.95 0.95 0.95 0.95 0.95 0 Excellen t 0.95 0.95 0.95 0.95 0.95 0.95 0.95 0.95 0.95 0.95 99.95 Go od 0.80 0.80 0.80 0.80 0.80 0.80 0.80 0.80 0.80 0.80 0.075 13 concern, we b eliev e that the selection bias is less severe in track and field than in professional sp orts like baseball or ho c k ey . Finally , our comp ositional mo del only allo wed for linear dep endence b et w een even ts. W e lea ve developmen t and in vestigation of a non-linear comp ositional mo del to future work. Ac kno wledgemen ts The authors thank T ristan F aure for his early con tributions to the original conception of this pro ject and for assistance with initial data collection during its preliminary phase. References Aoki, K., Kohm ura, Y., Sakuma, K., Koshik aw a, K., and Naito, H. (2015). Relationships b et w een field tests of p o wer and athletic p erformance in track and field athletes sp ecializing in p o wer ev ents. International Journal of Sp orts Scienc e & Co aching , 10(1):133–144. Bak er, R. D. and McHale, I. G. (2023). A flexible mixed model for age-dependent p erformance: Ap- plication to golf. Journal of the R oyal Statistic al So ciety Series C: Applie d Statistics , 72(5):1260– 1275. Battles, P ., Noble, T. J., and Chapman, R. F. (2025). Predicting high-performance decathlon career b est. Exp erimental Physiolo gy , 110(11):1672–1681. Brander, J. A., Egan, E. J., and Y eung, L. (2014). Estimating the effects of age on NHL play er p erformance. Journal of Quantitative Analysis in Sp orts , 10(2):241–259. Co x, T. F. and Dunn, R. T. (2002). An analysis of decathlon data. Journal of the R oyal Statistic al So ciety Series D: The Statistician , 51(2):179–187. Dziadek, B., Iskra, J., Mendyk a, W., and Przednow ek, K. (2022). Principal comp onen t analysis in the study of the structure of decathlon at differen t stages of sp orts career. Polish Journal of Sp ort and T ourism , 29(4):21–28. F air, R. C. (2008). Estimated age effects in baseball. Journal of Quantitative Analysis in Sp orts , 4(1). Griffin, J. E., Hinov eanu, L. C., and Hopker, J. G. (2022). Ba yesian mo delling of elite sp orting p erformance with large databases. Journal of Quantitative Analysis in Sp orts , 18(4):253–268. Kenn y , I. C., Sprev ak, D., Sharp, C., and Boreham, C. (2005). Determinan ts of success in the Olympic decathlon: Some statistical evidence. Journal of Quantitative Analysis in Sp orts , 1(1). P ark, J. and Zatsiorsky , V. M. (2011). Multiv ariate statistical analysis of decathlon p erformance results in olympic athletes (1988-2008). World A c ademy of Scienc e, Engine ering and T e chnolo gy , 5(5):985–988. Sc huc k ers, M., Lop ez, M., and Macdonald, B. (2023). Estimation of play er aging curves using regression and imputation. Annals of Op er ations R ese ar ch , 325(1):681–699. 14 T able A2: Parameter v alues b y ev ent for p oin t calculation Ev ent a b c 100 m 25.435 18.0 1.81 Long jump 0.144 220.0 1.40 Shot put 51.390 1.5 1.05 High jump 0.847 75.0 1.42 400 m 1.538 82.0 1.81 110 m h urdles 5.744 28.5 1.92 Discus throw 12.910 4.0 1.10 P ole v ault 0.280 100.0 1.35 Ja velin thro w 10.140 7.0 1.08 1500 m 0.038 480.0 1.85 Stan Developmen t T eam (2025). RStan: the R in terface to Stan. R pack age version 2.32.7. V an Damme, R., Wilson, R. S., V anho o ydonck, B., and Aerts, P . (2002). Performance constraints in decathletes. Natur e , 415(6873):755–756. Villaro el, C., Mora, R., and Gonzalez-Parra, G. C. (2011). Elite triathlete p erformance related to age. Journal of Human Sp ort and Exer cise , 6(2):363–373. W alker, J. A. and Caddigan, S. P . (2015). P erformance trade-offs and individual quality in decath- letes. Journal of Exp erimental Biolo gy , 218(22):3647–3657. Wimmer, V., F enske, N., Pyrk a, P ., and F ahrmeir, L. (2011). Exploring comp etition p erformance in decathlon using semi-parametric latent factor mo dels. Journal of Quantitative Analysis in Sp orts , (4). W o olf, A., Ansley , L., and Bidgo o d, P . (2007). Grouping of decathlon disciplines. Journal of Quantitative Analysis in sp orts , 3(4). A Additional results A.1 P oin t calculation details The formula for calculating p oin ts for each individual even t is given b elo w: P oints = ( a · ( b − y ) c if track ev ent a · ( y − b ) c if field ev ent (A1) where a , b , and c are given by T able A2 , and y is the athlete’s time, distance, or height. F aster times in track ev ents (100m, 400m, hurdles, and 1500m) and greater distances and heights in field ev ents pro duce higher scores. 15 A.2 Mo del comparisons with real data W e compared the out of sample accuracy on real decathlon data for each mo del under tw o frame- w orks. The first framew ork is a ‘general’ case, where w e created ten 90%-10% training/testing splits, with observ ations placed in the test split at random. In ‘tail’ framework, w e create ten train- ing/testing splits by selecting 10% of the decathletes and using their last decathlon observ ation as the test set, and all other observ ations in the training dataset. T ables A3 and A4 con tain the results (SMSE) from the real decathlon data bak eoff exp erimen ts with randomly remo ved observ ations and tail observ ations. A.3 P arameter reco v ery with kno wn β T able A5 displa ys the prop ortion of 95% credible in terv als con taining the true parameter asso ciated with the in ter-even t relationship ov er 200 sim ulated datasets, as describ ed in Section 3 . W e sp ecified a kno wn structure of linear dep endence b etw een even ts and estimated co efficien ts for the age p olynomials and preceding even ts using the original decathlon data. W e then simulated 200 datasets with 8668 observ ations. After fitting the cubic, comp ositional mo del to the 200 simulated datasets, w e studied the p osterior distributions o ver the β co efficients corresp onding to age and preceding ev ents. F or each co efficien t, we computed the prop ortion of 95% p osterior interv als containing the true v alue used in simulation. A.4 Empirical and p osterior predictive correlations b et w een decathlon even ts T able A6 con tains the empirical correlations b etw een the decathlon ev ents from the observed data. T ables A7 and A8 contain the 2.5% and 97.5% quantiles from the p osterior predictiv e correlations from the simulated datasets generated b y the simple and comp ositional mo dels resp ectiv ely , as describ ed in Section 3 . 16 T able A3: Mean standardized MSE across 10 cross v alidations in predicting decathlon p erformance with randomly remov ed observ ations. mo del basis 100m LJ SP HJ 400m 110mH DT PV JV 1500m p oin ts baseline cubic - - - - - - - - - - 0.234 simple cubic 0.309 0.414 0.188 0.343 0.329 0.311 0.262 0.294 0.295 0.413 0.235 comp ositional cubic 0.309 0.414 0.188 0.344 0.329 0.312 0.262 0.294 0.294 0.414 0.235 baseline spline - - - - - - - - - - 0.235 simple spline 0.309 0.414 0.188 0.344 0.329 0.311 0.263 0.294 0.295 0.414 0.235 comp ositional spline 0.309 0.414 0.188 0.344 0.329 0.312 0.262 0.294 0.294 0.414 0.235 17 T able A4: Mean standardized MSE across 10 cross v alidations tail-remov ed observ ations for decathletes. mo del and prior basis 100m LJ SP HJ 400m 110mH DT PV JV 1500m p oin ts baseline none cubic - - - - - - - - - - 0.358 simple none cubic 0.337 0.471 0.238 0.414 0.406 0.447 0.301 0.372 0.315 0.482 0.362 comp ositional none cubic 0.337 0.469 0.239 0.415 0.407 0.445 0.300 0.371 0.315 0.482 0.362 baseline spline - - - - - - - - - - 0.359 simple spline 0.338 0.470 0.238 0.415 0.409 0.448 0.301 0.371 0.317 0.484 0.363 comp ositional spline 0.337 0.469 0.239 0.415 0.408 0.445 0.300 0.369 0.315 0.482 0.363 18 T able A5: Prop ortion of 95% credible interv als containing the true parameter asso ciated with corresp onding predictor ov er 200 sim ulations. Entries are rounded to the second digit. predictor 100m LJ SP HJ 400m 110mH DT PV JT 1500m age 0.95 0.96 0.96 0.96 0.94 0.95 0.96 0.96 0.92 0.95 age 2 0.94 0.94 0.96 0.92 0.96 0.96 0.95 0.96 0.96 0.98 age 3 0.92 0.96 0.94 0.94 0.96 0.94 0.95 0.96 0.93 0.97 100m - 0.97 0.94 0.98 0.97 0.93 0.96 0.98 0.95 0.96 LJ - - 0.97 0.94 0.96 0.93 0.94 0.95 0.94 0.96 SP - - - 0.98 0.96 0.94 0.98 0.96 0.96 0.94 HJ - - - - 0.97 0.94 0.96 0.96 0.96 0.98 400m - - - - - 0.93 0.95 0.96 0.96 0.96 110mH - - - - - - 0.95 0.93 0.92 0.96 DT - - - - - - - 0.96 0.95 0.96 PV - - - - - - - - 0.90 0.94 JT - - - - - - - - - 0.94 T able A6: Empirical correlations b et ween decathlon even ts in observed data, rounded to 2 digits. Ev ent 100m LJ SP HJ 400m 110mH DT PV JT 1500m 100m 1.00 -0.54 -0.20 -0.20 0.66 0.52 -0.18 -0.25 -0.13 0.10 LJ - 1.00 0.33 0.43 -0.45 -0.47 0.29 0.34 0.24 -0.14 SP - - 1.00 0.31 -0.15 -0.36 0.73 0.38 0.51 -0.01 HJ - - - 1.00 -0.21 -0.34 0.28 0.29 0.22 -0.10 400m - - - - 1.00 0.46 -0.13 -0.25 -0.11 0.46 110mH - - - - - 1.00 -0.32 -0.37 -0.24 0.12 DT - - - - - - 1.00 0.40 0.48 -0.02 PV - - - - - - - 1.00 0.31 -0.20 JT - - - - - - - - 1.00 -0.09 1500m - - - - - - - - - 1.00 19 T able A7: 2.5% and 97.5% quantiles for p osterior predictive correlation b et ween decathlon even ts from 2000 simulated datasets from the simple mo del, rounded to 2 digits. Ev ent LJ SP HJ 400m 110mH DT PV JT 1500m 100m -0.41, -0.37 -0.16, -0.13 -0.16, -0.12 0.49, 0.52 0.37, 0.41 -0.15, -0.12 -0.19, -0.16 -0.11, -0.07 0.03, 0.07 LJ 1, 1 0.24, 0.28 0.29, 0.33 -0.35, -0.31 -0.37, -0.33 0.23, 0.26 0.24, 0.28 0.16, 0.2 -0.1, -0.06 SP - 1, 1 0.25, 0.28 -0.12, -0.08 -0.33, -0.29 0.64, 0.67 0.32, 0.35 0.44, 0.47 -0.01, 0.03 HJ - - 1, 1 -0.17, -0.13 -0.29, -0.25 0.23, 0.26 0.22, 0.26 0.17, 0.2 -0.07, -0.03 400m - - - 1, 1 0.31, 0.35 -0.11, -0.07 -0.2, -0.16 -0.09, -0.05 0.28, 0.32 110mH - - - - 1, 1 -0.29, -0.25 -0.31, -0.27 -0.21, -0.18 0.03, 0.07 DT - - - - - 1, 1 0.32, 0.36 0.41, 0.44 -0.02, 0.02 PV - - - - - - 1, 1 0.24, 0.28 -0.16, -0.12 JT - - - - - - - 1, 1 -0.06, -0.02 1500m - - - - - - - - 1, 1 20 T able A8: 2.5% and 97.5% quantiles for p osterior predictive correlation b et ween decathlon even ts from 2000 simulated datasets from the comp ositional mo del, rounded to 2 digits. Ev ent LJ SP HJ 400m 110mH DT PV JT 1500m 100m -0.55, -0.52 -0.22, -0.18 -0.22, -0.18 0.64, 0.67 0.5, 0.54 -0.19, -0.16 -0.27, -0.23 -0.15, -0.11 0.09, 0.13 LJ 1, 1 0.3, 0.34 0.39, 0.43 -0.47, -0.43 -0.48, -0.45 0.26, 0.3 0.31, 0.35 0.21, 0.25 -0.17, -0.12 SP - 1, 1 0.29, 0.32 -0.17, -0.13 -0.37, -0.34 0.71, 0.73 0.36, 0.39 0.49, 0.52 -0.03, 0.01 HJ - - 1, 1 -0.23, -0.19 -0.35, -0.31 0.25, 0.29 0.26, 0.3 0.2, 0.24 -0.13, -0.08 400m - - - 1, 1 0.44, 0.48 -0.15, -0.11 -0.27, -0.24 -0.14, -0.1 0.43, 0.47 110mH - - - - 1, 1 -0.33, -0.3 -0.38, -0.35 -0.26, -0.22 0.1, 0.15 DT - - - - - 1, 1 0.37, 0.41 0.46, 0.49 -0.04, 0 PV - - - - - - 1, 1 0.28, 0.32 -0.22, -0.17 JT - - - - - - - 1, 1 -0.12, -0.08 1500m - - - - - - - - 1, 1 21
Original Paper
Loading high-quality paper...
Comments & Academic Discussion
Loading comments...
Leave a Comment