Using Time Series Measures to Explore Family Planning Survey Data and Model-based Estimates
Family planning is a global development priority and a key indicator of reproductive health. Monitoring progress is challenged by gaps in survey data across countries. The United Nations Population Division addresses this with the Family Planning Est…
Authors: Oluwayomi Akinfenwa, Niamh Cahill, Catherine Hurley
U S I N G T I M E S E R I E S M E A S U R E S T O E X P L O R E F A M I L Y P L A N N I N G S U R V E Y D A T A A N D M O D E L - B A S E D E S T I M A T E S ∗ Oluwayomi Akinfenwa Hamilton Institute Maynooth Univ ersity Maynooth Co. Kildare, Ireland oluwayomiakinfenwa@gmail.com Niamh Cahill Department of Mathematics and Statistics Maynooth Univ ersity Maynooth Co. Kildare, Ireland Niamh.Cahill@mu.ie Catherine Hurley Department of Mathematics and Statistics Maynooth Univ ersity Maynooth Co. Kildare, Ireland Catherine.Hurley@mu.ie A B S T R A C T Family planning is a cornerstone of reproducti ve health and a global de velopment priority , central to Sustainable Dev elopment Goal indicator 3.7.1 on meeting women’ s need for modern contraception. Monitoring progress tow ard univ ersal access to family planning is challenged by substantial temporal gaps in household surve y data across countries. T o address this, the United Nations Population Di vision employs the F amily Planning Estimation Model (FPEM), a Bayesian hierarchical time series model that produces annual estimates and projections of key family planning indicators. FPEM lev erages the hierarchical structure of countries nested within regions and subregions, allowing information to be shared across levels to improve estimates in countries with sparse data. While FPEM enables consistent monitoring, its estimates are inherently smoothed, making it important to assess how well modelled trends reflect the underlying surve y observations and the heterogeneity of family planning trajectories across countries and regions. This paper examines the alignment between FPEM model-based estimates and observed surve y data on modern contraceptiv e use, a ke y family planning indicator . The methods use selected time series diagnostic indices from the wdie xplor er R package, which e xplicitly accounts for pre-defined grouping structures, in this case countries nested within sub-re gions. These indices quantify v ariation, trend, and temporal structure in country-lev el panel data while enabling comparison within and across sub- regional groupings. V isualisation is central to the analysis, enabling direct comparison of relati vely sparse survey observations with annual modelled trajectories and facilitating the interpretation of diagnostic measures at both country and sub-re gional lev els. By jointly visualising surv ey data and model estimates, as well as residual-based diagnostics, the study identifies where modelled family planning trends closely align with observed patterns and where meaningful discrepancies arise. The results highlight the value of group-aw are exploratory visualisation for improving transparency , interpretability , and assessment of model-based estimates. All analyses are fully reproducible and publicly av ailable. ∗ Citation : A uthors. Title. P ages.... DOI:000000/11111. A P R E P R I N T 1 Introduction The right of any indi vidual to decide freely and responsibly on the number and spacing of their children has long been recognised as a fundamental human right [ 1 ] and is central to improving liv es and building equitable societies [ 2 ]. This positions improv ements to family planning as a cornerstone of progress as reflected in Sustainable De velopment Goal indicator 3.7.1: “Proportion of women who ha ve their need for family planning satisfied with modern methods”. Family planning is therefore a key global de velopment priority , integral to reproducti ve health services and broader socio-economic dev elopment [ 1 ]. A range of family planning programmes operate at both global and national lev els to expand access to reproducti ve health services, strengthen health systems, and promote informed contracepti ve choice. Among these initiati ves is F amily Planning 2030 (FP2030) [ 3 ], which supports the global commitment to achieving univ ersal access to family planning by 2030. FP2030 e volv ed from the FP2020 initiati ve, launched at the 2012 London Summit on f amily planning with a vision tagged “ 120 by 20 ” numeric vision, which sought to enable 120 million additional women and girls access to modern contraception by 2020 [ 4 ]. As the FP2020 initiative concluded in 2020, it ga ve way to FP2030 with a broader vision to promote the right of women and girls to lead healthy liv es and make informed choices about contraception [ 3 ]. This is an initiati ve that is closely aligned with the global commitment of uni versal access to se xual and reproducti ve health under SDG 3.7. Despite the global commitment to family planning, progress varies widely across countries and regions, partly due to differences in access, program implementation, and socio-demographic factors [ 5 ]. T o monitor family planning progress, data are collected through household surv eys such as, the Demographic and Health Survey(DHS), Performance Monitoring for Actions(PMA), UNICEF Multiple Indicator Cluster Surve ys (MICS), national surve ys, and other surve ys [ 2 ]. These household surveys are typically conducted e very 3 to 5 years, resulting in temporal gaps of up to 6 years for certain countries. In some rare cases, national surve ys are conducted annually or semi-annually [6]. T emporal gaps in large-scale survey data make consistent monitoring of family planning progress challenging. T o address this limitation, the Family Planning Estimation Model (FPEM) was de veloped [ 7 , 8 ]. FPEM produces annual surve y-informed estimates and projections for ke y family planning indicators using Bayesian hierarchical time series inference. Where survey data are available, the model interpolates estimates and it projects estimates for data gaps between infrequent surve y observ ations. FPEM employs Bayesian hierarchical inference to share information across hierarchical structures, countries nested in subregions, subre gions in regions, and regions within the global le vel. The model estimates are smoothed by design, because they tend to reflect the hierarchical overall beha viour , which makes it important to explore ho w these modelled trends align with the underlying surve y observ ations. This paper examines the extent to which modelled estimates from FPEM align with the underlying survey data, using selected diagnostic indices from the wdiexplor er package [ 9 ]. These indices are time series measures de- signed to quantify variation, trend, shape and sequential temporal features of country-level panel data. By us- ing wdiexplor er to jointly analyse the survey observations and the corresponding modelled trajectories, as well as ev aluating the residuals, the analysis identifies where the model aligns with the observed data and where no- table differences arise. This facilitates the identification and comparison of temporal behaviours of the data and the associated model trends, enhancing understanding of patterns in modern contraceptive use across coun- tries. All analyses and visualisations presented in this paper are fully reproducible and av ailable on GitHub at https://github.com/Oluwayomi- Olaitan/Family- Planning- Exploratory- Analysis . The remaining sections of this paper are or ganised as follo ws. Section 2 pro vides background to the study , outlining the family planning survey data, the model-based estimates, and the wdiexplor er methodology . Section 3 describes the data processing steps for the surv ey dataset and the dataset of estimates and presents an initial visualisation of the surve y data. Section 4 introduces the exploratory analysis of the surve y data and model-based estimates using selected wdiexplor er diagnostic indices. Section 5 presents the residual-based exploratory analysis. Finally , Section 6 concludes with the findings, benefits of assessing how well the model-based trends align with the underlying surve y observations, the limitations of the diagnostic indices in the context of family planning data, and directions for future w ork. 2 Background In this section, we discuss the family planning surv ey data, the model-based estimates, and our wdie xplor er methodology . The surv ey and model-based data were sourced from the United Nations Population Division (UNPD), while wdiexplor er offers a w orkflow with time-series diagnostic measures and visualisation tools for exploring these measures to identify patterns, outliers, and other notable features. 2 A P R E P R I N T 2.1 Family Planning Survey Data According to [ 10 ], modern contracepti ve methods include medical products or procedures such as pills, intrauterine de vices, implants, condoms, and sterilisation, which are designed to reliably prev ent pregnancy . Traditional contracepti ve methods include behavioural and natural approaches, such as withdraw al, rhythm methods, douching, and folk methods. The pre v alence of either modern or traditional contraceptive methods is defined as the proportion of the tar get population, typically women of reproducti ve age (15 - 49) using that method at a gi ven time relati ve to the total population of the same group. These proportions (pre v alence of modern and traditional contracepti ve use) are the primary v ariables of interest for our analysis. These proportions alongside other demographic variables are captured through family planning surv eys. A collation of family planning surv ey data is or ganised and maintained by the UNPD in the W orld Contracepti ve Use database [ 11 ] and updated annually , providing country-le vel observ ations of family planning indicators to support the monitoring of family planning progress. The dataset provides surv ey observ ations of contracepti ve use (modern and traditional) and unmet need, obtained from nationally representati ve household surve ys, including Demographic and Health Surv eys (DHS), UNICEF Multiple Indicator Cluster Surv eys (MICS), Performance Monitoring for Action (PMA), Reproducti ve Health Surve ys, Contraceptiv e Pre valence Surv eys (CPS), national surv eys, and other sources [8]. The dataset spans 197 countries, including T aiwan and K osov o, which are not univ ersally recognised as sov ereign nations, and covers 1950 to 2021, although cov erage and completeness vary across countries, time, and indicators. Surve y observations are disaggreg ated by data series type, capturing the survey source, union status, indicating whether individuals are married/in a union or not, alongside other demographic characteristics and measures of observation uncertainty in the form of standard errors. 2.2 Family Planning Model-based Estimates The Family Planning Estimation Model (FPEM) is a Bayesian hierarchical time series model used by the UNPD to generate annual estimates and projections of ke y f amily planning indicators [ 7 , 8 ] using surv ey data as input. The model lev erages the Bayesian inference framew ork, where country-level estimates are informed by subregional, re gional, and global trends. This structure allows reliable projections ev en in countries with sparse data, as information is effecti vely borrowed from nested hierarchical le vels. Its structure consists of a process model that captures long-term changes in contraceptiv e pre v alence through logistic gro wth curves reflecting the realistic assumption that gro wth accelerates at intermediate lev els of use and slo ws as prev alence reaches saturation [7, 8]. FPEM serves as the core family planning estimation frame work within the UNPD, pro viding projections for family planning indicators and is implemented in the family planning estimation tool for country-le vel use, a v ailable in the R package fpemlocal [ 12 ]. While FPEM is central, there are other methodologies employed to complement it in assessing program inputs and impact and setting strategic tar gets. The model estimates of family planning indicators are a v ailable on the UNPD website [ 11 ] and the dataset contains estimates from 1970 to 2030. There are estimates for 14 indicator lev els, with both numerical counts and percentages for contracepti ve pre v alence, demand for f amily planning, and unmet need, classified by method type (an y , modern, traditional). Each record is associated with a LocationID , corresponding to the di vision numeric code and Location , country name, with T ime representing the year . The dataset also includes V ariant that captures the estimates and their credible intervals, by 95% lo wer bound, 80% lo wer bound, median estimate, 80% upper bound, and 95% upper bound. It contains the Age r ange information, Cate gories , with 3 population groups (“ All women”, “Married or in a union women”, and “Unmarried women”), and Estimate method which indicates whether the estimate is interpolated for observed data periods or projected for periods without data. These model-based annual estimates serve as a dataset to monitor progress to ward global family planning goals, such as the FP2030 initiativ e, and other key f amily planning targets. The dataset provides consistent and comparable estimates across countries, sub-regions, and re gions ov er time. 2.3 wdiexplorer: Time Series Diagnostic Measures T o assess and e xplore the f amily planning survey data related to contracepti ve use and corresponding model-based annual estimates generated by FPEM, we apply our wdie xplor er R package to these two datas ets. wdiexplor er [ 9 ] is a time series exploratory tool originally designed for exploratory analysis of country-level panel data of the W orld De velopment Indicators (WDI), as the name implies. It can also be applied to any dataset formatted as repeated observ ations ov er time and across countries. The package provides a structured workflo w for data exploration through diagnostic indices and visualisation tools. By explicitly incorporating pre-defined grouping structures, such as geographical region, income, or 3 A P R E P R I N T other categories, wdie xplor er facilitates the identification of patterns, outliers, and v ariations within and across group lev els, as well as temporal and shape-based features. In wdiexplor er , we use a three-stage process designed for the exploratory analysis of country-level panel data. The first stage in volv es obtaining data from the WDI, or another source, and assessing its completeness and validity . This stage uses visual summaries to assess data av ailability and missingness across countries and years, grouping countries by a predefined v ariable to compare patterns within and across groups. The second stage computes a set of ten diagnostic indices that quantify ke y characteristics of the data series. Inspired by the scagnostics frame work [ 13 , 14 ] and some established time series features [ 15 ], these indices capture variation, shape and trend, and sequential temporal beha viours of the data. The final stage utilises visual tools to identify outliers, patterns, potentially interesting features and to support interpretation of the diagnostic indices. The wdiexplor er package was originally designed for exploratory analysis of WDI data, one indicator at a time. W e adapt some of the diagnostic indices and visualisation tools of wdie xplor er to demonstrate ho w it can also be used to assess consistency , variation, and comparison between observ ed data and model-based estimates of any country-le vel panel data. Using family planning surv ey observ ations and the corresponding modelled estimates as an e xample, we show ho w different functionalities of the package are used depending on whether the focus is on exploring the data and model outputs or the residuals. The selected diagnostic indices for exploring the family planning datasets are silhouette width and trend strength. Silhouette width [ 16 ] is typically used in cluster analysis to assess the performance of groups obtained from a clustering procedure. Here, we use it to assess a pre-defined grouping of countries. It ev aluates ho w well a country’ s data aligns with its pre-defined group compared to other groups. It is computed by comparing the a verage distance to countries within the same group against the distance to the closest neighbouring group. The silhouette width ranges from − 1 to +1 . A v alue near +1 indicates that the country is well aligned within its assigned group, while a v alue close to − 1 suggests the country is closer to an alternativ e group. Silhouette width in our context quantifies the degree to which the contraceptiv e use pattern of each country align with its sub-region in both the surv ey data and the modelled output. T rend strength quantifies the extent to which a data series follo ws a consistent pattern over time, which could be linear or curved, relati ve to random fluctuations. The trend strength is defined as the ratio of the v ariance of the remainder component ( R t ) to the v ariance of the combined sum of the trend and remainder components ( T t + R t ) from a time series decomposition [ 15 ]. The value ranges from 0 to 1 expressed in proportions, distinguishing smooth patterns from irregular noise. T o assess model fit, we use the diagnostic indices linearity and curvature to analyse the model residuals. Linearity measures how closely a series follo ws a straight-line pattern ov er time. It assesses whether changes occur consistently without sharp curves or bends while curvature measures the e xtent to which a series deviates from a straight-line trend ov er time, capturing the presence of non-linear patterns; upward or downward bends. Linearity is quantified as β 1 , the coefficient of the linear term and curvature is quantified as β 2 , the coefficient of the quadratic term in a polynomial regression fitted to the trend component of the decomposed series, where the predictors are the first two orthogonal polynomials of the time index [ 15 ]. If the model perfectly captures the patterns in the data, the residuals for each country should behav e randomly , and the corresponding linearity and curv ature metrics should be zero or close to zero. Other diagnostic measures of wdiexplor er are: country average dissimilarity , within group average dissimilarity , smoothness, number of crossing points, longest flat spot and autocorrelation. These measures are less suitable for the family planning datasets for sev eral reasons. The infrequent nature of the surve y data with intervals of 3–5 years limits the comparability of temporal measures such as the number of crossing points or longest flat spot with the model-based annual estimates. Silhouette width and trend strength diagnostic measures are considered most suitable for capturing the behaviour of family planning data. W e proceed to explore these tw o datasets, compare their diagnostic measures, and examine patterns in the residuals using linearity and curv ature indices. 3 Preliminary Data Exploration 3.1 Data Processing The family planning datasets were processed to align with the requirements of the wdie xplor er workflo w , which expects a single observation per country-year pair . Survey data on contracepti ve use and other family planning indicators were collected from multiple surve y types. In 41 countries, there are multiple surve y observ ations per country-year pairs. T o address this, a yearly observation is obtained from the surveys prioritised in the following order: Demographic and Health Surve ys (DHS) first, followed by Multiple Indicator Cluster Surv eys (MICS), Performance Monitoring for Action (PMA) surve ys, national surve ys, and other sources. 4 A P R E P R I N T W e prioritise survey types in this order because DHS is generally considered the most reliable and widely comparable, serving as a global surve y for health data. Analyses using FPEM have demonstrated that the random errors associated with non-DHS data are greater than those associated with DHS data [ 7 ]. MICS and PMA follow because the y are also nationally representativ e and rigorous, while national surve ys and other sources are used only when higher-priority data are unav ailable, ackno wledging their potentially greater measurement error and variability . Despite prioritising survey types to obtain one observation per country–year pair , 16 country-year pairs across 12 countries have two observ ations of the same surve y type. For each country-year pair with two observ ations for the same surve y type, the mean of the proportions was computed and used as the representati ve v alue for such pair . For the analysis, we select the 85 focus countries of the FP2030 initiativ e, previously identified as the 69 priority countries of FP2020. These countries were characterised as focus countries because the y represent populations with significant barriers to accessing family planning services and hav e the largest gaps in meeting demand for modern contraception [ 2 ]. Many are located in W estern, Eastern Africa and South-Central Asia, predominantly identified by their socioeconomic status, consisting of low and lo wer-middle income countries. T able 1 (see Appendix) presents the 85 focus countries along with the total number of surveys conducted and the year of the most recent surve y . The dataset spans fiv e world re gions, with Africa having the lar gest number of countries (48) across fi ve sub-re gions, and Europe having the fe west, with only one country in Eastern Europe. W e further limited the dataset for this analysis to survey observations from 1990 through the most recent available surve y year . Prior to 1990, family planning programs were primarily focused on reducing fertility and population growth, and the corresponding surve y data reflect these early program goals rather than the rights-based perspective on reproducti ve health and well-being [ 17 ]. W e also limited the analysis to the population of women who are married or in a union. This group is often referred to as Married/In-Union W omen of Reproductive Age [18]. 3.2 V isualisation of F amily Planning Survey Data [ 19 ] outlined fi ve principles for ef fective visualisation of panel data: (1) one panel per individual-le vel (country), (2) panel grouping to represent hierarchical structures, (3) the use of colour to distinguish and compare hierarchies, (4) panel ordering to facilitate comparison, and (5) consistent panel scaling for e ffecti ve comparison and interpretation. These principles guided our preliminary exploration of the family planning survey data. W e applied them by constructing stacked plots of modern and traditional contraceptiv e use, with each panel representing a country . The panels were grouped according to the UNPD sub-regional classifications and ordered by their average total contraceptive use (modern + traditional) for their most recent surve y year . Countries within each sub-region were ordered by their total contraceptiv e use for the most recent survey year . W e maintained consistent panel scaling to ensure that the differences between countries were meaningfully represented. 5 A P R E P R I N T Central America South America Eastern Europe Eastern Asia Southern Africa South−Eastern Asia South−Eastern Asia South−Central Asia South−Central Asia Western Asia Western Asia Northern Africa Melanesia Eastern Africa Eastern Africa Eastern Africa Caribbean Micronesia Middle Africa Middle Africa Western Africa Western Africa Western Africa Pol ynesia Nicaragua El Salvador Honduras Belize Bolivia Ukraine DPR Korea Mongolia Swaziland Lesotho Namibia Botswana Viet Nam Cambodia Lao PDR Indonesia Philippines Myanmar Timor−Leste Iran India Bhutan Uzbekistan Sri Lanka Bangladesh Nepal Kyr gyzstan Pakistan T ajikistan Afghanistan State of Palestine Lebanon Syrian Arab Rep., Jordan Y emen Morocco Egypt Algeria T unisia Sudan V anuatu Papua New Guinea Solomon Islands Zimbabwe Malawi Keny a Rwanda Uganda Madagascar Zambia T anzania Ethiopia Burundi Mozambique Comoros Djibouti Eritrea South Sudan Somalia Haiti Kiribati Sao T ome & Principe Congo DR Congo Cameroon Central African Rep., Angola Chad Cabo Ver de Burkina Faso Ghana Senegal Côte d'Ivoire Liberia T ogo Sierra Leone Guinea−Bissau Gambia Mali Nigeria Benin Mauritania Niger Guinea Samoa 1990 2000 2010 2020 1990 2000 2010 2020 1990 2000 2010 2020 1990 2000 2010 2020 1990 2000 2010 2020 1990 2000 2010 2020 1990 2000 2010 2020 1990 2000 2010 2020 0.0 0.2 0.4 0.6 0.8 0.0 0.2 0.4 0.6 0.8 0.0 0.2 0.4 0.6 0.8 0.0 0.2 0.4 0.6 0.8 0.0 0.2 0.4 0.6 0.8 0.0 0.2 0.4 0.6 0.8 0.0 0.2 0.4 0.6 0.8 0.0 0.2 0.4 0.6 0.8 0.0 0.2 0.4 0.6 0.8 0.0 0.2 0.4 0.6 0.8 0.0 0.2 0.4 0.6 0.8 year contraceptive use proportion contraceptive_categories modern traditional Figure 1: Stacked bar plot of contraceptive use sho wing both modern and traditional methods across countries. Countries are grouped by sub-region, with sub-re gions ordered by their av erage total (modern + traditional) contraceptiv e use in the most recent year and countries within sub-regions are also ordered according to their total contraceptiv e use in the most recent years. Central America sub-region has the highest (modern + traditional) contraceptiv e use with Nicaragua having the highest total contracepti ve use in its most recent survey year (2011) in Central America sub-re gion. 6 A P R E P R I N T Figure 1 presents the proportions of modern and traditional contracepti ve use among FP2030 focus countries. At the sub-regional lev el, Central America records the highest av erage contraceptive use, followed by South America and Eastern Europe. South America and Eastern Europe are each represented by a single FP2030 focus country , Boli via and Ukraine, respectiv ely . There are noticeable differences in total contracepti ve use within and across sub-regions. In the Eastern Asia subregion there are just two FP2030 focus countries, the Democratic People’ s Republic of K orea and Mongolia, both of which have high total contracepti ve use. In South-Eastern Asia, a fe w countries exhibit consistently high total contracepti ve use, with V ietnam being the highest. In South-Central Asia, Iran records the highest total contraceptiv e use in its most recent surv ey year . Likewise, Morocco in Northern Africa, Zimbabwe in Eastern Africa record the highest total contraceptiv e use in their most recent surve y year . Figure 1 also re veals v ariation in surve y frequency across countries, as recorded in T able 1 (see Appendix). V ietnam, Indonesia, and Philippines, countries in South-Eastern Asia, display the longest periods of annually recorded surv ey data. This indicates that the total number of surv eys conducted in these countries between 1990 to 2021 exceeds that of any other FP2030 focus country . In contrast, some countries exhibit only short periods of annual data collection. For e xample, Lesotho has annual surv ey data between 2000 and 2002 only . Other countries, particularly countries in Central America and Melanesia sub-regions, sho w consistent gaps of 3 to 5 years between surve ys. Beyond v ariation in survey frequency , Figure 1 shows that some sub-regions include only a single FP2030 focus country , as the sole population in the sub-region facing significant barriers to accessing family planning services: Bolivia in South America, Ukraine in Eastern Europe, Haiti in Caribbean, Kiribati in Micronesia and Samoa in Polynesia. Generally , in Figure 1, the bar plot re veals that modern contraceptiv e use accounts for a larger share of total contraceptive use than traditional methods. Ho wev er , exceptions are observ ed in some countries where the proportion of traditional contraceptiv e use is higher . For e xample, the proportion of traditional contracepti ve use w as higher in Bolivia during its first surve y year (1993), like wise all surv ey years in Somalia, a country in Eastern Africa. Similar pattern occurs in initial surv ey years across countries in Middle Africa sub-re gion, as well as some surve y years in countries of the W estern Africa sub-region. This pattern is consistent with findings reported by [ 2 ] which indicate that some countries report higher proportion of traditional contracepti ve use o ver modern re vealing barriers to accessing family planning services. According to the results of [ 2 ], the median prev alence of modern contraceptive use among women of reproductiv e age (15–49 years) in 2019 was 44.3% (95% uncertainty interv al: 42.1 – 47.0%). T raditional methods accounted for approximately 4.2% of use, calculated as the difference between ov erall contraceptiv e pre valence (48.5%) and modern methods. [ 20 ] also emphasised that modern contracepti ve methods are more reliable than traditional methods and are positioned higher in the hierarchy of contracepti ve ef fecti veness. Backed by these findings, the subsequent analysis focuses on modern contraceptiv e use. 4 Diagnostic Indices of Survey Data and Model-based Estimates FPEM relies on hierarchical Bayesian inference, which allo ws the model to share information across countries, sub- regions, regions and globally . The model produces smoothed estimates, and the hierarchical structure is especially useful where sparse data poses a challenge. W e assess not only how well the Bayesian model captures the temporal and variational patterns observed in the survey data, b ut also where hierarchical pooling influences the estimates. Using diagnostic measures such as trend strength and silhouette width from the collection of diagnostic indices of the wdiexplor er package, as described in Sub-section 2.3, we compare survey data and model-based estimates, and identify countries where deviations are most pronounced, highlighting conte xts in which the model hierarchy has a substantiv e impact. 4.1 T rend Str ength Measure T rend strength is one of the diagnostic indices of the wdie xplor er , under the category of trend and shape features. It quantifies the degree to which a series follo ws a consistent temporal pattern, whether linear or non-linear , relativ e to random fluctuations. T rend strength is the proportion of v ariance in the data explained by the variance of the remainder component of a decomposed time series relati ve to the v ariance of the sum of the smoothed trend component and the remainder component [ 15 ]. A series is considered to hav e a strong trend when the variance of the remainder component is small relati ve to the total v ariance. A weakly trended series has a lar ge remainder v ariance, reflecting greater irregular fluctuations [9]. T o ev aluate the strength of trends in the family planning survey data and model-based estimates, we calculate trend strength of each country in both datasets using the wdiexplor er package. These metrics were compared by calculating the ratio of model to surve y trend strength. 7 A P R E P R I N T W e present a scatterplot of the model to survey trend strength ratio versus the surv ey data trend strength for each of the 85 FP2030 focus country in Figure 2. Belize Chad Comoros Lebanon Somalia South Sudan T ajikistan Timor−Leste T unisia Ukraine 5 10 15 20 0.25 0.50 0.75 1.00 survey_trend_strength T rend strength ratio sub_region Caribbean Central America Eastern Africa Eastern Asia Eastern Europe Melanesia Micronesia Middle Africa Norther n Africa Polynesia South America South−Central Asia South−Eastern Asia Souther n Africa W estern Africa Western Asia Figure 2: Comparison of trend strengths in surve y data and model-based estimates across countries. Each point represents the ratio of model-based to survey trend strength plotted against the surve y trend strength for a country . All countries hav e ratios above 1, indicating that the model-based trends are stronger than the survey trends. Labelled points correspond to countries with extreme ratios of model-based to survey trends strength. Hov ering any point in the interactiv e version re veals the corresponding country name, its survey and model trend strength. Figure 2 sho ws that across all 85 focus countries, the trend strength ratio exceeds 1, indicating that the model-based trend strength is stronger than that derived directly from survey data. This pattern is consistent with the smoothing effect of FPEM. Smoothing increases apparent trend strength because it remov es short-term noise and measurement error , borro ws information from neighbouring time points to reinforce consistency , assumes gradual continuous change rather than abrupt shifts, and down-weights outliers; together these ef fects suppress variability in the raw data and make the underlying long-term pattern appear clearer , more consistent, and stronger than it does in the observed data points. Labelled points correspond to the top ten countries with the largest ratios, pointing to cases where the model estimates differ most from the observed surv ey trends. W e further examine these countries by comparing their surve y data points with their corresponding model-based trends. 8 A P R E P R I N T Survey: 0.049 Model: 0.996 Survey: 0.323 Model: 0.998 Survey: 0.079 Model: 0.994 Survey: 0.364 Model: 0.999 Survey: 0.233 Model: 0.984 Survey: 0.371 Model: 0.998 Survey: 0.279 Model: 0.998 Survey: 0.385 Model: 0.995 Survey: 0.292 Model: 0.998 Survey: 0.395 Model: 0.986 Somalia Chad South Sudan T unisia Timor−Leste Belize Comoros T ajikistan Ukraine Lebanon 1990 2000 2010 2020 1990 2000 2010 2020 1990 2000 2010 2020 1990 2000 2010 2020 1990 2000 2010 2020 1990 2000 2010 2020 1990 2000 2010 2020 1990 2000 2010 2020 1990 2000 2010 2020 1990 2000 2010 2020 0.35 0.40 0.45 0.50 0.1 0.2 0.3 0.40 0.45 0.50 0.55 0.60 0.45 0.50 0.55 0.275 0.300 0.325 0.350 0.375 0.05 0.10 0.10 0.14 0.18 0.05 0.10 0.3 0.4 0.5 0.6 0.00 0.02 0.04 0.06 0.08 year Modern contraceptive use proportion Figure 3: Surve y data trajectories and model-based trends for the top 10 countries with the largest ratios of model-based to surve y trend strength. Each panel presents the survey observ ations and corresponding model trajectory of a country , ordered by their ratios. Belize shows the highest ratio, reflecting a dip in its 2006 smoothed out by the model. Similarly , Comoros exhibits a sharp spike in 2000, with an observed proportion of modern contraceptiv e use far higher than other years. For the 10 countries with the lar gest deviations, Figure 3 displays their surv ey data points alongside the corresponding model-based trends over time. Each country is represented by a separate panel, and countries are ordered in descending order of the ratio value. W e ensure panel-specific scaling to accurately present the fluctuations in data points and trends for each country . Figure 3 illustrates how FPEM smooths surve y fluctuations in the top 10 countries with the highest ratios. The smoothed curv es are designed to highlight the underlying signal by filtering out some of the noise in the data. That makes the model based long-term trends look stronger and clearer than they appear in the raw observed data. All 10 countries hav e trend strength v alues calculated from the modelled estimates that are very close to 1, as one might expect. The differing ratios reflect variation in the trend strength of the observed data. Belize has a very low trend measurement for the surv ey observ ations, and its panel sho ws that the proportion of modern contracepti ve use decreased substantially in 2006 compared to pre vious years, follo wed by higher v alues in subsequent surv eys (2011 and 2015). This dip in the survey data is weakly captured in the model-based trend, as the model assumes gradual, continuous change ov er time rather than abrupt shifts. Comoros has a similarly low trend measurement for the surve y observations, b ut based on just three observations, where the middle one is unusually large. Other countries with high ratios, namely T ajikistan, Ukraine, Lebanon, and South Sudan, hav e sparse data, which does not follow a consistent upward or do wnward trend. In Somalia, the fitted trend exhibits bias and lies consistently below the observed surv ey points. In Figure 1, Somalia exhibits the lo west proportion of modern contraceptiv e use across all surve y years, both within its sub-re gion and relati ve to other sub-re gions. Gi ven this persistent deviation, one might expect the model-based trend to be partially pulled to ward the sub-re gional pattern, but the trend remains lo w , due to the influence of the low surv ey v alues. The high trend scores for the models relati ve to the surve ys across the 10 countries are attrib uted to FPEM including temporal smoothing and information sharing across countries within its hierarchical structure. Note also, while we rank surve y types and select the data point from the highest-ranked type for each country-year during our surve y data processing, FPEM uses all av ailable survey types to generate model estimates. T ogether , these modelling choices reduce the influence of survey noise, resulting in smoother trajectories and stronger apparent trends in the model-based estimates compared with the surve y data. 9 A P R E P R I N T 4.2 Silhouette Width Measur e Silhouette width is an output of the silhouette analysis and is one of the v ariation features of fered by wdie xplor er . It quantifies how well a data series align with its assigned group relativ e to other groups [ 16 ]. The silhouette value ranges from − 1 to +1 , where a value approaching +1 indicates that a country is well-aligned within its group and clearly separated from other groups, a value near 0 suggests a country is not clearly separated from other groups, and a value near − 1 indicates that the data trajectory of a country is closer to those of a different group. Silhouette analyses for both the survey and model-based estimates were conducted using the complete family planning dataset for all participating countries. W e calculated dissimilarities for all 185 countries, capturing the distance of each country to all others as well as its distance to countries within its sub-region. These dissimilarities formed the basis for computing the silhouette width. Although the analysis draws on the complete family planning dataset av ailable from the UNPD website, the partition plots display only FP2030 focus countries with more than one country in their sub-region. Sub-regions with only a single FP2030 country were excluded in the partition plot. Figures 4 and 5 are the partition plots of survey data and model-based estimates silhouette widths respecti vely . The partition plot is produced by one of the visualisation functions of the wdiexplor er and displays diagnostic metrics for each country while accounting for pre-defined groupings, here sub-regions used by FPEM. Each country m etric value is represented by a coloured bar ov er a lighter-shaded rectangular bar indicating the group average, allo wing easy comparison of silhouette widths of countries within their group [9]. Silhouette widths highlight ho w closely countries follo w the patterns of their assigned groups and re veal meaningful within-group deviations. Howe ver , when a country exhibits beha viour that div erges from that of other countries in the group, av erage dissimilarity for the group increases, which can influence the relativ e alignment of countries within the group. This pattern illustrates how outlier countries can pull the group av erage dissimilarity , affecting the alignment of the majority of countries within the group. A silhouette analysis based on median rather than av erage dissimilarity may be more appropriate for our context, b ut we hav e not in v estigated this. 10 A P R E P R I N T Melanesia Middle Africa Southern Africa Western Africa South−Central Asia Norther n Africa Western Asia Central America Eastern Africa South−Eastern Asia Eastern Asia −1.0 −0.8 −0.6 −0.4 −0.2 0.0 0.2 0.4 0.6 0.8 V anuatu Solomon Islands Papua Ne w Guinea Sao T ome & Pr incipe Congo Angola Cameroon Central African Rep., Chad DR Congo Botswana Swaziland Namibia Lesotho Cabo V erde Senegal Burkina Faso Sierra Leone Liberia Guinea Gambia Niger Ghana Côte d'Ivoire Nigeria T ogo Mali Mauritania Guinea−Bissau Benin Uzbekistan Bhutan Pakistan Afghanistan Iran T ajikistan Bangladesh Sri Lanka India Kyrgyzstan Nepal Sudan Morocco Egypt Algeria T unisia Jordan Syrian Arab Rep., State of Palestine Y emen Lebanon El Salvador Honduras Nicaragua Belize Mozambique T anzania Zimbabwe Uganda Burundi Eritrea Keny a Madagascar South Sudan Malawi Ethiopia Djibouti Zambia Somalia Rwanda Comoros Timor−Leste Viet Nam Myanmar Philippines Indonesia Cambodia Lao PDR DPR Korea Mongolia Metric Measure: sil_width Figure 4: Silhouette widths of the survey data across the FP2030 focus countries, grouped by sub-region excluding sub-regions with only one country . Each bar represents the silhouette width of its correspondence country , while the light-shaded rectangular bars indicate the a verage silhouette width for each sub-region. Sub-regions are ordered by their av erage silhouette width, and countries within the same group are ordered accordingly with the same colour to facilitate visual distinction within groups. All sub-region e xcept Melanesia exhibit ne gativ e group a verage silhouette width. 11 A P R E P R I N T Figure 4 displays the silhouette widths for the surve y data of the 85 FP2030 focus countries, grouped by sub-re gion. Haiti, Ukraine, Kiribati, Bolivia, and Samoa are excluded from the partition plot because they are the only FP2030 country in their sub-region, leaving no other focus countries for comparison. Note, other countries do exist in their sub-regions in the complete family planning dataset used to compute the silhouette analysis, as reported in T able 2 (see Appendix). Sub-regions are arranged in descending order of their a verage silhouette widths, and within sub-regions, countries are ordered by decreasing silhouette widths. Melanesia, a sub-region in the Oceania region, is the only sub-region with a positiv e average silhouette width. In this sub-region, Figure 1 shows that the three FP2030 focus countries consistently exhibit proportions of modern contraceptiv e use within a similar range across all surv ey years, although V anuatu displays slightly higher le vels than the other two countries. This ov erall similarity is reflected in their comparable and positi ve silhouette widths. Papua New Guinea with only three data points as reported in T able 1 (see Appendix) has a relati vely high silhouette width of 0 . 74 and Solomon Islands, with two data points, has a silhouette width of 0 . 66 . V anuatu has a silhouette width of 0 , because none of its surveys were conducted in the same years as those of other 5 countries in the Melanesia sub-region. (Recall that the complete dataset is used for the silhouette analysis). The group average silhouette width in this sub-region also reflects the observ ed low within group dissimilarity with positi ve av erage group silhouette width. In Central America sub-region, the focus countries consistently exhibit proportions of modern contracepti ve use within a similar pattern across survey years, see Figure 1. Howe ver , the silhouette widths shown in Figure 4 do not reflect this observation. This is explained by dif ferences in survey years across countries. Survey observ ations were conducted in different years, and in this sub-re gion, only a fe w surveys were conducted in the same year . As a result, dissimilarities for some country pairs were computed using only one or, at most, two common survey years. Silhouette widths in this sub-region are estimated solely on the years where both countries hav e recorded observations, which may not adequately capture the observed o verall similarity . Eastern Asia has the lo west av erage group silhouette width, with tw o of our focus countries exhibiting high negati ve silhouette widths. In Middle Africa, the Democratic Republic of Congo and Chad show positive silhouette widths, whereas other countries in the sub-region have negati ve values, with São T omé and Príncipe exhibiting the lowest. In Southern Africa, Botswana has an extreme negativ e silhouette width, indicating that its trajectory of modern contraceptiv e use is distinct from all other countries in the sub region. The influence of an outlier country is seen across most sub-re gions. For e xample, in South-Eastern Asia, T imor-Leste exhibits the lo west proportion of modern contraceptive use, as sho wn in Figure 1. Its silhouette width, which quantifies how closely a country follows the patterns in its assigned group, indicates that Timor -Leste has the lowest value, reflecting its minimal alignment with the South-Eastern Asia sub-region (Figure 4). This extreme deviation contrib utes to an increased group average dissimilarity , reflecting the influence of an outlying country . A similar ef fect is observed in Sudan within the Northern Africa sub-region, where its contracepti ve use is the least compared to the neighbouring countries, resulting in low silhouette width and higher group a verage dissimilarity . In W estern Africa, Cabo V erde has the highest proportion of modern contracepti ve use across its surve y years relati ve to other countries in the sub-re gion. Its lo w silhouette width indicates that it is the least aligned country within the W estern Africa sub-region, thereby contributing to a negativ e group average silhouette width and thus higher overall group dissimilarity . By contrast, se veral countries within a similar range of proportions of modern contracepti ve use in W estern Africa sub-region, namely Benin, Guinea-Bissau, and Mauritania exhibit positiv e silhouette widths, demonstrating better alignment. Overall, most countries e xhibit strongly negati ve silhouette widths. In the literal interpretation of silhouette width, these values indicate that the data series trajectories of these countries are more similar to countries outside their assigned sub-regions than to those within. Several f actors may contrib ute to these de viations. Firstly , we observ ed in Figure 1 that there is high v ariation in contraceptiv e use within each subregion. Furthermore, as discussed above, the presence of outlier countries can affect group alignment. In addition, family planning survey data were collected at irregular interv als, and because dissimilarities are computed only between observations from the same year , silhouette widths are estimated using dissimilarities of only those years where both countries in a pair ha ve recorded observ ations. These inconsistencies could hav e amplified negativ e silhouette widths and weaken the alignment of countries within their sub-region. 12 A P R E P R I N T Melanesia Southern Africa Western Asia Western Africa Middle Africa Central America South−Central Asia South−Eastern Asia Eastern Africa Eastern Asia Norther n Africa −0.8 −0.6 −0.4 −0.2 0.0 0.2 Solomon Islands V anuatu Papua Ne w Guinea Botswana Namibia Lesotho Swaziland Y emen Jordan Lebanon State of Palestine Syrian Arab Rep., Cabo V erde Niger Mauritania Guinea Nigeria Benin Gambia Mali Ghana Côte d'Ivoire Guinea−Bissau T ogo Liberia Burkina Faso Sierra Leone Senegal Sao T ome & Pr incipe Congo Central African Rep., DR Congo Angola Cameroon Chad Belize El Salvador Nicaragua Honduras Afghanistan T ajikistan Pakistan Iran Uzbekistan Sri Lanka Bangladesh India Bhutan Nepal Kyrgyzstan Timor−Leste Viet Nam Philippines Cambodia Indonesia Lao PDR Myanmar Zimbabwe Eritrea Mozambique Comoros South Sudan Djibouti Somalia Keny a Burundi T anzania Zambia Malawi Uganda Madagascar Ethiopia Rwanda Mongolia DPR Korea Sudan Morocco Egypt Algeria T unisia Metric Measure: sil_width Figure 5: Silhouette widths of the model-based estimates across the 85 FP2030 focus countries, grouped by sub-region excluding sub-re gions with only a single country . Sub-regions are ordered by their av erage silhouette width. Countries within the same sub-region share the same bar and axis te xt colour to facilitate visual distinction within groups. All sub-regions have negati ve average silhouette widths, except Melanesia and Southern Africa with positive average silhouette widths. 13 A P R E P R I N T Figure 5 is the partition plot of the model-based estimates dataset for the 85 focus countries, excluding the 5 countries that are the only country in their sub-regions. Figure 5 shows that all countries in the Melanesia sub-region exhibit positiv e silhouette widths as seen in Figure 4. Notably , V anuatu now has a silhouette v alue; in the survey partition plot of Figure 4, it lacked a v alue because the surve y years of its observ ations did not match the surv ey years of the other countries in the sub-region. With FPEM generating annual estimates, this is no longer an issue. Southern Africa sho ws a relati vely small positi ve a verage silhouette width, with Botswana as the only country e xhibiting a negati ve value, whereas in Figure 4, all countries exhibit negati ve silhouette widths. This reflects how the use of model-based annual estimates from FPEM, which enables consistent year -to-year comparisons across countries, can result in more robust silhouette widths that better represent alignment within this sub-re gion. In W estern Africa, Cabo V erde stands out with an extremely low silhouette width. This pattern was also evident in Figure 4, as Cabo V erde is the only focus country in the W estern Africa sub-region with a high uptake on modern contraception. Similarly , Y emen stands out among W estern Asia countries with an extremely lo w silhouette width, though this was not apparent in Figure 4. Looking back at Figure 1, we see that Y emen has by far the lowest contracepti ve use in its sub re gion. Other sub-regions including Central America, South-Central Asia, South-Eastern Asia, Eastern Africa, Eastern Asia, and Northern Africa are dominated by countries with moderate to strongly negati ve silhouette widths. This same pattern was observed in the surv ey-based silhouette width as seen in Figure 4. In Figure 4, countries in the W estern Asia sub-region sho w negati ve silhouette widths, with an a verage group width of − 0 . 61 . The model-based estimates in Figure 5 present a slightly different picture: while Jordan and Y emen remain negati v e, other countries exhibit positi ve (though close to zero) silhouette widths, with an av erage group width of − 0 . 06 . This comparison highlights ho w the annual model-based estimates of FPEM adjust the alignment of countries within the sub-region relati ve to the surve y-based data. Building on this, we compared the silhouette widths from the model-based estimates with those from the survey data to assess ho w well the model reproduces the patterns observed in the surve y and to highlight cases with high differences in their v alues. 14 A P R E P R I N T Burkina Faso DR Congo Jordan P apua New Guinea Senegal Solomon Islands −1.0 −0.5 0.0 0.5 −1.0 −0.5 0.0 0.5 survey_sil_width model_sil_width sub_region Caribbean Central America Eastern Afr ica Easter n Asia Eastern Europe Melanesia Micronesia Middle Africa Nor thern Africa Polynesia South America South−Centr al Asia South−Eastern Asia Souther n Africa Western Africa Western Asia Figure 6: Comparison of silhouette widths between survey data and model-based estimates across countries. Each point represents the model-based silhouette width plotted against the survey silhouette width of a country . The diagonal line represents the identity line. Countries are coloured by sub-region to facilitate the identification of within group patterns. The labelled points correspond to the top three countries with the largest absolute dif ferences between the two metrics and three other countries with the highest positi ve surv ey silhouette width. Countries represented by points close to the diagonal ha ve similar silhouette widths in both the surve y and model-based estimates. Hovering an y point in the interactiv e version re veals the corresponding country name, its survey and model-based silhouette widths. Figure 6 presents the scatterplot of model-based silhouette widths against the survey silhouette width for each country . The labelled countries are positioned far away from the diagonal line and their observations and model-based trends are shown in more detail in Figure 7. Generally , we would expect model-based silhouette values to be bigger than those calculated from the survey data. This is due to the effect of smoothing, which flattens out local discrepancies and also the influence of the Bayesian hierarchical framew ork which borrows strength in modelling trajectories within sub-regions. Consequently , most of the points in Figure 6 are abo ve the diagonal line. The three labelled countries in Figure 6 (Burkina Faso and Sene gal in W estern Africa, and Jordan in W estern Asia) with model-based silhouette widths considerably higher than values from the surve y data would consequently appear to benefit a lot from the ef fects of modelling, e ven though their model-based silhouette values are still near zero. T o further examine the large dif ferences in their silhouette widths, we compare the surve y data trajectories to the corresponding model-based trends of the labelled countries. 15 A P R E P R I N T Survey: −0.678 Model: 0.071 Survey: −0.746 Model: 0.086 Survey: 0.735 Model: 0.262 Survey: 0.664 Model: 0.079 Survey: −0.741 Model: −0.034 Survey: 0.407 Model: −0.016 W estern Africa Burkina Faso W estern Africa Senegal Melanesia P apua New Guinea Melanesia Solomon Islands W estern Asia Jordan Middle Africa DR Congo 1990 2000 2010 2020 1990 2000 2010 2020 1990 2000 2010 2020 1990 2000 2010 2020 1990 2000 2010 2020 1990 2000 2010 2020 0.0 0.2 0.4 0.6 0.20 0.25 0.30 0.35 0.40 0.0 0.1 0.2 0.3 0.4 0.5 0.0 0.2 0.4 0.6 0.20 0.25 0.30 0.35 0.40 0.1 0.2 0.3 0.4 year Modern contraceptive use proportion Figure 7: Survey data trajectories and model-based trends for the labelled countries with high absolute differences between model-based and surve y silhouette widths in Figure 6. The labelled countries are presented along the other countries in their sub-region to compare their data series and model trends. Sub-regions are ordered by their silhouette width. Labelled countries are uniquely highlighted by distinct colours while the model trajectory of other countries in their sub-region are presented in gre y colour . Countries in W estern Africa have higher model-based silhouette width, while countries in Melanesia hav e higher surve y silhouette width. Survey and model-based silhouette widths for each labelled country are presented in their panel. Hov ering any line in the interactiv e version rev eals the corresponding country name, and its surve y and model silhouette widths. Figure 7 also labels three countries with unusually high surve y-based silhouette width, relativ e to those from the model trajectories. These are the three countries with the highest silhouette width in Figure 4, and their observ ations and trends are shown in Figure 7. As noted previously and as sho wn in Figure 6, the two Melanesia countries (Papua Ne w Guinea and Solomon Islands) have just a fe w surve y observations and so the surve y-based distances and thus silhouette widths are unreliable. The third country , DR Congo based on its surv ey silhouette v alue is the most middling country in Middle Africa, which is consistent with Figure 1. The drop in silhouette value for its model trajectory is likely explained by the fact that the smooth remains flat between 2000 and 2014, unlike other Middle Africa countries. The comparison of surve y and model-based trend strengths and silhouette widths highlights the influence of the Bayesian hierarchical framew ork and the time series modelling in FPEM, which smooths country trajectories. The low silhouette values for the observed data reflects the fact that most of the sub-regions have quite a lot of variation across their observed data trajectories. The silhouette v alues calculated from the model are somewhat higher . This analysis suggests 16 A P R E P R I N T that a grouping structure other than sub-re gion might be more informati ve for f amily planning modelling. T o further strengthen our exploratory analysis, we analysed the residuals between the model estimates and surv ey observ ations. 5 Exploratory Residual Analysis of the Survey and Model-based F amily Planning Datasets T o further compare ho w the model-based estimates of modern contracepti ve use dif fers from the surve y data, we analyse the residuals using two selected diagnostic indices of the wdiexplor er as discussed in Sub-section 2.3. W e compute the linearity and curvature of the residuals for each country . If the model captures the patterns in the data trajectories, the residuals should appear as random fluctuations around the zero line, with linearity and curv ature values close to zero. When the residuals instead sho w some patterns, such as consistent upward or do wnward mo vements or fluctuations ov er time, it indicates that the fitted model has not fully captured important structure in the data. Linearity is one of the diagnostic indices implemented in the wdie xplor er . It measures the ov erall direction of a data series over time. When applied to the residuals of the family planning datasets, this measure ev aluates how closely the residuals follow a straight-line pattern. The linearity value is obtained as the coefficient of the linear term ( β 1 ) in an orthogonal polynomial regression fitted to the smoothed trend component of the decomposed series. Positiv e v alues indicate an increasing linear pattern in the residuals, while ne gati ve v alues indicate a decreasing pattern. Because residuals from a well-fitting model should resemble random noise, we expect minimal to no linear structure, with linearity values near zero. The curv ature feature implemented in the wdiexplor er measures how much a series bends a way from a straight-line pattern ov er time, capturing non-linear mo vements such as gradual upward or do wnward curves (U- shaped and the in verted U-shaped). It is computed as the coefficient of the quadratic term of an orthogonal polynomial regression fitted to the trend component of the decomposed residuals [ 15 ]. As with linearity , residuals that behav e like random noise should hav e curv ature values close to zero. T o examine the linearity and curvature of the residuals in the family planning datasets, we present a scatterplot of these two metrics in Figure 8. Most countries cluster near zero for both metrics. The labelled points indicate countries where either linearity or curvature de viates much from the expected random behaviour . 17 A P R E P R I N T Afghanistan Algeria Bhutan Burkina Faso Mongolia P akistan −0.04 −0.02 0.00 0.02 −0.05 0.00 0.05 0.10 linearity curvature sub_region Caribbean Central America Eastern Africa Eastern Asia Eastern Europe Melanesia Micronesia Middle Africa Northern Africa P olynesia South America South−Central Asia South−Eastern Asia Souther n Africa W estern Africa W estern Asia Figure 8: A scatterplot of residual curv ature against linearity from the FP surve y and model-based datasets, with each point representing a country and coloured by sub-region. It assesses whether linear or non-linear patterns remain in the residuals of each country . Most countries are around the vertical and horizontal lines indicating zero and near-zero curvature or linearity v alues. The labelled points correspond to countries with slight unexplained v ariation between the surve y and the model-based estimates. Each panel presents the curv ature and linearity v alues of its country . Hovering any point in the interacti ve v ersion re veals the corresponding country name, the curv ature and linearity of its residuals. Figure 8 shows that the model performs well for most countries. The residuals cluster close to zero on both the linearity and curvature ax es, indicating little evidence of systematic linear or non-linear structure in the unexplained variation. A small number of countries, which are labelled in the plot, fall somewhat farther from zero, although these de viations are not large, the y sho w a higher absolute linearity or curv ature relative to other countries. For example, Mongolia has a curvature v alue of − 0 . 042 and a linearity v alue of − 0 . 022 , illustrating modest fluctuations in its residual pattern. In contrast, Bhutan has a curvature value of zero, while its linearity deviates noticeably from zero, suggesting a linear residual structure. Figure 9 further examines these residual patterns. Figure 9 presents residual trajectories, a superimposed quadratic fit, the data series and model trends for the labelled countries from Figure 8. Burkina Faso is also included: although the residuals analysis indicates good model fit, it stood out in earlier analysis of silhouette widths for the survey and model-based trends. This inclusion illustrates a situation where strong diagnostics from residuals coexist with atypical trend-strength measures. 18 A P R E P R I N T Linearity: 0.043 Curvature: −0.019 Linearity: −0.055 Curvature: −0.011 Linearity: 0.119 Curvature: 0.000 Linearity: 0.011 Curvature: 0.018 Linearity: −0.022 Curvature: −0.042 Linearity: −0.049 Curvature: 0.016 −0.025 0.000 0.025 0.050 −0.050 −0.025 0.000 0.025 0.050 −0.02 −0.01 0.00 0.01 0.02 0.03 0.00 0.05 0.10 0.15 −0.06 −0.04 −0.02 0.00 0.02 0.04 Afghanistan Algeria Bhutan Burkina Faso Mongolia Pakistan 1990 2000 2010 2020 1990 2000 2010 2020 1990 2000 2010 2020 1990 2000 2010 2020 1990 2000 2010 2020 1990 2000 2010 2020 −0.025 0.000 0.025 residuals Afghanistan Algeria Bhutan Burkina Faso Mongolia Pakistan 1990 2000 2010 2020 1990 2000 2010 2020 1990 2000 2010 2020 1990 2000 2010 2020 1990 2000 2010 2020 1990 2000 2010 2020 0.2 0.4 0.6 year Modern contraceptive use proportion Figure 9: Labelled countries with non-zero curvature and linearity residual scores. The top panels show the residual trajectories and a superimposed quadratic fit of each country while the bottom panels display their survey data and corresponding model trends, illustrating the extent to which the model captures the patterns in each labelled country . In Figure 9, residuals are shown in the top tow and the observed data with the model-based trends in the bottom row , with countries ordered consistently across rows. Bhutan has by far the largest linearity measure, which upon inspection is due to the substantial impro vement in contracepti ve use in 2010, which is not captured by the model. Upon in vestig ation, earlier surve ys in Bhutan, were based on national surv eys, whereas the 2010 observ ation comes from a Multiple Indicator Cluster Survey . While the analysis allo ws for observations from dif ferent surveys and FPEM uses all surve ys observations, the sudden spike w as not captured by the model. In Afghanistan, the residuals exhibit a linearity of 0 . 043 and a curvature of − 0 . 019 . The observed proportion of modern contraceptiv e use in 2000 is substantially lower than in other surve y years, resulting in a large negati ve residual for this year . Similarly , in 2010, where the observed v alue is relati v ely high, the model exhibits a slight bias, which may be attributed to its hierarchical pooling effect. T ogether, these deviations account for the observ ed upward follo wed by do wnward pattern in the residuals, as captured by the linearity and curvature measures. In Pakistan, the linearity and curv ature values capture the discrepancy in the model fit ov er the period 2003–2012, as reflected in the residuals. Surve y observations during this period show sudden increases and decreases in the proportion of modern contraceptiv e use, which do not follow a consistent temporal pattern. The time-series component of FPEM assumes smooth and continuous change rather than abrupt shifts; as a result, short-term fluctuations are smoothed in the model-based trends, gi ving rise to U-shaped residual trajectories. This behaviour is reflected in the residual curv ature value of 0 . 016 , while the observed dip between 2003 and 2005 is indicated by the ne gati ve linearity v alue of − 0 . 049 , corresponding to a downw ard bias in the model during these years. Afghanistan, Bhutan, and Pakistan, all belonging to the same sub-region, exhibit notable discrepancies that warrant further in vestig ation of the South-Central Asia sub-re gion. Across these countries and the other countries examined abov e, residual analysis highlights discrepancies between model-based trends and surve y observations. Somalia, a country not included in Figure 9 sho ws a do wnward-biased model prediction, with the fitted trend consistently lying belo w the observed surv ey points as sho wn in Figure 3. This downward bias is reflected in the residuals, which though positiv e are all small in magnitude, resulting in negligible linearity and curv ature measures. These findings establish the importance of e xploring the observ ed data, the model-based trends, and the residuals to better understand the temporal patterns, diagnose where and inv estigate ho w well the model captures the observed patterns. 19 A P R E P R I N T 6 Conclusion This study explored surve y data and FPEM-based estimates of modern contraceptiv e pre valence using time series diagnostic indices implemented in the wdiexplor er package. Recognising that FPEM estimates are inherently smoothed, we assessed how well the model captures observ ed temporal patterns of modern contraceptiv e use across the 85 focus countries of the FP2030 initiativ e. By ev aluating ho w well model trends reflect the underlying survey observ ations and the heterogeneity of family planning trajectories across countries and sub-re gions, this study provides insight into the temporal dynamics of the proportions of modern contraceptiv e use across the 85 FP2030 focus countries and highlight where discrepancies between model-based estimates and surve y observ ations are most pronounced, with visualisation serving as a key tool. V isualisation is central to the analysis, enabling direct comparison of relativ ely sparse survey observations with annual modelled trajectories and facilitating the interpretation of diagnostic measures at both country and sub-regional le vels. Across the 85 focus countries, the selected diagnostics indices: silhouette width, trend strength, linearity and curvature indicate that FPEM generally captures long-term trends in modern contracepti ve use data. Deviations from the surve y data are most pronounced in countries and years exhibiting abrupt changes. For example, in Belize and Comoros, the model assumes gradual, continuous change o ver time rather than the sudden shifts observ ed in the data. In Somalia, while one would expect the model-based trend to partially align with the sub-regional patterns, it consistently falls below the observ ed surve y points. Residual analysis highlights these discrepancies, providing a detailed view of where and how the model di ver ges from the observed data. Other countries with notable discrepancies, Afghanistan, Bhutan, and Pakistan, all belonging to the same sub-re gion, suggest that a grouping structure other than sub-region may improv e the modelling of family planning trends. This analysis is subject to limitations arising from the structure of the family planning survey data. These data are country-lev el surve y observations obtained from multiple nationally representative household surveys, sometimes resulting in multiple observations per surve y year and often temporal gaps of up to 6 years. The wdiexplor er package is dev eloped to e xplore country-lev el panel data with one observ ation per country-year pair . Also, infrequent temporal gaps make se veral diagnostic measures of wdiexplor er unsuitable for capturing temporal behaviour in the proportion of modern contraceptiv e use. While silhouette width was considered appropriate, it poses a challenge. Dissimilarity-based measures are sensitiv e to temporal gaps, and could distort group-lev el alignment. One possible way to address this limitation is to estimate missing survey data points using linear interpolation prior to calculating dissimilarities. In addition, this analysis uses the mean dissimilarity of country pairs to quantify country-lev el dissimilarity; howe ver , this measure can be sensitiv e to extreme distance v alues, an alternativ e approach would be the use of median instead of the mean in silhouette analysis, which may provide a more rob ust interpretation of group-le vel patterns in the data. In conclusion, this study demonstrates that combining time series diagnostic indices with visualisation offers a frame work for ev aluating how well model-based estimates align with observations. This analysis confirms that FPEM-based estimates generally capture long-term trends in modern contracepti ve use data across the 85 FP2030 focus countries, while also highlighting specific countries and periods where the model div erges from observed data, particularly in cases of abrupt changes or where sub-re gional grouping may not fully capture local dynamics. By identifying these discrepancies, this approach not only provides insight into the temporal patterns of family planning trajectories but also points to opportunities for refining hierarchical modelling strate gies. Despite limitations arising from sparse and unev enly spaced surve y data, the integration of diagnostic measures and visualisation enables a nuanced assessment of model performance. 20 A P R E P R I N T References [1] Maud Anne Bracke. W omen’ s rights, family planning, and population control: the emergence of reproducti ve rights in the united nations (1960s–70s). The International History Re view , 44(4):751–771, 2022. [2] United Nations, Department of Economic and Social Affairs, Population Di vision. F amily Planning and the 2030 Agenda for Sustainable Development: Data Booklet . ST/ESA/SER.A/429. United Nations, 2019. [3] FP2030. About fp2030: W orking together to advance family planning around the world., 2025. Accessed: 2025-10-24. [4] Karen Hardee and Sandra Jordan. Advancing rights-based family planning from 2020 to 2030. Open access journal of contraception , pages 157–171, 2021. [5] Bernice Kuang and Isabel Brodsky . Global trends in family planning programs, 1999–2014. International P erspectives on Sexual and Repr oductive Health , 42(1):33–44, 2016. [6] Niamh Cahill, Emily Sonne veldt, Priya Emmart, Jessica W illiamson, Robinson Mb u, Airy Barrière F odjo Y etgang, Isaac Dambula, Gizela Azambuja, Alda Antonio Mahumane Govo, Binod Joshi, et al. Using family planning service statistics to inform model-based estimates of modern contracepti ve pre v alence. Plos one , 16(10):e0258304, 2021. [7] Leontine Alkema, Vladimira Kantorov a, Clare Menozzi, and Ann Biddlecom. National, regional, and global rates and trends in contraceptiv e prev alence and unmet need for family planning between 1990 and 2015: a systematic and comprehensiv e analysis. The Lancet , 381(9878):1642–1652, 2013. [8] Niamh Cahill, Emily Sonneveldt, John Stov er , Michelle W einberger , Jessica W illiamson, Chuchu W ei, W in Brown, and Leontine Alkema. Modern contraceptive use, unmet need, and demand satisfied among women of reproductiv e age who are married or in a union in the focus countries of the family planning 2020 initiative: a systematic analysis using the family planning estimation tool. The Lancet , 391(10123):870–882, 2018. [9] Oluwayomi Akinfenwa, Niamh Cahill, and Catherine Hurle y . wdiexplorer: An r package designed for exploratory analysis of world de velopment indicators (wdi) data, 2025. [10] David Hubacher and James T russell. A definition of modern contraceptiv e methods. Contraception , 92(5):420–421, 2015. [11] United Nations Department of Economic and Social Affairs, Population Di vision. Family planning data. https: //www.un.org/development/desa/pd/data/family- planning- data , 2024. Accessed: 2025-11-25. [12] Gregory Guranich, Niamh Cahill, and Leontine Alk ema. Fpemlocal: Estimating family planning indicators in r for a single population of interest. Gates Open Researc h , 5:24, 2021. [13] John W Tuk ey and Paul A T ukey . Computer graphics and exploratory data analysis: An introduction. In Pr oceedings of the sixth annual confer ence and exposition: computer graphics , volume 85, pages 773–785, 1985. [14] Leland W ilkinson and Graham Wills. Scagnostics distributions. Journal of Computational and Graphical Statistics , 17(2):473–491, 2008. [15] Rob J. Hyndman and George Athanasopoulos. F orecasting: Principles and Practice . O T exts, Melbourne, Australia, 3rd edition, 2021. Accessed on 2025-07-05. [16] Peter J Rousseeuw . Silhouettes: a graphical aid to the interpretation and validation of cluster analysis. Journal of computational and applied mathematics , 20:53–65, 1987. [17] Saumya RamaRao and Anrudh K Jain. Aligning goals, intents, and performance indicators in family planning service deliv ery . Studies in family planning , 46(1):97–104, 2015. [18] Niamh Cahill, Michelle W einberger , and Leontine Alkema. What increase in modern contraceptive use is needed in fp2020 countries to reach 75% demand satisfied by 2030? an assessment using the accelerated transition method and family planning estimation model. Gates Open Resear ch , 4:113, 2020. [19] Oluwayomi Akinfenwa, Niamh Cahill, and Catherine Hurle y . V isualisation for exploratory modelling analysis of bayesian hierarchical models. arXiv preprint , 2024. [20] Maria Paz Marquez, Maria Midea Kabamalan, and Elma Laguna. T raditional and modern contraceptiv e method use in the philippines: trends and determinants 2003–2013. Studies in F amily Planning , 49(2):95–113, 2018. 21 A P R E P R I N T 7 Acknowledgments This publication has emanated from research conducted with the financial support of T aighde Éireann – Research Ireland under Grant number 18/CR T/6049. For the purpose of Open Access, the author has applied a CC BY public copyright licence to any Author Accepted Manuscript v ersion arising from this submission. 22 A P R E P R I N T A ppendix A: Survey Data T able T able 1: Summary of surveys for family planning focus countries Country Sub Region Number of Surveys Recent Survey Afghanistan South-Central Asia 8 2018 Algeria Northern Africa 7 2018 Angola Middle Africa 4 2015 Bangladesh South-Central Asia 13 2019 Belize Central America 5 2015 Benin W estern Africa 6 2017 Bhutan South-Central Asia 4 2010 Bolivia South America 6 2016 Botswana Southern Africa 2 2017 Burkina Faso W estern Africa 11 2020 Burundi Eastern Africa 7 2016 Cabo V erde W estern Africa 3 2018 Cambodia South-Eastern Asia 6 2014 Cameroon Middle Africa 7 2018 Central African Republic Middle Africa 5 2018 Chad Middle Africa 6 2019 Comoros Eastern Africa 3 2012 Congo Middle Africa 3 2014 Côte d’Ivoire W estern Africa 8 2020 DPR K orea Eastern Asia 8 2017 DR Congo Middle Africa 6 2017 Djibouti Eastern Africa 3 2012 Egypt Northern Africa 10 2014 El Salvador Central America 5 2014 Eritrea Eastern Africa 3 2010 Ethiopia Eastern Africa 12 2020 Gambia W estern Africa 7 2019 Ghana W estern Africa 13 2017 Guinea W estern Africa 6 2018 Guinea-Bissau W estern Africa 5 2018 Haiti Caribbean 5 2016 Honduras Central America 6 2019 India South-Central Asia 8 2019 Indonesia South-Eastern Asia 25 2018 Iran South-Central Asia 9 2010 Jordan W estern Asia 7 2017 Ken ya Eastern Africa 11 2020 Kiribati Micronesia 2 2018 Kyr gyzstan South-Central Asia 5 2018 Lao PDR South-Eastern Asia 5 2017 Lebanon W estern Asia 4 2009 Lesotho Southern Africa 9 2018 Liberia W estern Africa 4 2019 Madagascar Eastern Africa 9 2020 Malawi Eastern Africa 9 2019 Mali W estern Africa 7 2018 Mauritania W estern Africa 6 2019 Mongolia Eastern Asia 9 2018 Morocco Northern Africa 6 2018 Mozambique Eastern Africa 6 2015 Continued on next page 23 A P R E P R I N T T able continued from previous page Country Sub Region Number of Surveys Recent Survey Myanmar South-Eastern Asia 6 2015 Namibia Southern Africa 4 2013 Nepal South-Central Asia 10 2019 Nicaragua Central America 5 2011 Niger W estern Africa 10 2021 Nigeria W estern Africa 12 2018 Pakistan South-Central Asia 11 2018 Papua Ne w Guinea Melanesia 3 2016 Philippines South-Eastern Asia 17 2017 Rwanda Eastern Africa 8 2019 Samoa Polynesia 4 2019 Sao T ome and Principe Middle Africa 5 2019 Senegal W estern Africa 12 2019 Sierra Leone W estern Africa 8 2019 Solomon Islands Melanesia 2 2015 Somalia Eastern Africa 4 2018 South Sudan Eastern Africa 4 2015 Sri Lanka South-Central Asia 4 2016 State of Palestine W estern Asia 6 2019 Sudan Northern Africa 5 2014 Swaziland Southern Africa 5 2014 Syrian Arab Republic W estern Asia 4 2009 T ajikistan South-Central Asia 5 2017 T anzania Eastern Africa 8 2015 T imor-Leste South-Eastern Asia 8 2016 T ogo W estern Africa 6 2017 T unisia Northern Africa 6 2018 Uganda Eastern Africa 12 2021 Ukraine Eastern Europe 4 2012 Uzbekistan South-Central Asia 4 2006 V anuatu Melanesia 3 2013 V ietnam South-Eastern Asia 21 2020 Y emen W estern Asia 5 2013 Zambia Eastern Africa 6 2018 Zimbabwe Eastern Africa 7 2015 24 A P R E P R I N T T able 2: A tabular representation of the total number of countries in each sub-region, grouped by FP2030 focus country status. Sub_region Number of FP2030 countries Others Eastern Africa 16 2 W estern Africa 16 0 South-Central Asia 11 3 Middle Africa 7 2 South-Eastern Asia 7 3 Northern Africa 5 6 W estern Asia 5 11 Central America 4 4 Southern Africa 4 1 Melanesia 3 3 Eastern Asia 2 5 Caribbean 1 11 Eastern Europe 1 9 Micronesia 1 4 Polynesia 1 3 South America 1 11 25
Original Paper
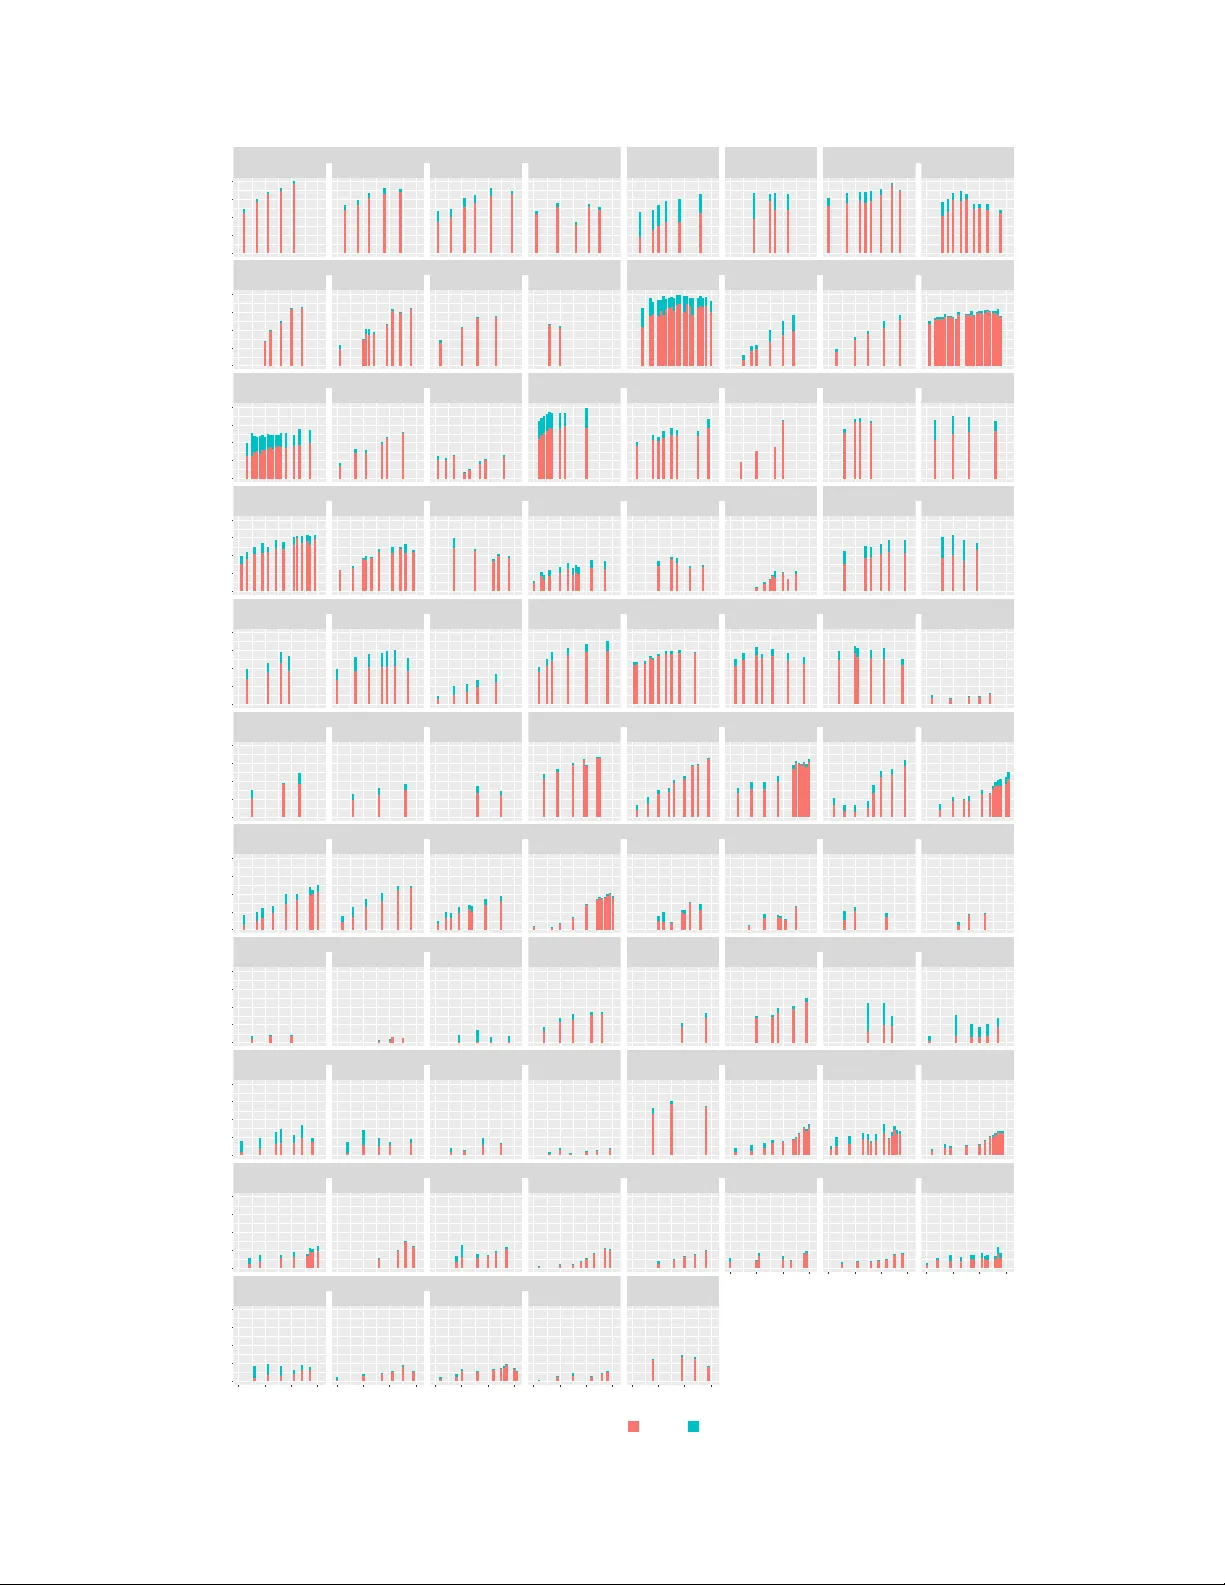
Loading high-quality paper...
Comments & Academic Discussion
Loading comments...
Leave a Comment