Odor Communication with Green Leaf Volatiles for Stress Signalling in the Internet of Plants
This paper develops an end-to-end odor communication model for stress signaling between plants using Green Leaf Volatiles (GLV). A damaged transmitter plant emits (Z)-3-hexenal, (Z)-3-hexenol, and (Z)-3-hexenyl acetate, which propagate through a time…
Authors: Fatih Merdan, Ozgur B. Akan
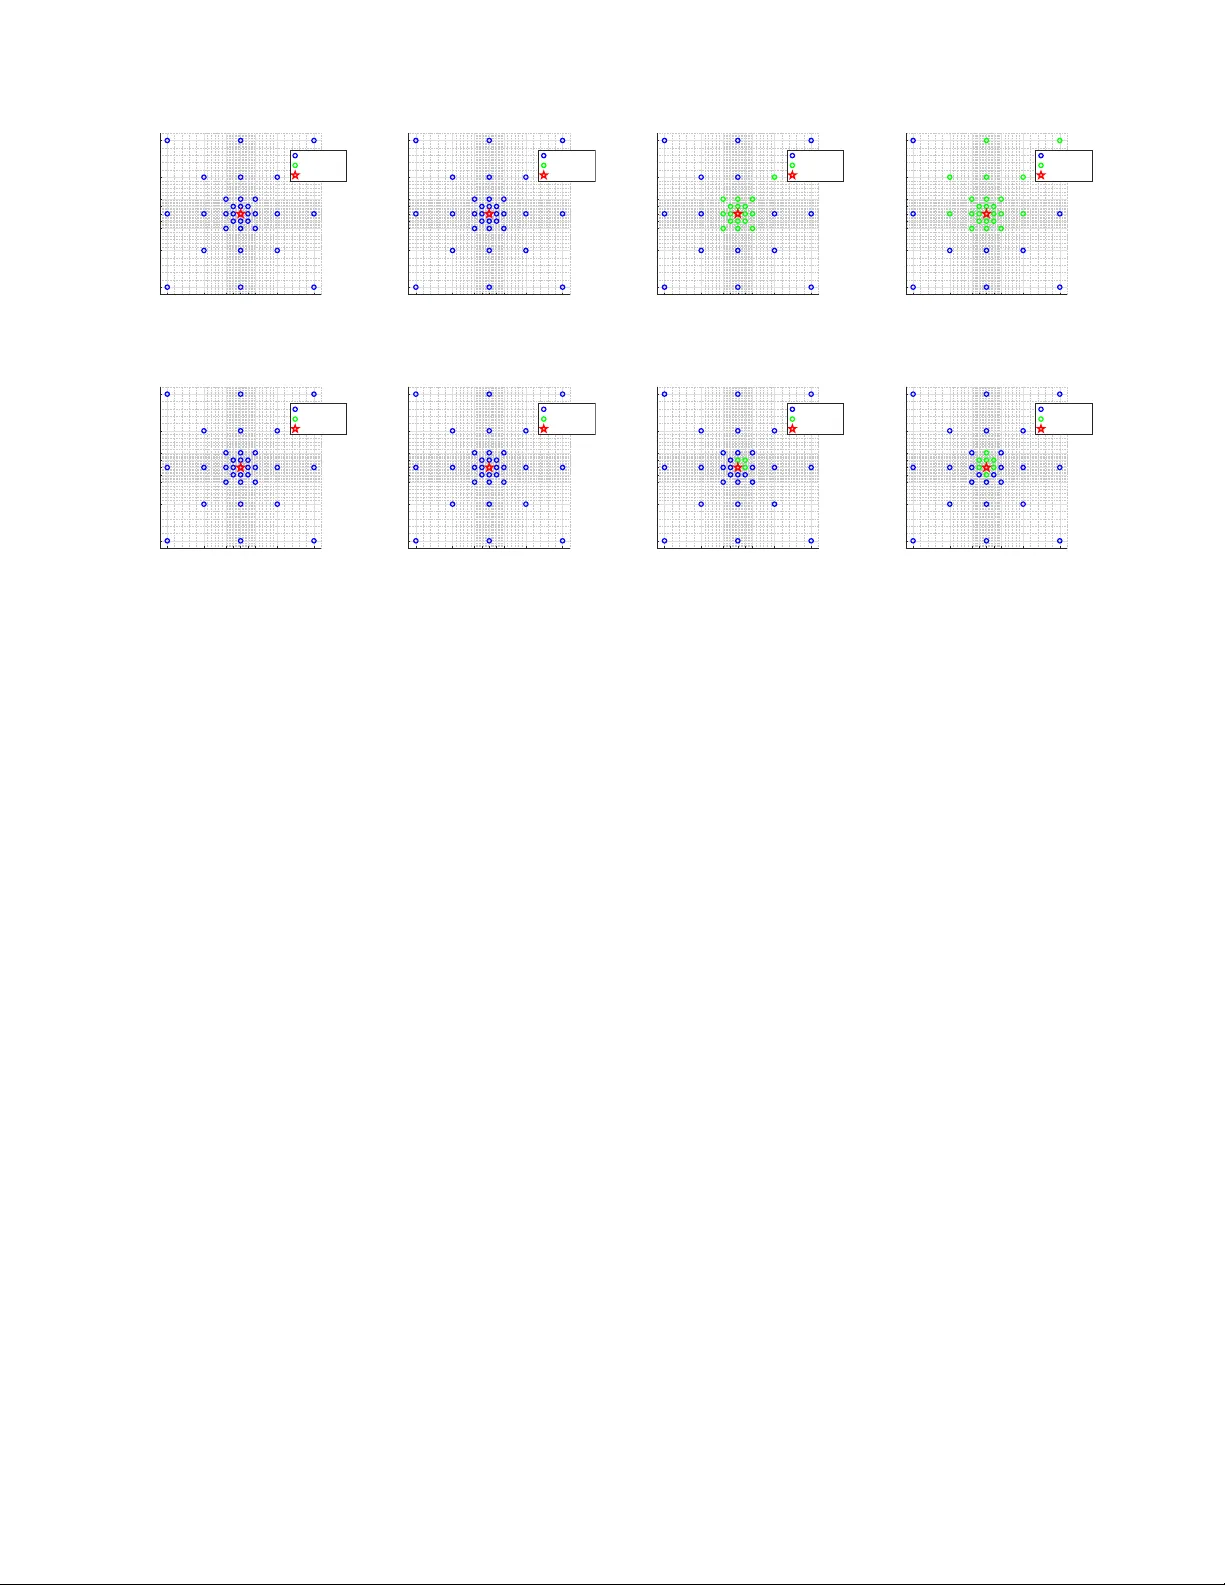
1 Odor Comm unication with Green Leaf V olatiles for Stress Signalling in the In ternet of Plan ts F atih Merdan, Ozgur B. Akan, F ello w, IEEE Abstract—This pap er dev elops an end-to-end o dor com- m unication model for stress signaling betw een plants using Green Leaf V olatiles (GL V). A damaged transmitter plant emits (Z)-3-hexenal, (Z)-3-hexenol, and (Z)-3-hexen yl acetate, whic h propagate through a time-v arying diusion–adv ection c hannel and undergo m ultiplicative loss at the receiver. The sink plan t is mo deled with a bio chemical receiver netw ork that con v erts the receiv ed GL V s in to the defensive metab olite (Z)- 3-hexen yl β -vicianoside, and an alarm decision is dened based on its concentration lev el. Numerical results sho w that (Z)-3- hexenol is the primary driver of the system and that plan t p erception generally op erates in a non-linear region. These ndings pro vide a framework for understanding the ev olution of plan t-plan t communication and for developing next-generation precision farming tec hnologies. Index T erms—Molecular comm unication, mathematical mo dels, biological pro cesses, plan t comm unication, v olatile organic comp ounds. I. Introduction P LANTS are dynamic organisms that activ ely in teract with their en vironmen t through a set of chemical signals [ 1 ]. T o survive v arious stresses, such as herbivore attac ks or extreme temp eratures, plants hav e ev olv ed the abilit y to release V olatile Organic Comp ounds (V OCs) [ 2 ]. Among these, Green Leaf V olatiles (GL V s) play a critical role in the rapid stress resp onse. When a plant is ph ysically damaged, these molecules are synthesized and released, serving as an airborne ”alarm” that neigh- b oring unstressed plan ts can sense to trigger preemptiv e defense mec hanisms [3], [4]. Characterization of these biological pro cesses through the lens of Information and Comm unication T ec hnology has emerged as a promising fron tier [ 5 ]. This interdisciplinary approac h allows for the quan tication of information o w within ecosystems and pro vides a framework for designing bio-compatible com- m unication systems [ 6 ]. F rom a communication-theoretic p ersp ective, this in terplan t interaction can b e mo deled as a specialized Odor Communication framew ork [ 7 ]. In this framework, the stressed plant acts as a transmitter. The atmosphere serves as a time-v arying ph ysical c hannel where signal propagation is go verned b y the la ws of ad- v ection and diusion. Finally , the neighboring unstressed plan t functions as a biological receiv er that must deco de F atih Merdan and O.B. Akan are with the Cen ter for neXt- generation Communications (CXC), Department of of Electrical and Electronics Engineering, Koç Univ ersity , Istan bul 34450, Türkiy e (e- mail: fmerdan25@ku.edu.tr, akan@ku.edu.tr). O. B. Akan is also with the Internet of Ev erything (IoE) Group, Department of Engineering, Universit y of Cam bridge, Cambridge CB3 0F A, U.K. (e-mail: oba21@cam.ac.uk). these airb orne c hemical cues through complex internal metab olic path w a ys to moun t an appropriate ph ysiological resp onse. Early foundational work in this area established an end-to-end mo del for long-range pheromone comm uni- cation b etw een plan ts, characterizing the dispersion of molecules under the la ws of turbulent diusion [ 8 ]. More recen tly , [9] explored the context of stress comm unica- tion, using con tin uous gene regulation to appro ximate Biological V olatile Organic Comp ound (BVOC) emissions and in vestigate modulation techniques. F urthermore, [10] ev aluates end-to-end b ehavior via atten uation and dela y , emphasizing low-pass characteristics and distance/wind sensitivit y . Despite these signicant adv ancements, exist- ing frameworks often simplify the receiv er side of the link, frequen tly treating the sink plant as a basic detector or a generic absorption p oint. F urthermore, many mo dels rely on static or simplied c hannel assumptions that do not fully capture airborne particle comm unication. In this pap er, three primary contributions are presented. First, a rigorous bio chemical receiver model is developed that is rooted in recent biological experimental data. Sp eci- cally , the in ternal metab olic transformation of Green Leaf V olatiles comprising (Z)-3-hexenal, (Z)-3-hexenol, and (Z)-3-hexen yl acetate in to the defensiv e glycoside (Z)-3- hexen yl β -vicianoside is characterized. Through mo deling of these metabolic path wa ys, (Z)-3-hexenol is identied as the main driver of the defensive state, providing a biological basis for signal reception. Second, a completely c haracterized time-v arying channel impulse resp onse for a diusion-advection c hannel is utilized for the rst time for o dor comm unication. Finally , the analysis is extended b ey ond a p oin t-to-p oin t link to insp ect the propagation of the alarm signal across a plant population for the rst time. The remainder of this paper is organized as follows. In Section I I, the o dor path w a y in plan ts is discussed. Section II I describes the mathematical framework for the p erception of odors by plants. In Section IV, the sim ulation results are giv en and discussed. Concluding remarks are giv en in Section V. I I. Odor Signalling Path wa y in Plan ts Plan ts face many dieren t stresses throughout their life cycles. These can mainly b e categorized as biotic and abiotic stresses. Biotic stresses can b e caused by insects, bacteria, viruses, fungi, nemato des, arac hnids, 2 HAL C 6 H 10 O HAC C 8 H 14 O 2 HOL C 6 H 12 O CHR CXE UGT85A53 UGT91R1 HEXVic C 17 H 30 O 10 HEXGlc C 12 H 22 O 6 Damaged Plant Time-V ar ying Diffusion- Advection Channel q HAL (t) q HOL (t) q HAC (t) Plant HAL Generation Plant HOL Generation Plant HAC Generation c air HAL (t) c air HOL (t) c air HAC (t) c a (t) c t (t) HOL to HEXGlc HEXGlc to HEXVic c o (t) c g (t) c v (t) x β a β o β t x x Fig. 1: End-to-end odor comm unication mo del used in this w ork. A damaged plan t emits three GL V s (HAL, HOL, and HA C) that propagate through a time-v arying diusion–adv ection channel. The receiv ed air concen trations are sub ject to multiplicativ e loss and drive a receiver-side biochemical net work (HAL/HA C con v ersion to HOL and downstream con v ersion to HEXVic), whose output c v ( t ) is used for the alarm decision [11]. and w eeds. Abiotic stresses o ccur under drough t, ex- treme temp eratures, and salinit y [12]. As a defense mec hanism, plan ts release V olatile Organic Comp ounds (V OC) under these stress factors [ 9 ]. Stress-induced v olatiles are categorized b y metabolic origin into four classes: fatt y acid degradation pro ducts, suc h as herbivore- induced (Z)-3-hexenol; phenylpropanoids, including cold or drought-induced methyl salicylate (MeSA); biotic and abiotic stress-triggered monoterp enes such as linalo ol; and sesquiterpenes, such as nerolidol [13]. Green Leaf V olatiles (GL V s) are fatty acid deriv ed V olatile Organic Comp ounds consisting of six-carb on aldeh ydes, alcohols, and esters [14]. When the leav es of a plan t are physically damaged, GL V s are created on site. Plants can generate substan tial amounts of GL V s in seconds to minutes after tissue damage, in some cases reaching nearly 100 µg per gram of fresh weigh t [15]. They play an imp ortant role in the direct defense of plan ts at w ound sites and in indirect plant defense where plan ts can use GL V s to attract herbiv ore predators and establish stress comm unication b et w een neigh bouring plants [16], [17]. In this study , GL V transduction is mo delled b etw een stressed and unstressed plan ts. The stressed plan t is con- sidered the source of GL V s, and the neigh b ouring plants are the sinks. Sp ecically , herbivores feed on the source plan t, and with eac h bite, a new plume of GL V s is released in to the air. Green leaf v olatile biosyn thesis initiates with the formation of (Z)-3-hexenal, whic h is partially reduced to (Z)-3-hexenol and subsequen tly acet ylated b y a BAHD acyltransferase to yield (Z)-3-hexenyl acetate [18], [14]. (Z)-3-hexenal is an aldeh yde, (Z)-3-hexenol is an alcohol, and (Z)-3-hexenyl acetate is an ester, and it is possible to transform these in to one another. After the GL V s are released into the atmosphere, they mo v e through a diusion-advection channel b efore reac hing a GL V sink plant. P article transp ort in owing media arises from both diusion and advection; how ev er, adv ection dominates at the macroscale. In nature, the op en air is not controlled, and the v ariations in wind v elocity ov er time are mo delled using sto chastic signals [19]. When the released GL V s reach a GL V sink plan t, they are taken b y the leav es of the plan t. The general route of gas exchange in plan ts is through the stomata, which transp ort H 2 O , C O 2 , and O 2 . There is also evidence that GL V s are absorb ed through the stomata. Adsorption on the cuticle or outer surface of the leaf is another pathw a y for the in tak e of GL V b y plan ts [18]. Con tinuous uptak e through the stomata follow ed by metab olic con v ersion is the most eectiv e VOC intak e path wa y , as adsorption is considerably slo w er than stomatal absorption [20]. This also means that the ability of plants to p erceive o dor molecules is highly restricted when the stomata of plants are closed, suc h as in the dark or under drought stress [21]. When the stomata are op en, the GL V s rst cross the turbulen t and leaf b oundary la y ers, en ter the stomata, and diuse in to intercellular air spaces. They then undergo air–liquid partitioning, a pro cess go verned by Henry’s la w constant. In the end, they reac h a metab olic site in the leaf. Here, b oth (Z)-3-hexenal and (Z)-3-hexen yl acetate are transformed in to (Z)-3-hexenol. A t the same time, (Z)-3-hexenol is pro cessed in to (Z)-3-Hexen yl- β -D- glucop yranoside (HEXGlc). Finally , HexGlc is con verted to (Z)-3-hexen yl β -vicianoside (HEXVic). It has b een exp erimen tally sho wn that HEXVic accum ulating lea v es are more resilient against herbiv ore attacks [22]. This 3 conrms that odor transmission is used for stress comm u- nication in plants in nature. This paper fo cuses on HEXVic accum ulation in GL V sink plants after GL V transmis- sion from damaged GL V source plan ts. Ho w ever, the eects of GL V s are not limited to HEXVic accumulation. F or example, (Z)-3-hexenal exp osure results in a C a 2+ cyt increase in guard cells and subsequently in mesophyll cells that trigger the expression of biotic and abiotic stress-resp onsiv e genes in a C a 2+ dep enden t manner [23]. Moreo v er, it is revealed that exp osure to (Z)-3-hexen yl acetate induces ROS Pro duction in Wheat [24]. Both C a 2+ and R OS are important secondary signals in plan ts that can activ ate many defense-related enzymes, and future researc h is needed to uncov er their mechanics. I I I. Odor Perception Dynamics in Plan ts In a communication paradigm, there are three main elemen ts: the transmitter, the receiv er, and the channel. In this section, o dor signalling b etw een plan ts is c haracter- ized b y mathematically dening these elemen ts together with the relev an t signals. The proposed model for the odor p erception by plants is giv en in Fig. 1. Due to the absence of a comprehensiv e dataset for a single sp ecies, biological parameters w ere aggregated from m ultiple plan t sources to parameterize the system. Never- theless, since all of these species exhibit o dor p erception, the resulting framework can b e regarded as a general plant mo del for odor sensing. In addition, all odor molecules are assumed to b e processed within a single eectiv e cytosolic v olume, and the corresp onding enzyme concentrations are computed on the same basis. A. Odor T ransmitter The transmitter plant releases (Z)-3-hexenal (HAL), (Z)-3-hexenol (HOL), and (Z)-3-hexen yl acetate (HAC) due to herbiv ore damage. Each bite of the leaf is repre- sen ted as a bit. Bit 0 corresp onds to no bite, where there is no GL V emission, and bit 1 corresp onds to a bite. The release of GL V s into the air is mo delled as a rectangular pulse of length 2 seconds. The emission amplitudes of eac h o dor molecule are determined from [25] using the data from the cut leav es of the corn plant and given in T able I I. The transmitted signal is describ ed as q ( t ) = N ∑ k =1 A m p ( t − k T sym ) , (1) where A m is the emission amplitude of the odor molecule, T sym is the sym bol p erio d, and p ( t ) is a rectangular pulse of length T sym . Although prop er bit and sym b ol denitions are made, plants are not able to reconstruct these bits. Ev en tually , the released GL V s will b e understo o d as an alarm signal only . B. Diusion-Adv ection Channel The mov ement of odor particles in the air is describ ed with a partial dierential equation as ∂ c ∂ t ( x , t ) = D ∇ 2 c ( x , t ) − v ( t ) · ∇ c ( x , t ) + S ( x , t ) , (2) where c ( x , t ) denotes the concen tration of the parti- cle at p osition x and time t , D is the constan t air diusion co ecient, v ( t ) is the wind v elocity vector, ∇ c ( x , t ) and ∇ 2 c ( x , t ) represent the spatial gradient and Laplacian of the concentration, respectively , and S ( x , t ) denotes the transmitter plant. The time-v arying diusion- adv ection channel impulse resp onse described in [26] is used to accurately mo del the mo v ements of GL V s under a time-v arying diusion-advection channel. T o do this, the transmitter plan t is mo delled as a point source as S ( x , t ) = q ( t ) δ ( x − x 0 ) where x 0 is the transmitter plan t p osition and the initial zero condition is assumed for eac h o dor molecule. The air diusion co ecients for each molecule are calculated using the F uller metho d explained in [27]. The output of the c hannel is the concentration of the o dor molecules around a receiver plant p osition. C. Odor Receiver Receiv ers are also mo deled as p oints in a 3-D space, and it is assumed that the stomata of the receiv er plants remain op en throughout the communication pro cess. The air concen trations of HAL, HOL, and HA C are the input of the receiv er. The receiv er plant rst absorbs the odor molecules from the air. Then, these are metabolized in to HEXVic through enzymatic reactions. The receiv er decides that there is an attac k nearb y if the concentration of HEXVic in the lea v es c v ( t ) passes through a threshold c v 0 . Therefore, the amount of HEXVic accumulated in the leaf is used as the main output of the system. 1) Random Multiplicativ e Loss: Within the receiv er leaf, not all absorb ed o dor molecules are utilized b y the targeted bio c hemical pathw ay . A portion of these molecules may b e sequestered in other plant tissues or consumed by competing metabolic reactions. F urthermore, the successful in teraction betw een a molecule and its corresp onding enzyme at the reaction site is inherently sto c hastic, dep ending on the probabilit y of molecular col- lision [28]. In addition, it is found that certain herbiv ores release saliv ary enzymes that suppress GL V emissions from the source plant [29]. These physical and biochemical uncertain ties are collectiv ely modeled at the receiv er input through a random multiplicativ e loss factor. T o mo del the loss factors for HAL, HAC, and HOL, Beta-distributed random v ariables that are indep endent across time samples are emplo y ed. The specic prole of eac h loss factor is c haracterized by its mean and co ecien t of v ariation (CV) [30], tailored to each molecule type. This framework serves as a biological analog to Signal- to-Noise Ratio (SNR) con trol in classical communication systems: the mean of the distribution scales the eectiv e input amplitude, while the CV dictates the magnitude of sto c hastic uctuations that degrade detection reliability . 4 2) Odor Absorption: Using the denitions in [20], V OC absorption b y plan t lea ves is mathematically modelled as ( r ias F + 1 ( 1 r G + E 2 ) + 10 3 r liq H P a ) A = ( 1 r G − E 2 ) ( 1 r G + E 2 ) C a − 10 3 H P a C ct , (3) where r ias = ∆ L ias τ D A f ias is the intercellular airspace resistance, ∆ L ias is the eective diusion path length in intercellular air spaces, τ is the diusion path tortuosity , D A is the diusion co ecient of VOC in gas phase and f ias is the fraction of the intercellular air space volume in the total leaf volume. F = 273 . 15 T k × 22 . 4 e − 3 is a scaling constant where T k is the temp erature in k el v in . r G = r s + r b is the total resistance from outside air to intercellular air spaces. r b = r w b ( D w D A ) 2 3 is the resistance of the leaf boundary la y er, where r w b is the resistance of the leaf b oundary la yer for water v ap or and D w is the diusion co ecient of w ater in the gas phase. Similarly , r s = r w s ( D w D A ) is the stomatal resistance and r w s is the stomatal resistance for w ater v ap or. E is the VOC sp ecic transpiration rate, H is the VOC specic Henry’s constant tak en from [25] and P a is the pressure in bar . r liq is the sum of the resistances of the cell wall, plasma membrane, and cytosol. It is calculated follo wing the description given in [20] for eac h odor molecule. T o do this, the parameters of the plan t Spathiph yllum clevelandii are used. Moreov er, the Octanol/W ater partition co ecients ( K o/w ) for the odor molecules are obtained from the Chemeo database [31]– [33]. In ( 3 ), A is the o dor molecule absorption rate in mol m − 2 s − 1 , C a is the odor concentration in the atmo- sphere in ppb and C ct is the o dor concentration in cytosol in mol m − 3 . In this equation, C a and C ct are known, and A is the output at a time instan t. The output of the channel is in mol / m 3 . T o conv ert the unit of C a from mol / m 3 to ppb , the methods explained in [34] and [35] are utilized. Since in the receiv er, mol ar absorption rates are used, A is con v erted in to mol L − 1 s − 1 as A ( mol L − 1 s − 1 ) = A ( mol m − 2 s − 1 ) × LA F W V intra , (4) where LA F W is the leaf area p er fresh w eight ( m 2 g − 1 F W ) obtained from [36] and V intra is the water v olume of leaf tissue per unit fresh w eight ( L g − 1 F W ). Using the fact that Arabidopsis leav es normally has 0.90 g g − 1 F W [37], and taking the densit y of water 1 g /ml , V intra is calculated. 3) HAL to HOL Conv ersion: Absorb ed HAL inside the lea v es ( c a ( t ) ) is processed in to HOL. In [16], the enzyme enco ded b y A t4g37980 in Arabidopsis is sho wn to con vert HAL in to HOL, and is named as CHR. T o represent this c hemical reaction, Michaelis-Men ten Equations are used [38]. The rate of change from HAL to HOL is represented as J AO ( t ) = k ao cat E C H R c a ( t ) k ao m + c a ( t ) , (5) where k ao cat is the catalytic constant, E C H R is the total CHR concentration in the leaf, k ao m is the Mic haelis constan t for this reaction and c a ( t ) is the total cytosolic HAL concen tration in the leaf. 4) HAC to HOL Conv ersion: As rep orted in [39], the Arabidopsis enzyme AtCXE12 is shown to metab o- lize HAC into HOL. T o mo del this reaction, a similar Mic haelis-Men ten dynamics is used as J T O ( t ) = k to cat E C X E c t ( t ) k to m + c t ( t ) , (6) where E C X E is the total A tCXE12 concentration in the leaf, and c t ( t ) is the total cytosolic HAC concen tration in the leaf. 5) HOL to HEX Glc Con version: According to [40], the UGT85A53 protein in Camellia sinensis is responsible for HEX Glc accum ulation from airb orne HOL. A Michaelis- Men ten dynamics is used as J OG ( t ) = k og cat E 85 A c o ( t ) k og m + c o ( t ) , (7) where E 85 A is the total UGT85A53 concentration in the leaf, and c o ( t ) is the total cytosolic HOL concen tration in the leaf. 6) HEXGlc to HEXVic Con v ersion: Evidence in [41] sho ws that the enzyme UGT91R1 mediates HEXVic ac- cum ulation in S. lycopersicum b y preferen tially catalyzing the arabinosylation for HEX Glc. Similarly , this dynamic is mo delled as J GV ( t ) = k gv cat E 91 R c g ( t ) k gv m + c g ( t ) , (8) where E 91 R is the total UGT91R1 concentration in the leaf, and c g ( t ) is the total cytosolic HEX Glc concen tration in the leaf. c v ( t ) is used to represen t the total cytosolic HEXVic concen tration. Using the metho d explained in [42], the total enzyme concen trations from ppm v alues can b e found as E tot = k e A b 10 15 N A , (9) where k e ≈ 3 e 6 is an estimate of cellular densit y of protein molecules p er f emtoliter , A b is the abundance, and N A is the A v ogadro constant. The abundance v alues of the enzymes are obtained from the P axDb database [43]. F or A tCXE12 and CHR, the Arabidopsis leaf tissue is used. F or UGT85A53, the Arabidopsis gene UGT85A1, and for UGT91R1, the Arabidopsis gene UGT91A1 is used, with the abundance in the whole organism. Using the absorption rates from ( 4 ) and the internal enzymatic rates from ( 5 ), ( 6 ), (7), and ( 8 ) the follo wing 5 T ABLE I: Biological-Chemical Parameters Description Symbol V alue Unit Description Symbol V alue Unit T emp erature T k 298.15 kel v in Diusion path tortuosit y τ 1.57 mm − 1 Pressure P 1 atm F raction of the in tercellular air space volume in the total leaf volume f ias 0.328 m 3 m − 3 Molecular weigh t of HAL M a 98.143 g /mol Henry’s constant (HAL) H a 6.0 mol L − 1 atm − 1 Molecular weigh t of HOL M o 100.159 g /mol Henry’s constan t (HOL) H o 113 mol L − 1 atm − 1 Molecular weigh t of HA C M t 142.2 g /mol Henry’s constant (HAC) H t 3.1 mol L − 1 atm − 1 Molecular weigh t of v ap or M w 18 g /mol Octanol/W ater partition coecient (HAL) K a o/w 10 1 . 542 - Diusion co ecient of HAL D a 8 . 0718 × 10 − 6 m 2 /s Octanol/W ater partition coecient (HOL) K o o/w 10 1 . 335 - Diusion co ecient of HOL D o 7 . 9291 × 10 − 6 m 2 /s Octanol/W ater partition coecient (HAC) K t o/w 10 1 . 906 - Diusion co ecient of HA C D t 6 . 7698 × 10 − 6 m 2 /s Abundance of CHR A C H R b 330 ppm Diusion co ecient of v ap or D w 2 . 3289 × 10 − 5 m 2 /s Abundance of A tCXE12 A C X E b 122 ppm Leaf area per fresh weigh t LA F W 0.0055 m 2 g − 1 F W Abundance of UGT85A53 A 85 A b 13.2 ppm water volume of leaf tissue per unit fresh w eigh t V intra 0.0009 L g − 1 F W Abundance of UGT91R1 A 91 R b 0.09 ppm Leaf b oundary la y er resistance for water v apor (HAL) r w b a 2.58 m 2 s/mol A v ogadro constant N A 6.02 × 10 23 mol − 1 Stomatal resistance for water v ap or (HAL) r w s a 21.8 m 2 s/mol Catalytic constant (CHR) k ao cat 13.27 s − 1 Leaf b oundary la y er resistance for water v apor (HOL) r w b o 3.23 m 2 s/mol Catalytic constant (CXE) k to cat 3.78 s − 1 Stomatal resistance for water v ap or (HOL) r w s o 26.5 m 2 s/mol Catalytic constant (85A) k og cat 0.35 s − 1 Leaf b oundary la y er resistance for water v apor (HA C) r w b t 2.47 m 2 s/mol Catalytic constant (91R) k gv cat 0.33 s − 1 Stomatal resistance for water v ap or (HA C) r w s t 16.1 m 2 s/mol Michaelis constant (CHR) k ao m 32.7 µM HAL transpiration rate E a 6 × 10 − 4 mol m − 2 s − 1 Michaelis constant (CXE) k to m 5940 µM HOL transpiration rate E o 5 . 4 × 10 − 4 mol m − 2 s − 1 Michaelis constant (85A) k og m 18.92 µM HAC transpiration rate E t 4 . 5 × 10 − 4 mol m − 2 s − 1 Michaelis constant (91R) k gv m 5.9 µM Eective diusion path length in intercellular air spaces ∆ L ias 6 . 38 × 10 − 5 m system of dierential equations is constructed dc a ( t ) dt = A a ( t ) − J AO ( t ) , dc t ( t ) dt = A t ( t ) − J T O ( t ) , dc o ( t ) dt = A o ( t ) + J AO ( t ) + J T O ( t ) − J OG ( t ) , dc g ( t ) dt = J OG ( t ) − J GV ( t ) , dc v ( t ) dt = J GV ( t ) . (10) where A a ( t ) , A o ( t ) , and A t ( t ) are the absorption rates of HAL, HOL, and HAC, resp ectively . All biological-c hemical parameters are giv en in T able I. IV. Simulation Results In this Section, n umerical analysis of the given top ol- ogy is carried out. First, the receiver characteristics are insp ected in detail. Then, the end-to-end comm unica- tion system is inspected b etw een one transmitter and one receiver plan t. Lastly , the distribution of the alarm signal is analyzed across a comprehensive set of receiver co ordinates to characterize ho w the warning message is p erceiv ed by the surrounding plant p opulation under dieren t wind conditions. F or m ulti-receiver scenarios, the channel is simulated in Python using an NVIDIA GeF orce GTX 1080 Ti GPU, and the channel output is sa v ed. Subsequent analysis is conducted using MA TLAB R2023b. The parameters used in the sim ulations are given in T able I I. A. Receiver Characteristics The o dor receiv er presented in this w ork is designed to study the initial stim ulation phase of the receiver plan t. Because the mo del do es not yet include a ’reset’ or recov ery mechanism, it contin uously accumulates in- coming signals. This receiver can be taken as a linear time inv ariant (L TI) system if for each enzymatic reaction k m ≫ c ( t ) is satised. It can b e observed that, as long as the receiv er k eeps getting an input, it will lea v e the linear op erating region b ecause the in ternal concentrations will increase as time progresses. T o understand the linearity limits of this system with resp ect to its 3 inputs, a practical metho d is in troduced. Sp ecically , if for that simulation duration, the time fraction for which r > 0 . 1 is less than 6 -12 -11 -10 -9 -8 -7 -6 log 10 (c a air (t)) 0 0.2 0.4 0.6 0.8 1 Frac Time (r>0.1) 0.02 T = 300 s T = 900 s T = 1800 s T = 3600 s (a) -12 -11 -10 -9 -8 -7 -6 log 10 (c t air (t)) 0 0.005 0.01 0.015 0.02 Frac Time (r>0.1) T = 300 s T = 900 s T = 1800 s T = 3600 s (b) -12 -11 -10 -9 -8 -7 -6 log 10 (c o air (t)) 0 0.2 0.4 0.6 0.8 1 Frac Time (r>0.1) 0.02 T = 300 s T = 900 s T = 1800 s T = 3600 s (c) 0 1 2 3 4 5 6 log 10 (SF) 0 0.2 0.4 0.6 0.8 1 Frac Time (r>0.1) 0.02 T = 300 s T = 900 s T = 1800 s T = 3600 s (d) -12 -11 -10 -9 -8 -7 -6 log 10 (c a air (t)) 0 0.01 0.02 0.03 0.04 Frac Time (r>0.1) 0.02 T = 300 s T = 900 s T = 1800 s T = 3600 s (e) -12 -11 -10 -9 -8 -7 -6 log 10 (c t air (t)) 0 0.005 0.01 0.015 0.02 Frac Time (r>0.1) T = 300 s T = 900 s T = 1800 s T = 3600 s (f ) -12 -11 -10 -9 -8 -7 -6 log 10 (c o air (t)) 0 0.01 0.02 0.03 0.04 0.05 Frac Time (r>0.1) 0.02 T = 300 s T = 900 s T = 1800 s T = 3600 s (g) 0 1 2 3 4 5 6 log 10 (SF) 0 0.01 0.02 0.03 0.04 0.05 Frac Time (r>0.1) 0.02 T = 300 s T = 900 s T = 1800 s T = 3600 s (h) -12 -11 -10 -9 -8 -7 -6 log 10 (c a air (t)) 0 0.2 0.4 0.6 0.8 1 Frac Time (r>0.1) 0.02 T = 300 s T = 900 s T = 1800 s T = 3600 s (i) -12 -11 -10 -9 -8 -7 -6 log 10 (c t air (t)) 0 0.005 0.01 0.015 0.02 Frac Time (r>0.1) T = 300 s T = 900 s T = 1800 s T = 3600 s (j) -12 -11 -10 -9 -8 -7 -6 log 10 (c o air (t)) 0 0.2 0.4 0.6 0.8 1 Frac Time (r>0.1) 0.02 T = 300 s T = 900 s T = 1800 s T = 3600 s (k) 0 1 2 3 4 5 6 log 10 (SF) 0 0.2 0.4 0.6 0.8 1 Frac Time (r>0.1) 0.02 T = 300 s T = 900 s T = 1800 s T = 3600 s (l) Fig. 2: Receiv er nonlinearit y results across v arious simulation times, input signal congurations, and scaling scenarios. F or (i) constan t inputs (a) scales HAL only , (b) scales HA C only , (c) scales HOL only , and (d) scales all three input amplitudes together, and the horizontal axis shows the common scaling factor (SF). F or (ii) single initial pulses, (e) scales HAL only , (f ) scales HA C only , (g) scales HOL only , and (h) scales all three input amplitudes together. F or (iii) p erio dic on-o cycling, (i) scales HAL only , (j) scales HAC only , (k) scales HOL only , and (l) scales all three input amplitudes together. The horizon tal dashed lines indicate the 0 . 02 threshold used to dene the L TI operating region. or equal to 0 . 02 , the system is treated as op erating in the linear regime, where r = max ( c a ( t ) k ao m , c t ( t ) k to m , c o ( t ) k og m , c g ( t ) k gv m ) . (11) The linearit y condition is ev aluated across v arious sim ulation durations and input signal proles. In each conguration, the amplitude of one input signal is in- creased while the other tw o are held constant to examine the linearit y; subsequen tly , all three input amplitudes are simultaneously increased to observ e the collective b eha vior. F or all cases, the initial air concen trations of eac h o dor molecule are set to 1 × 10 − 12 mol/m 3 . Three input signal congurations are ev aluated: (i) a constan t input, (ii) a single initial pulse ( T on = 10 s ), and (iii) p erio dic on-o cycling ( T on = T of f = 10 s ). The results are presented in Fig. 2. As exp ected, for b oth constant and p erio dic on-o cycling input proles, the minim um input amplitude required to exceed the linearit y threshold decreases as simulation duration increases. In the case of a single initial pulse, the specic amplitude at whic h linearit y breaks can be iden tied for each odor molecule. Notably , the system exhibits a return to the linear regime as time progresses in this conguration. This recov ery o ccurs b ecause the concentrations of molecules respon- sible for breaking linearity decrease ov er time as they are con v erted in to do wnstream metab olites lik e HEX Glc. A cross all congurations, the results for HOL scaling and sim ultaneous scaling are nearly identical, implying that HOL is the primary limiter of the linear op erating region. In contrast, HAC remains within the linear regime across all tested scenarios and durations. T o study the frequency characteristics of the o dor receiv er, the magnitude and phase resp onse of the system are ev aluated. Since the input signals corresp ond to concen tration levels, they cannot b e negativ e. Therefore, the oscillating inputs are giv en to the system in the form sho wn as c air x ( t ) = A (1 + cos (2 πf t )) , (12) where A = 5 × 10 − 11 mol/m 3 corresp onds to a linear op eration region according to Fig. 2. In eac h simulation, only one input is made oscillatory , and the other tw o are tak en as zero. T o be able to work with oscillating outputs once there are oscillating inputs, the output of the system is considered as the internal plant HOL concentration 7 10 -4 10 -3 10 -2 10 -1 10 0 10 1 Frequency (Hz) 50 55 60 65 70 75 80 85 90 95 |H(f)| (dB) (a) 10 -4 10 -3 10 -2 10 -1 10 0 10 1 Frequency (Hz) 105 110 115 120 125 130 |H(f)| (dB) (b) 10 -4 10 -3 10 -2 10 -1 10 0 10 1 Frequency (Hz) -20 -15 -10 -5 0 5 10 15 20 25 |H(f)| (dB) (c) 10 -4 10 -3 10 -2 10 -1 10 0 10 1 Frequency (Hz) -3 -2.5 -2 -1.5 -1 -0.5 0 Phase H(f) (rad) (d) 10 -4 10 -3 10 -2 10 -1 10 0 10 1 Frequency (Hz) -1.5 -1 -0.5 0 Phase H(f) (rad) (e) 10 -4 10 -3 10 -2 10 -1 10 0 10 1 Frequency (Hz) -3 -2.5 -2 -1.5 -1 -0.5 0 Phase H(f) (rad) (f ) Fig. 3: F requency-domain resp onse of the HOL output to dieren t odor inputs. The top row sho ws the magnitude resp onses for HAL, HOL, and HA C inputs in (a), (b), and (c), respectively . The bottom row presen ts the corresp onding phase resp onses in (d), (e), and (f ). ( c o ( t ) ) in this analysis. In general, the output is of the form c o ( t ) = B (1 + cos (2 π f t + ϕ )) , where B has units µmol/L . Then, the frequency resp onse of the system is calculated as H ( t ) = B e j ϕ A [ µmol/L ] . (13) Using these denitions, the magnitude and phase re- sp onse of the system are calculated and giv en in Fig. 3. The results sho w that the magnitude response remains constan t at low frequencies and b egins to roll o as the frequency increases for each o dor molecule. This indicates that the plant’s bio chemical net w ork cannot trac k rapid uctuations in odor concentration. Moreo ver, the eectiv e bandwidth of the biological receiv er app ears consisten t across all three odor molecules. This suggests that the rate-limiting step in the bio chemical net work is lik ely common to all three path wa ys, p otentially the nal con v ersion stages leading to the HOL concen tration. In addition, there is a signican t dierence in the magnitude resp onse among the three inputs. HOL exhibits the highest gain, while HAC has the lo w est gain. These ndings conrm the observ ation that HOL is the dominan t driv er for this system. T o understand the sensitivit y of the linear op eration region to the enzyme abundances, the abundances of UGT85A53 and UGT91R1 are v aried, and the linearit y is examined. F or this analysis, perio dic on-o cycling input is applied for 1 hour , and the results are given in Fig. 4. It can be observ ed that the system’s linearit y is signican tly more sensitiv e to the abundance of UGT85A53. This result further demonstrates that HOL is the critical o dor molecule for the receiver, as its conv ersion pro cess represen ts the primary constrain t on the system’s ability to main tain a linear resp onse. -3 -2 -1 0 1 2 3 log 10 (SF 91 ) -3 -2 -1 0 1 2 3 log 10 (SF 85 ) 0 0.2 0.4 0.6 0.8 Frac Time (r > 0.1) Fig. 4: Sensitivity analysis of the linear op erating region with resp ect to enzyme abundances. The horizon tal and v ertical axes show the scaling factors for eac h enzyme abundance. B. End-to-End Communication System Here, the end-to-end comm unication system is sim u- lated using a single transmitter-receiver plant pair. In 8 0 50 100 150 200 250 Time (min) 0 1 2 3 4 5 C a at Rx (mol/m 3 ) 10 -5 HAL HAC HOL (a) 0 50 100 150 200 250 Time (min) 0 200 400 600 800 1000 1200 1400 1600 c a ( M) (HAL) (b) 0 50 100 150 200 250 Time (min) 0 100 200 300 400 500 c t ( M) (HAC) (c) 0 50 100 150 200 250 Time (min) 0 1000 2000 3000 4000 5000 6000 7000 c o ( M) (HOL) (d) 0 50 100 150 200 250 Time (min) 0 20 40 60 80 100 c g ( M) (HEXGlc) (e) 0 50 100 150 200 250 Time (min) 0 0.5 1 1.5 c v ( M) (HEXVic) (f ) Fig. 5: 1 -transmitter 1 -receiver sim ulation results. The channel output air concentrations are sho wn in (a). The internal leaf concentrations are sho wn for (b) HAL, (c) HA C, (d) HOL, (e) HEX Glc, and (f ) HEXVic. The red dashed lines indicate the linearit y limit for that molecule, and the black dashed line indicates the alarm decision threshold. these simulations, equiprobable insect bites (bits) are used. The propagation c hannel is sim ulated indep endently for the three considered GL V s using a shared wind realization, under the assumption that the molecules do not interact or aect one another’s mov ement. F or eac h receiv er position and for eac h o dor molecule, ( 2 ) is solved. In addition, zero-mean white Gaussian wind is assumed for the x and y dimensions, while there is no wind in the z dimension. In [22], a comprehensive metab olite analysis of leaf extracts is conducted, and the amoun t of HEXVic w as found to b e 0 . 10 ± 0 . 02 µg .g − 1 F W in con trol plan ts, and 2 . 39 ± 0 . 78 µg .g − 1 F W in plan ts exp osed to v olatiles from neighboring herbivore-infested plan ts. In accordance with this, the alarm threshold in this article is tak en as 0 . 5 µg .g − 1 F W . Using the molecular weigh t of HEXVic ( M W v = 394 . 4 g /mol ), the threshold is written in units µM as c v 0 [ µM ] = c v 0 [ µg .g − 1 F W ] × 10 − 3 M W v × V intra . (14) P arameters describ ed in T able I I for a non-directed strong wind scenario are used, and important signals are plotted. These results are given in Fig. 5. It is observ ed that the receiver works in the non-linear region of op eration in a general natural setting. As can be seen in Fig. 5(a), there is no bit-wise structure due to the channel eects. How ever, the receiv er plan t is able to obtain the information that ”there is an attack nearb y” . F rom the previous receiver analysis, it was found that the input HOL air concentration is the strongest signal that contributes to the output internal HEXVic concen tration. How ever, understanding the individual ef- fects of HAL, HOL, and HAC from the persp ective of comm unication engineering requires the main operations in the transmitter plant as well. In this article, the Carb on concentration budged idea is introduced. Using the emission amplitudes giv en in T able II, the maxim um Carb on molecule emission amplitude is determined as 3 . 728 × 10 − 10 mol/s . Then, this amount is used to send only one t yp e of GL V p er simulation with emission amplitudes A a = A o = 6 . 21 × 10 − 11 mol/s and A t = 4 . 66 × 10 − 11 mol/s . F or this analysis, the parameters in T able I I for the directed wind scenario are used, and the resulting plot is given in Fig. 6. This result also suggests that HOL is the most ecient molecule to transmit. Then, a natural question arises: Why do plan ts send dierent GL V s, and not only HOL with higher amoun ts? T o prop erly answer this question, one needs to dev elop a w a y to characterize the energy required to pro duce and store these molecules in a transmitter plan t. F urthermore, one has to tak e in to accoun t the fact that storage of one molecule in large amoun ts can be toxic to the plan t [16], [15]. Therefore, toxicit y limits for these molecules must b e established. These questions motiv ate a m ultidisciplinary researc h direction that requires close collab oration b etw een engineers and biologists. 9 T ABLE I I: Simulation P arameters Description V alue Timing and decision Channel sampling rate, f s 10 Hz Symbol duration, T sym 2 s HEXVic alarm threshold, c v 0 1 . 4 µ M Receiver-side multiplicativ e loss Beta-loss mean, (HAL/HAC/HOL) 0 . 85 Beta-loss co ecient of v ariation (CV) 0 . 15 Emission amplitudes HAL emission amplitude, A a 2 . 76 × 10 − 11 mol/s HOL emission amplitude, A o 1 . 52 × 10 − 11 mol/s HAC emission amplitude, A t 1 . 45 × 10 − 11 mol/s Geometry T x position [0 , 0 , 1] m Rx p osition (1T x–1Rx) [0 . 15 , 0 , 1] m Rx p osition (GL V comparison) [0 . 20 , 0 , 1] m Wind regimes Non-directed strong wind µ x = µ y = 0 m/s, σ x = σ y = 0 . 5 m/s Non-directed weak wind µ x = µ y = 0 m/s, σ x = σ y = 0 . 01 m/s Directed wind µ x = 0 . 2 , µ y = 0 m/s, σ x = σ y = 0 . 01 m/s 0 100 200 300 400 Time (min) 0 0.5 1 1.5 2 2.5 3 c v (t) ( M) HAL only HAC only HOL only Fig. 6: Comparison of internal HEXVic accumulation for single GL V emission scenarios. One possible explanation for the usage of m ultiple odor molecules can b e given from a communication theoretical p ersp ective. Here, the plant is transmitting the same message ov er indep endent channels. This can b e thought of as a form of diversit y combining tec hnique. W e name this tec hnique c hemical diversit y com bining. Chemical div ersit y com bining do es not impro v e the accuracy of comm unication by someho w ov ercoming the eects of the diusion-adv ection c hannel. As can b e seen in Fig. 5(a), all o dor molecules trav el in the air in a similar manner. That is, the wind determines the mo vemen ts. Therefore, o dor molecules ha ving dierent masses or diusion co e- cien ts do not matter in this top ology . Chemical diversit y com bining can increase the accuracy of comm unication b y introducing dieren t, preferably indep endent, chemical c hannels for the same outcome. F or example, insects that feed on a leaf can release saliv ary enzymes that suppress HOL emission from that leaf, but HAL and HAC can still b e emitted. Or, the receiver plan t migh t be in suc h a state that it must use HAL for dierent c hemical reactions. In these kinds of scenarios, utilizing chemical diversit y b y com bining tec hniques by sending the same message o v er dieren t chemical channels can prov e helpful for the comm unication link. Since the receiver is an accum ulator, the meaningful metric to consider in this top ology to quan tify the com- m unication is the time at whic h the receiver plant becomes ”alarmed” . This time is referred to as Alarm Time. The o dor comm unication link b et w een a single transmitter- receiv er pair is further analyzed by insp ecting the alarm time in dierent wind scenarios at dieren t distances. Here, distance refers to the x -axis position of the receiver plan t. In addition, the initial time where the receiver b ecomes non-linear, referred to as Linearity Time, is also insp ected. The simulation results for these analyses are presen ted in Fig. 7. The results show that the alarm time increases with increasing distance for all wind regimes. Wind v ariability signican tly aects this trend: while the directed-wind case yields a smooth and predictable increase, the non-directed regimes exhibit stronger dis- tance sensitivity and non-smooth transitions. F or the non- directed w eak wind scenario, after 1 m , the receiver plan ts do not get any message. Comparing linearit y and alarm times reveals that the alarm decision typically o ccurs while the receiv er op erates in the non-linear region. C. Spread of the Alarm Message Here, ho w the w arning message is receiv ed by the surrounding population is simulated. Man y receiver plan ts are placed around one transmitter plan t. The sim ulations are carried out for the non-directed strong wind and non- directed w eak wind scenarios, assuming that the stomata of all plants are op en throughout the simulation. The results are given in Fig. 8. It is observed that, under the non-directed strong wind scenario, the alarm message propagates signican tly further from the transmitter. In con trast, under w eak wind conditions, the alarm remains largely lo calized. This result, together with the results of Fig. 7, sho ws ho w the comm unication of the alarm message is highly dep endent on the strong carrier wind. This dep endency suggests a direct application in the design of automated monitoring systems for smart greenhouses. Sp ecically , integrating con trolled airo w management can optimize signal cov erage and reduce detection latency , ensuring that lo calized p est or pathogen outbreaks are rapidly communicated to the en tire plant p opulation and monitoring devices through the diusion-adv ection c hannel. By maintaining a consistent medium o w, the comm unication radius of the biological receivers can b e articially extended, facilitating more robust and pre- dictable bio-monitoring net w orks. 10 0 1 2 3 Distance (m) 176 178 180 182 184 186 Alarm Time (min) 0 0.05 0.1 0.15 0.2 0.25 Linearity Time (min) Alarm Time Linearity Time (a) 0 0.5 1 1.5 2 2.5 3 Distance (m) 180 200 220 240 260 280 300 Alarm Time (min) 0 0.2 0.4 0.6 0.8 1 Linearity Time (min) Alarm Time Linearity Time (b) 0 0.5 1 1.5 2 2.5 3 Distance (m) 150 200 250 300 350 400 Alarm Time (min) 0 50 100 150 200 250 300 350 Linearity Time (min) Alarm Time Linearity Time no alarm (c) Fig. 7: Alarm time and linearity time versus T x–Rx distance for three wind regimes: (a) directed wind, (b)non- directed strong wind, and (c) non-directed weak wind. V. Conclusion This study presents a comprehensive end-to-end com- m unication mo del for o dor signaling in plants, sp eci- cally fo cusing on the transduction of GL V s from stressed source plants to unstressed sink plants. By in tegrating diusion-adv ection c hannel dynamics with a receiv er-side bio c hemical netw ork, the transformation of airb orne (Z)- 3-hexenal (HAL), (Z)-3-hexenol (HOL), and (Z)-3-hexenyl acetate (HA C) into the defensiv e metab olite (Z)-3-hexen yl β -vicianoside (HEXVic) is c haracterized. Notably , HOL w as identied as the primary driv er of the system and the main constraint on the receiver’s linear op erating region. This sp ecic technical insigh t op ens a deep er inquiry into the evolutionary logic of plan t b eha vior: why has the utilization of a div erse comp osition of molecules ev olv ed if a single component serves as the primary driv er? By synthesizing engineering principles with biological systems, these complex signaling trade-os can b e deco ded as optimized information-sharing strategies. It is emphasized that the restriction of the stomata limits the capacit y for o dor communication, suggesting that future smart agriculture techniques should rely on h ybrid systems that incorp orate v arious biological signals. Although plan ts may not b e able to decode the full bit sequence of a stress even t, sp ecialized devices could b e dev eloped to extract more detailed data, such as sp ecic herbiv ore biting patterns. This hidden information could b e reconstructed to allow highly informed decisions in agriculture applications. T o build on these ndings, future studies should aim to unco v er the mec hanics of other secondary signals, such as C a 2+ and R OS, and incorporate recov ery mechanisms to mo del the long-term ”resetting” of the biological receiver. Ultimately , the adoption of this in terdisciplinary approach allo ws the evolutionary bac kground of plant comm unica- tion to b e b etter understo o d, while a practical framew ork is provided to use these biological mechanisms for next- generation precision farming. References [1] S. M. W estman, K. J. Kloth, J. Hanson, A. B. Ohlsson, and B. R. Albrectsen, “Defence priming in Arabidopsis – a Meta- Analysis,” Scientic Rep orts, vol. 9, no. 1, p. 13309, September 2019. [2] A. C. Jones, T. M. Cofer, J. Engelb erth, and J. H. T umlinson, “Herbivorous Caterpillars and the Green Leaf V olatile (GL V) Quandary ,” Journal of Chemical Ecology , vol. 48, no. 3, pp. 337–345, March 2022. [3] F. Loreto and S. D’A uria, “How do plants sense v olatiles sent by other plan ts?” T rends in Plant Science, vol. 27, no. 1, pp. 29–38, January 2022. [4] A. K. Meents and A. Mithöfer, “Plant–Plan t Comm unication: Is There a Role for V olatile Damage-Asso ciated Molecular Patterns?” F rontiers in Plan t Science, vol. 11, October 2020. [5] A. B. Kilic and O. B. Akan, “Information and co mmunication theoretical foundations of the internet of plants, principles, challenges, and future directions,” 2025. [Online]. A v ailable: [6] A. Z. Babar and O. B. Akan, “Sustainable and precision agriculture with the internet of everything (io e),” 2025. [Online]. A v ailable: [7] D. Aktas et al., “Odor-based molecular communications: State- of-the-art, vision, challenges, and frontier directions,” IEEE Communications Surveys & T utorials, vol. 27, no. 4, pp. 2658– 2692, 2025. [8] B. D. Unluturk and I. F. Akyildiz, “An End-to-End Mo del of Plant Pheromone Channel for Long Range Molec ular Commu- nication,” IEEE T ransactions on NanoBioscience, vol. 16, no. 1, pp. 11–20, Jan uary 2017. [9] A. B. Kilic and O. B. Akan, “End-to-end mathematical mo d- eling of stress comm unication betw een plan ts,” IEEE T rans- actions on Molecular, Biological, and Multi-Scale Comm unica- tions, vol. 12, pp. 69–78, 2026. [10] B. Maitra and O. B. Akan, “Modeling and an alysis of voc-based interplan t molecular communication channel,” 2025. [Online]. A v ailable: [11] F. Merdan, “Created in biorender,” https://BioRender.com/ z55x3op, 2026, bioRender Illustration. [12] J. Midzi, D. W. Jeery , U. Baumann, S. Rogiers, S. D. Ty erman, and V. Paga y , “Stress-Induced V olatile Emissions and Signalling in Inter-Plan t Communication,” Plants, vol. 11, no. 19, p. 2566, January 2022. 11 -10 -5 -2 -1 0 1 2 5 10 x-position (m) -10 -5 -2 -1 0 1 2 5 10 y-position (m) Rx (no alarm) Rx (alarmed) Tx (a) -10 -5 -2 -1 0 1 2 5 10 x-position (m) -10 -5 -2 -1 0 1 2 5 10 y-position (m) Rx (no alarm) Rx (alarmed) Tx (b) -10 -5 -2 -1 0 1 2 5 10 x-position (m) -10 -5 -2 -1 0 1 2 5 10 y-position (m) Rx (no alarm) Rx (alarmed) Tx (c) -10 -5 -2 -1 0 1 2 5 10 x-position (m) -10 -5 -2 -1 0 1 2 5 10 y-position (m) Rx (no alarm) Rx (alarmed) Tx (d) -10 -5 -2 -1 0 1 2 5 10 x-position (m) -10 -5 -2 -1 0 1 2 5 10 y-position (m) Rx (no alarm) Rx (alarmed) Tx (e) -10 -5 -2 -1 0 1 2 5 10 x-position (m) -10 -5 -2 -1 0 1 2 5 10 y-position (m) Rx (no alarm) Rx (alarmed) Tx (f ) -10 -5 -2 -1 0 1 2 5 10 x-position (m) -10 -5 -2 -1 0 1 2 5 10 y-position (m) Rx (no alarm) Rx (alarmed) Tx (g) -10 -5 -2 -1 0 1 2 5 10 x-position (m) -10 -5 -2 -1 0 1 2 5 10 y-position (m) Rx (no alarm) Rx (alarmed) Tx (h) Fig. 8: Population-lev el alarm maps under non-directed strong wind after (a) 1 hour, (b) 3 hours, (c) 6 hours, and (d) 10 hours, and the maps under non-directed weak wind after (e) 1 hour, (f ) 3 hours, (g) 6 hours, and (h) 10 hours. [13] J. Jin et al., “V olatile comp ound-mediated plant–plan t interac- tions under stress with the tea plan t as a model,” Horticulture Research, vol. 10, no. 9, p. uhad143, Septem b er 2023. [14] K. Matsui and J. Engelb erth, “Green Leaf V olatiles—The F orefront of Plant Resp onses Against Biotic Attac k,” Plant and Cell Physiology , v ol. 63, no. 10, pp. 1378–1390, October 2022. [15] J. Engelberth, “Green Leaf V olatiles: A New Play er in the Protection against Abiotic Stresses?” In ternational Journal of Molecular Sciences, v ol. 25, no. 17, p. 9471, Jan uary 2024. [16] T. T anaka et al., “Identication of a Hexenal Reductase That Modulates the Comp osition of Green Leaf V olatiles,” Plant Physiology , vol. 178, no. 2, pp. 552–564, Octob er 2018. [17] M. v an Wijk, P . J. A. de Bruijn, and M. W. Sab elis, “Complex Odor from Plan ts under A ttac k: Herbivore’s Enemies React to the Whole, Not Its Parts,” PLOS ONE, vol. 6, no. 7, p. e21742, July 2011. [18] K. Sugimoto, K. Matsui, and J. T akabay ashi, “Uptake and Con- version of V olatile Compounds in Plant–Plan t Comm unication,” in Deciphering Chemical Language of Plant Communication, J. D. Blande and R. Glinw oo d, Eds. Cham: Springer Interna- tional Publishing, 2016, pp. 305–316. [19] V. Jamali, A. Ahmadzadeh, W. Wick e, A. No el, and R. Schober, “Channel Mo deling for Diusive Molecular Communication—A T utorial Review,” Pro ceedings of the IEEE, vol. 107, no. 7, pp. 1256–1301, July 2019. [20] M. Y amane and A. T ani, “An absorption mo del of volatile organic comp ound by plant leaf: The most inuential site in the absorption pathw a y ,” A tmospheric En vironmen t: X, v ol. 23, p. 100274, August 2024. [21] N. M. Aguirre, J. M. Grunseich, A. F. Lima, S. D. Da vis, and A. M. Helms, “Plant communication across dierent en- vironmental contexts suggests a role for stomata in v olatile perception,” Plant, Cell & Environmen t, v ol. 46, no. 7, pp. 2017–2030, 2023. [22] K. Sugimoto et al., “Intak e and transformation to a glycoside of (Z)-3-hexenol from infested neigh b ors rev eals a mo de of plant odor reception and defense,” Pro ceedings of the National Academ y of Sciences, v ol. 111, no. 19, pp. 7144–7149, Ma y 2014. [23] Y. Aratani, T. Uemura, T. Hagihara, K. Matsui, and M. T oy ota, “Green leaf v olatile sensory calcium transduction in Arabidop- sis,” Nature Communications, v ol. 14, no. 1, p. 6236, October 2023. [24] M. Ameye et al., “Metabolomics Rev eal Induction of ROS Production and Glycosylation Even ts in Wheat Up on Exp osure to the Green Leaf V olatile Z-3-Hexen yl Acetate,” F ron tiers in Plant Science, v ol. 11, Decem ber 2020. [25] K. Sarang, K. J. R udziński, and R. Szmigielski, “Green leaf volatiles in the atmosphere—properties, transformation, and signicance,” A tmosphere, v ol. 12, no. 12, 2021. [Online]. A v ailable: https://www.mdpi.com/2073- 4433/12/12/1655 [26] F. Merdan and O. B. Akan, “Airborne particle communication through time-varying diusion-advection channels,” 2026. [Online]. A v ailable: [27] B. E. Poling, J. M. Prausnitz, and J. P . O’Connell, The Properties of Gases and Liquids, 5th ed. New Y ork: McGraw- Hill, 2001. [28] D. J. W arne, R. E. Bak er, and M. J. Simpson, “Simulation and inference algorithms for sto chastic bio chemical reaction netw orks: F rom basic concepts to state-of-the-art,” Journal of The Roy al So ciety Interface, v ol. 16, no. 151, p. 20180943, F ebruary 2019. [29] P .-A. Lin et al., “Silencing the alarm: An insect saliv ary enzyme closes plant stomata and inhibits volatile release,” New Phytologist, vol. 230, no. 2, pp. 793–803, 2021. [30] R. Ospina and F. Marmolejo-Ramos, “P erformance of Some Estimators of Relative V ariability ,” F rontiers in Applied Math- ematics and Statistics, vol. 5, A ugust 2019. [31] Chemeo Database. cis-3-hexenal. Accessed: Sept. 21, 2025. [Online]. A v ailable: https://www.chemeo.com/cid/46- 326- 9/ 3- Hexenal- Z [32] ——. cis-3-hexen-1-ol. Accessed: Sept. 21, 2025. [Online]. A v ail- able: https://www.chemeo.com/cid/18- 655- 5/3- Hexen- 1- ol- Z [33] ——. cis-3-hexenyl acetate. Accessed: Sept. 21, 2025. [Online]. A v ailable: https://www.chemeo.com/cid/54- 175- 8/ 3- Hexen- 1- ol- acetate- Z [34] U.S. En vironmen tal Protection Agency . Indoor air unit conv ersions. Accessed: Sept. 21, 2025. [Online]. A v ail- able: https://www3.epa.gov/ceampubl/learn2model/part- two/ onsite/doc/Indoor%20Air%20Unit%20Conversions.pdf [35] J. H. Seinfeld and S. N. Pandis, A tmospheric Chemistry and Physics: F rom Air Pollution to Climate Change, 2nd ed. New Y ork: J. Wiley & sons, 2006. [36] D. T olleter et al., “The Arabidopsis leaf quantitativ e atlas: A cellular and sub cellular mapping through unied data in tegra- tion,” Quantitativ e Plan t Biology , vol. 5, p. e2, F ebruary 2024. 12 [37] M. Durand, B. Porc heron, N. Hennion, L. Maurousset, R. Lemoine, and N. Pourtau, “W ater Decit Enhances C Export to the Roots in Arabidopsis thaliana Plan ts with Con tribution of Sucrose T ransp orters in Both Shoot and Ro ots1[OPEN],” Plant Physiology , v ol. 170, no. 3, pp. 1460–1479, Marc h 2016. [38] I. H. Segel, Enzyme Kinetics: Behavior and Analysis of Rapid Equilibrium and Steady-State Enzyme Systems. New Y ork: Wiley , 1975. [39] T. M. Cofer and J. H. T umlinson, “The carboxylesterase AtCXE12 converts volatile (Z)-3-hexenyl acetate to (Z)-3- hexenol in Arabidopsis lea ves,” Plan t Physiology , v ol. 197, no. 4, p. kiaf119, April 2025. [40] T. Jing et al., “Glucosylation of (Z)-3-hexenol informs in- traspecies interactions in plants: A case study in Camellia sinensis,” Plant, Cell & Environmen t, vol. 42, no. 4, pp. 1352– 1367, 2019. [41] K. Sugimoto et al., “Identication of a tomato UDP- arabinosyltransferase for airborne v olatile reception,” Nature Communications, vol. 14, no. 1, p. 677, F ebruary 2023. [42] B. Dubreuil, O. Matalon, and E. D. Levy , “Protein Abundance Biases the Amino A cid Comp osition of Disordered Regions to Minimize Non-functional In teractions,” Journal of Molecular Biology , v ol. 431, no. 24, pp. 4978–4992, Decem b er 2019. [43] PaxDb Consortium. Paxdb: Protein abundance database. Accessed: Sept. 24, 2025. [Online]. A v ailable: https://pax- db.org F atih Merdan completed his high school ed- ucation at Kırıkkale Science High Sc hool. He received his B.Sc. degree in Electrical and Electronics Engineering from Middle East T echnical Universit y . He is currently pursuing his M.Sc. degree in Electrical and Electronics Engineering under the supervision of Prof. Akan at K oç Univ ersit y , Istan bul, T urkey . Ozgur B. Akan (F ellow, IEEE) received the PhD from the Sc hool of Electrical and Com- puter Engineering Georgia Institute of T ech- nology Atlan ta, in 2004. He is curren tly the Head of In ternet of Ev erything (IoE) Group, with the Departmen t of Engineering, Univer- sity of Cam bridge, UK and the Director of Centre for neXt-generation Comm unications (CXC), Koç Universit y , T urkey . His researc h interests include wireless, nano, and molecular communications and In ternet of Ev erything.
Original Paper
Loading high-quality paper...
Comments & Academic Discussion
Loading comments...
Leave a Comment