Optimal Placement and Sizing of PV-Based DG Units in a Distribution Network Considering Loading Capacity
This research paper proposes an efficient methodology for the allocation of multiple photovoltaic (PV)-based distributed generation (DG) units in the radial distribution network (RDN), while considering the loading capacity of the network. The propos…
Authors: Abhinav Sharma, Pratyush Chakraborty, Manoj Datta
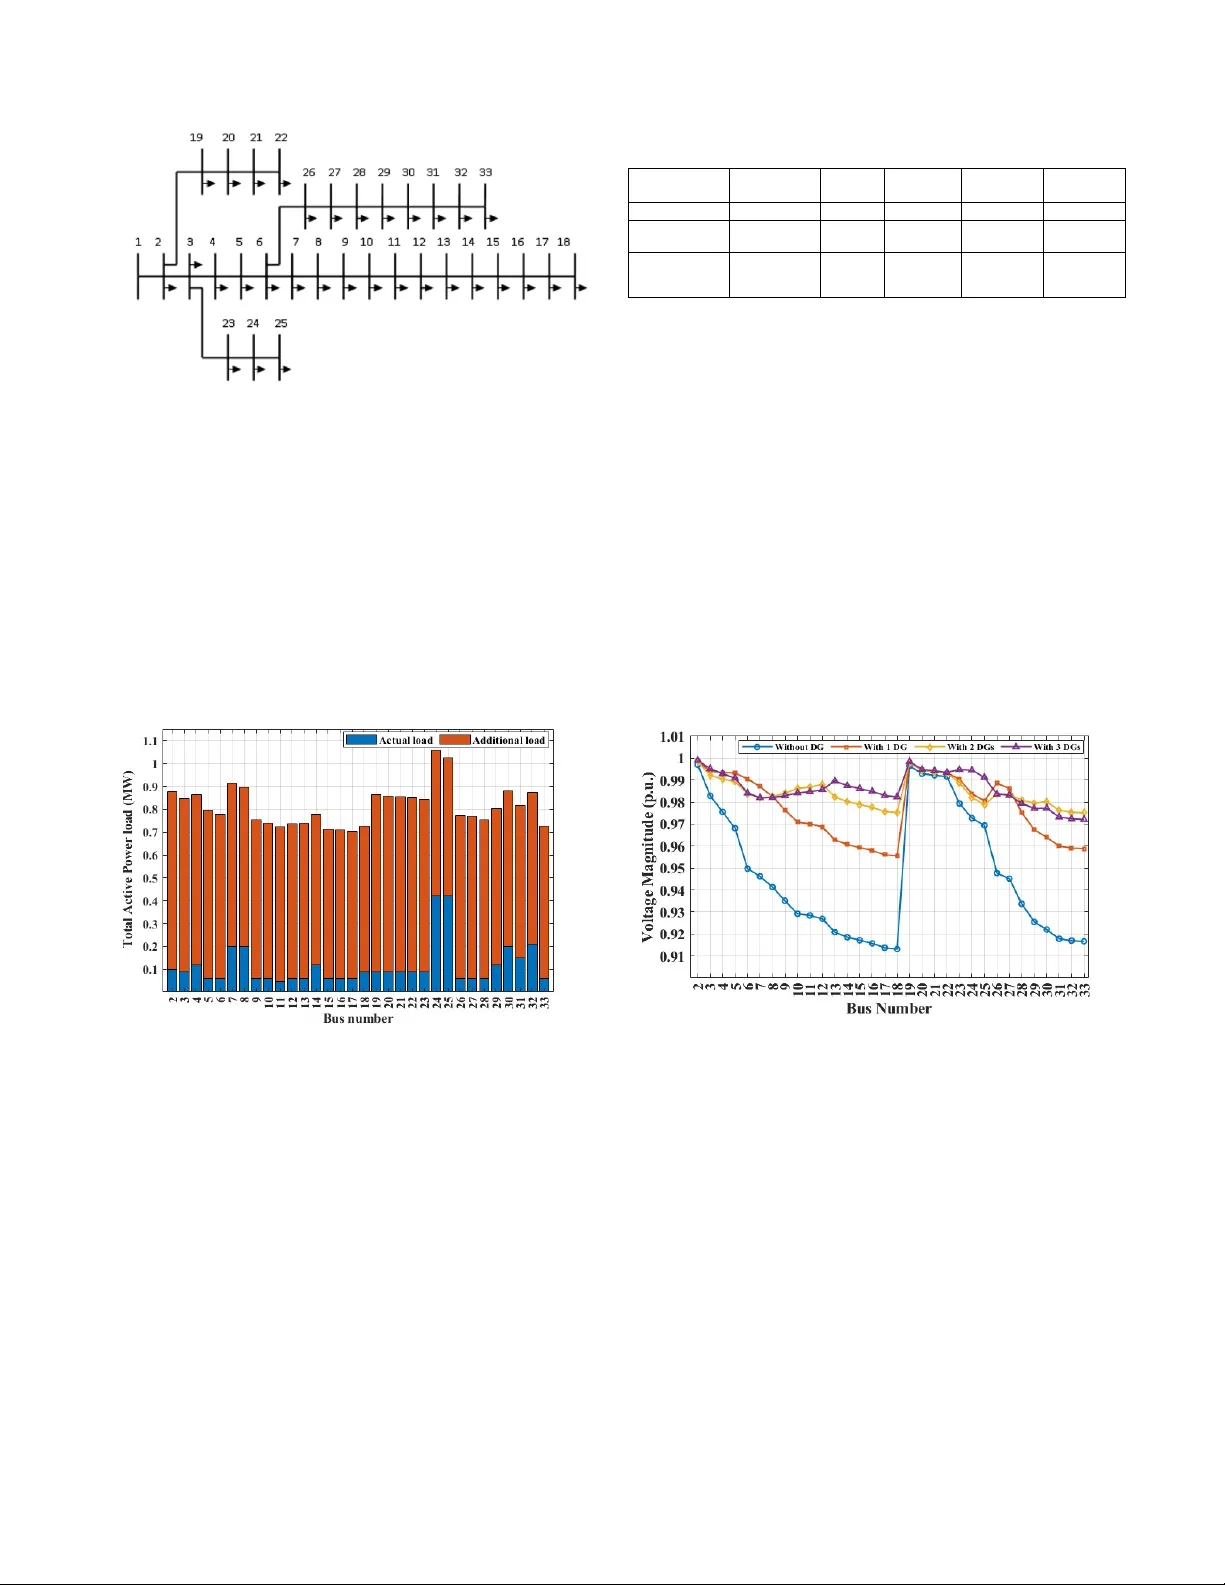
1 Optimal Placement and Sizing of PV -Based DG Units in a Distrib ution Network Considering Loading Capacity Abhinav Sharma, Student Member , IEEE, Pratyush Chakraborty , Senior Member , IEEE, Manoj Datta, Senior Member , IEEE, and Kazi N. Hasan, Senior Member , IEEE Abstract —This resear ch paper proposes an efficient method- ology for the allocation of multiple photo voltaic (PV)-based dis- tributed generation (DG) units in the radial distribution network (RDN), while considering the loading capacity of the network. The proposed method is structured using a two-stage approach. In the first stage, the additional active power loading capacity of the network and each individual b us is determined using an iterative approach. This analysis quantifies the network’ s additional active loadability limits and identifies buses with high active power loading capacity , which are considered candidate nodes for the placement of DG units. Subsequently , in the second stage, the optimal locations and sizes of DG units are determined using the Monte Carlo method, with the objectives of minimizing voltage de viation and reducing acti ve power losses in the netw ork. The methodology is validated on the standard IEEE 33-b us RDN to determine the optimal locations and sizes of DG units. The results demonstrate that the optimal allocation of one, two, and three DG units, achieved from proposed method, reduces network’ s active power losses by 50.37%, 58.62%, and 65.16%, respecti vely , and also significantly enhances the voltage profile across all buses. When the obtained results are compared with the results of several existing studies, it is found that the proposed method allows f or larger DG capacities and maintains better voltage profiles throughout the RDN. Index T erms —Distributed generation, distrib ution network planning, iterativ e approach, loading capacity , Monte Carlo method, optimal placement and sizing. N O M E N C L A T U R E m, n Index for buses c Index for interconnection point L Set of lines M Set of nodes C Set of interconnection points b Line susceptance g Line conductance P k m Additional activ e power loading P M Grid supplied activ e power Q M Grid supplied reactiv e power P L Line activ e power injection QL Line reactiv e po wer injection Abhinav Sharma is with the Department of Electrical and Electronics Engineering, BITS Pilani, Hyderabad Campus, Hyderabad, 500078, India, and also with the School of Engineering, RMIT Uni versity , Melbourne VIC 3000, Australia. Pratyush Chakraborty is with the Department of Electrical and Electronics Engineering, BITS Pilani Hyderabad Campus, Hyderabad, 500078, India. Manoj Datta and Kazi N. Hasan is with the School of Engineering, RMIT Univ ersity , Melbourne VIC 3000, Australia. P D Activ e power load Q D Reactiv e power load P DG Power output from DG V V oltage magnitude θ V oltage angle I . I N T RO D U C T I O N T HE increasing penetration of renew able energy sources (RES) into power distribution networks is a critical step tow ard achieving sustainable and low-carbon energy systems. Howe ver , the integration of RES poses significant technical challenges due to the intermittent nature and the limited host- ing capacity of existing distribution infrastructure. Tradition- ally , distribution netw orks were structured to transmit po wer unidirectionally from central generating stations to end-users. Accommodating distributed RES requires careful planning to maintain voltage stability , minimize power losses, and enhance network reliability [1], [2]. In recent years, there has been notable focus on dev elop- ing efficient techniques for optimal DG allocation in distri- bution networks. These approaches are mainly intended to improv e voltage profiles, minimize losses in the network, and strengthen the reliability and resilience of power system [3]. Numerous optimization strategies hav e focused on determining optimal allocation of DG units. Broadly , these strate gies are di- vided into three main cate gories. The first group includes meta- heuristic algorithms, such as e volutionary computation and simulated annealing, which are widely adopted for their ability to escape local optima and handle nonlinear search spaces [4], [5]. The second group in volves mathematical programming approaches, where formulations such as linear, nonlinear , and mixed-inte ger programming are employed depending on the problem structure [6], [7], [8], [9]. A third category comprises search-based techniques, for example, T abu search and group search optimization, which rely on systematic exploration of feasible solutions [10], [11]. Different load flo w models are incorporated to ev aluate candidate solutions, including backward/forward sweep, probabilistic power flo w , and the distFlow formulation [12], [13], [14]. Moreover , advanced op- timization framew orks like sequential quadratic programming (SQP) and A C optimal power flo w (A COPF) are often used for enhancing solution accuracy and reliability [15], [16]. The author of [17] focuses on determining the additional loading capacity to ensure that the system can handle increased 2 demand or integrate distributed generation without compro- mising network performance. The system’ s capability to ac- commodate increased load demand through the integration of wind and solar DG units without violating network constraints is assessed in [18]. The particle swarm optimization (PSO) algorithm in [19] used for optimal allocation of PV -DG units, aiming to min- imize losses, improve voltage deviation, and enhance cost- effecti veness. The joint optimization of RDN reconfiguration with DG allocation has been formulated as MILP problem to overcome the limitations of metaheuristic methods. By linearizing the nonlinear problem, the proposed approach ensures global optimality and con vergence [20], [21], [22]. A nonlinear programming framew ork has also been pro- posed for determining the optimal allocation for renewable DGs, with objectiv e of reducing network losses through lo- calized generation [23]. The approach incorporates A COPF , while accounting for operational limits and uncertainties in de- mand and renew able output. Another contribution in this area combines probabilistic nonlinear optimization with sensitivity- based analysis to reduce losses while simultaneously de- termine DG allocation and transformer tap positions [24]. These methods offered a more ef fectiv e and reliable alternativ e compared to traditional planning techniques. Multi-objectiv e optimization approaches have been adopted to enhance both the loadability limits and reduce losses in distribution networks. One such technique frames the problem of optimal DG allocation as an MINLP model and solv es it using a two-stage (bi-level) strategy . The first stage, referred to as the siting planning model (SPM) [25], utilizes index- based methods to identify promising bus locations. In the second stage, the capacity planning model (CPM) [26], op- timization techniques as SQP and B AB [27] are applied to determine optimal DG sizes. The use of heuristic index-based methods in the siting phase may overlook critical operational constraints, the computational burden of mixed-inte ger nonlin- ear programming-based sizing strategies can hinder practical deployment, especially in larger or real-time applications. It can be observed from the existing literature that only few studies consider a composite objecti ve function as the minimization of voltage de viation and network active po wer losses when solving the optimal allocation problem. Most studies focus solely on single optimization criterion, such as reducing power losses or improving the voltage profile. Furthermore, in many existing approaches, vital operational constraints of the distribution system such as line flow lim- its, equipment ratings, and permissible bus voltage limits are not considered. As a result, the actual capacity of the network to accommodate additional loads or DGs may be ov erlooked, leading to suboptimal solutions or ev en infeasible solutions. These limitations ha ve been resolved in this paper by dev eloping an efficient two-stage methodology . The major contributions of this paper are as follows: 1) W e de veloped an efficient two-stage methodology for the optimal placement and sizing of multiple DG units in a distribution network. A ne w advantageous feature of this method is that it first ev aluates the loading limits of the network and of each individual bus, ensuring that the DG units have larger capacities and are placed only at nodes with sufficient installation capacity . 2) Our method addresses the complex and highly con- strained DG allocation problem by considering all the vital operational constraints of the network. 3) W e validated the method on the standard IEEE 33- bus RDN, demonstrating its ef fecti veness in significantly reducing active power losses and improving the voltage profile. 4) W e conducted comparati ve analysis of the results ob- tained from our method with those of sev eral existing approaches, and our method demonstrated better perfor- mance. The structure of this paper is as follows: Section I provides an introduction, including a comprehensive revie w of related literature, the motiv ation behind this study , key contributions, and the paper structure. The mathematical modeling is pro- vided in Section II. The proposed methodology is discussed in detail in Section III. The v alidation of the methodology using the IEEE 33-bus test system is detailed in Section IV , while Section V presents the conclusions of the study . I I . M A T H E M A T I C A L M O D E L I N G In this section, the optimal allocation problem in a distri- bution network is formulated as a two-stage approach. The mathematical formulation of the first stage, for determining the network’ s additional activ e loadability limits, is modeled, and the mathematical formulation of the second stage, to determine the optimal locations and sizes of DG units using the Monte Carlo method is also modeled. The mathematical modeling for both stages is giv en below . A. Mathematical modeling of the first stage The constrained optimization problem for the first stage is formulated as: 1) Objective function The objectiv e is to find the additional active loading capac- ity , which is giv en as: max X m ∈M P mλ (1) 2) Constraints Nodal activ e and reactiv e power balances are modeled by equations (2) and (3). They ensure that the total power , which includes both grid supplied power and power injected through connected lines, at each bus equals the corresponding power demand. X c ∈C m P M c + X l ∈L nm P L nm = P dm + P mλ ∀ m ∈ M (2) X c ∈C m Q M c + X l ∈L nm QL nm = Q dm ∀ m ∈ M (3) The power supplied from the slack bus is constrained by specified power limits, defined in equations (4) and (5). 3 P M , min c ≤ P M c ≤ P M , max c ∀ c ∈ C m (4) Q M , min c ≤ Q M c ≤ Q M , max c ∀ c ∈ C m (5) Set C m comprises all buses that serve as POIs to the upstream network. Line flows are ev aluated using equations (6) and (7), considering line parameters such as conductance and susceptance, voltage magnitudes, and phase angles at the corresponding buses. P L mn = g mn V 2 m − g mn V m V n cos θ mn − b mn V m V n sin θ mn (6) QL mn = − b mn V 2 m − b mn V m V n cos θ mn − g mn V m V n sin θ mn (7) The line flo ws are constrained with their respecti ve power flow limits, as defined in equations (8) and (9). − P L max mn ≤ P L mn ≤ P L max mn ∀ mn ∈ L (8) − QL max mn ≤ QL mn ≤ QL max mn ∀ mn ∈ L (9) The v oltage magnitude at each bus is constrained within specified upper and lower bounds, as giv en in equation (10). V min m ≤ V m ≤ V max m ∀ m ∈ M (10) The maximum current carrying capacity for each line within the corresponding thermal limits is specified as (11). I mn ≤ I max mn ∀ mn ∈ M (11) B. Mathematical modeling of the second stage The constrained optimization problem for the second stage is formulated as: 1) Objective function T wo single objectiv e functions are considered as minimiza- tion of v oltage deviation and minimization of activ e power loss. a) Minimization of V oltage Deviation V oltage deviation ( ∆ V m ), ∆ V m = | V m − 1 | , (12) f 1 = min X m ∈M | V m − 1 | (13) where V m is voltage profile on m th bus.The ∆ V m represents the deviation between the voltage at the m th bus and the reference voltage (1 pu). b) Minimization of active power losses T otal active power losses ( P L ), P L = L X mn =1 P L 2 mn + QL 2 mn V 2 m R mn , (14) f 2 = min( P L ) (15) The weighted sum approach combines multiple single ob- jectiv e functions into a composite function. The overall objec- tiv e function is formulated by using multiple single objectives and giv en as: F obj. = ( w 1 × f 1 ) + ( w 2 × f 2 ) (16) Each objecti ve function is associated with a weight that reflects its relative priority . These weighting coefficients are strictly positiv e and normalized such that, 2 X i =1 w i = 1 . . . . . . . . . w i ∈ (0 , 1) (17) where w is the weighting factor . 2) Constraints Nodal activ e and reactiv e power balances are modeled by equations (18) and (19). They ensure that the total power , which includes both grid supplied po wer and power injected through connected lines, at each bus equals the corresponding power demand. X c ∈C m P M c + X l ∈L nm P Lnm = P dm ∀ m ∈ M (18) X c ∈C m Q M c + X l ∈L nm Q Lnm = Q dm ∀ m ∈ M (19) In equation (20), the constraints on the power output of DGs are specified. P min DG i ≤ P DG i ≤ P max DG i ∀ i ∈ { 1 , 2 , . . . , N DG } (20) The v oltage magnitude at each bus is constrained within specified upper and lower bounds, as giv en in equation (21). V min m ≤ V m ≤ V max m ∀ m ∈ M (21) I I I . P RO P O S E D M E T H O D O L O G Y Heuristic-based approaches for the allocation of DG units in RDN are widely explored in recent literature. These approaches can provide approximate solutions with limited computational burden but often overlook critical operational constraints of network, such as line flow limits, equipment rat- ings, permissible bus voltage limits. Ignoring these constraints can lead to significant stress on the system and potential opera- tional issues. Although a fully exhausti ve OPF-based approach for DG allocation satisfies all network constraints, it imposes a high computational burden. T o address these drawbacks, an efficient two-stage methodology has been proposed. Fig.1 shows the flowchart for proposed two-stage methodology . 4 Fig. 1. Flowchart of the proposed methodology An iterativ e approach is used in the first stage to determine the additional activ e loading capacity of the network and of each individual bus. This analysis determines the network’ s additional active loading limit and identifies the b uses with high activ e loading capacity , which are considered as the candidate nodes for DG placement. The steps in volved for determining the additional loading capacity is provided in Algorithm 1. Algorithm 1 Loadability Capacity Analysis for Network Initialize base power flow using MA TPO WER Identify load buses in the system data Set system operational constraints for each load bus in the system do Initialize λ = 1 Set λ max = λ Scale activ e power load at current bus using λ Create a test case with updated load while power flow conv erges do Check operational constraints if all constraints are satisfied then Update λ max Increment λ ← λ + λ step else Break end if end while Store λ max for current bus end for Calculate Additional load = ( λ − 1) × base load at each bus Identify top N buses with highest loadability margin In the second stage, Monte Carlo method is employed to determine the optimal locations and sizes of DG units, with the objectiv e of minimizing voltage deviation and reducing activ e po wer losses. The Monte Carlo method is executed T times, with the placement of DG units on buses selected via probabilistic sampling from the top N buses, and assigned sizes within the specified penetration limits of the network’ s loadability . For each trial, the system is modified with selected DG configurations, and power flow analysis is performed. If the power flow conv erges and all bus v oltage constraints are satisfied, objective function ev aluated and the trial results are stored. The steps in volved in assessing the optimal placement and sizing is provided in Algorithm 2. Algorithm 2 DG Placement and Sizing using Monte Carlo Method Initialize: Number of DG units N DG , bounded DG limits, bus voltage limits, and number of Monte Carlo trials T for each trial t = 1 to T do Select buses for DG placement using probabilistic sam- pling from the top N candidate/ranked buses Assign DG sizes within specified bounded penetration limits Modify system data with selected DG placement and sizing Run power flow for modified system if power flow conv erges then Check voltage constraints at all buses if all constraints are satisfied then Compute objectiv e function (OF) Store trial result (placement, sizing, OF) else Discard trial end if else Discard trial end if end for From stored trials, identify the one with: • V alid voltage limits at all buses • Minimum objectiv e function value Compute and display the optimal solution for DG place- ment and sizing from the stored trial I V . V A L I D A T I O N U S I N G T E S T S Y S T E M The IEEE 33-bus RDN is used to validate the proposed two- stage methodology . The corresponding single-line diagram of RDN is in Fig. 2. RDN has a total load demand of 3.72 MW of activ e po wer and 2.3 MV ar of reactiv e power . Under the base operating condition, the network experiences losses of 0.211 MW (activ e) and 0.143 MV ar (reactiv e). Moreover , 21 of the 33 buses hav e voltages lo wer than the specified voltage limit of 0.95 p.u. [28]. All simulations were performed in MA TLAB using MA TPO WER on a laptop with an Intel(R) Core(TM) i7 processor running at 3.20 GHz and 16 GB of RAM. 5 Fig. 2. Single line diagram of test network [28]. A. Results and Discussions The increase in active loading capacity for each individual bus, within the limits of operational constraints, is sho wn in Fig. 3. It illustrates both the fixed load and the additional load that can be accommodated at each bus. Out of all the buses, Bus 2 can handle the maximum load increase, whereas Bus 18 allo ws the least. The maximum achiev able load of 4.6 MW is obtained when simultaneous loading is permitted across all buses. Fig. 3. Fixed load and additional loading for each individual bus. The proposed method is used to allocate PV -based DG units, which supply activ e power ( P DG ). T able I summarizes the optimal allocation results for one, two, and three DG units in RDN. For a single DG unit, bus 6 is identified as the optimal location with a capacity of 2.893 MW , lowering total acti ve power losses from 0.211 MW to 0.1047 MW . The minimum bus voltage in this case is 0.9556 p.u., observed at bus 18. For two DG units, the optimal placement is determined at buses 12 and 30, with corresponding capacities of 1.147 MW and 1.239 MW . This configuration results in a further reduction of the network’ s activ e power losses to 0.0873 MW , while the minimum bus voltage improv es to 0.9751 p.u., observed at bus 33. For three DG units, the optimal placement is determined at buses 13, 24, and 30, with corresponding capacities of 1.032 MW , 1.096 MW , and 1.062 MW , respectively . The lowest activ e power losses of 0.0735 MW are obtained, with a minimum bus voltage of 0.9556 p.u. observed at bus 18. T ABLE I R E SU LT S F O R A L L OC ATI O N O F D G U N IT S No. of DG Units Optimal Loc- ation(s) DG Size (MW) Losses w/o DG Losses with DGs V min (p.u.) , Bus One DG Unit 6 2.893 0.211 0.1047 0.9556, 18 T wo DG Units 12 30 1.147 1.239 0.211 0.0873 0.9751, 33 Three DG Units 13 24 30 1.032 1.096 1.062 0.211 0.0735 0.9721, 33 Fig. 4 illustrates the voltage magnitude profile of the RDN under four scenarios: without DG, with single DG, with two DGs, and with three DGs. Under the base operating condition or without any DG unit, the network exhibits significant voltage drops, with minimum voltage around 0.91 p.u. at farthest b uses. With a single DG unit, the voltage profile shows noticeable impro vement, with minimum bus voltage rises above 0.95 p.u. and 17 buses having voltage magnitudes greater than 0.98 p.u. With two DG units, the voltage profile across the buses remains abo ve 0.97 p.u., and 23 buses have voltage magnitudes abov e 0.98 p.u. W ith three DG units, the system achiev es the best performance, with voltage magni- tudes maintained abov e 0.97 p.u. across all buses and 28 buses hav e voltage magnitude more than 0.98 p.u. Fig. 4. RDN voltage magnitude profiles for different DG scenarios. B. Comparative analysis of the pr oposed and existing methods T ables II, III, and IV presents a comparison of the results obtained from proposed two-stage methodology for allocation of DG units, with those of several existing methodologies such as improved analytical technique (IA T) [29], genetic algorithm (GA) [30], salp swarm algorithm (SSA) [31], multi-objectiv e whale optimization algorithm (WO A) [32], efficient analytical (EA) [33], coot bird optimization (CBOM) [34], and improved HHO using PSO [35]. For the case of a single DG unit, all methodologies identify bus 6 as the optimal location, but the proposed method allows the largest DG size of 2.893 MW , achiev es 50.37% reduction in acti ve power losses which is higher than most existing methods, and obtain V min of 0.9556 p.u., which is better than V min obtained from all other methods, as summarized in T able II. 6 T ABLE II S I NG L E D G A L L O CAT IO N I N R D N: A C O MPA R A T I VE S T UD Y O F D I FFE R E N T M E T H OD S DG units Different Methods For IEEE 33 Bus RDN Bus No. DG Size (MW) Loss Red- uction (%) V min (p.u.) 1 IA T [29] 6 2.431 47.31 0.9476 GA [30] 6 2.500 46.96 0.9500 SSA [31] 6 2.490 47.31 0.9401 WO A [32] 6 2.590 47.39 0.9425 EA [33] 6 2.530 47.39 0.9504 CBOM [34] 6 2.575 50.72 0.9511 HHOPSO [35] 6 2.574 50.73 0.9510 Proposed Method 6 2.893 50.37 0.9556 For the case of two DG units, the proposed method selects buses 12 and 13 as optimal locations. The total DGs capacity is 2.380 MW , which is larger than that of other methods, while achieving a comparable active power losses reduction of 58.62% and V min of 0.9751 p.u., which is better than V min obtained from all other methods, as summarized in T able III. T ABLE III T WO D G A L L O CAT IO N I N R D N: A C O MPA R A T IV E S T UD Y O F D I FF E RE N T M E TH O D S DG units Different Methods For IEEE 33 Bus RDN Bus No. DG Size (MW) Loss Red- uction (%) T otal DG Size (MW) V min (p.u.) 2 IA T [29] - - 55.62 - - GA [30] 14 30 0.750 1.250 58.44 2.000 0.9701 SSA [31] 13 30 0.832 1.110 58.64 1.970 0.9667 WO A [32] - - - - - EA [33] 13 30 0.844 1.140 58.50 1.958 0.9682 CBOM [34] 13 30 0.852 1.157 58.69 2.009 0.9684 HHOPSO [35] 13 30 0.846 1.158 59.09 2.004 0.9680 Proposed Method 12 30 1.147 1.239 58.62 2.380 0.9751 For the case of three DG units, the optimal buses are 13, 24 and 30. The total DGs capacity is 3.190 MW , which is larger than that of other methods, while achieving a 65.16% reduction in activ e po wer losses, which is only about 1 kW higher than that obtained by some existing methods and V min of 0.9721 p.u., which is better V min obtained from all other methods, as summarized in T able IV . The increased capacity of DGs results in significantly improv ed voltage magnitude profile throughout the RDN, ensuring that voltages remain within permissible operating limits. Figs. 5–7 illustrate the improv ed bus v oltage profiles of the RDN for three cases: with one, two, and three DG units, respectiv ely . As e vident from the figures, the voltage profile improves progressiv ely with an increasing number of DG units across all methods. Howe ver , compared to existing methods, the proposed method demonstrates an improved voltage profile in all three cases by maintaining higher bus voltage magnitudes throughout RDN. T ABLE IV T H RE E D G A L LO C A T I O N I N R D N : A C O M P A R A T I VE S T U DY O F D I FFE R E N T M E T H OD S DG units Different Methods For IEEE 33 Bus RDN Bus No. DG Size (MW) Loss Red- uction(%) T otal DG Size (MW) V min (p.u.) 3 IA T [29] 6 18 32 1.312 0.462 0.657 61.48 2.431 0.9701 GA [30] 14 24 29 0.750 1.250 1.000 64.95 3.000 0.9639 SSA [31] 13 24 30 0.790 1.070 1.012 65.45 2.872 0.9670 WO A [32] 13 24 30 0.801 1.091 1.053 65.50 2.945 0.9687 EA [33] 13 24 30 0.798 1.099 1.050 65.36 2.947 0.9683 CBOM [34] 13 24 30 0.802 1.091 1.054 65.50 2.947 0.9687 HHOPSO [35] 14 24 30 0.761 1.094 1.068 66.14 2.926 0.9687 Proposed Method 13 24 30 1.032 1.096 1.062 65.16 3.190 0.9721 Fig. 5. Improved bus voltage profiles of the RDN with one DG unit. Fig. 6. Improved bus voltage profiles of the RDN with two DG units. 7 Fig. 7. Improved bus voltage profiles of the RDN with three DG units. V . C O N C L U S I O N This paper presents an efficient two-stage methodology for the optimal allocation of multiple PV -based DG units in a radial distribution network, while accounting for the network’ s loading capacity . An iterative technique is used in the first stage to e valuate the additional activ e loading capacity of the network and each individual bus, identifying candidate locations for DG placement. The Monte Carlo method is used in the second stage to determine the optimal sizes and locations of the DG units, aiming to minimize voltage deviations and reduction in activ e power losses in the network. The proposed tw o-stage methodology , when v alidated on IEEE 33-bus RDN, demonstrates notable impro vements in ov erall network performance. Specifically , the optimal allocation of one, two, and three DG units yields active po wer losses re- ductions of 50.37%, 58.62%, and 65.16%, respectiv ely , while simultaneously improving bus voltage magnitudes throughout the RDN. The comparati ve analysis of the proposed methodology with other existing methods demonstrates its merits, as it identifies suitable DG locations, accommodates larger DG capacities, and achiev es significant reductions in active power losses, and notable voltage profiles improvements. These adv antages high- light the practical applicability of the method for integrating DGs into modern distribution systems. Future work aims to determine overall loadability limits of the network and of each individual bus, as well as to e xplore the integration of other types of DG units. R E F E R E N C E S [1] J. M. Raya-Armenta, N. Bazmohammadi, J. G. A vina-Cervantes, D. S ´ aez, J. C. V asquez, and J. M. Guerrero, “Energy management system optimization in islanded microgrids: An overvie w and future trends, ” Renewable and Sustainable Energy Reviews , vol. 149, p. 111327, 2021. [2] G. M. Binini, J. L. Munda, and O. M. Popoola, “Optimal location, sizing and scheduling of distributed energy storage in a radial distribution network, ” Journal of Energy Storage , vol. 94, p. 112499, 2024. [3] J. Caballero-Pe ˜ na, C. Cadena-Zarate, A. Parrado-Duque, and G. Osma- Pinto, “Distributed energy resources on distribution networks: A sys- tematic revie w of modelling, simulation, metrics, and impacts, ” In- ternational Journal of Electrical P ower & Energy Systems , vol. 138, p. 107900, 2022. [4] S. Alizadeh, M. Mahdavian, and E. Ganji, “Optimal placement and sizing of photovoltaic power plants in po wer grid considering multi- objectiv e optimization using ev olutionary algorithms, ” Journal of Elec- trical Systems and Information T echnology , vol. 10, no. 1, p. 7, 2023. [5] S. I. T aheri, M. Davoodi, and M. H. Ali, “ A simulated-annealing-quasi- oppositional-teaching-learning-based optimization algorithm for dis- tributed generation allocation, ” Computation , vol. 11, no. 11, p. 214, 2023. [6] A. V alencia-D ´ ıaz, R. A. Hincapi ´ e, and R. A. Gallego, “Optimal place- ment and sizing of distributed generation in electrical dc distribution networks using a stochastic mixed-integer lp model, ” Arabian Journal for Science and Engineering , vol. 49, no. 8, 2024. [7] M. Zare-Bahramabadi, H. Farzin, and M. Ehsan, “ A mixed integer lin- ear programming model for risk-based placement of remote-controlled switches, distributed generation, and tie line in distribution systems with complex topologies to improve the resilience, ” IET Renewable P ower Generation , vol. 17, no. 13, pp. 1316–1327, 2023. [8] S. M. R. H. Shawon, X. Liang, and M. Janbakhsh, “Optimal placement of distrib uted generation units for microgrid planning in distribution networks, ” IEEE Tr ansactions on Industry Applications , vol. 59, no. 3, pp. 2785–2795, 2023. [9] H. Ak ¨ ulker and E. A ydin, “Optimal design and operation of a multi- energy microgrid using mixed-integer nonlinear programming: Impact of carbon cap and trade system and taxing on equipment selections, ” Applied Ener gy , vol. 330, p. 120313, 2023. [10] R. Y . Y amamoto, T . Pinto, R. Romero, and L. H. Macedo, “Specialized tabu search algorithm applied to the reconfiguration of radial distribution systems, ” International Journal of Electrical P ower & Ener gy Systems , vol. 162, p. 110258, 2024. [11] T . H. B. Huy , “Enhancing distribution system performance via dis- tributed generation placement and reconfiguration based on improved symbiotic organisms search, ” Journal of Control Science and Engineer- ing , vol. 2023, p. 6081991, 2023. [12] C. Gonz ´ alez-Mor ´ an, P . Arboleya, and B. Mohamed, “Matrix backward forward sweep for unbalanced po wer flow in alpha-beta o frame, ” Electric P ower Systems Resear ch , vol. 148, pp. 273–281, 2017. [13] L. A. Gallego Pareja, J. F . Franco, and L. G. Cordero Bautista, “ A fast-specialized point estimate method for the probabilistic optimal power flow in distribution systems with renewable distributed gener- ation, ” International Journal of Electrical P ower & Energy Systems , vol. 131, p. 107049, 2021. [14] S. Kapoor , J. Hendriks, A. G. W ills, L. Blackhall, and M. Mahmoodi, “Modified distflow: Novel power flow model for distribution grid, ” in 2024 IEEE PES Innovative Smart Grid T echnologies Europe (ISGT Eur ope) , pp. 1–5, 2024. Explicit, non-recursiv e DistFlow model with improved accuracy and speed. [15] G. Lakshmi and N. Srilatha, “Optimal capacity and placement of distributed generation using sequential quadratic programming, ” Inter- national Journal of Intelligent Systems and Applications in Engineering , vol. 12, no. 22s, p. 1241, 2024. [16] S. Das, O. B. Fosso, and G. Marafioti, “Efficient distribution network loss minimization with optimal dg placement and operation, ” in 2021 IEEE 12th Energy Con version Congress & Exposition - Asia (ECCE- Asia) , pp. 1885–1890, 2021. [17] M. Alturki and A. Khodaei, “Optimal loading capacity in distribution grids, ” in 2017 North American P ower Symposium (N APS) , pp. 1–6, 2017. [18] F . Zishan, E. Akbari, A. R. Sheikholeslami, and N. Shafaghatian, “Optimization and placement of dg resources in the network to reduce line loading, ” International Journal of Industrial Electronics, Control and Optimization , vol. 6, no. 2, pp. 89–100, 2023. [19] R. Gnanendar and M. Sushama, “Enhancing distribution network effi- ciency and symmetry via optimal sizing and location of photovoltaic dg using pso, ” International Journal of Intelligent Systems and Applications in Engineering , vol. 12, no. 4, pp. 4381–4387, 2024. [20] L. A. Gallego, J. M. L ´ opez-Lezama, and O. G. Carmona, “ A mixed- integer linear programming model for simultaneous optimal reconfigura- tion and optimal placement of capacitor banks in distribution networks, ” IEEE Access , vol. 10, pp. 52655–52673, 2022. [21] A. V alencia-D ´ ıaz, R. A. Hincapi ´ e, and R. A. Gallego, “Optimal place- ment and sizing of distributed generation in electrical dc distribution networks using a stochastic mixed-integer lp model, ” Arabian Journal for Science and Engineering , 2024. [22] A. Hassanzadeh, P . Moghari, R. Mohammadi Chabanloo, and H. T orka- maiazn, “Renewable distributed generation allocation in radial distribu- tion networks for techno-economic enhancement, ” Renewable Energy , 2025. [23] S. M. R. H. Shawon, X. Liang, and M. Janbakhsh, “Optimal placement of distrib uted generation units for microgrid planning in distribution networks, ” IEEE Tr ansactions on Industry Applications , vol. 59, no. 3, pp. 2785–2795, 2023. 8 [24] S. Das, O. B. Fosso, and G. Marafioti, “Probabilistic planning of distribution networks with optimal dg placement under uncertainties, ” IEEE T ransactions on Industry Applications , vol. 59, no. 3, pp. 2731– 2741, 2023. [25] S. A. Adegoke, Y . Sun, A. S. Adegoke, and D. Ojeniyi, “Optimal placement of distributed generation to minimize power loss and improve voltage stability , ” Heliyon , vol. 10, no. 21, p. e39298, 2024. [26] K. Bestuzhev a, A. Chmiela, B. M ¨ uller , F . Serrano, and S. Vigersk e, “Global optimization of mixed-integer nonlinear programs with scip 8, ” Journal of Global Optimization , vol. 91, p. 287–310, 2025. [27] O. D. Montoya, L. F . Grisales-Nore ˜ na, and O. D. Florez-Cediel, “Exact mixed-integer nonlinear programming formulation for conductor size selection in balanced distribution networks: Single and multi-objective analyses, ” Electricity , vol. 6, no. 1, p. 14, 2025. [28] H. Li and L. Li, “Bilevel planning of distrib ution networks with distributed generation and energy storage: A case study on the modified ieee 33-bus system, ” Energy Engineering , vol. 122, no. 4, pp. 1337– 1358, 2025. [29] R. A. Lone, S. J. Iqbal, and A. S. Anees, “Optimal location and sizing of distributed generation for distribution systems: An improved analytical technique, ” International Journal of Green Energy , vol. 21, no. 3, pp. 682–700, 2024. [30] S. Prakash, V . Rangta, N. Jayalakshmi, and V . Kumar Jadoun, “Optimal location of dgs in a distribution system for maintaining voltage profile and loss reduction using genetic algorithm, ” in 2020 International Confer ence on P ower Electronics & IoT Applications in Renewable Ener gy and its Contr ol (P ARC) , pp. 59–64, 2020. [31] A. Selim, S. Kamel, A. A. Mohamed, and J. Y u, “Placement and sizing of distributed generations and shunt capacitors in radial distribution sys- tems using hybrid optimization technique, ” Electric P ower Components and Systems , vol. 51, no. 5, pp. 421–437, 2023. [32] C. H. P ., K. Subbaramaiah, and P . Sujatha, “Optimal dg unit placement in distribution networks by multi-objecti ve whale optimization algorithm & its techno-economic analysis, ” Electric P ower Systems Resear ch , vol. 214, p. 108869, 2023. [33] K. Mahmoud, N. Y orino, and A. Ahmed, “Optimal distributed gener- ation allocation in distrib ution systems for loss minimization, ” IEEE T ransactions on P ower Systems , vol. 31, no. 2, pp. 960–969, 2016. [34] G. Memarzadeh, M. Arabzadeh, and F . Keynia, “ A new optimal allo- cation of dgs in distribution networks by using coot bird optimization method, ” Energy Informatics , vol. 6, no. 1, p. 30, 2023. [35] M. R. Elkadeem, M. Abd Elaziz, Z. Ullah, S. W ang, and S. W . Sharshir, “Optimal planning of renewable energy-integrated distribution system considering uncertainties, ” IEEE Access , vol. 7, pp. 164887–164907, 2019.
Original Paper
Loading high-quality paper...
Comments & Academic Discussion
Loading comments...
Leave a Comment