Color-based Emotion Representation for Speech Emotion Recognition
Speech emotion recognition (SER) has traditionally relied on categorical or dimensional labels. However, this technique is limited in representing both the diversity and interpretability of emotions. To overcome this limitation, we focus on color att…
Authors: Ryotaro Nagase, Ryoichi Takashima, Yoichi Yamashita
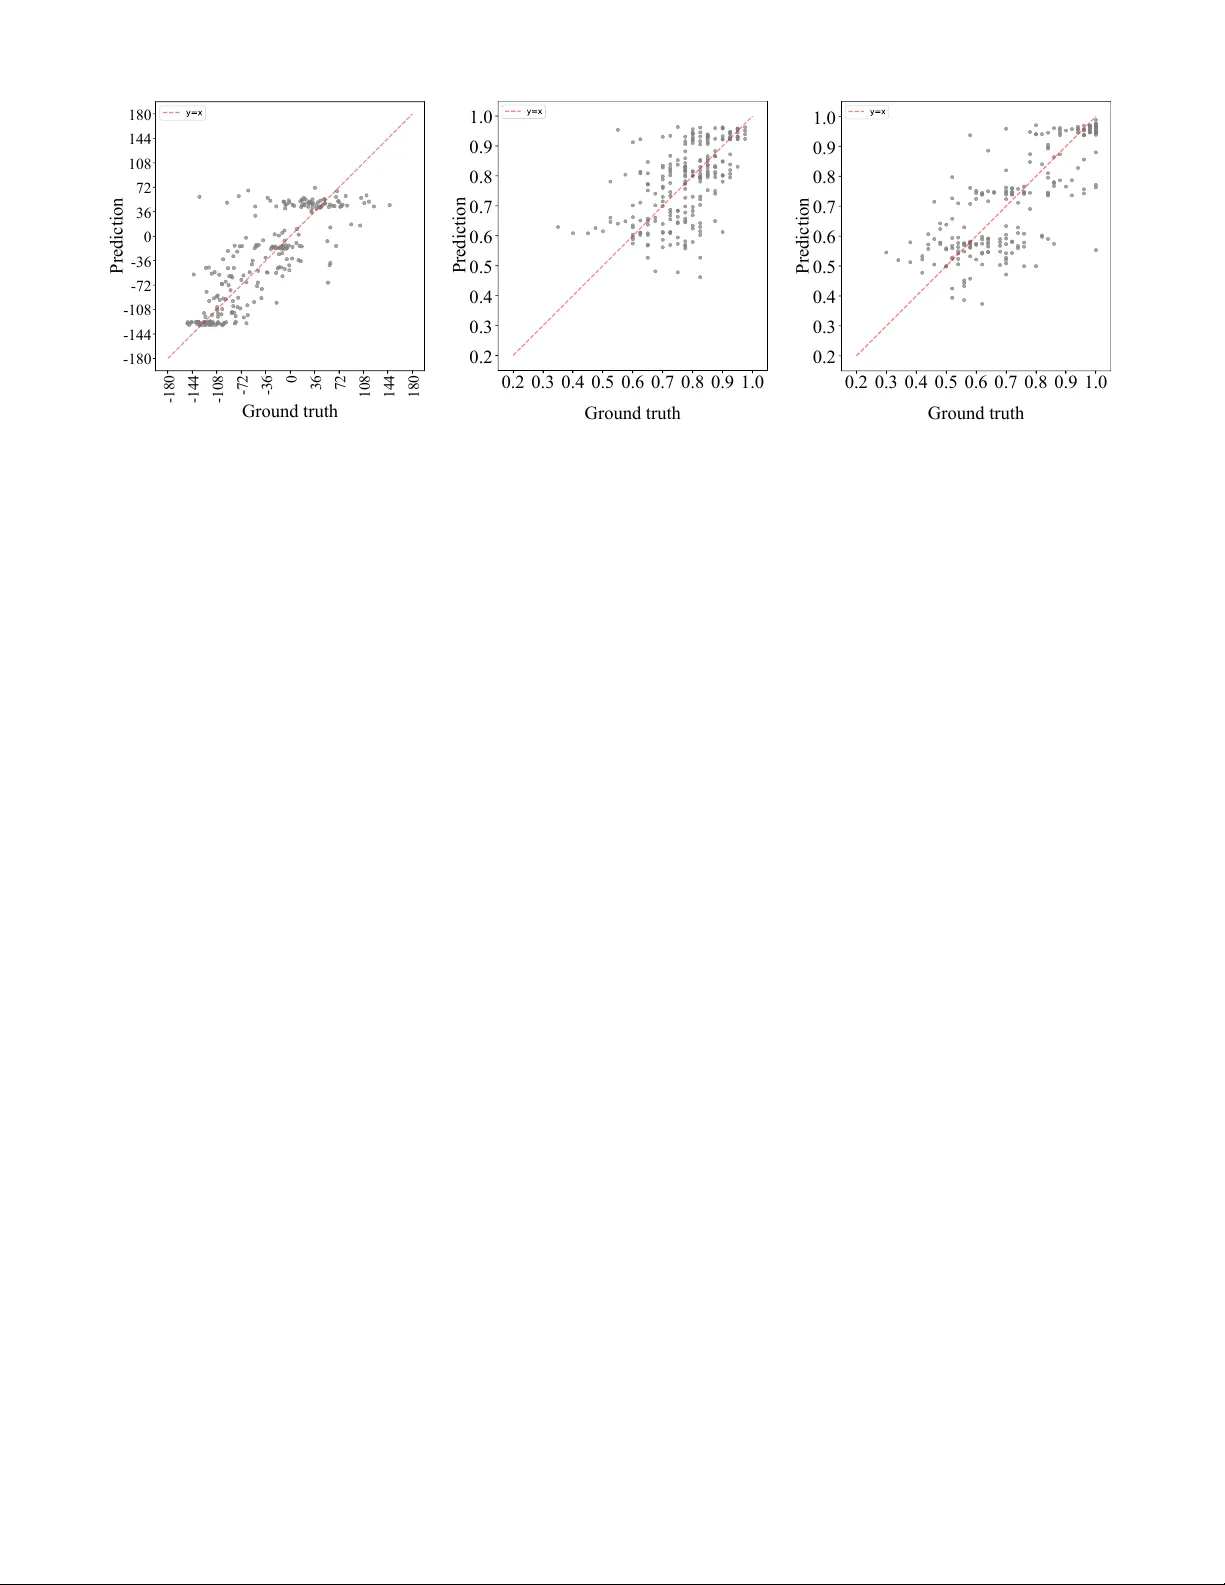
Color -based Emotion Representation for Speech Emotion Recognition Ryotaro Nagase, Ryoichi T akashima, Y oichi Y amashita College of Information Science and Engineering, Ritsumeikan Uni versity Osaka, Japan Email: { rnagase, rtaka } @fc.ritsumei.ac.jp, yyama@is.ritsumei.ac.jp Abstract —Speech emotion r ecognition (SER) has traditionally relied on categorical or dimensional labels. Howe ver , this tech- nique is limited in repr esenting both the diversity and inter - pretability of emotions. T o overcome this limitation, we f ocus on color attributes, such as hue, saturation, and value, to represent emotions as continuous and interpr etable scores. W e annotated an emotional speech cor pus with color attrib utes via cr owdsourcing and analyzed them. Moreover , we built regression models f or color attrib utes in SER using machine lear ning and deep learning, and explor ed the multitask learning of color attribute regression and emotion classification. As a result, we demonstrated the relationship between color attributes and emotions in speech, and successfully developed color attribute regression models for SER. W e also showed that multitask learning impro ved the performance of each task. Index T erms —speech emotion r ecognition, color attribute r e- gression, machine learning, deep learning, multitask lear ning I . I N T RO D U C T I O N Emotions in speech provide crucial cues that support human communication. In recent years, social interest has grown in improving the quality of online communication and in addressing customer abuse. Along with this trend, speech emotion recognition (SER) has attracted considerable atten- tion. The SER technique predicts emotions con ve yed through speech. It has been applied in various domains, including the dev elopment of conv ersational agents [1] and social robots [2], the analysis of call center con versations [3] and counseling sessions [4], and the design of e-learning systems [5]. In general, conv entional methods of SER are usually di- vided into two types: categorical and dimensional approaches. Howe ver , these frameworks hav e limitations in representing both the div ersity and interpretability of emotions. Categor- ical emotion recognition predicts discrete emotions, such as happiness, anger, and sadness [6], [7]. These methods are easy to understand but cannot describe mixed or unclear emo- tions because they require predefined classes during training and inference. In contrast, dimensional emotion recognition predicts continuous scores, such as valence, arousal, and dominance [8], [9]. Although they can capture more subtle differences, their interpretation is not straightforw ard and often requires domain-specific kno wledge. T o address these limitations, we propose a color-based SER framew ork, which provides both intuitiv e understanding and quantitativ e representation. Color is not only defined by nu- merical attributes such as hue, saturation, and value, b ut is also (ii) Saturation and value (i) Hue Y our chosen color [T ranscription] audio XXX Fig. 1: Interf ace for annotating color attrib utes visually intuitiv e. Therefore, this framew ork is expected to be particularly useful in scenarios that require the intuiti ve visu- alization of emotions, such as counseling or e-learning. As an initial step, in this study , we focused on acted emotional speech in Japanese, and we added emotion labels represented as color attributes to an existing dataset that contained only categorical emotion labels. W e analyzed this dataset and demonstrated the relationship between categorical emotions and color attributes, such as hue, saturation, and value. W e also showed that a color-based SER model can be trained with the same model architectures used in con ventional categorical SER. Further- more, we conducted the multitask learning of color attribute regression and emotion classification, and demonstrated the complementary relationship between categorical emotions and color attributes. The contributions of this work are as follows: • W e demonstrate the relationship between emotions in speech and color attributes. • W e present the first SER frame work that represents emo- tions with color attributes and directly predicts them from speech. I I . P RO C E D U R E F O R A N N OTA T I N G E M O T I O N S W I T H C O L O R A T T R I B U T E S W e annotated emotional speech with color attributes, namely hue, saturation, and value. Hue represents the type of color ranging from 0 ◦ to 360 ◦ , where 0 ◦ corresponds to red, 120 ◦ to green, 240 ◦ to blue, and 360 ◦ to red again. Saturation represents the vividness of a color ranging from 0% to 100% . Lower values correspond to grayish colors, whereas higher values indicate more vivid colors. V alue represents the bright- ness of a color ranging from 0% to 100% , where 0% is black, Hap 90° 45° 0° 180° 270° 135° 315° 225° Fea 90° 45° 0° 180° 270° 135° 315° 225° Sur 90° 45° 0° 180° 270° 135° 315° 225° Sad 90° 45° 0° 180° 270° 135° 315° 225° Dis 90° 45° 0° 180° 270° 135° 315° 225° Ang 90° 45° 0° 180° 270° 135° 315° 225° Color circle 90° 45° 0° 180° 270° 135° 315° 225° Fig. 2: Histogram of hue label frequencies per emotion and with increasing value, the color becomes brighter . The annotation was conducted through crowdsourcing. Annotators used the interface shown in Fig. 1. They were not given any examples of correspondences between emotional speech and color attributes, and the y selected the color on the basis of their own judgment. After listening to the speech, they were instructed to “select the hue that best represents the emotion con veyed by the speech. ” The hue was divided into 20 options at 18 ◦ intervals, presented as tiles shown in Fig. 1(i). Then, annotators were instructed to “select the saturation and value that best represent the emotion con veyed by the speech. ” W e provided an interface for them to select saturation and v alue simultaneously shown in Fig. 1(ii), a design choice based on the findings that these two attributes mutually influence each other . For e xample, the Helmholtz–K ohlrausch ef fect [10] indicates that as saturation increases, value is perceiv ed as higher , whereas the Hunt effect [11] indicates that as value increases, saturation is percei ved as higher . Saturation was divided into interv als of 25% up to 100% , and value into intervals of 20% up to 100% . W e prepared 26 tile-shaped options, 25 arranged in a 5 × 5 grid, and one additional option representing 0% value. Annotators could confirm the final choice of color under the label “Y our chosen color . ” They were also allowed to modify their selection until they were satisfied. I I I . C O L L E C T I O N A N D A N A L Y S I S O F E M OT I O N S W I T H C O L O R AT T R I BU T E S A. Emotional speec h dataset annotated with color attributes In this study , we used the Japanese emotional speech corpus with verbal content and nonv erbal vocalizations (JVNV) [12]. This dataset contains Japanese emotional utterances, including non verbal vocalizations such as laughter , sobs, and screams. The corpus was recorded by four professional actors in two sessions. In the Regular session, they produced verbal and non verbal utterances designed by the corpus creators, whereas in the Phrase-free session, they produced utterances, including non verbal vocalizations of their own design. Each utterance belongs to one of the six categorical emotions, i.e., anger (Ang), disgust (Dis), fear (Fea), happiness (Hap), sadness (Sad), and surprise (Sur). The corpus contains a total of 1,615 utterances, consisting of 249 anger , 258 disgust, 265 fear , 280 happiness, 257 sadness, and 306 surprise samples. W e collected labels of color attrib utes from 10 annotators per utterance through the Japanese crowdsourcing platform Lancers , follo wing the procedure described in Section II. After the collection, we av eraged hue, saturation, and value and assigned them as the final labels for each utterance. B. Analysis of collected color attributes with categorical emo- tions 1) Hue: Since hue is angular , we ev aluated the inter- annotator agreement on hue using the circular standard de- viation σ circ , as defined in Eq. (1), where ln is the natural logarithm, R is the mean resultant length defined in Eq. (2), θ rad i is the hue angle in radians of the i -th annotator , and N is the number of annotators. σ circ = √ − 2 ln R (1) R = v u u t 1 N N X i =1 cos θ rad i ! 2 + 1 N N X i =1 sin θ rad i ! 2 (2) The circular standard deviation av eraged across utterances was 57 . 3 ◦ , indicating that annotations tended to cluster within similar hues, such as red-orange or blue-purple. W e also calculated a circular mean as a final label, as defined in Eq. (3). ¯ θ = arctan2 1 N N X i =1 sin θ rad i , 1 N N X i =1 cos θ rad i ! (3) The color circle and circular histogram of hue labels for each emotion are shown in Fig. 2. As the number of utterances assinged the same score increases, the connected line segments become longer . Each point is colored according to its hue label, and the dashed line indicates the mean hue for each categorical emotion. The mean hue is determined to be 46 ◦ for happy , 275 ◦ for fear , 48 ◦ for surprise, 242 ◦ for sadness, 296 ◦ for disgust, and 343 ◦ for anger . Fig. 2 illustrates that points cluster at certain angles, with fewer points in the opposite directions across all categorical emotions. Since JVNV consists of speech performed by pro- fessional actors, the hue labels tend to be more consistently matched across utterances. According to the hue distribution, happiness and surprise cluster around 45 ◦ , corresponding to yellow , orange, and yellow-green. Anger clusters around 0 ◦ , with a mean hue near 340 ◦ , corresponding to reddish-purple. Fear , sadness, and disgust cluster around 270 ◦ , corresponding to blue and purple, with distinct mean directions. These results suggest that hue distributions tend to differ across emotions, and that these color attributes may provide additional cues for training an emotion classifier . Emotion Hap Fea Sur Sad Dis Ang Saturation 100 80 60 40 20 0 Fig. 3: Distrib ution of saturation label per emotion Emotion Hap Fea Sur Sad Dis Ang V alue 100 80 60 40 20 0 Fig. 4: Distrib ution of v alue label per emotion 2) Saturation: W e e valuated the inter-annotator agreement on saturation using the con ventional standard deviation. The standard deviation av eraged across utterances was 21 . 9% , indicating that the annotations were generally consistent. Fig. 3 shows the distribution of saturation labels for each emotion. Each point is colored according to its saturation label. From the figure, it can also be observed that the saturation of happiness, surprise and anger , which are considered high- arousal emotions, tends to be higher than about 60% . In contrast, fear, sadness, and disgust, which are considered low- arousal emotions, are widely distributed between 20% and 100% . These results suggest that the distribution of saturation labels aligns with the arousal axis. 3) V alue: W e e valuated the inter-annotator agreement on value as in Section III-B2. The standard deviation av eraged across utterances was 14 . 6% , indicating that the annotations were generally consistent as well. Fig. 4 shows the distribution of value labels for each emotion. Each point is colored accord- ing to its value label. From the figure, it can also be observed that happiness and surprise are concentrated between 80% and 100% . In contrast, value labels of anger are distributed between 50% and 100% , and those of fear , sadness, and disgust are distributed between 20% and 100% . These results indicate that positive emotions tend to have higher values, whereas negati ve emotions tend to have lower values. All final labels for saturation and value are above 20% . Because color changes are dif ficult to percei ve at lo w satura- tion and value, it is possible that annotators selected such low scores less frequently to represent emotions. I V . C O L O R A T T R I B U T E R E G R E S S I O N F O R S E R A. Experimental setup In this study , we conducted two experiments. In Exper- iment 1, we compared the performance of color attribute regression between support vector regression (SVR) and deep neural network (DNN) models to determine whether color attributes representing emotions can be predicted from speech. In Experiment 2, we performed the multitask learning of color attribute regression and categorical emotion classification to analyze the relationship between the two tasks. 1) Dataset: For the training of regression models, we used the JVNV dataset annotated with color attributes. W e per- formed lea ve-one-speaker-out cross-validation. The Regular session provided training data, whereas the Phrase-free session was conducted for validation and ev aluation without speaker CNN Layers ❄ T ransformer blocks 🔥 HuBERT W aveform Linear 🔥 (Regression) 3 color attributes Hue Saturation V alue or or or Feature extract (ConParE2016/HuBER T embedding) W aveform SVR (a) SVR- and DNN-based color attribute regression CNN Layers ❄ T ransformer blocks 🔥 HuBERT W aveform Linear 🔥 (Classification) Linear 🔥 (Regression) 3 color attributes 6 emotions (b) Multitask learning of color attribute regression and categorical emotion recognition Fig. 5: Outline of the models used in Experiments 1 and 2 ov erlap. The training data were augmented to five times their original size through speed perturbation with factors ranging from 0.9 to 1.1 in steps of 0.05, following pre vious SER methods [13], [14]. 2) Models and metrics: In Experiment 1, we built two models, which were a SVR model and a DNN sho wn in Fig. 5a. The acoustic features used for the SVR model are ComParE2016 [15] and embeddings from a Japanese pre- trained HuBER T model 1 provided by Hugging Face [16]. Since previous studies suggested that intermediate layers from the self-supervised learning (SSL) model are effecti ve for SER [17], [18], we used the outputs of the 6th, 9th, and 12th layers. When the SSL model outputs were input into the SVR model, the features were con verted into fixed-length utterance- lev el vectors by temporal average pooling. The kernel was set to the radial basis function, and other hyperparameters were selected via grid search on the validation data. W e constructed SVR models independently for each of the color attributes, which are hue, saturation, and value. Since hue is an angular variable, we trained separate regressors for sine and cosine components, and reconstructed the hue angle using the arctan 2 function. During DNN training, we combined the pretrained HuBER T model with a regression head consisting of two fully connected layers. In the HuBER T model, the parameters of the CNN layers were fixed, and only those of the 1 https://huggingface.co/yky-h/japanese-hubert-base T ransformer blocks were updated, follo wing pre vious studies on SER [19], [20]. W e constructed models to predict color attributes individually as well as jointly . Note that hue was represented by its sine and cosine components. The number of epochs was 20, the batch size was 16, and the learning rate was 1 × 10 − 5 . W e used AdamW [21] as the optimizer with a linear scheduler . The loss function w as the concordance correlation coefficient (CCC) loss L CCCL in Eq. (4), where ρ denotes the Pearson correlation coef ficient (PCC), µ y and µ ˆ y the means of the ground truth y and the prediction ˆ y , respecti vely , and σ 2 y and σ 2 ˆ y their variances. The CCC loss is widely used in dimensional emotion recognition [8], [9], [20]. It maximizes the correlation coefficient that accounts for the means and variances of the ground truth and prediction. L CCCL = 1 − 2 ρσ y σ ˆ y σ 2 y + σ 2 ˆ y + ( µ y − µ ˆ y ) 2 (4) In Experiment 2, we used the DNN architecture shown in Fig. 5b to perform the multitask learning of color attribute regression and six-categorical-emotion classification. The final loss function L all is defined in Eq. (5), where L CE denotes the cross-entropy loss for categorical emotion classification and α is a weighting coef ficient. α was v aried from 0.6 to 1.0 in steps of 0.1. At α = 1 . 0 , the model was trained only on categorical emotion classification. L all = (1 − α ) L CCCL + α L CE (5) W e ev aluated hue regression using the angular error (AE) in Eq. (6), defined as the mean absolute difference between the predicted and ground-truth hues. AE = min( | y − ˆ y | , 360 ◦ − | y − ˆ y | ) (6) W e also e valuated saturation and v alue re gression using PCC and CCC, and six-class categorical emotion classification using accuracy . B. Experiment 1: Comparison of color attribute r egr ession r esults T able I sho ws the performance of hue, saturation, and value regression with the SVR and DNN models. Note that “Settings” correspond to input features for SVR and training methods for DNN. For the SVR models, HuBER T embed- dings, particularly those from intermediate layers, achiev ed a higher CCC than the traditional feature set. In particular , the AE with HuBER T embeddings of the 6th layer impro ved by 10 . 4 ◦ compared with that with ComParE2016. These results indicate that SSL features are effecti ve for color attribute regression, which is consistent with previous findings [17], [18]. For the DNN models, the performance of the indi vidually trained models was slightly higher than that of the jointly trained model. This result suggests that each color attribute is relativ ely independent, making simultaneous learning more difficult than single-task learning. Comparing SVR and DNN models, SVR achiev ed a lower AE, whereas DNN achieved a higher CCC for saturation and value. In addition, the gap between PCC and CCC was smaller for DNN than for SVR. T ABLE I: Results of color attribute regression with SVR and DNN models Setting Hue Saturation V alue AE ↓ PCC ↑ CCC ↑ PCC ↑ CCC ↑ SVR models ComParE2016 41 . 7 0 . 564 0 . 325 0 . 699 0 . 480 HuBER T embeddings L = 6 35 . 1 0 . 549 0 . 370 0 . 755 0 . 565 L = 9 31 . 3 0 . 580 0 . 403 0 . 788 0 . 658 L = 12 35 . 1 0 . 584 0 . 383 0 . 729 0 . 553 DNN models Individual training 34 . 6 0 . 588 0 . 533 0 . 809 0 . 794 Joint training 35 . 3 0 . 483 0 . 466 0 . 793 0 . 771 T ABLE II: Results of multitask learning of color attribute regression and categorical emotion classification α Hue Saturation V alue Accuracy ↑ (6 emotion cls.) AE ↓ PCC ↑ CCC ↑ PCC ↑ CCC ↑ 0.6 32 . 7 0 . 445 0 . 406 0 . 776 0 . 753 83 . 8 0.7 31 . 2 0 . 500 0 . 463 0 . 796 0 . 784 85 . 8 0.8 30 . 1 0 . 522 0 . 504 0 . 821 0 . 810 88 . 3 0.9 29 . 7 0 . 580 0 . 560 0 . 814 0 . 803 90 . 8 1.0 - - - - - 88 . 3 These differences are likely due to the fact that CCC was directly optimized. Overall, the lo west angular error of hue was 31 . 3 ◦ . This result indicates that predictions remained within similar hue scores rather than across distant ones. The maximum CCCs were 0 . 533 for saturation and 0 . 794 for value. This result suggests that both saturation and v alue can be predicted from speech to some extent. C. Experiment 2: Multitask learning of color attribute re gr es- sion and emotion classification T able II shows the results of multitask learning for color attribute regression and emotion classification with different α values. As α increased, the CCC of color attrib ute regression improv ed. Compared with the regression-only model as sho wn in T able I, the multitask learning of regression and classifica- tion improved performance by 1 . 6 ◦ in hue AE, 0.027 points in saturation CCC, and 0.016 points in v alue CCC at α = 0 . 9 . In addition, the accuracy with multitask learning at α = 0 . 9 was 2.5 points higher than that at α = 1 . 0 . Specifically , the multitask setting reduced the number of classification errors from sadness to fear and from anger to surprise compared with the classification-only setting. These emotion pairs also differed in mean hue angle. The results demonstrate that color attribute regression and emotion classification are mutually effecti ve auxiliary tasks. The prediction results for hue, saturation, and value by multitask learning at α = 0 . 9 are shown in Figs. 6– 8. Note that the horizontal axis is the ground truth score, the v ertical axis is the predicted score, and the red dashed line is the ideal score. The scores of hue are sho wn in the range of -180 ◦ to 180 ◦ , and those of saturation and value are shown in the range of 0.2 to 1.0. In Fig. 6, utterances in happiness and surprise 180 144 108 36 0 -36 -72 -108 -180 72 -144 -180 -144 -108 -72 -36 0 36 72 108 144 180 Ground truth Prediction Fig. 6: Prediction result for hue Ground truth 0.2 0.3 0.4 0.5 0.6 0.7 0.8 0.9 1.0 Prediction 1.0 0.9 0.8 0.7 0.6 0.5 0.4 0.3 0.2 Fig. 7: Prediction result for saturation Ground truth 0.2 0.3 0.4 0.5 0.6 0.7 0.8 0.9 1.0 Prediction 1.0 0.9 0.8 0.7 0.6 0.5 0.4 0.3 0.2 Fig. 8: Prediction result for value are clustered in the range from 36 ◦ to 72 ◦ , whereas utterances of sadness and fear are distributed between − 144 ◦ and − 108 ◦ . In Fig. 7, most predictions are located above 0.5 and are generally consistent with the ideal scores. In Fig. 8, utterances in fear, sadness, and disgust were distributed between 0.5 and 0.6, those in anger between 0.7 and 0.8, and those in happiness and surprise between 0.9 and 1.0. These results follow the distributions of hue, saturation, and value labels, and demonstrate that the model trained with the proposed framew ork can predict each color attribute from speech. V . C O N C L U S I O N In this paper , we proposed a nov el color-based emotion representation and clarified its relationship to categorical emo- tions. W e also realized a new SER framework that directly predicts emotions as color attributes from speech. Moreover , we demonstrate that the multitask learning of color attribute regression and emotion classification has improv ed the per- formance in both tasks. In future work, we will explore the effecti veness of the color-based emotion representation on other types of data, such as spontaneous speech and English speech. R E F E R E N C E S [1] J. Hu, Y . Huang, X. Hu, and Y . Xu, “The acoustically emotion-aware con versational agent with speech emotion recognition and empathetic responses, ” IEEE T ransactions on Affective Computing , vol. 14, no. 1, pp. 17–30, Jan 2023. [2] J.-S. Park, J.-H. Kim, and Y .-H. Oh, “Feature vector classification based speech emotion recognition for service robots, ” IEEE T ransactions on Consumer Electr onics , vol. 55, no. 3, pp. 1590–1596, August 2009. [3] M. Macary , M. T ahon, Y . Est ` eve, and A. Rousseau, “ AlloSat: A new call center French corpus for satisfaction and frustration analysis, ” in Proceedings of the T welfth Language Resources and Evaluation Confer ence , May 2020, pp. 1590–1597. [4] D. T ao, T . Lee, H. Chui, and S. Luk, “Modeling intrapersonal and interpersonal influences for automatic estimation of therapist empathy in counseling conv ersation, ” in ICASSP 2024 - 2024 IEEE International Confer ence on Acoustics, Speech and Signal Pr ocessing (ICASSP) , April 2024, pp. 12692–12696. [5] W . Li, Y . Zhang, and Y . Fu, “Speech emotion recognition in e-learning system based on af fective computing, ” in Thir d International Conference on Natural Computation (ICNC 2007) , Aug 2007, vol. 5, pp. 809–813. [6] Z. Ma et al., “emotion2vec: Self-supervised pre-training for speech emo- tion representation, ” in Findings of the Association for Computational Linguistics: ACL 2024 , Aug. 2024, pp. 15747–15760. [7] Z. Ma et al., “EmoBox: Multilingual Multi-corpus Speech Emotion Recognition T oolkit and Benchmark, ” in INTERSPEECH 2024 – 25th Annual Confer ence of the International Speech Communication Association (INTERSPEECH) , 2024, pp. 1580–1584. [8] B. Vlasenko, S. Vyas, and M. Magimai.-Doss, “Comparing data- driv en and handcrafted features for dimensional emotion recognition, ” in ICASSP 2024 - 2024 IEEE International Conference on Acoustics, Speech and Signal Processing (ICASSP) , 2024, pp. 11841–11845. [9] A. Sampath, J. T av ernor, and E. M. Prov ost, “Efficient finetuning for dimensional speech emotion recognition in the age of transformers, ” in ICASSP 2025 - 2025 IEEE International Conference on Acoustics, Speech and Signal Processing (ICASSP) , April 2025, pp. 1–5. [10] R. L. Donofrio, “Re view paper: The helmholtz-kohlrausch effect, ” Journal of the Society for Information Display , vol. 19, no. 10, pp. 658–664, 2011. [11] R. W . G. Hunt, “Light and dark adaptation and the perception of color, ” Journal of the Optical Society of America , vol. 42, no. 3, pp. 190–199, Mar 1952. [12] D. Xin, J. Jiang, S. T akamichi, Y . Saito, A. Aizawa, and H. Saruwatari, “Jvn v: A corpus of japanese emotional speech with verbal content and non verbal expressions, ” IEEE Access , vol. 12, pp. 19752–19764, 2024. [13] Z. Aldeneh and E. M. Prov ost, “Using regional saliency for speech emotion recognition, ” in 2017 IEEE International Conference on Acoustics, Speec h and Signal Pr ocessing (ICASSP) , March 2017, pp. 2741–2745. [14] B. T . Atmaja and A. Sasou, “Effects of data augmentations on speech emotion recognition, ” Sensor s , vol. 22, no. 16, 2022. [15] B. Schuller et al., “The interspeech 2016 computational paralinguistics challenge: Deception, sincerity & native language, ” in INTERSPEECH 2016 – 17th Annual Conference of the International Speech Communi- cation Association (INTERSPEECH) , 2016, pp. 2001–2005. [16] T . W olf et al., “Transformers: State-of-the-art natural language process- ing, ” in Proceedings of the 2020 Conference on Empirical Methods in Natural Language Pr ocessing: System Demonstrations , Oct. 2020, pp. 38–45. [17] A. Saliba, Y . Li, R. Sanabria, and C. Lai, “Layer-wise analysis of self-supervised acoustic word embeddings: A study on speech emotion recognition, ” in 2024 IEEE International Conference on Acoustics, Speech, and Signal Pr ocessing W orkshops (ICASSPW) , April 2024, pp. 590–594. [18] W . Chen, X. Xing, P . Chen, and X. Xu, “V esper: A compact and ef fective pretrained model for speech emotion recognition, ” IEEE T ransactions on Affective Computing , vol. 15, no. 3, pp. 1711–1724, July 2024. [19] Y . W ang, A. Boumadane, and A. Heba, “ A fine-tuned wav2vec 2.0/hu- bert benchmark for speech emotion recognition, speaker verification and spoken language understanding, ” arXiv preprint , 2021. [20] J. W agner et al., “Dawn of the transformer era in speech emotion recognition: Closing the valence gap, ” IEEE T r ansactions on P attern Analysis and Machine Intellig ence , vol. 45, no. 9, pp. 10745–10759, Sep. 2023. [21] I. Loshchilov and F . Hutter , “Decoupled weight decay regularization, ” in International Conference on Learning Representations , 2017.
Original Paper
Loading high-quality paper...
Comments & Academic Discussion
Loading comments...
Leave a Comment