Phase Transitions in Collective Damage of Civil Structures under Natural Hazards
The fate of cities under natural hazards depends not only on hazard intensity but also on the coupling of structural damage, a collective process that remains poorly understood. Here we show that urban structural damage exhibits phase-transition phen…
Authors: ** (논문에 명시된 저자 정보가 제공되지 않아 확인 불가) **
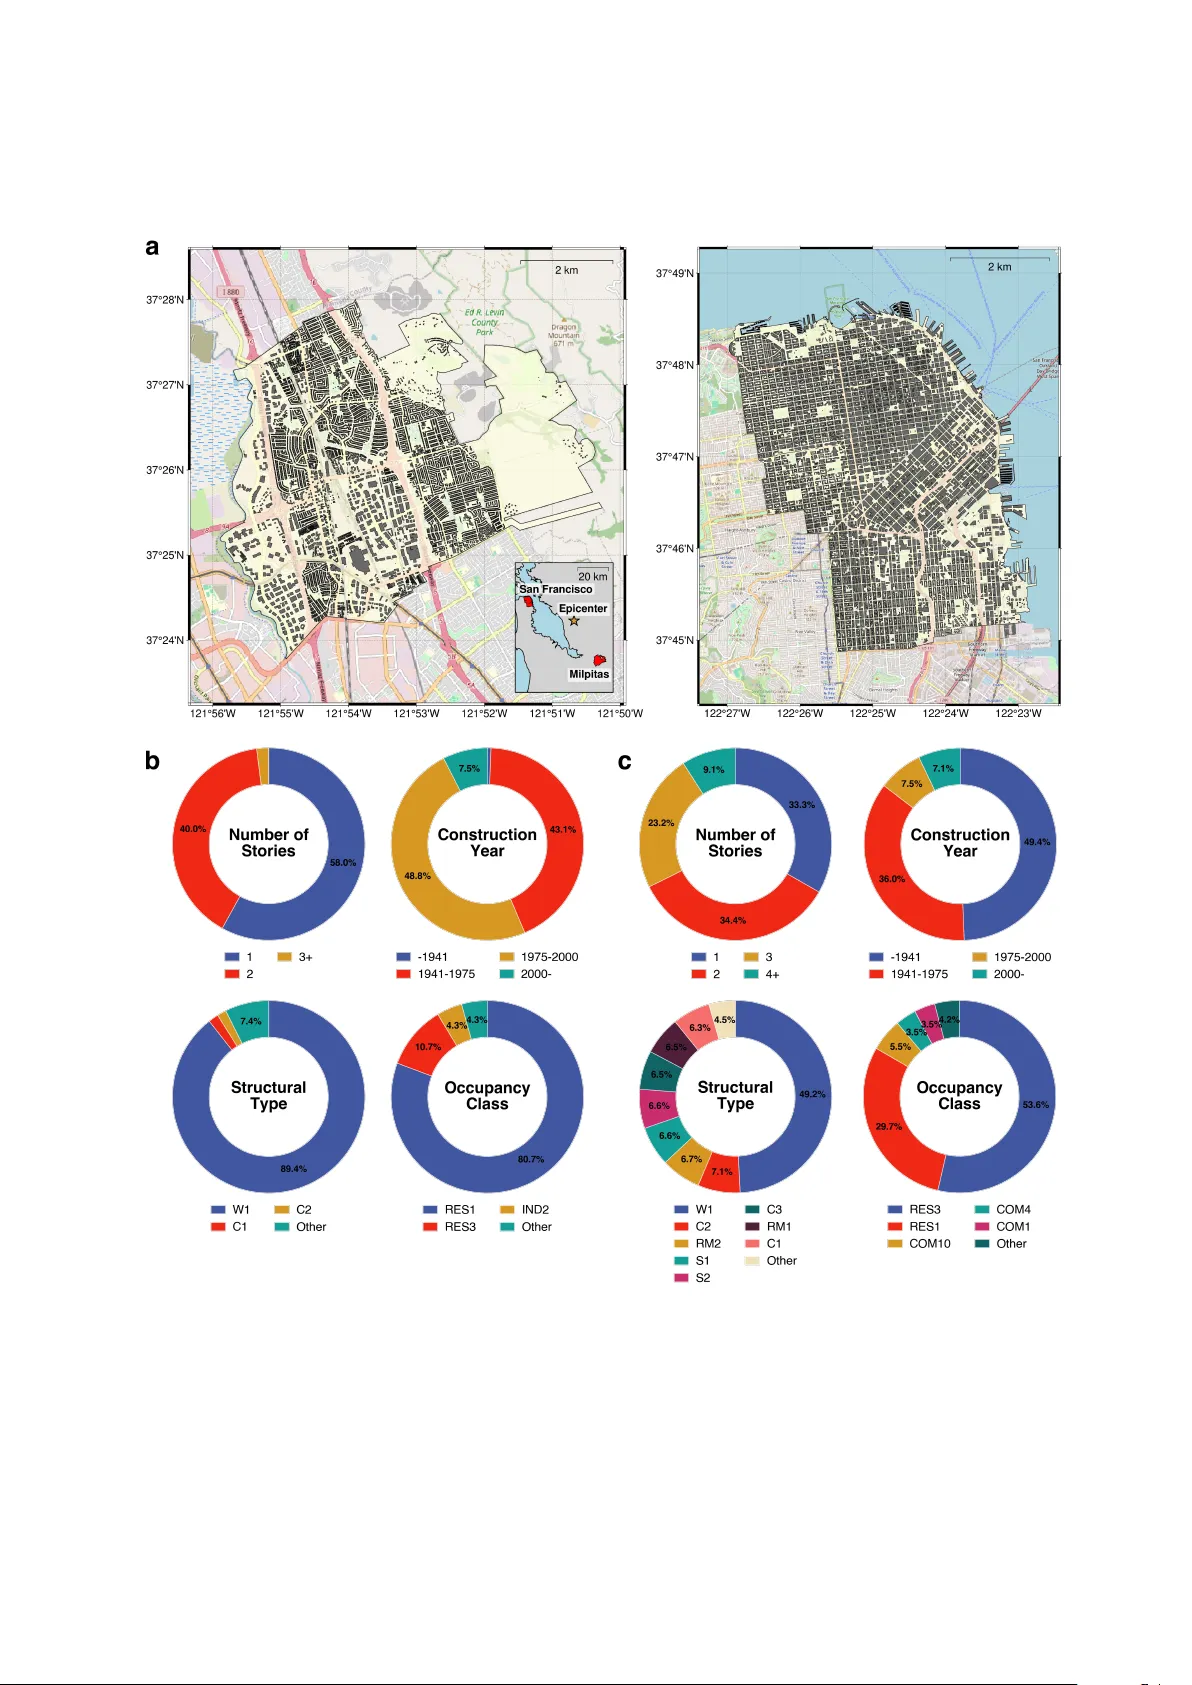
Phase T ransitions in Collectiv e Damage of Civil Structures under Natural Hazards Sebin Oh a , Jin yan Zhao b , Raul Rincon c , Jamie E. P adgett c , Ziqi W ang a, ∗ a Dep artment of Civil and Envir onmental Engine ering, University of California, Berkeley, CA, Unite d States of Americ a b Dep artment of Me chanic al and Civil Engine ering, California Institute of T e chnolo gy, Pasadena, CA, Unite d States of Americ a c Dep artment of Civil and Envir onmental Engine ering, Ric e University, Houston, TX, Unite d States of Americ a Abstract The fate of cities under natural hazards dep ends not only on hazard in tensity but also on the coupling of structural damage, a collective pro cess that remains p o orly understo o d. Here w e show that urban structural damage exhibits phase-transition phenomena. As hazard intensit y increases, the system can shift abruptly from a largely safe to a largely damaged state, analogous to a first-order phase transition in statistical physics. Higher div ersity in the building p ortfolio smo oths this transition, but multiscale damage clustering traps the system in an extended critical-like regime—analogous to a Griffiths phase—suppressing the emergence of a more predictable disordered (Gaussian) phase. These phenomenological patterns are c haracterized b y a random-field Ising mo del, with the external field, disorder strength, and temp erature in terpreted as the effectiv e hazard demand, structural div ersit y , and mo deling uncertaint y , resp ectively . Applying this framew ork to real urban inv en tories rev eals that widely used engineering mo deling practices can shift urban damage patterns b etw een synchronized and volatile regimes, systematically biasing exceedance-based risk metrics b y up to 50% under mo derate earthquak es ( M w ≈ 5 . 5 – 6 . 0 )—equiv alent to a sev eral-fold gap in repair costs. This phase-aw are description turns the collective b ehavior of civil infrastructure damage into actionable diagnostics for urban risk assessmen t and planning. Keywor ds: Natural hazards risk assessment, Phase transitions, Urban resilience 1. In tro duction Cities are increasingly exposed to natural hazards whose impacts extend far b eyond individual buildings. The 2023 Kahramanmaraş earthquakes ( M w 7.8 and 7.5) severely damaged ov er 280 , 000 buildings and displaced millions, causing losses exceeding US$34 billion [ 10 , 36 , 41 ]. Similarly , the 2024 Category 4 Hurricane ∗ Corresponding author Email addr ess: ziqiwang@berkeley.edu (Ziqi W ang) Helene unleashed catastrophic flo o ding across the southeastern United States, resulting in losses estimated at US$78.7 billion [ 5 , 27 ]. Suc h extensiv e impacts necessitate a mov e b ey ond parcel-lev el analysis tow ard regional assessmen ts that capture the emergence of collective vulnerabilities [ 6 , 26 , 30 , 31 , 39 ]. F acilitating this shift, rapid adv ances in computational mo deling and data av ailability ha ve enabled the prediction of regional disaster impacts at unpreceden ted gran ularity [ 25 , 38 , 49 ]. Fine-grained building in ven tories, ph ysics-based hazard mo dels, and field reconnaissance data can no w be integrated seamlessly in to probabilistic analysis framew orks that ev aluate hazard impacts at building-level resolution [ 3 , 9 , 46 , 49 ]. This has spurred a widespread focus on fidelity: improving model accuracy , refining comp onent-lev el ph ysics, and accelerating simulations [ 9 , 15 , 18 , 33 , 43 , 44 ], implicitly assuming that increasing lo cal precis ion automatically yields a b etter understanding of global resilience. Y et a fundamen tal question p ersists: ev en if every structure in a city could b e mo deled with absolute fidelit y , would the gov erning principles of urban resilience emerge? W e contend they would not. Bey ond the barriers of computational cost, the sheer granularit y of such an approach risks obscuring damage patterns b ehind a fog of detail. This mirrors the philosophy of statistical physics: the laws of thermo dynamics emerge not from tracking individual molecular tra jectories, but from iden tifying ho w micro-interactions organize in to macro-behavior [ 19 , 22 ]. Similarly , natural hazards engineering must transcend the pursuit of ever- finer resolution to uncov er the universal organizing principles of collective structural response—insights that brute-force, high-resolution sim ulation alone can never yield. Here we unco ver the underlying ph ysics that go verns collectiv e resp onses in city-scale building p ortfo- lios. Using large-scale nonlinear time-history analyses coupled with sto chastic and ph ysics-based earthquake mo dels, we identify t wo phase transitions in structural damage. First, in regions with low structural di- v ersity , the system exhibits a synchr onize d state , where regional damage can shift abruptly from largely safe to widespread failure, analogous to a first-order phase transition. Second, increasing diversit y do es not decouple the system in to a predictable Gaussian av erage; instead, the inherent spatial clustering of structures traps cities in an extended critical-like regime—analogous to a Griffiths phase. In this volatile state , engineering predictions become highly sensitive to modeling details, undermining their reliability . Con ven tional p ortfolio-level simplifications can inadverten tly toggle a cit y mo del b et ween sync hronized and v olatile regimes, introducing systematic bias in tail-risk metrics. Consequently , establishing b oth the v alidit y and fundamental limits of engineering predictions requires diagnosing these underlying regimes, calling for phase-awar eness in cit y-scale hazard risk assessment. 2 2. Collectiv e b ehavior in city-scale structural damage Milpitas, California, a residential city in the San F rancisco Ba y Area, serves as the study region, with earthquak es considered as the represen tative hazard for the city (Fig. 1 a). The analysis fo cuses on m ultistory buildings (t wo or more stories), which dominate regional seismic risk due to their greater vulnerability and damage consequences. Building-lev el data are in tegrated into m ulti–degree-of-freedom structural mo dels, whose nonlinear time-history analyses yield statistical distributions of structural capacities. These capacities are ev aluated against spatially correlated ground-motion fields to generate damage realizations, which are then aggregated in to ensembles of damage fractions (see Metho ds and Supplementary Note 1 .). As hazard intensit y increases, the resp onse shifts from a collectiv ely safe to a collectiv ely damaged state (Fig. 1 c). At low magnitudes, most buildings remain undamaged; at high magnitudes, nearly all are damaged. While this trend is expected, the abruptness of the transition is striking: around M w = 5 – 6 , the collectiv e state switches suddenly from safe to damaged. Within this range, the damage-fraction distributions b ecome bimo dal, peaking at the t w o extremes, indicating that the region tends to be either largely safe or largely damaged rather than partially so. This synchronization emerges under mo derate-in tensity hazards, where engineering decisions are most consequential yet most uncertain. Unlik e weak or extreme even ts, where appropriate actions are relatively straigh tforward (ignore or fully mobilize), mo derate even ts require calibrated preparedness, but their p olarized outcomes make such decisions inherently complex. Extended Data Figs. 1 and 2 sho w the results for the full building p ortfolio, including single-story buildings. Differen t cities may exhibit distinct collective b eha viors under similar hazard conditions. T o examine how the nature of the transition depends on the composition of the building p ortfolio, w e v ary structural diversit y systematically . Sp ecifically , we adjust the disp ersion in structural capacities to represent cities with different lev els of p ortfolio heterogeneity (Fig. 1 b). This heterogeneity is parameterized b y σ , which quan tifies the additional disp ersion in structural capacities across the region (see Metho ds ), with σ = 0 denoting the real- in ven tory baseline. This allows us to trace how the collective resp onse evolv es with increasing structural div ersity . A t high structural diversit y , the bimo dality observed at mo derate magnitudes ( M w = 5 . 6 in Fig. 1 d) is suppressed, smo othing the transition from collectively safe to collectiv ely damaged states (Extended Data Fig. 3 ). Synchronization v anishes around σ ≈ 0 . 5 , where the damage-fraction distribution flattens and collective damage b ecomes highly volatile. Notably , increasing diversit y do es not drive the system immediately into a fully disordered phase; instead, it remains in a volatile regime with p ersistently high v ariabilit y and non-Gaussian statistics. 3 T o map the collective response across a wide range of earthquake magnitudes and structural div ersities, we construct a heatmap of the most probable regional damage fraction (the mo de) (Fig. 2 b). T wo synchronized states emerge: a collectiv ely safe state (near-zero damage) and a collectiv ely damaged state (near-complete damage). At low σ , the transition b etw een them is sharp, mark ed b y a narrow phase-co existence band where the damage-fraction distribution is bimo dal. Beyond a critical diversit y σ c ≈ 0 . 5 , the transition smo oths into a broad volatile regime characterized b y high-v ariance, non-Gaussian statis tics. Analysis of the northeastern San F rancisco p ortfolio, which spans diverse districts and is therefore more heterogeneous, corrob orates this trend (Extended Data Figs. 2 and 4 ), demonstrating that greater heterogeneit y weak ens sync hronization and broadens the transition. Sp ecific quantitativ e details, such as the exact shap e of the transition b oundary or the extent of the v olatile regime, v ary with mo deling assumptions, but the core phenomenological features remain robust. Supplemen tary sensitivity analyses confirm that these collectiv e b eha viors consisten tly emerge across a sp ectrum of mo del fidelities, ranging from alternativ e probabilistic mo dels to physics-based sim ulations in volving finite-element analysis with seismic wa v e propagation (Supplementary Figs. 1 – 4 ). This consis- tency indicates that the observed regimes are not artifacts of sp ecific mo deling c hoices, but rather inheren t regularities go verning the interpla y b et ween hazards and structural systems. These observed shifts in collective b eha viors mirror phase transitions in ferromagnetic systems, where disorder mo dulates the abruptness of the transition. The resulting heatmap thus serves as an empirical phase diagram, motiv ating the statistical physics-based interpretation formalized in the next section. 4 Fig. 1: Collective structural responses and transition b ehavior in a city-scale building p ortfolio. a , Study region and building distribution. Milpitas (San F rancisco Ba y Area), near the mo deled earthquak e epicen ter (left). Lo cations of the 5 , 943 multistory buildings analyzed (righ t). b , F ragility curv es for the Milpitas portfolio (left) and a coun terpart with greater disp ersion in structural capacity (right), represen ting a city with higher structural div ersity . Here, σ quantifies additional heterogeneity in tro duced in structural capacity , with σ = 0 denoting the real-inven tory baseline. A fragility curve probabilistically defines structural capacit y in terms of p eak ground acceleration (PGA), expressed in units of gra vitational acceleration, g . c , Evolution of damage-fraction distributions with increasing earthquake magnitude at relatively low structural diversit y , showing a jump from a collectively safe to a collectively damaged state, indicative of a first-order transition. The color scale denotes o ccurrence frequency . Snapshots at M w = 4 . 5 , 5 . 6 , and 6 . 5 are shown b elow. At mo derate magnitudes ( M w ≈ 5 – 6 ), the distributions b ecome bimo dal, revealing bistable collective respon se. d , Evolution of the distributions with increasing structural diversit y at a moderate magnitude ( M w = 5 . 6 ). Greater diversit y smo oths the transition and suppresses bistability , yielding a contin uous transition to an extended critical-lik e state characterized by non-Gaussian statistics. The histograms below show snapshots at σ = 0 , 0 . 5 , and 1 . 0 . Markers (A) and (B) indicate the σ = 0 . 8 and 1 . 0 cases, resp ectively , mapp ed in panel e . e , Damage clustering at ( M w , σ ) = (5 . 6 , 0 . 8) and (5.6,1.0). Colors indicate damage density (low to high); areas without buildings are masked (gray). Damage states of buildings form clusters across multiple spatial scales, counteracting the homogenization exp ected under the Cen tral Limit Theorem. 5 3. Ising mo del interpretation for phase transitions Regional-scale hazard risk can be interpreted through the lens of the Ising mo del, where binary spins corresp ond to the damaged or undamaged states of civil structures and the magnetic field represen ts the effectiv e hazard demand [ 28 ]. W e cast spatial heterogeneit y among cities in the random-field Ising mo del (RFIM), whose Hamiltonian is H ( { s } ) = − X i ( H + h i ) s i − X i σ c , missing the subtle Griffiths-like b ehavior observ ed in real p ortfolios. While the precise top ology of the diagram v aries across urban configurations—for instance, cities with sk ewed or multimodal disorder distributions can pro duce asymmetric b oundaries or sequential transitions (Extended Data Figs. 1 and 2 )—the core physics remains universal. The framework captures the fundamental comp etition betw een co op erative coupling and local disorder, gov erning the shift betw een synchronized damage and v olatile fluctuations. 8 Fig. 2: Random-field Ising-mo del representation of collective structural damage transitions. a , In the random-field Ising mo del (RFIM) mapping, each building’s damage state is represented as a binary spin. The effectiv e hazard demand acts as an external field combining in trinsic safety bias and hazard-driv en excitation; in ter-building dep endency induces collective response. b , Damage-fraction phase diagram from regional simulations for Milpitas (left) and the RFIM-reconstruction (righ t). Color denotes damage fraction, and con tours indicate iso damage lev els. The reconstruction captures the distinct collective states, the phase-coexistence band, and the critical point (black circle). c , Mean-field free energy landscapes F ( m d ; M w , σ ) at σ = 0 (top) and M w = 5 . 6 (b ottom), where m d is the damage fraction. Increasing M w drives an abrupt switch betw een free- energy minima, whereas increasing σ flattens and merges the minima, conv erting a discontin uous transition into a contin uous crossov er. Pro jections pro vide an RFIM-based reconstruction of Figs. 1 c,d. d , Susceptibilit y p eak and broadened critical region. Near the critical magnitude M w c ≈ 5 . 6 , we compute susceptibility χ from 50 independent p ortfolio realizations at each σ (see Methods ) and summarize their distribution as a background heatmap. χ exhibits a pronounced but finite peak at σ c ≈ 0 . 5 . The depleted densit y (absence of yello w) o v er σ ∈ [0 . 3 , 0 . 6] indicates strong realization-to-realization v ariabilit y , consistent with a broadened critical regime (Griffiths-lik e b ehavior); in the volatile regime ( σ > σ c ), χ deca ys slowly , reflecting p ersistent sensitivity . e , Correlation-length p eak and persistence through the volatile regime. Using the same portfolio realizations, we estimate connected tw o-p oint correlations C ( r ) (see Metho ds ) and infer the correlation length ξ by fitting the deca y C ( r ) /C (0) ∝ e − r/ξ versus distance r (inset). The correlation length remains elev ated for σ > σ c , indicating persistent correlations across multiple spatial scales b eyond criticality . 9 4. Phase-a ware urban hazard risk assessment Despite recen t adv ances in regional-scale risk and resilience analysis for natural hazards, curren t engi- neering practices and design codes remain centered on individual structures, with limited consideration of their collectiv e b ehavior at the city scale. F or example, risk and loss assessment framew orks such as the Hazus Earthquake Mo del T e chnic al Manual , published by F ederal Emergency Managemen t Agency (FEMA), classify buildings by coarse categories such as structural type, material, and construction year, and then assign capacities by class [ 11 ]. While efficient, such coarse categorization can imp ose artificial homogeneity within eac h class and obscure the diversit y that gov erns the collectiv e resp onse [ 29 ]. Likewise, although spatial correlations of hazard intensities hav e long b een recognized and incorp orated into risk assessment guidelines [ 13 , 17 ], correlations among structural capacities, arising from shared materials, typologies, or construction practices [ 4 , 12 , 20 , 42 , 45 ], ha ve only recently begun to receive attention and remain under- represen ted [ 16 ]. Structural capacities are still often mo deled as conditionally indep endent given hazard in tensity [ 38 ], suppressing collective b ehavior and biasing regional decision metrics. Fig. 3 quantifies the practical stakes of these assumptions by comparing regional repair-cost distributions in the north-eastern part of San F rancisco, sub jected to the same earthquake scenarios as the Milpitas case, with and without coarse structural categorization. Compared with the Milpitas building p ortfolio, the selected San F rancisco region, whic h includes commercial districts such as the Financial District and Mission Ba y and residential zones suc h as P acific Heigh ts and Hay es V alley , exhibits a more diverse building p ortfolio (Extended Data Fig. 9 ). Enforcing coarse categories narrows the p ortfolio’s effectiv e capacit y spread and exacerbates collective clustering, changing the shap e of the distribution and rendering spurious first-order phase transitional b ehavior. Fig. 3 further con trasts analyses with and without the conditional- indep endence assumption for the Milpitas p ortfolio; neglecting in ter-building correlation obscures collective alignmen t in damage and leads to a biased distribution shap e. In b oth cases, mean repair costs remain similar, yet the tails alter markedly; exceedance probabilities for repair costs are biased by up to 50% at mo derate earthquake magnitudes ( M w ≈ 5 . 5 – 6 . 0 ), and the 1% quantile repair cost is misestimated b y up to one to t w o orders, ranging from a 30-fold underestimation under coarse categorization in San F rancisco and to a 30-fold ov erestimation under conditional indep endence in Milpitas (Supplementary Figs 13 and 14 ). Since preparedness, resource prep ositioning, and retrofit prioritization are gov erned b y tail measures (e.g., exceedance probabilities, v alue-at-risk, or conditional v alue-at-risk), these assumption-driv en shifts are decision-critical. The distributional c hange is most pronounced at mo derate hazard in tensities, where design and p olicy choices are most consequential and challenging, in contrast to w eak or extreme hazards for which 10 decisions are relativ ely straightforw ard. View ed through the lens of collective phases, engineering simplifications do not merely reduce precision; they may shift a p ortfolio into an incorrect collectiv e phase. Coarse structural categorization artificially sync hronizes the modeled p ortfolio, inducing abrupt transitions, whereas the conditional-indep endence as- sumption pushes it tow ard the v olatile regime. Phase distortion is most pronounced at mo derate hazard in tensity where the system is near a critical phase b oundary , but becomes negligible under extreme hazards. Consequen tly , mo del v alidit y is not absolute but con tingent on the portfolio’s proximit y to phase b ound- aries. This motiv ates a phase-aw are diagnostic framew ork for constructing balanced engineering mo dels that remain faithful to the underlying collective phase while maximizing efficiency . Crucially , such a framework iden tifies when a system enters the volatile regime, where critical-like b eha vior fundamen tally constrains predictabilit y and renders aggregated risk metrics intrinsically sensitive to mo deling choices. 11 Fig. 3: Engineering implications of collective behavior and phase aw areness. a , F ragility curves for the northeastern San F rancisco building portfolio analyzed with (colored) and without (gray) coarse structural-type categorization. Categories for structural type are defined according to Hazus 6.1 [ 11 ]. b , Regional repair-cost distributions illustrating t wo common engi- neering simplifications: coarse structural-type categorization for the San F rancisco p ortfolio (left) and conditional-indep endence assumption for the Milpitas portfolio (righ t). In San F rancisco, replacing individual fragility curves (teal) with category-based curves (gold) imp oses artificial homogeneity and reshapes the total repair-cost distributions, pro ducing clustered b ehavior. In Milpitas, assuming conditionally indep endent structural capacities (pink) instead of explicitly dependent capacities (teal) sup- presses collectiv e alignment in damage and broadens the repair-cost distributions. In b oth cases, these distributional changes mainly alter quantile-based tail-risk metrics while leaving mean risk metrics largely unchanged. Mark er sym bols b elow the x-axis iden tify represen tativ e earthquak e magnitudes used in panel c . c , Phase-diagram in terpretation of the engineering simplifications. Background colors denote collective-risk phases; the tw o synchronized regimes corresp ond to collectively dam- aged (red) and collectiv ely safe states (blue), resp ectively . Each simplification changes the inferred phase-diagram lo cation of the same underlying portfolio by altering its effectiv e heterogeneity: coarse categorization (left) reduces apparent diversity (moving the p ortfolio leftw ard), whereas the conditional-indep endence assumption (right) increases apparent diversit y (moving it right ward). Under weak or strong hazards, these shifts do not c hange the qualitative phase, but at mo derate intensities they can push the p ortfolio across the phase b oundary . Suc h phase misrepresen tation systematically distorts loss predictions, particularly in the tail of the distribution, where risk-informed decisions are most sensitive. Marker sym b ols corresp ond to the representativ e magnitudes in panel b . 12 5. Discussion The emergence of collective damage regimes reveals that regional disaster risk follo ws universal la ws of collectiv e behavior. Rather than acting as a sum of indep enden t building failures, a cit y b ehav es as a coupled system whose collective state is determined jointly by hazard intensit y and structural div ersity . The Random Field Ising Mo del captures these dynamics, demonstrating that the comp etition b etw een inter- building coupling and lo cal disorder go verns whether the regional response is abrupt and synchronized, or con tinuous and volatile. These findings generalize b eyond seismic risk. Any hazard capable of imp osing correlated demand across a region, such as hurricanes, flo o ds, or wildfires, may induce similar collective phase transitions when inter- acting with the underlying heterogeneity of the built environmen t. F urthermore, this framew ork naturally extends to infrastructure netw orks, where failure can b e redefined as functional outages in p ow er grids, transp ortation blo ck ages, or w ater supply disruptions. F uture work utilizing scaled exp eriments that mimic the interpla y of spatial correlation and disorder could provide physical v alidation of these predicted collectiv e dynamics. The statistical physics p ersp ective also clarifies the fundamental limits of current engineering risk mo d- els. Simplifications that distort hazard correlations or structural div ersity do not merely reduce precision; they can inadverten tly shift a region across a phase b oundary , fundamen tally altering the nature of the predicted resp onse. This is particularly critical when the system resides in the v olatile phase, where p ersis- ten t multiscale correlations slo w the self-av eraging of fluctuations. This non-Gaussian b ehavior imposes an in trinsic limit on predictabilit y , leaving tail-risk metrics sensitiv e to mo dest modeling changes. Embedding phase a wareness through diagnostics such as critical p oints or free-energy landscapes offers a path tow ard balanced engineering mo dels that remain computationally practical while resp ecting the underlying physics of collectiv e b ehavior. More broadly , situating urban risk within the physics of critical phenomena reframes the paradigm of urban resilience mo deling. Recognizing cities as complex systems op erating near criticality rev eals a fundamen tal limit to the constructionist approac h: refining individual component models alone cannot capture the full risk landscap e; it m ust b e complemen ted by a macroscopic framew ork that na vigates the transitions b et ween collective stability and instability . 13 Metho ds Regional simulation framew ork The detailed framework for regional-scale structural resp onse simulations is summarized in Supplemen tary Metho d 5 , and the sp ecific implemen tation used in this study is detailed in Supplementary Metho d 6 . Study r e gions and building inventories Building-lev el attributes were obtained from the Natural Hazards Engineering Research Infrastructure (NHERI) database, which pro vides detailed inv en tory data for the San F rancisco Bay Area, including the n umber of stories, construction y ear, and structural t yp e [ 48 ]. T wo representativ e regions were analyzed: Milpitas and northeastern San F rancisco. The Milpitas dataset includes 5,943 buildings, predominan tly residen tial, whereas the San F rancisco dataset comprises 6,323 buildings spanning commercial districts suc h as the Financial District and Mission Ba y , as well as residential neighborho o ds including Pacific Heigh ts and Ha yes V alley . District b oundaries were retrieved from the San F rancisco Op en Data Portal [ 8 ]. Extended Data Fig. 9 shows maps of the t wo regions and the distributions of structural attributes; detailed inv en tory statistics are pro vided in the Supplementary Figs. 15 – 18 . Structur al mo deling Using the retrieved building attributes, multi-degree-of-freedom (MDOF) shear mo dels were constructed for each building follo wing established simulation frameworks [ 21 , 25 ]. Each mo del reflected the building’s material, t yp ology , construction year, n um b er of stories, height, and plan area, while each story w as mod- eled as a zero-length element with a h ysteretic uniaxial material capable of repro ducing nonlinear stiffness degradation and pinching b ehavior. Story-wise stiffness and strength parameters were derived from the Hazus 6.1 Earthquak e Mo del database [ 11 ] according to structural type and design era, and implemented in the op en-source finite-elemen t platform Op enSeesPy [ 24 , 47 ]. The mo dels were sub jected to ground motions through a uniform base-excitation pattern applied at the structures’ base supp orts, and the p eak inter-story drift ratio w as extracted as the primary engineering demand parameter (EDP). Incremen tal Dynamic Analyses (IDA) [ 37 ] were conducted to estimate structural capacities using 100 empirical ground-motion records from the NGA-W est2 database [ 2 ]. Each record w as incrementally scaled un til the structure reached its threshold EDP , defined as the EDP corresponding to the slight damage state according to the in ter-story drift limits defined in Hazus 6.1 [ 11 ] for the resp ective structural type and construction era. A lognormal distribution is fitted to the resulting set of 100 capacity estimates 14 p er building, whose cumulativ e density function represents the fragilit y curv e for eac h building. Regional correlations among structural capacities were then computed from the ensemble of sim ulated capacities across all buildings in the study region. T o emulate cities with more heterogeneous building p ortfolios, we in tro duced v ariability in structural capacities. F or each prescrib ed diversit y level σ , we p erturbed each building’s median capacity (i.e., the mean of the log-capacit y) by multiplying it by lognormal nois e, whose logarithm has mean zero and standard deviation σ . This pro cedure effectively broadened the regional fragility-curv e p ortfolio across a region, as illustrated in Extended Data Fig. 8 . Hazar d mo deling A strike-slip earthquak e scenario on the Ha yward fault, represen tative of the San F rancisco Bay Area, was defined with an epicenter at (37 . 666 ◦ N , 122 . 076 ◦ W) , strike 325 ◦ , dip 90 ◦ , rake 180 ◦ , and a 3 km depth to the top of rupture. The moment magnitude M w serv ed as the intensit y measure. Site conditions were assigned using V S 30 v alues from the U.S. Geological Survey dataset [ 35 ]. These parameters defined the input for sim ulating spatially correlated ground motions under a California strike-slip mechanism. F or sto chastic ground-motion field generation, we adopted the ground-motion prediction equation (GMPE) of Chiou and Y oungs [ 7 ], applicable to activ e crustal regions in California, to compute the logarithmic mean and standard deviation of p eak ground acceleration (PGA) for each site. F ault rupture length and width w ere estimated from the moment magnitude using the empirical scaling relations of W ells and Copp er- smith [ 40 ]. Spatial correlation of in tra-even t residuals was mo deled following Jay aram and Baker [ 17 ], with an exp onen tial decay function calibrated for strike-slip mec hanisms and soil conditions represen tative of the Ba y Area. The resulting spatially correlated residual fields w ere sup erimp osed on the GMPE-based median predictions to generate regional PGA maps consisten t with the sp ecified earthquake scenario. T o maximize the physical realism of generated ground-motion fields, the sto c hastically simulated intensit y measures ov er Milpitas were cross-v alidated against physics-based sim ulations from the SCEC Broadband Platform (BBP) [ 23 ]. The BBP generates broadband (0-20+ Hz) seismic wa v e synthetics using a combination of physics-based comp onents to simulate fault rupture and three-dimensional wa v e propagation. The same earthquak e scenarios were used in b oth approaches. The comparison (Extended Data Fig. 10 ; Supplementary Figs. 19 – 22 ) sho ws close agreement in PGA levels and spatial v ariability within aleatory uncertainties. 15 Simulation pr o c e dur e F or each seismic scenario, we generated building capacities and ground-motion demands, then ev aluated damage deterministically . Capacities C i (in g units) for building i were sampled from the fitted lognormal distributions with parameters calibrated from the IDA-based fragilit y analysis, including the IDA-deriv ed correlations. Seismic demands D i w ere sampled as lognormal from the GMPE median and v ariance, including in ter- and intra-ev en t residuals. Damage was assigned by the binary rule I i = 1 { D i > C i } , and the regional damage fraction w as m d = 1 N P N i =1 I i for N buildings. W e p erformed 10,000 Monte Carlo realizations at eac h ( M w , σ ) pair to obtain the distribution of m d . The magnitude range was M w = 3 . 5 to 8 . 5 in incremen ts of 0 . 05 (101 v alues). The diversit y parameter spanned σ = 0 . 00 to 1 . 00 in increments of 0 . 01 (101 v alues), with σ = 0 . 00 denoting co de-sp ecified structural parameters with no extra v ariabilit y . L oss and c ost estimation Repair costs w ere estimated using building-lev el data from the SimCen ter Earthquak e T estb ed for the San F rancisco Bay Area [ 48 ], whic h pro vides replacemen t and repair costs computed via the PELICUN framew ork [ 50 ]. The ratio betw een the provided repair and replacement costs w as appro ximately 3%, corresp onding to the mo der ate damage state in the Hazus 6.1 Earthquake Mo del [ 11 ]. Since this study fo cused on the slight damage state, repair costs were scaled b y a factor of five to reflect the t ypical cost ratio b etw een slight and mo derate damage. F or each sim ulated realization, the repair cost of building i was computed as R i = Cost i I i / 5 , where Cost i is the building’s replacement cost and I i is the simulated binary damage indicator. The regional repair cost fraction was then r = P i R i P i Cost i , representing the proportion of total replacemen t v alue requiring repair. Construction of phase represen tations Statistic al he atmap c onstruction F or each panel in whic h one parameter v aries (the tuning parameter) while the other is held fixed, we aggregated outcomes across tuning-parameter v alues to form a tw o-dimensional histogram with axes giv en b y the tuning parameter and the damage fraction m d . Occurrence frequency w as computed on a uniform grid with bin widths of 0.05 in M w , 0.01 in σ , and 10 − 3 in m d . T o stabilize the color scale, counts were clipp ed at a robust upp er cutoff and then normalized (95th p ercen tile for the M w panels; 99th p ercen tile for the σ panels). The resulting normalized o ccurrence frequencies were rendered as 100-level filled contours, with the horizon tal axis denoting the tuning parameter and the vertical axis denoting m d . 16 Empiric al phase r epr esentation F or the empirical phase diagram, we estimated the most probable damage fraction m ⋆ d at each ( M w , σ ) grid p oin t. W e constructed a 100-bin uniform histogram of m d , ranked bins by count, and av eraged samples within the smallest set of top bins whose cumulativ e count exceeded 100 (1% of 10,000 simulations) to obtain a stable estimate. The resulting field m ⋆ d ( M w , σ ) was visualized as a 100-lev el filled con tour map with σ on the horizon tal axis and M w on the v ertical axis. RFIM mapping and free-energy analysis Par ameter mapping W e estimated the RFIM mean-field parameters H and ∆ on the ( M w , σ ) grid b y fitting m ⋆ d to the self- consisten t equation m = erf m + a 1 √ 2 ,a 2 , fixing J = 1 so that a 1 ≡ H and a 2 ≡ ∆ . W e parameterized a 1 ( M w ) and a 2 ( σ ) with lo w-order p olynomials (quadratic in M w ; non-decreasing linear in σ ) and estimated coeffi- cien ts b y least squares ov er the grid. T o stabilize the a 2 fit and a void spurious bistability , w e excluded data from the sync hronized regime and applied a light regularization to suppress unrealistically sharp transitions. Extended Data Fig. 7 sho ws the fitted relations. RFIM phase diagr am Using the fitted maps a 1 ( M w ) and a 2 ( σ ) , we numerically solved m = erf m + a 1 √ 2 ,a 2 on the ( M w , σ ) grid. At eac h grid point, we obtained the equilibrium magnetization m ⋆ and used the corresp onding damage fraction m ⋆ d for visualization. Because a 2 ( σ ) w as fitted using data in the volatile regime, w e extrapolated this relation in to the synchronized regime. W e identified the bistable region as grid p oints where solutions initialized from opp osite states ( m 0 = ± 1 ) differed b y more than 10 − 4 . The critical magnitude and diversit y , M w c and σ c , were then inferred from the fitted free energy (see Metho ds , Identific ation of critic al magnitude and diversity ). F r e e-ener gy landsc ap e The corresp onding mean-field free energy (see Supplemen tary Metho d 3 ), F ( m ; M w , σ ) = 1 2 m 2 − ( m + a 1 ( M w )) erf m + a 1 ( M w ) √ 2 a 2 ( σ ) − r 2 π a 2 ( σ ) exp − ( m + a 1 ( M w )) 2 2 ( a 2 ( σ )) 2 ! + C , w as ev aluated on dense grids in m ov er slices at fixed M w or fixed σ , with C = 0 . Since only relative differences in F are physically meaningful, each slice w as normalized b y subtracting its minim um and 17 dividing b y the global maxim um height (after minim um subtraction). F or visualization in Fig. 2 c, w e applied a p ow er-la w normalization to emphasize lo w-energy basins corresp onding to equilibrium states, and mapp ed m to m d . Identific ation of critic al magnitude and diversity The critical magnitude M w c is the point at whic h the equilibrium magnetization m changes sign, which in the mean-field form corresp onds to a 1 ( M w ) = 0 . F rom the fitted relation, this o ccurs at M w c ≈ 5 . 6 for the b enchmark Milpitas case at σ = 0 . 0 . The critical div ersity σ c , b eyond which m v aries smo othly with increasing M w and no abrupt change o ccurs, is defined by the condition d 2 F dm 2 m =0 = 0 . Ev aluating this condition for the mean-field free energy yields a 2 c = p 2 /π , corresp onding to σ c ≈ 0 . 49 . Susc eptibility and c orr elation estimation F or the ensemble at fixed ( M w , σ ) , w e first identified an equilibrium range. W e then estimated susceptibility from equilibrium fluctuations of the damage fraction m as χ = N V ar( m ) = N ⟨ m 2 ⟩ − ⟨ m ⟩ 2 , where ⟨·⟩ denotes an ensemble av erage ov er equilibrium samples and N is the num ber of buildings. This fluctuation- based definition serves as a practical pro xy for linear-response sensitivity to an external-field p erturbation. Spatial dep endence was quantified using the connected t wo-point correlation C ( i, j ) = ⟨ s i s j ⟩ − ⟨ s i ⟩⟨ s j ⟩ . W e radially av eraged C ( i, j ) o v er all distinct pairs b y separation r ij (bin width ∆ r ) to obtain C ( r ) , and rep orted C ( r ) /C (0) , where C (0) is the mean on-site v ariance. W e repeated the analysis ov er 50 independent p ortfolio realizations to obtain robust distributions of χ and ξ (Supplementary Metho d 4 ). 18 References [1] Amnon Aharon y . T ricritical points in systems with random fields. Physic al R eview B , 18(7):3318–3327, Octob er 1978. ISSN 0163-1829. doi: 10.1103/Ph ysRevB.18.3318. URL https://link.aps.org/doi/ 10.1103/PhysRevB.18.3318 . [2] Timoth y D. Anc heta, Robert B. Darragh, Jonathan P . Stewart, Emel Seyhan, W alter J. Silv a, Brian S.- J. Chiou, Katie E. W o o ddell, Rob ert W. Gra v es, Alb ert R. K ottke, David M. Bo ore, T adahiro Kishida, and Jennifer L. Donahue. NGA-W est2 Database. Earthquake Sp e ctr a , 30(3):989–1005, August 2014. ISSN 8755-2930, 1944-8201. doi: 10.1193/070913EQS197M. URL https://journals.sagepub.com/ doi/10.1193/070913EQS197M . [3] Karen Angeles and T racy Kijewski-Correa. Adv ancing parcel-lev el hurricane regional loss assessmen ts using op en data and the regional resilience determination tool. International Journal of Disaster Risk R e duction , 95:103818, September 2023. ISSN 22124209. doi: 10.1016/j.ijdrr.2023.103818. URL https: //linkinghub.elsevier.com/retrieve/pii/S2212420923002984 . [4] Jac k W Bak er, Ed Almeter, Dustin Co ok, Abbie B Liel, and Curt Haselton. A model for par- tially dependent component damage fragilities in seismic risk analysis. Earthquake Sp e ctr a , 40(1): 609–628, F ebruary 2024. ISSN 8755-2930, 1944-8201. doi: 10.1177/87552930231205790. URL https://journals.sagepub.com/doi/10.1177/87552930231205790 . [5] Mic hael J. Brennan and John P . Cangialosi. T ropical Cyclone Report: Hurricane Helene (AL092024). T ec hnical rep ort, National Hurricane Center, National Oceanic and Atmospheric Administration (NO AA), Miami, FL, USA, Octob er 2024. URL https://www.nhc.noaa.gov/data/tcr/AL092024_ Helene.pdf . [6] Sergey V. Buldyrev, Roni Parshani, Gerald Paul, H. Eugene Stanley , and Shlomo Havlin. Catastrophic cascade of failures in interdependent netw orks. Natur e , 464(7291):1025–1028, April 2010. ISSN 0028- 0836, 1476-4687. doi: 10.1038/nature08932. URL https://www.nature.com/articles/nature08932 . [7] Brian S.-J. Chiou and Robert R. Y oungs. Update of the Chiou and Y oungs NGA Model for the A v erage Horizontal Component of Peak Ground Motion and Resp onse Sp ectra. Earthquake Sp e ctr a , 30(3):1117–1153, August 2014. ISSN 8755-2930, 1944-8201. doi: 10.1193/072813EQS219M. URL https://journals.sagepub.com/doi/10.1193/072813EQS219M . 19 [8] Cit y and Coun t y of San F rancisco. Analysis neigh borho o ds. https://data.sfgov.org/dataset/ Analysis- Neighborhoods/p5b7- 5n3h , 2024. Accessed Octob er 21, 2025. [9] Laxman Dahal, Henry Burton, and Kuanshi Zhong. High-Fidelit y High-Resolution Re- gional Seismic Risk and Resilience Assessment of Large Building Inv en tories. Earthquake Engine ering & Structur al Dynamics , 54(5):1376–1396, 2025. ISSN 1096-9845. doi: 10. 1002/eqe.4313. URL https://onlinelibrary.wiley.com/doi/abs/10.1002/eqe.4313 . _eprin t: h ttps://onlinelibrary .wiley .com/doi/p df/10.1002/eqe.4313. [10] Ab dullah Dilsiz, Selim Gunay , Khalid Mosalam, Eduardo Miranda, Carlos Arteta, Halil Sezen, Erica Fischer, Manouchehr Hakhamaneshi, W ael Hassan, Bilal ALhaw amdeh, Samuel Andrus, Jorge Arch bold, Safak Arslanturk oglu, NURULLAH BEKT AS, Luis Ceferino, Jade Cohen, Bu- rak Duran, Kalil Erazo, Gloria F araone, T ali F einstein, Ra jendra Gautam, Abhineet Gupta, Salah Ha j Ismail, Amalesh Jana, Sa jad Jav adinasab Hormozabad, Amarnath Kasalanati, Maha Ke- na wy , Zey ad Khalil, Irene Liou, Mark o Marinko vic, Amory Martin, Y vonne Merino-P eña, Maziar Miv ehchi, Luis Moy a, César Pá jaro Miranda, nicolas quintero, Juliana Rivera, Xa vier Romão, Maria Camila Lop ez Ruiz, Shokrullah Sorosh, Laura V argas, Pulkit Dilip V elani, Hartanto Wi- b o wo, Susu Xu, T ANER YILMAZ, Mohammad Alam, Gab or Holtzer, T racy Kijewski-Correa, Ian Rob ertson, David Rouec he, and Amir Safiey . StEER: 2023 Mw 7.8 Kahramanmaras, Türkiye Earth- quak e Sequence Preliminary Virtual Reconnaissance Rep ort (PVRR). T echnical rep ort, Designsafe- CI, 2023. URL https://www.designsafe- ci.org/data/browser/public/designsafe.storage. published/PRJ- 3824/#detail- 942732811040452115- 242ac11b- 0001- 012/?version=2 . [11] F ederal Emergency Management Agency (FEMA). Hazus Earthquak e Mo del T echnical Manual: Hazus 6.1. T echnical rep ort, F ederal Emergency Management Agency , W ashington, D.C., July 2024. URL https://www.fema.gov/flood- maps/products- tools/hazus . [12] Ja yadipta Ghosh, Keiv an Rokneddin, Jamie E. Padgett, and Leonardo Dueñas-Osorio. Seismic Relia- bilit y Assessmen t of Aging High wa y Bridge Net works with Field Instrumen tation Data and Correlated F ailures, I: Metho dolo gy . Earthquake Sp e ctr a , 30(2):795–817, Ma y 2014. ISSN 8755-2930, 1944-8201. doi: 10.1193/040512EQS155M. URL https://journals.sagepub.com/doi/10.1193/040512EQS155M . [13] K. Go da and H. P . Hong. Spatial Correlation of Peak Ground Motions and Resp onse Sp ectra. Bul letin of the Seismolo gic al So ciety of Americ a , 98(1):354–365, F ebruary 2008. ISSN 0037-1106. doi: 10.1785/ 0120070078. URL https://pubs.geoscienceworld.org/bssa/article/98/1/354- 365/341898 . 20 [14] Nigel Goldenfeld. L e ctur es on Phase T r ansitions and the R enormalization Gr oup . CRC Press, 1 edition, March 2018. ISBN 978-0-429-49349-2. doi: 10.1201/9780429493492. URL https://www. taylorfrancis.com/books/9780429962042 . [15] Himadri Sen Gupta, Omar N. Nofal, Andrés D. González, Charles D. Nicholson, and John W. V an De Lindt. Machine Learning-Based Prediction of Optimal Building-Level Flo o d Mitigation Strategies in A t-Risk Communities. Natur al Hazar ds R eview , 26(4):04025044, Nov em b er 2025. ISSN 1527-6988, 1527-6996. doi: 10.1061/NHREFO.NHENG- 2330. URL https://ascelibrary.org/doi/10.1061/ NHREFO.NHENG- 2330 . [16] P ablo Heresi and Eduardo Miranda. RPBEE: P erformance-based earthquake engineering on a regional scale. Earthquake Sp e ctr a , 2023. ISSN 19448201. doi: 10.1177/87552930231179491. Publisher: SA GE Publications Inc. [17] Nirmal Jay aram, Jac k W Bak er, N Jay aram, and J W Baker. Correlation mo del for spatially dis- tributed ground-motion intensities. Earthquake Engine ering & Structur al Dynamics , 38(15):1687–1708, 12 2009. ISSN 1096-9845. doi: 10.1002/EQE.922. URL https://onlinelibrary.wiley.com/ doi/full/10.1002/eqe.922https://onlinelibrary.wiley.com/doi/abs/10.1002/eqe.922https: //onlinelibrary.wiley.com/doi/10.1002/eqe.922 . [18] Luk e T. Jenkins, Maggie J. Creed, Karim T arbali, Manoranjan Muthusam y , Rob ert Šakić T rogr- lić, Jeremy C. Phillips, C. Scott W atson, Hugh D. Sinclair, Carmine Galasso, and John McCloskey . Ph ysics-based simulations of multiple natural hazards for risk-sensitive planning and decision making in expanding urban regions. International Journal of Disaster Risk R e duction , 84:103338, January 2023. ISSN 22124209. doi: 10.1016/j.ijdrr.2022.103338. URL https://linkinghub.elsevier.com/ retrieve/pii/S221242092200557X . [19] Leo Kadanoff. Statistic al physics: statics, dynamics, and r enormalization . W orld Scientific, 2000. ISBN 978-981-02-3764-6. [20] Ch ulyoung Kang, Oh Sung Kw on, and Junho Song. Ev aluation of correlation b et ween engineering demand parameters of structures for seismic system reliability analysis. Structur al Safety , 93, 11 2021. ISSN 01674730. doi: 10.1016/j.strusafe.2021.102133. [21] Xinzheng Lu, F rank McKenna, Qingle Cheng, Zhen Xu, Xiang Zeng, and Stephen A Mahin. An op en- source framework for regional earthquake loss estimation using the cit y-scale nonlinear time history 21 analysis. Earthquake Sp e ctr a , 36(2):806–831, Ma y 2020. ISSN 8755-2930, 1944-8201. doi: 10.1177/ 8755293019891724. URL https://journals.sagepub.com/doi/10.1177/8755293019891724 . [22] Shang-Keng Ma. Mo dern the ory of critic al phenomena . Routledge, 2019. ISBN 978-0-367-09537-6. [23] P . J. Maec hling, F. Silv a, S. Callaghan, and T. H. Jordan. SCEC Broadband Platform: System Arc hitecture and Softw are Implementation. Seismolo gic al R ese ar ch L etters , 86(1):27–38, Jan uary 2015. ISSN 0895-0695, 1938-2057. doi: 10.1785/0220140125. URL https://pubs.geoscienceworld.org/ srl/article/86/1/27- 38/315492 . [24] F rank McKenna. Op enSees: A F ramework for Earthquak e Engineering Simulation. Computing in Scienc e & Engine ering , 13(4):58–66, 2011. [25] F rank McKenna, Stev an Gavrilo vic, Jiny an Zhao, Kuanshi Zhong, Adam Zsarno czay , Barbaros Cetiner, Sina Naeimi, Sang ri Yi, Ak ash Bangalore Satish, Amin Pac kzad, P edro Arduino, and W ael Elhaddad. NHERI-SimCen ter/R2DT o ol: V ersion 5.5.0 (v5.5.0), 2025. URL https://doi.org/10.5281/zenodo. 16884221 . NHERI SimCenter, Rapid Regional Resilience Determination T o ol (R2DT o ol). [26] Chandrak ala Meena, Chittaranjan Hens, Suman A c haryy a, Simc ha Haber, Stefano Boccaletti, and Baruc h Barzel. Emergent stability in complex net work dynamics. Natur e Physics , 19(7):1033–1042, July 2023. ISSN 1745-2473, 1745-2481. doi: 10.1038/s41567- 023- 02020- 8. URL https://www.nature. com/articles/s41567- 023- 02020- 8 . [27] NO AA National Cen ters for Environmen tal Information. U.S. billion-dollar w eather and climate disas- ters, 2025. URL https://www.ncei.noaa.gov/access/billions/ . [28] Sebin Oh, Sangri Yi, and Ziqi W ang. Long-range Ising mo del for regional-scale seismic risk analysis. Earthquake Engine ering & Structur al Dynamics , 53(12):3904–3923, 2024. [29] Raul Rincon and Jamie Ellen P adgett. F ragility m odeling practices and their implications on risk and resilience analysis: F rom the structure to the net work scale. Earthquake Sp e ctr a , 40(1):647–673, F ebruary 2024. ISSN 8755-2930. doi: 10.1177/87552930231219220. URL https://doi.org/10.1177/ 87552930231219220 . Publisher: SA GE Publications Ltd STM. [30] T om R. Robinson, Nic holas J. Rosser, Alexander L. Densmore, Katie J. Oven, Surya N. Shrestha, and Ramesh Guragain. Use of scenario ensembles for deriving seismic risk. Pr o c e e dings of the Na- 22 tional A c ademy of Scienc es , 115(41), Octob er 2018. ISSN 0027-8424, 1091-6490. doi: 10.1073/pnas. 1807433115. URL https://pnas.org/doi/full/10.1073/pnas.1807433115 . [31] Nitheshnirmal Sadhasiv am, Leonard Ohenhen, Mohammad Khorrami, Susanna W erth, and Mano o c hehr Shirzaei. Building damage risk in sinking Indian megacities. Natur e Sustainability , October 2025. ISSN 2398-9629. doi: 10.1038/s41893- 025- 01663- 0. URL https://www.nature.com/articles/ s41893- 025- 01663- 0 . [32] Rafael M. Sebastianes and V. K. Saxena. Phase diagram of the random-field Ising mo del with a trimo dal distribution. Physic al R eview B , 35(4):2058–2060, F ebruary 1987. ISSN 0163-1829. doi: 10.1103/Ph ysRevB.35.2058. URL https://link.aps.org/doi/10.1103/PhysRevB.35.2058 . [33] Mohamadreza Sheibani and Ge Ou. Accelerated Large-Scale Seismic Damage Sim ulation With a Bi- mo dal Sampling Approac h. F r ontiers in Built Envir onment , 7:677560, Ma y 2021. ISSN 2297-3362. doi: 10.3389/fbuil.2021.677560. URL https://www.frontiersin.org/articles/10.3389/fbuil.2021. 677560/full . [34] Theo dorakis and F ytas. Random-field Ising mo del: Insigh t from zero-temperature sim ulations. Con- dense d Matter Physics , 17(4):43003, December 2014. ISSN 1607324X. doi: 10.5488/CMP .17.43003. URL http://www.icmp.lviv.ua/journal/zbirnyk.80/43003/abstract.html . [35] Eric M. Thompson. An up dated V s30 map for california with geologic and top ographic constrain ts (v er. 2.0, july 2022), 2018. URL https://doi.org/10.5066/F7JQ108S . U.S. Geological Survey data release. [36] United Nations Office for the Co ordination of Humanitarian Affairs (OCHA). Humanitarian transition o verview: Türkiy e earthquake resp onse. T echnical rep ort, United Nations Office for the Co ordina- tion of Humanitarian Affairs (OCHA), August 2023. URL https://reliefweb.int/report/turkiye/ humanitarian- transition- overview- turkiye- earthquake- response- august- 2023 . [37] Dimitrios V amv atsikos and C. Allin Cornell. Incremental dynamic analysis. Earthquake Engine ering & Structur al Dynamics , 31(3):491–514, March 2002. ISSN 0098-8847, 1096-9845. doi: 10.1002/eqe.141. URL https://onlinelibrary.wiley.com/doi/10.1002/eqe.141 . [38] John W. v an de Lindt, Jamie Kruse, Daniel T. Co x, Paolo Gardoni, Jong Sung Lee, Jamie Padgett, Therese P . McAllister, Andre Barb osa, Harv ey Cutler, Shannon V an Zandt, Nathanael Rosenheim, 23 Christopher M. Na v arro, Elaina Sutley , and Sara Hamideh. The in terdep endent net w orked comm unity resilience mo deling environmen t (IN-CORE). R esilient Cities and Structur es , 2(2):57–66, June 2023. ISSN 2772-7416. doi: 10.1016/j.rcns.2023.07.004. URL https://www.sciencedirect.com/science/ article/pii/S277274162300039X . [39] Alessandro V espignani. The fragility of in terdep endency . Natur e , 464(7291):984–985, April 2010. ISSN 0028-0836, 1476-4687. doi: 10.1038/464984a. URL https://www.nature.com/articles/464984a . [40] Donald L. W ells and Kevin J. Copp ersmith. New empirical relationships among magnitude, rup- ture length, rupture width, rupture area, and surface displacement. Bul letin of the Seismolo gi- c al So ciety of A meric a , 84(4):974–1002, August 1994. ISSN 1943-3573, 0037-1106. doi: 10.1785/ BSSA0840040974. URL https://pubs.geoscienceworld.org/bssa/article/84/4/974/119792/ New- empirical- relationships- among- magnitude . [41] W orld Bank and Global F acility for Disaster Reduction and Recov ery . Glob al R apid Post-Disaster Dam- age Estimation (GRADE) R ep ort: F ebruary 6, 2023 Kahr amanmar aş Earthquakes - Türkiye R ep ort . W ashington, DC, F ebruary 2023. doi: 10.1596/39468. URL https://hdl.handle.net/10986/39468 . [42] Meng jie Xiang, Jiaxu Shen, Zekun Xu, and Jun Chen. Structure-to-structure seismic damage correlation mo del. Earthquake Engine ering & Structur al Dynamics , 53(10):3205–3229, 2024. ISSN 1096-9845. doi: 10.1002/eqe.4172. URL https://onlinelibrary.wiley.com/doi/abs/10.1002/eqe.4172 . _eprint: h ttps://onlinelibrary .wiley .com/doi/p df/10.1002/eqe.4172. [43] Zekun Xu, Jun Chen, Jiaxu Shen, and Mengjie Xiang. Regional-scale nonlinear structural seismic resp onse prediction b y neural net w ork. Engine ering F ailur e A nalysis , 154, December 2023. ISSN 13506307. doi: 10.1016/j.engfailanal.2023.107707. Publisher: Elsevier Ltd. [44] T ak ahiro Y ab e, P . Suresh C. Rao, Satish V. Ukkusuri, and Susan L. Cutter. T ow ard data-driv en, dynam- ical complex systems approaches to disaster resilience. Pr o c e e dings of the National A c ademy of Scienc es , 119(8):e2111997119, F ebruary 2022. ISSN 0027-8424, 1091-6490. doi: 10.1073/pnas.2111997119. URL https://pnas.org/doi/full/10.1073/pnas.2111997119 . [45] Tian Y ou and Solomon T esfamariam. Spatial correlation in building seismic performance for regional resilience assessmen t. R esilient Cities and Structur es , 3(2):57–65, June 2024. ISSN 27727416. doi: 10.1016/j.rcns.2024.06.004. URL https://linkinghub.elsevier.com/retrieve/pii/ S2772741624000267 . 24 [46] Jian Zhong, Sien Zhou, Hao W ang, and Huimin Hu. Regional seismic fragilit y of bridge netw ork deriv ed by cov ariance matrix mo del of bridge p ortfolios. Engine ering Structur es , 309, June 2024. ISSN 18737323. doi: 10.1016/j.engstruct.2024.118035. Publisher: Elsevier Ltd. [47] Minjie Zhu, F rank McKenna, and Michael H. Scott. Op enSeesPy: Python library for the Op enSees finite elemen t framework. Softwar eX , 7:6–11, January 2018. ISSN 23527110. doi: 10.1016/j.softx.2017.10.009. URL https://linkinghub.elsevier.com/retrieve/pii/S2352711017300584 . [48] A dam Zsarnó czay , W ael Elhaddad, Barbaros Cetiner, Kuanshi Zhong, F rank McKenna, and Gre- gory Deierlein. SimCen ter Earthquake T estb ed: San F rancisco, CA, 2023. URL https://www. designsafe- ci.org/data/browser/public/designsafe.storage.published/PRJ- 3880 . [49] A dam Zsarnó cza y , Gregory G. Deierlein, F rank McKenna, Matthew Sc ho ettler, Sang-Ri Yi , Barbaros Cetiner, Aak ash Bangalore Satish, Jiny an Zhao, Justin Bonus, Abiy F. Melaku, Sina Naeimi, Pedro Arduino, Rac hel Davidson, Catherine Gorle, Sanjay Govindjee, Ahsan Kareem, T racy L. Kijewski- Correa, Laura N. Lo wes, Michael Motley , Seymour M. J. Sp ence, Ertugrul T aciroglu, Alexandros A. T aflanidis, and Matthew DeJong. An op en-source simulation platform to supp ort and foster re- searc h collab oration in natural hazards engineering. F r ontiers in Built Envir onment , 11, August 2025. ISSN 2297-3362. doi: 10.3389/fbuil.2025.1590479. URL https://www.frontiersin.org/journals/ built- environment/articles/10.3389/fbuil.2025.1590479/full . Publisher: F rontiers. [50] Á dám Zsarnóczay and Gregory G. Deierlein. P elicun – a computational fr amework for estimating damage, loss and comm unity resilience. In Pr o c e e dings of the 17th W orld Confer enc e on Earthquake Engine ering (17W CEE) , page Paper No. C003438, Sendai, Japan, September 13–18 2020. In ternational Asso ciation for Earthquak e Engineering, The 17th W orld Conference on Earthquake Engineering. URL https://github.com/NHERI- SimCenter/pelicun . © The 17th W orld Conference on Earthquak e En- gineering. 25 A c knowledgemen ts Data av ailabilit y The data that supp ort the findings of this study are av ailable in the pap er and the Supplementary Informa- tion and/or from the corresp onding author up on reasonable request. Co de av ailabilit y Co de used to generate the results is a v ailable at [URL that will b e a v ailable once the manuscript is accepted]. Author contributions S.O. and Z.W. conceived and developed the core ideas. S.O., R.R., J.E.P ., and Z.W. contributed to the study methodology . S.O. developed the softw are for the ov erall workflo w and performed the simulations. J.Z. developed and executed the physics-based ground-motion time-history generation. S.O. curated the data, conducted the inv estigation, p erformed the formal analyses, and pro duced the visualizations. S.O. wrote the original man uscript. S .O., J.Z., R.R., J.E.P ., and Z.W. reviewed and edited the man uscript. Z.W. sup ervised the pro ject. R.R. provided baseline co de for GMPE-based intensit y-measure generation. Z.W. pro vided access to high-p erformance computing resources. Comp eting interests There are no comp eting in terests to declare. A dditional information Supplemen tary information is a v ailable for this pap er. Corresp ondence and requests for materials should b e addressed to Ziqi W ang. 26 Extended Data Extended Data Fig. 1: Evolution of damage-fraction distributions with increasing earthquake magnitude for the full Milpitas p ortfolio. a , Heatmap of regional damage-fraction distributions versus earthquak e magnitude; colors indicate relative o ccurrence frequency . In Milpitas, the num ber of stories is nearly bimo dal, whereas structural t yp e is nearly uniform across the city (Extended Data Fig. 9 ). This bimo dality giv es rise to three collective states (A, B, and C) separated by tw o sequential transitions. b , Representativ e spatial damage maps for the three collective states, shown with the spatial distribution of the number of stories for reference. Blue and red indicate undamaged and damaged states, respectively . Damage in the intermediate state B aligns with multistory buildings, indicating collective damage of multistory structures. States A and C correspond to the collectively safe and collectively damaged states, respectively . 27 Extended Data Fig. 2: Sim ulation-derived phase diagrams for the full Milpitas portfolio (left) and the northeast- ern San F rancisco p ortfolio (righ t). The full Milpitas portfolio exhibits three collective states at low structural diversit y , consistent with the three-state behavior in Fig. 1 . The San F rancisco portfolio do es not show a distinct transition b oundary between the collectively safe and collectively damaged states; instead, the change is gradual, pro ducing a smo oth transition rather than a sharp phase b oundary . 28 Extended Data Fig. 3: Ev olution of regional damage-fraction distributions at representativ e structural div ersity lev els. Heatmaps show the ev olution of the Milpitas damage-fraction distribution at three structural div ersity levels ( σ = 0 . 0 , 0 . 5 , and 1 . 0 ). Snapshots b elow each panel show the corresponding histograms at representativ e magnitudes ( M w = 4 . 5 , 5 . 6 , and 6 . 5 ). As structural div ersity increases, the transition from the collectively safe to the collectiv ely damaged state becomes progressively smoother, and the bimodality at intermediate magnitudes disapp ears. 29 Extended Data Fig. 4: Evolution of damage-fraction distributions with increasing earthquake magnitude for the northeastern San F rancisco p ortfolio. Heatmap (left) shows regional damage-fraction distributions versus earthquak e magnitude, with the color indicating relative o ccurrence frequency . Histograms (righ t) sho w the distributions at selected magnitudes ( M w = 5 . 8 , 6 . 3 , 6 . 8 , and 7 . 3 ), highlighting a smo oth transition from the collectiv ely safe to the collectively damaged state in this high-diversit y p ortfolio. 30 Extended Data Fig. 5: Ev olution of damage-fraction distribution with temp erature in regional simulations. Eac h column corresp onds to a fixed earthquak e magnitude, and each row to the probabilistic-margin parameter T . Increasing T progressively smo oths the transition b etw een the collectively safe and collectively damaged states, illustrating the analogy of temp erature in the random-field Ising mo del to uncertaint y in the hazard–structure interaction model; see Supplementary Method 2 for implementation details. 31 Extended Data Fig. 6: Phase diagram for Milpitas, California, with temp erature as a con trol parameter. Collective behavior is shown in structural div ersity–temperature space at M w = 5 . 5 (left) and in structural div ersity–temperature– magnitude space (righ t). The left panel sho ws the decrease in the critical div ersity σ c with increasing T , whic h marks the boundary betw een synchronized regimes (collectively safe or collectively damaged city-scale risk) and a volatile regime with mixed outcomes. The righ t panel extends this relationship across earthquake magnitudes M w , yielding a con tinuous phase surface separating synchronized and volatile regions. Increasing T suppresses abrupt transitions, smo othing the b oundary and weak ening phase separation, consisten t with the random-field Ising mo del [ 1 , 32 , 34 ]; see Supplementary Metho d 2 for implementation details. 32 Extended Data Fig. 7: Dep endence of free-energy co efficients on hazard intensit y and structural diversit y . a , First- order co efficien t a 1 versus earthquake magnitude M w , with a quadratic fit that crosses zero at the inferred critical magnitude. b , Second-order coefficient a 2 versus structural diversit y σ , with a non-decreasing linear fit consisten t with progressive smo othing of the transition as heterogeneity increases. T o stabilize the fit and a void spurious bistabilit y , only data in the volatile regime ( σ > 0 . 6 ) were used. 33 Extended Data Fig. 8: Evolution of fragility curves with increasing structural diversit y . F ragility curv es for the multistory building p ortfolio in Milpitas, California, shown for four structural diversit y levels. Here, σ denotes the additional v ariabilit y introduced to emulate cities with different levels of structural heterogeneity . σ = 0 . 0 corresp onds to the baseline fragility-curv e distribution estimated from incremental dynamic analysis (IDA) for Milpitas, with no added heterogeneity . g denotes gravitational acceleration. 34 Extended Data Fig. 9: Regional building p ortfolios of Milpitas and San F rancisco, California. a , Building fo otprints of Milpitas (left) and northeastern San F rancisco (right), with an inset map showing their relative lo cations and the earthquake epicenter. b , Composition of the Milpitas p ortfolio by n umber of stories, y ear built, structure type, and occupancy class, showing the dominance of low-rise residential buildings. c , Same distributions for San F rancisco, rev ealing greater structural and functional diversit y across the urban core. Categories for structural type and o ccupancy class follow Hazus 6.1 [ 11 ]. 35 Extended Data Fig. 10: Comparison of p eak ground acceleration (PGA) distributions b etw een physics-based and empirical models across four earthquake magnitudes. Histograms show PGA from physics-based SCEC Broadband Platform (BBP) simulations and the empirical Chiou–Y oungs ground-motion prediction equation (GMPE) [ 7 ]. PGA w as sampled at 64 recording stations (the same for BBP and GMPE), uniformly distributed within Milpitas. F or each metho d, 100 realizations were generated, yielding 64 × 100 = 6 , 400 samples per histogram. Supplementary Figs. 19 – 22 sho w the corresponding station-by-station spatial comparisons for the four magnitudes. 36 Supplemen tary Information for: Phase T ransitions in Collectiv e Damage of Civil Structures under Natural Hazards Sebin Oh a , Jin yan Zhao b , Raul Rincon c , Jamie P adgett c , Ziqi W ang a, ∗ a Dep artment of Civil and Envir onmental Engine ering, University of California, Berkeley, CA, Unite d States of Americ a b Dep artment of Me chanic al and Civil Engine ering, California Institute of T e chnolo gy, Pasadena, CA, Unite d States of Americ a c Dep artment of Civil and Envir onmental Engine ering, Ric e University, Houston, TX, Unite d States of Americ a This PDF file includes: Supplemen tary Note 1 Supplemen tary Metho ds 1–6 Supplemen tary Figs. 1–22 References ∗ Corresponding author Email addr ess : ziqiwang@berkeley.edu (Ziqi W ang) T able of Con ten ts Supplemen tary Notes 40 Supplemen tary Note 1. Probabilistic simulations in regional-scale risk analysis . . . . . . . . . . . . 40 Supplemen tary Metho ds 41 Supplemen tary Metho d 1. Order parameter identification using principal comp onent analysis . . . 41 Supplemen tary Metho d 2. Non-zero temp erature simulation . . . . . . . . . . . . . . . . . . . . . . 43 Supplemen tary Metho d 3. Ising mo del revisited . . . . . . . . . . . . . . . . . . . . . . . . . . . . . 44 Supplemen tary Metho d 4. Ensemble-based estimation of susceptibility , correlations, and data- driv en Landau free energy . . . . . . . . . . . . . . . . . . . . . . . . . . . . . . . . . . . . . . 48 Supplemen tary Metho d 5. Simulation framework for regional-scale structural resp onses . . . . . . . 50 Supplemen tary Metho d 6. Implementation of regional-scale structural simulations . . . . . . . . . . 51 Supplemen tary Figures 55 Supplemen tary Fig. 1. Sensitivit y analysis: kernel densit y estimation (KDE)-based fragility curves 55 Supplemen tary Fig. 2. Sensitivity analysis: empirical ground-motion prediction equations (GMPEs) 56 Supplemen tary Fig. 3. Sensitivit y analysis: the North Berk eley building portfolio . . . . . . . . . . 57 Supplemen tary Fig. 4. Sensitivit y analysis: the Belm on t building p ortfolio . . . . . . . . . . . . . . 58 Supplemen tary Fig. 5. Explained-v ariance sp ectra from principal comp onent analysis (PCA) . . . 59 Supplemen tary Fig. 6. Equiv alence b etw een the first principal comp onent and the regional damage fraction . . . . . . . . . . . . . . . . . . . . . . . . . . . . . . . . . . . . . . . . . . . . . . . . 60 Supplemen tary Fig. 7. Evolution of the pro jected PCA space with increasing earthquak e magnitude for Milpitas . . . . . . . . . . . . . . . . . . . . . . . . . . . . . . . . . . . . . . . . . . . . . . 61 Supplemen tary Fig. 8. Evolution of the pro jected PCA space with increasing earthquak e magnitude for northeastern San F rancisco . . . . . . . . . . . . . . . . . . . . . . . . . . . . . . . . . . . 62 Supplemen tary Fig. 9. Evolution of the pro jected PCA space with increasing structural diversit y for Milpitas . . . . . . . . . . . . . . . . . . . . . . . . . . . . . . . . . . . . . . . . . . . . . . 63 Supplemen tary Fig. 10. Evolution of the pro jected PCA space with increasing structural diversit y for northeastern San F rancisco . . . . . . . . . . . . . . . . . . . . . . . . . . . . . . . . . . . 64 Supplemen tary Fig. 11. Data-driv en Landau free-energy landscap e . . . . . . . . . . . . . . . . . . 65 38 Supplemen tary Fig. 12. Equilibrium magnetization and susceptibility from the data-driven Landau free-energy landscap e . . . . . . . . . . . . . . . . . . . . . . . . . . . . . . . . . . . . . . . . . 66 Supplemen tary Fig. 13. Mean and quantile v alues of regional repair-cost distributions computed with and without engineering simplifications . . . . . . . . . . . . . . . . . . . . . . . . . . . . 67 Supplemen tary Fig. 14. Exceedance probabilities for t wo reference repair costs . . . . . . . . . . . 68 Supplemen tary Fig. 15. Distributions of building attributes for the Milpitas p ortfolio . . . . . . . . 69 Supplemen tary Fig. 16. Selected neigh b orho o ds in northeastern San F rancisco . . . . . . . . . . . . 70 Supplemen tary Fig. 17. Distributions of building attributes for the northeastern San F rancisco p ortfolio . . . . . . . . . . . . . . . . . . . . . . . . . . . . . . . . . . . . . . . . . . . . . . . . 71 Supplemen tary Fig. 18. Maps of the near-surface shear-w av e velocity V s 30 for Milpitas (left) and northeastern San F rancisco (righ t) . . . . . . . . . . . . . . . . . . . . . . . . . . . . . . . . . 72 Supplemen tary Fig. 19. Comparison of peak ground acceleration (PGA) distributions b etw een ph ysics-based and empirical mo dels at M w = 5 . 0 across recording stations . . . . . . . . . . . 73 Supplemen tary Fig. 20. Comparison of peak ground acceleration (PGA) distributions b etw een ph ysics-based and empirical mo dels at M w = 6 . 0 across recording stations . . . . . . . . . . . 74 Supplemen tary Fig. 21. Comparison of peak ground acceleration (PGA) distributions b etw een ph ysics-based and empirical mo dels at M w = 7 . 0 across recording stations . . . . . . . . . . . 75 Supplemen tary Fig. 22. Comparison of peak ground acceleration (PGA) distributions b etw een ph ysics-based and empirical mo dels at M w = 8 . 0 across recording stations . . . . . . . . . . . 76 Supplemen tary References 77 39 Supplemen tary Notes Supplemen tary Note 1. Probabilistic simulations in regional-scale risk analysis Regional-scale risk analysis to natural hazards fundamentally dep ends on probabilistic simulations. It is infeasible to directly observ e or exp erimen tally reproduce the full-scale resp onse of an en tire city to a nat- ural hazard. Field surv eys and p ost-disaster reconnaissance provide only limited, one-shot data p oin t that represen ts a single realization of complex sto chastic pro cesses. T o ov ercome this scarcit y of empirical obser- v ations, probabilistic simulations serve as an essential to ol for exploring the range of possible regional civil structural resp onses, quan tifying uncertainties, and identifying emergen t b eha viors that cannot b e captured from individual even ts alone. Suc h sim ulations enable researchers to represen t the inherent randomness in b oth hazard excitations and structural capacities, forming the foundation for assessing collective risk at the cit y or regional scale. 40 Supplemen tary Metho ds Supplemen tary Method 1. Order parameter identification using principal comp onent analysis Recen t studies hav e demonstrated that unsup ervised machine learning tec hniques can uncov er the underlying order parameters of complex systems directly from empirical data, without prior ph ysical assumptions [ 7 , 14 , 26 ]. While adopting the regional damage fraction as an order parameter follo ws naturally from the analogy b et ween the RFIM and regional sim ulations, we further verify that this order parameter can b e recov ered directly from the data itself, without presuming its form. T o this end, w e employ principal comp onent analysis (PCA) as a minimally parametric approac h to extract low-dimensional collective mo des from ensembles of simulation outcomes. The analyses are conducted for tw o study regions (Milpitas and northeastern San F rancisco) under t wo distinct sim ulation scenarios. In the first-order scenario, the earthquak e magnitude M w is v aried while structural diversit y is fixed at σ = 0 (no additional heterogeneity). In the second-order scenario, the structural div ersity σ is v aried while the magnitude is fixed at the critical v alue M w = M w c defined as the magnitude at whic h the a v erage damage fraction equals 0 . 5 . This design yields four analysis cases in total, one for each combination of region and scenario. F or eac h case, PCA is applied to ensem bles of realizations sampled across the corresp onding con trol parameter ( M w for the first-order and σ for the second-order scenario). The resulting explained-v ariance sp ectra are shown in Supplemen tary Fig. 5 . In all cases, the first principal comp onent dominates the total v ariance, particularly for the first-order scenarios where the system resp onse is gov erned b y a single collective mo de represen ting the abrupt transition b etw een the safe and damaged states. F or the second-order scenarios, the v ariance explained by the first comp onent is relativ ely lo wer, reflecting the distributed, con tinuous reorganization of the system across a broad range of structural div ersity . The explained v ariance for the San F rancisco cases is generally smaller than that of Milpitas, indicating the weak inter-building dependence in the San F rancisco region that renders the regional damage- fraction distribution appro ximately Gaussian. The equiv alence b etw een the first principal comp onent (PC1) and the regional damage fraction is demon- strated in Supplementary Fig. 6 . A cross all four analysis cases, PC1 exhibits a nearly one-to-one corresp on- dence with the damage fraction, confirming that the dominant collective mo de identified purely from the data coincides with the physically interpretable order parameter of the system. This alignmen t v alidates that the macroscopic organization of regional resp onses can b e fully captured by a single scalar quantit y , consisten t with the analogy b etw een magnetization in the random-field Ising mo del and the regional damage 41 fraction in cit y-scale simulations. The visual evolution of en sem bles pro jected on to the PC1–PC2 space is presented in Supplementary Figs. 7 – 10 . Under the first-order scenario (v arying M w at σ = 0 ), the Milpitas case exhibits an abrupt shift of the distribution along PC1 around M w ≈ 5 . 60 , marking a discontin uous transition from the collectiv ely safe to the collectively damaged state. In contrast, the San F rancisco case follows a smo oth tra jectory without a sudden jump, indicating the absence of a sharp first-order transition. Under the second-order scenario (v arying σ at fixed M w = M w c ), Milpitas shows a gradual merging of distributions along PC1, consistent with contin uous, second-order–like b eha vior. The San F rancisco case, by contrast, shows no fundamental reorganization across increasing σ , confirming that the region is already in a disordered, paramagnetic-lik e phase. T ogether, these PCA pro jections pro vide direct visual evidence that the nature of collective regional resp onse transitions is go verned b y the external excitation in tensity and by the strength of inter-building coupling. 42 Supplemen tary Metho d 2. Non-zero temp erature sim ulation Regional simulations describ ed in the main text corresp ond to a zero-temperature RFIM. In this setting, the safet y margin M = C − D , where C and D denotes structural capacity and hazard demand, resp ectively , fully determines the damage state: if M < 0 , the structure is classified as damaged; otherwise, it is safe. This deterministic assignment leav es no margin for uncertaint y , equiv alent to the zero-temp erature limit where thermal fluctuations are absen t. W e further examine the effect of allowing a pr ob abilistic mar gin to the safet y margin. F rom the p ersp ec- tiv e of the RFIM–regional sim ulation analogy , the safety margin M can b e regarded as the negative energy difference b etw een the damaged and safe states: M ∝ − ∆ E = − ( E damaged − E safe ) . Maximizing the entrop y under this constrain t yields the damage probability P ( Damage ) = 1 1 + exp ( M /T ) , where T denotes the probabilistic-margin parameter. This logistic form follo ws from the principle of max- im um entrop y . Constraining only the expected energy with an energy gap ∆ E (equiv alently M ∝ − ∆ E ), the maximum-en trop y distribution for the binary damage is the Boltzmann distribution, which yields the logistic damage probability . As T → 0 , the decision rule becomes fully deterministic, while larger T intro- duce increasing uncertaint y around the failure threshold. In the regional sim ulation context, T represents the epistemic uncertain ty or the degree of confidence in the hazard-structure mo del. Spatially av eraged damage fraction in the magnitude–temp erature space is shown in Extended Data Fig. 5 , rev ealing the progressiv e smo othing of the collective response as temp erature increases. Interestingly , the critical structural diversit y σ c , b eyond which the region no longer exhibits a first-order-like abrupt transition, v aries systematically with temp erature, as illustrated in Extended Data Fig. 6 . W e observe that σ c decreases as temp erature increases. This suggests that large uncertaint y in the hazard–structure mo del systematically obscures the emergence of collective b ehavior, smo othing out the distinct phases observed at low er uncertaint y levels. Maintaining a consisten t phase across analyses therefore b ecomes crucial for meaningful risk assessment. Conv ersely , pursuing excessively precise comp onent-lev el mo dels or datasets may yield limited returns for system-lev el decision-making, as microscopic refinements are often a veraged out when collective dynamics dominate. 43 Supplemen tary Metho d 3. Ising mo del revisited The classic al Ising mo del The Ising mo del pro vides a fundamental framework for describing collectiv e b ehavior that arises from inter- actions among man y coupled comp onents. In its general form, the system consists of N discrete sites that in teract with one another, each represen ted by a spin v ariable s i ∈ {− 1 , +1 } corresponding to one of tw o p ossible states. The total energy of a given configuration is expressed by the Hamiltonian H = − X i 0 , while the second term biases the spins tow ard the direction of the external field. The balance b et ween these t w o contributions determines the o verall alignment of the system. A t thermal equilibrium, the probability of observing a particular configuration { s i } follo ws the Boltzmann distribution, p ( { s i } ) = 1 Z exp ( − β H ) , where β = 1 / ( k B T ) is the inv erse temp erature, k B is the Boltzmann constant, T is the absolute temp er- ature, and Z is the partition function that ensures normalization. The macroscopic state of the system is c haracterized by the equilibrium magnetization m ⋆ ≡ ⟨ m ⟩ = 1 N N X i =1 ⟨ s i ⟩ , where ⟨ s i ⟩ denotes the thermal exp ectation v alue of spin s i . This quantit y serves as the order parameter, distinguishing different phases and capturing critical b ehavior. When the temp erature T is high, thermal fluctuations dominate and the spins are randomly oriented, leading to m ≈ 0 (a disordered phase). Below a critical temp erature T c , the system sp on taneously breaks symmetry and develops a nonzero magnetization ( m = ± m 0 , with m 0 > 0 ), indicating an ordered phase in whic h most spins align in the same direction. This sp on taneous symmetry breaking represents a contin uous (second-order) phase transition, providing a mini- mal mathematical represen tation of ho w local interactions can give rise to abrupt macroscopic organization. 44 R andom-field Ising mo del (RFIM) The RFIM extends the classical Ising framework by introducing spatial disorder through site-dep endent lo cal fields. The Hamiltonian of the RFIM is expressed as H = − X i 0) − P ( J m + H + h < 0) = 2Φ J m + H ∆ − 1 = erf J m + H √ 2 ∆ , (3) where Φ( · ) is the cumulativ e distribution function of the standard normal random v ariable. Equation ( 3 ) th us defines the equilibrium magnetization m ⋆ ≡ ⟨ m ⟩ as the fixed p oint of the mean-field map. L andau fr e e-ener gy formulation The equilibrium states of the mean-field RFIM can b e c haracterized b y a phenomenological Landau free- energy p otential F MF ( m ) , whose stationary p oints repro duce the self-consistent condition in Eq. ( 3 ). W e define its gradien t with resp ect to the order parameter m as ∂ F MF ∂ m = m − erf J m + H √ 2 ∆ , so that ∂ F MF /∂ m = 0 recov ers Eq. ( 3 ). Integrating with resp ect to m yields, up to an additiv e constan t C , F MF ( m ; H, ∆) = 1 2 m 2 − Z erf J m + H √ 2 ∆ d m + C = 1 2 m 2 − m + H J erf J m + H √ 2 ∆ − r 2 π ∆ J exp − ( J m + H ) 2 2∆ 2 + C . The shap e of F MF ( m ; H, ∆) provides an in tuitive picture of how disorder alters collectiv e b ehavior. F or 46 w eak disorder ( ∆ ≪ J ), the free-energy l andscape exhibits tw o symmetric minima separated b y a barrier, corresp onding to bistable ordered states with m = ± m 0 . As ∆ increases, the barrier gradually flattens and the tw o minima merge into a single well centered at m = 0 , exhibiting the disappearance of bistability and the onset of a con tinuous transition. The evolution of F MF ( m ) th us provides an intuitiv e picture of ho w lo cal heterogeneity smo oths out collectiv e order, linking the microscopic disorder strength to the macroscopic transition t yp e. In the context of regional-scale structural risk analysis, this free-energy landscap e represen ts the effectiv e p oten tial go verning the collectiv e damage state of the built en vironment. The emergence of bistable minima corresp onds to regimes where the region exhibits t wo distinct macroscopic states, i.e., collectiv ely safe and collectiv ely damaged, while the single well regime reflects a con tin uous response transition without abrupt shifts in collectiv e condition. 47 Supplemen tary Metho d 4. Ensemble-based estimation of susceptibilit y , correlations, and data- driv en Landau free energy T o quan tify collective sensitivity and spatial coherence, we compute the susceptibilit y χ and the connected t wo-point correlation function C ( r ) from the equilibrium ensemble at fixed ( M w , σ ) for a fixed p ortfolio realization (i.e., a fixed set of fragility curves). W e rep eat the calculation for 50 indep enden t p ortfolio real- izations, all at the same σ , to quan tify realization-to-realization v ariability and obtain robust distributions of χ and ξ . Equilibrium ensemble sele ction W e select the narro west interv al of the damage fraction m d , [ m d lo , m d hi ] , that con tains a fixed fraction f of the samples (w e use f = 0 . 10 , i.e., 1 , 000 of 10 , 000 ). Samples with m d ∈ [ m d lo , m d hi ] form the equilibrium ensem ble used to compute the ensemble av erage ⟨·⟩ for χ and C ( r ) . Conne cte d c orr elations F or each site i = 1 , · · · , N , we record s i ∈ {− 1 , +1 } across R = 10 , 000 realizations α = 1 , . . . , R at fixed ( M w , σ ) . Ensemble av erages are taken ov er realizations: ⟨ s i ⟩ = 1 R R X α =1 s ( α ) i , ⟨ s i s j ⟩ = 1 R R X α =1 s ( α ) i s ( α ) j . The connected correlation is C ( i, j ) = ⟨ s i s j ⟩ − ⟨ s i ⟩⟨ s j ⟩ . T o obtain a distance-dep enden t correlation, w e compute pairwise Euclidean distances r ij = ∥ x i − x j ∥ and radially av erage C ( i, j ) ov er all distinct pairs i < j whose distances fall in bins [ r, r + ∆ r ) , yielding C ( r ) . W e normalize b y the on-site v ariance, C (0) = 1 N N X i =1 ⟨ s 2 i ⟩ − ⟨ s i ⟩ 2 = 1 N N X i =1 1 − ⟨ s i ⟩ 2 , and rep ort C ( r ) /C (0) . Correlation lengths ξ are estimated by fitting C ( r ) /C (0) ∝ e − r/ξ o ver the range sho wn in Fig. 2e (using only bins with p ositive C ( r ) ). 48 Susc eptibility estimation fr om a p olynomial-fit L andau fr e e ener gy Susceptibilit y can also be expressed in terms of the free-ene rgy curv ature as χ − 1 = ∂ 2 F ∂ m 2 m = m ⋆ , where m ⋆ is the equilibrium order parameter. Here w e estimate χ from an empirical free-energy landscap e reconstructed from the sim ulated distribution of the regional order parameter m d . F or eac h ( M w , σ ) , we form the empirical distribution P ( m ) from a histogram of the damage fraction, mapp ed to m ∈ [ − 1 , 1] . Up to an additiv e constant, we define the empirical Landau free energy as F emp ( m ) = − ln P ( m ) , where a small additiv e offset is applied to P ( m ) to av oid ln 0 in empty bins. W e then construct a p olynomial-fit free energy F poly ( m ) by fitting F emp ( m ) with a p olynomial Landau form, F poly ( m ) = c 0 + c 1 m + c 2 m 2 + c 4 m 4 + c k m k , where k ≥ 6 is an even integer. The linear term c 1 m captures weak asymmetry in the empirical landscape, while the high-order stabilizing term c k m k enforces boundedness near | m | → 1 without materially affecting the fit around the minimum (i.e., the equilibrium). W e impose c k > 0 and fix k = 100 , which yields stable fits and prev ents spurious minima near the b ounds (Supplementary Fig. 11 ). F rom the fitted landscap e, the equilibrium magnetization m ⋆ is obtained by the stationary condition F ′ poly ( m ⋆ ) = 0 . The susceptibility is then estimated from the inv erse curv ature at the equilibrium magneti- zation, χ − 1 = ∂ 2 F poly ∂ m 2 m = m ⋆ . This curv ature-based definition is consistent with the mean-field linear-resp onse relation χ = ∂ ⟨ m ⟩ /∂ h , and pro vides a robust, quantitativ e measure of collective sensitivity from a finite ensemble. Supplementary Fig. 12 sho ws the estimated equilibrium order parameter m ⋆ and susceptibility χ for three representativ e v alues of σ . 49 Supplemen tary Metho d 5. Simulation framew ork for regional-scale structural resp onses F or a region consisting of n structures, consider a safety mar gin (or safety factor ) vector X ∈ R n , where eac h element X i denotes the safety margin of structure i . The damage state of each structure is determined based on its safety margin. F or instance, if a binary damage state is of in terest, the damage state DS i of structure i is defined as DS i = 1 , if X i ≤ 0 0 , if X i > 0 , where DS i indicates whether structure i has damaged ( DS i = 1 ) or not ( DS i = 0 ). T o capture the uncer- tain ties inherent in hazard ev ents and structural resp onses, eac h safety margin X i is mo deled as a random v ariable. The failure probability of structure i , denoted b y P f i , is then giv en by P f i = P ( X i ≤ 0) , whic h dep ends on the probability distribution of X i . Since our interest lies in the collective b ehavior of m ultiple structures, the joint probability distribution of the vector X b ecomes cen tral. In other w ords, regional-scale risk analyses and simulations focus on characterizing the joint distribution of X , including its mean vector, cov ariance matrix, and distribution type. This p ersp ectiv e encompasses b oth sto chastic and physics-based approac hes, where the resulting distribution may not b elong to an y standard family of probabilit y distributions. In such cases, the distribution can b e dev elop ed through rep eated simulations under v arying sources of uncertaint y . In structural engineering practices, the first- and the second-order central and cross momen ts of X are often av ailable; the reliabilit y of individual structures typically needs to b e assessed during the design phase, whic h requires the mean and v ariance of the safety margin. Many metho ds can b e used to calculate the first- and the second-order central moments, including full-size exp eriments to high-fidelit y finite element analyses with accurate ph ysical parameters, while the in ter-building correlation has recen tly b egun to gain atten tion [ 13 , 16 , 28 – 30 ]. Oh et al. [ 22 ] presen ted an unbiased approach for constructing a joint probability distribution of X based on the principle of maxim um entrop y , given that the first- and second-order cen tral momen ts are known. 50 Supplemen tary Metho d 6. Implementation of regional-scale structural simulations R e gional data r etrieval All data used in this study were obtained from publicly accessible rep ositories and open-source libraries to ensure reproducibility . The datasets encompass building inv en tories, ground-motion records, and adminis- trativ e b oundaries, which together form the basis of the regional simulations. Building-lev el attributes were retrieved from the NHERI SimCenter Earthquake T estb e d for the San F r ancisc o Bay Ar e a [ 21 ]. The database provides detailed information on the num b er of stories, construction y ear, structural type, o ccupancy class, plan area, repair cost, and replacement cost for more than 200,000 buildings in the region. T w o subsets were used in this study: (1) the city of Milpitas, including 5,943 m ulti-story buildings, and (2) the northeastern districts of San F rancisco, comprising 6,323 buildings across mixed structural types. The data were accessed through the DesignSafe DataDep ot (PRJ-3880 [ 32 ]) and formatted as geospatial la yers to enable spatial mapping and structural mo del generation. A total of 100 empirical ground-motion acceleration records were obtained from the Enhanc ement of Next Gener ation A ttenuation R elationships for W estern US (NGA-W est2) database [ 2 , 6 ]. The NGA- W est2 database pro vides a comprehensive collection of uniformly processed strong-motion records from shallo w-crustal earthquakes in active tectonic regions. The retriev ed 100 time-history records w ere used to p erform incremen tal dynamic analyses for estimating structural capacities. These motions represen t crustal earthquakes recorded in California and w ere scaled to v arying intensit y levels following the pro cedure describ ed in the Metho ds . Cit y b oundaries and building fo otprin ts were generated using the op en-source OSMnx library [ 4 ] with base map data from OpenStreetMap [ 23 ]. Neigh b orho o d b oundaries for San F rancisco w ere obtained from the Analysis Neighb orho o ds dataset on the San F rancisco Op en Data Portal [ 11 ]. All retrieved p olygons w ere pro jected to the EPSG:3857 co ordinate system and used to clip and visualize the regional building p ortfolios. Structur al c ap acity mo deling W e adopt the p eak inter-story drift ratio (IDR) as the engineering demand parameter (EDP). F or each structural type and design era, the Hazus Earthquake Mo del T e chnic al Manual (V ersion 6.1; FEMA, 2024) defines threshold drift ratios at which a building is considered to hav e reac hed the slight-damage state [ 12 ]. Building capacity is defined as the ground-motion intensit y measure (IM) at which the mo del first reaches 51 this sligh t-damage EDP under record scaling. The peak ground acceleration (PGA) is adopted as the in tensity measure, expressed in units of g , the gravitational acceleration. F ollo wing the baseline approach of Lu et al. [ 18 ], as adopted in the SimCenter R2D T o ol [ 21 ], we devel- op ed a multi–degree-of-freedom (MDOF) shear mo del for each building using the Hazus 6.1 tabulations [ 12 ], c haracterized by fundamental building attributes such as the n umber of stories, structural material, con- struction year, and plan area. Eac h model is a planar system with one lateral degree of freedom p er story (rigid diaphragm action at flo or levels). Story resp onse is represen ted by zero-length elements with a uni- axial h ysteretic material capturing yielding, cyclic degradation, and pinching. Mo dels are implemented in Op enSeesPy [ 20 , 31 ]. Incremen tal dynamic analyses (IDA) [ 25 ] were p erformed with 100 empirical NGA-W est2 ground-motion records. Each record was scaled until the structure reached its slight-damage drift-ratio limit, pro ducing one threshold IM (here, PGA) p er record. The resulting 100 threshold PGAs p er building constitute a capacity sample in terms of PGA, from whic h the building-level fragility curve is derived. The ID A-deriv ed capacit y samples were con verted into probabilistic models at the building lev el to propagate uncertain ty in regional simulations. In the main text, we employ a parametric lognormal mo del; in the Supplemen tary Information, we also rep ort a non-parametric alternative to assess sensitivity to distributional assumptions. In earthquak e engineering practice, building-level fragilit y curves are most commonly mo deled as log- normal, and this con ven tion is adopted widely in guidelines and applications (e.g., Hazus 6.1 [ 12 ]; FEMA P-58 [ 3 ]). A ccordingly , for each building i with structural capacit y C i , we mo del ln C i ∼ N ( µ i , σ 2 i ) with ( µ i , σ i ) calibrated from the 100 samples. The resulting fragility (probability of damage at a given IM ) is P ( Damage ≥ Slight | IM) = Φ ln IM − µ i σ i , where Φ is the standard normal cum ulative distribution function (CDF). T o ev aluate the impact of distributional assumptions, we also construct building-level fragility curves di- rectly from the capacity samples using Gaussian kernel densit y estimation (KDE) on ln C , without imp osing a parametric form. The KDE-based density is n umerically in tegrated to obtain a CDF, which represents the individual fragility curves for buildings [ 9 , 19 ]. Supplementary Figs. 1 present the resulting fragility curv es and the corresp onding regional sim ulation outcomes. W e preserve inter-building dep endence betw een structural capacities by estimating regional correlations 52 from the ensemble of 100 ID A-based capacity samples and retaining this correlation structure when sampling capacities for regional analyses. This captures common-source v ariability arising from shared structural attributes. F or the KDE-based fragility curves, we emplo y a Gaussian copula to imp ose the same correlation matrix on the non-parametric marginals, ensuring that both the parametric and non-parametric formulations main tain consistent inter-building dep endence in regional simulations. Hazar d demand mo deling W e adopt the p eak ground acceleration (PGA) as the ground-motion intensit y measure at each building lo cation, representing the maximum horizontal acceleration exp erienced during an earthquake. F or each earthquak e scenario, spatial PGA fields are computed using empirical ground-motion prediction equations (GMPEs) based on predefined earthquak e scenarios that are ph ysically plausible for the study regions. T o ensure b oth statistical realism and physical consistency with regional seismotectonic conditions, physics- based ground-motion simulations are also p erformed for selected scenarios to cross-v alidate the PGA fields deriv ed from the GMPEs. The earthquak e scenarios were defined by v arying the moment magnitude M w from 3.5 to 8.5 in in- cremen ts of 0.05, in which reliabilit y of the adopted GMPEs is ensured, cov ering the sufficien t range from small to large regional even ts. All scenarios share a common epicenter lo cated at latitude 37.666 ° N and longitude 122.076 ° W, appro ximately along the cen tral segment of the Ha yward fault, which p oses one of the most significan t seismic threats to the San F rancisco Bay Area. Since the Ha yward fault is a right-lateral strik e-slip fault, the fault geometry is defined b y a strike of 325 ° , dip of 90 ° , and rake of 180 ° , representing a near-v ertical, righ t-lateral strik e-slip mechanism typical of the Ha yward fault system. The depth to the top of the rupture plane is set to 3 km, consistent with empirical observ ations of shallo w crustal earthquakes in California. These configurations ensure that the generated ground-motion fields are b oth realistic and represen tative of the dominant regional seismotectonic conditions. F or eac h scenario, we compute spatial fields of the logarithmic PGA mean and standard deviation at ev ery building location using the Enhanc ement of Next Gener ation A ttenuation R elationships for W estern U.S. (NGA-W est2) GMPE of Chiou and Y oungs [ 10 ] (CY14). The selected GMPE is implemented through the pygmm Python library [ 17 ]. The rupture geometry defined ab o ve is employ ed, while the V s 30 v alue at each lo cation is retrieved from Thompson [ 24 ] (Supplementary Fig. 18 ) and the rupture length L and width W are estimated from the moment magnitude M w using the empirical regressions of W ells and Copp ersmith [ 27 ]. Spatial correlation of intra-ev en t residuals was mo deled following Jay aram et al. [ 15 ] with an exp onen tial deca y function, ensuring realistic spatial v ariabilit y in ground-motion intensit y . 53 Differen t empirical GMPEs are applied to the b enchmark Milpitas example, including the Abraham- son–Silv a–Kamai 2014 (ASK14) GMPE [ 1 ], the Bo ore–Stew art–Seyhan–Atkinson 2014 (BSSA14) GMPE [ 5 ], and the Campb ell–Bozorgnia 2014 (CB14) GMPE [ 8 ], all of which are suitable for active tectonic regions suc h as California. Supplementary Figs. 2 presen t the sensitivity analysis comparing the regional simulation outcomes obtained using these differen t GMPEs. T o complement the empirical mo dels, we emplo y the Southern California Earthquake Center Br o adb and Platform (SCEC-BBP) to simulate three-dimensional broadband ground motions. F or the same earthquake scenarios and input parameters used in the GMPE analyses, time histories are ge nerated on an 8 grid (64 recording stations) within the study region, and the corresp onding PGA v alues are extracted. These sim ulations capture long-p erio d basin effects and rupture directivit y patterns that empirical models cannot represen t. The simulated and GMPE-based PGA maps are cross-v alidated to confirm the realism of the generated ground-motion intensit y fields, whic h are presen ted in Extended Data Fig. 10 and Supplementary Figs. 19 to 22 . 54 Supplemen tary Figures Supplementary Fig. 1: Sensitivit y analysis: kernel density estimation (KDE)-based fragility curves. a , Comparison of fragility curves for the Milpitas p ortfolio constructed using the con ven tional lognormal form (left) and the KDE-based non- parametric form (right). b , Evolution of regional damage-fraction distributions with increasing earthquake magn itude when the KDE-based fragility curves are used. c , Empirical phase diagram of the Milpitas p ortfolio obtained using the KDE-based fragility curves. It preserves the k ey features of the phase diagram shown in Fig. 2b of the main text, which is constructed using lognormal fragility curv es. 55 Supplementary Fig. 2: Sensitivity analysis: empirical ground-motion prediction equations (GMPEs). The b ench- mark Milpitas p ortfolio is ev aluated using three NGA-W est2 GMPEs. F or each mo del, the evolution of regional damage-fraction distributions with earthquake magnitude (left) and the corresp onding empirical phase diagram (right) are sho wn. a , Abra- hamson–Silv a–Kamai 2014 (ASK14) [ 1 ]. b , Boore–Stewart–Seyhan–Atkinson 2014 (BSSA14) [ 5 ]. c , Campb ell–Bozorgnia 2014 (CB14) [ 8 ]. All three preserve the key features of the phase diagram in Fig. 2b of the main text, which is constructed using the Chiou–Y oungs 2014 (CY14) mo del [ 10 ]. 56 Supplementary Fig. 3: Sensitivity analysis: the North Berkeley building p ortfolio. a , Map of the near-surface shear- wa v e velocity V s 30 across the North Berkeley region. b , Distributions of k ey building attributes, including plan area, num b er of stories, construction year, residential units, o ccupancy class, and structural type. c , Evolution of regional damage-fraction distributions with increasing earthquake magnitude for the North Berkeley portfolio. d , Empirical phase diagram sho wing the collective structural resp onse as a function of structural diversit y σ and earthquake magnitude. Since the num b ers of single-story and multi-story buildings are comparable, while other factors that strongly influence seismic response are relatively uniform across the region, the North Berkeley portfolio exhibits three collectiv e states with t wo transition b oundaries. 57 Supplementary Fig. 4: Sensitivity analysis: the Belmont building p ortfolio. a , Map of the near-surface shear-wa ve velocity V s 30 across the Belmont region. b , Distributions of key building attributes, including plan area, num b er of stories, construction year, residential units, o ccupancy class, and structural type. c , Evolution of regional damage-fraction distributions with increasing earthquake magnitude for the Belmont p ortfolio. d , Empirical phase diagram showing the collective structural response as a function of structural diversity σ and earthquak e magnitude. Due to the single-story–dominant building p ortfolio and the high V s 30 v alues across the region, Belmont shows little transition b ehavior and remains predominantly in the collectively safe state throughout the examined parameter range. 58 Supplementary Fig. 5: Explained-v ariance spectra from principal comp onent analysis (PCA). Explained v ariance ratios of successive principal comp onents are shown on linear (left) and log–log (righ t) scales for four analysis cases: Milpitas and northeastern San F rancisco under first-order (fixed σ = 0 ) and second-order (fixed M w = M w c ) conditions. The first principal comp onent dominates the v ariance, particularly for the first-order scenarios, indicating that the collective behavior is largely captured b y a single order parameter. F or the second-order scenarios, the v ariance is distributed across multiple components, consistent with the gradual and correlated reorganization of the system as structural diversit y increases. The ov erall lo wer explained v ariance in the San F rancisco cases reflects weak er inter-building dependence and a more Gaussian-like distribution of regional damage fractions. 59 Supplementary Fig. 6: Equiv alence b etw een the first principal comp onent and the regional damage fraction. The first principal component (PC1) obtained from principal comp onent analysis (PCA) is plotted against the regional damage fraction for tw o study regions (Milpitas and northeastern San F rancisco) under t wo sim ulation scenarios. The top ro w shows the first-order scenario, where the earthquak e magnitude M w is v aried at fixed structural diversit y σ = 0 , and the bottom ro w shows the second-order scenario, where σ is v aried at fixed M w = M w c . T en realizations are shown for each control parameter ( M w or σ ), where eac h p oint represents a single sim ulation realization, colored by the corresp onding con trol parameter. In all cases, PC1 exhibits a near one-to-one corresp ondence with the damage fraction, demonstrating that the dominant mo de identified purely from data coincides with the ph ysically in terpretable order parameter of the system. 60 Supplementary Fig. 7: Evolution of the pro jected PCA space with increasing earthquak e magnitude for Milpitas. Simulation realizations are pro jected into the space spanned b y the first and second principal comp onents (PC1 and PC2) at fixed structural diversit y σ = 0 . 0 as the earthquake magnitude M w increases. Each panel corresp onds to a different ( M w , σ ) condition, with color indicating the normalized o ccurrence frequency from 5,000 realizations. The distribution exhibits an abrupt shift from the left to the right cluster in PC1 around M w ≈ 5 . 60 , marking a sudden transition from the collectively safe to the collectively damaged state, c haracteristic of a first-order phase transition. 61 Supplementary Fig. 8: Evolution of the pro jected PCA space with increasing earthquake magnitude for north- eastern San F rancisco. Same analysis setup as in Supplemen tary Fig. 7 , performed for San F rancisco at fixed structural diversit y σ = 0 . 0 . As M w increases, the distribution shifts gradually and forms a smo oth curved tra jectory along PC1–PC2 without an abrupt jump, indicating the absence of a sharp first-order transition. This con tinuous ev olution reflects weak er inter-building coupling and higher intrinsic diversit y in the San F rancisco region. 62 Supplementary Fig. 9: Evolution of the pro jected PCA space with increasing structural diversit y for Milpitas. Simulation realizations are pro jected into the space spanned by PC1 and PC2 for Milpitas at fixed earthquake magnitude M w = 5 . 60 under increasing structural diversity σ . Each panel shows the normalized occurrence frequency computed from 5,000 realizations. With increasing σ , the initially bimo dal distribution along PC1 gradually merges into a single broadened cluster, reflecting a contin uous transition from an ordered to a disordered regime, consisten t with second-order–like behavior. 63 Supplementary Fig. 10: Evolution of the pro jected PCA space with increasing structural diversit y for northeastern San F rancisco. Same analysis setup as in Supplementary Fig. 9 , performed for San F rancisco at fixed earthquake magnitude M w = 6 . 38 . As σ increases, the distribution contracts slightly tow ard the cen tral cluster but does not exhibit any fundamental reorganization across structural diversit y . This b ehavior visually confirms that the region remains in a disordered, paramagnetic- like phase without undergoing a phase transition. 64 Supplementary Fig. 11: Data-driv en Landau free-energy landscap e. F or each ( M w , σ ) , we form the empirical distribution P ( m ) by histogramming the simulated damage fraction m d after mapping to m ∈ [ − 1 , 1] (with m d = ( m + 1) / 2 ), and define the empirical free energy F emp ( m ) ∝ − ln P ( m ) . W e fit F emp ( m ) with a polynomial Landau form F poly ( m ) = c 0 + c 1 m + c 2 m 2 + c 4 m 4 + c k m k , using k = 100 for the stabilizing high-order term. The 3D surface (top) shows F emp ( m ) , and the 2D pro jections (b ottom) show cross-sections with the fitted F poly ( m ) for three representative cases: σ < σ c (left), σ ≈ σ c (center), and σ > σ c (right). This polynomial-fit Landau free energy enables curv ature-based susceptibility estimates (Supplementary Fig. 12 ). 65 Supplementary Fig. 12: Equilibrium magnetization and susceptibility from the data-driv en Landau free-energy landscap e. Equilibrium magnetization m ⋆ (left) and curv ature-based susceptibility χ inferred from the p olynomial-fit empirical free energy F poly ( m ) (Supplemen tary Method 4; Supplemen tary Fig. 11 ). Blue, red, and yello w indicate M w = 5 . 55 , 5 . 60 , and 5 . 65 cases. F or each ( M w , σ ) , m ⋆ is obtained from the minimum of F poly ( m ) and χ from the inv erse curv ature at m ⋆ , χ − 1 = ∂ 2 F poly /∂ m 2 m = m ⋆ . The center and right panels rep ort χ at criticality ( M w = M w c ) and near criticality ( M w ≈ M w c ), respectively . Markers show simulation-based estimates from a single p ortfolio realization and dashed lines indicate the mean- field prediction. The lingering magnetization and slowly decaying susceptibility for σ > σ c are consistent with the Griffiths-like behavior describ ed in Figs. 2d,e 66 Supplementary Fig. 13: Mean and quan tile v alues of regional repair-cost distributions computed with and without engineering simplifications. Left: northeastern San F rancisco p ortfolio; right: Milpitas p ortfolio. The bac kground violins show the full repair-cost distributions at representativ e earthquake magnitudes. Mean repair costs are largely insensitive to engineering simplifications, whereas the low er and upp er 5% quantiles differ substantially . In the northeastern San F rancisco case (left), structural categorization pushes the low er and upp er quantile curves farther apart; ov erestimating upp er-tail losses and underestimating lo wer-tail losses. In Milpitas (righ t), the conditional-indep endence assumption has the opp osite effect, drawing the tw o quantile curves closer together by reducing upper-tail losses and inflating low er-tail estimates. 67 Supplementary Fig. 14: Exceedance probabilities for tw o reference repair costs. Left: northeastern San F rancisco portfolio; right: Milpitas p ortfolio. Curves show the probability that regional repair costs exceed two reference thresholds (circles: lower threshold; crosses: higher threshold) with and without engineering simplifications. In b oth regions, exceedance probabilities shift noticeably when engineering simplifications are applied. 68 Supplementary Fig. 15: Distributions of building attributes for the Milpitas p ortfolio. Histograms sho w the distribu- tions of key building attributes, including plan area, number of stories, construction year, residen tial units, occupancy class, and structure type. Insets magnify the histograms near small v alues. 69 Supplementary Fig. 16: Selected neigh b orho o ds in northeastern San F rancisco. The analyzed region includes ma jor commercial districts suc h as the Financial District and Mission Bay , as well as residen tial neighborho o ds including P acific Heights and Hayes V alley . The highligh ted area represents the subset of neighborho ods selected for the building p ortfolio analysis. 70 Supplementary Fig. 17: Distributions of building attributes for the northeastern San F rancisco p ortfolio. His- tograms sho w the distributions of key building attributes, including plan area, num ber of stories, construction year, residential units, o ccupancy class, and structure type. Insets magnify the histograms near small v alues. 71 Supplementary Fig. 18: Maps of the near-surface shear-w av e velocity V s 30 for Milpitas (left) and northeastern San F rancisco (righ t). The v alues are retrieved from Thompson [ 24 ]. The selected San F rancisco region exhibits greater heterogeneity in this geomechanical prop erty , which strongly influences seismic resp onse, as well as greater v ariation in building types. 72 Supplementary Fig. 19: Comparison of p eak ground acceleration (PGA) distributions b et ween physics-based and empirical mo dels at M w = 5 . 0 across recording stations. Histograms compare PGA v alues obtained from the ph ysics- based SCEC Broadband Platform (BBP) sim ulations and the empirical Chiou and Y oungs ground-motion prediction equation (GMPE). Both datasets were sampled at the same 64 recording stations (S1–S64) uniformly distributed across Milpitas, with 100 realizations generated for each method. 73 Supplementary Fig. 20: Comparison of p eak ground acceleration (PGA) distributions b et ween physics-based and empirical mo dels at M w = 6 . 0 across recording stations. Histograms compare PGA v alues obtained from the ph ysics- based SCEC Broadband Platform (BBP) sim ulations and the empirical Chiou and Y oungs ground-motion prediction equation (GMPE). Both datasets were sampled at the same 64 recording stations (S1–S64) uniformly distributed across Milpitas, with 100 realizations generated for each method. 74 Supplementary Fig. 21: Comparison of p eak ground acceleration (PGA) distributions b et ween physics-based and empirical mo dels at M w = 7 . 0 across recording stations. Histograms compare PGA v alues obtained from the ph ysics- based SCEC Broadband Platform (BBP) sim ulations and the empirical Chiou and Y oungs ground-motion prediction equation (GMPE). Both datasets were sampled at the same 64 recording stations (S1–S64) uniformly distributed across Milpitas, with 100 realizations generated for each method. 75 Supplementary Fig. 22: Comparison of p eak ground acceleration (PGA) distributions b et ween physics-based and empirical mo dels at M w = 8 . 0 across recording stations. Histograms compare PGA v alues obtained from the ph ysics- based SCEC Broadband Platform (BBP) sim ulations and the empirical Chiou and Y oungs ground-motion prediction equation (GMPE). Both datasets were sampled at the same 64 recording stations (S1–S64) uniformly distributed across Milpitas, with 100 realizations generated for each method. 76 Supplemen tary References [1] Norman A. Abrahamson, W alter J. Silv a, and Ronnie Kamai. Summary of the ASK14 Ground Mo- tion Relation for Activ e Crustal Regions. Earthquake Sp e ctr a , 30(3):1025–1055, August 2014. ISSN 8755-2930, 1944-8201. doi: 10.1193/070913EQS198M. URL https://journals.sagepub.com/doi/ 10.1193/070913EQS198M . [2] Timoth y D. Anc heta, Robert B. Darragh, Jonathan P . Stewart, Emel Seyhan, W alter J. Silv a, Brian S.- J. Chiou, Katie E. W o o ddell, Rob ert W. Gra v es, Alb ert R. K ottke, David M. Bo ore, T adahiro Kishida, and Jennifer L. Donahue. NGA-W est2 Database. Earthquake Sp e ctr a , 30(3):989–1005, August 2014. ISSN 8755-2930, 1944-8201. doi: 10.1193/070913EQS197M. URL https://journals.sagepub.com/ doi/10.1193/070913EQS197M . [3] Applied T echnology Council. Seismic performance assessment of buildings, volume 1 – metho dology , second edition. T echnical Report FEMA P-58-1, F ederal Emergency Management Agency (FEMA), W ashington, D.C., Decem ber 2018. URL https://www.atcouncil.org/ . Prepared by the Applied T ec hnology Council for the F ederal Emergency Management Agency . Pro ject Officers: Michael Mahoney and Rob ert D. Hanson. [4] Geoff Bo eing. Mo deling and Analyzing Urban Netw orks and Amenities With OSMnx. Ge o gr aphic al A nalysis , 57(4):567–577, Octob er 2025. ISSN 0016-7363, 1538-4632. doi: 10.1111/gean.70009. URL https://onlinelibrary.wiley.com/doi/10.1111/gean.70009 . [5] Da vid M. Bo ore, Jonathan P . Stew art, Emel Seyhan, and Gail M. Atkinson. NGA-W est2 Equations for Predicting PGA, PGV, and 5% Damp ed PSA for Shallow Crustal Earthquakes. Earthquake Sp e ctr a , 30(3):1057–1085, August 2014. ISSN 8755-2930, 1944-8201. doi: 10.1193/070113EQS184M. URL https://journals.sagepub.com/doi/10.1193/070113EQS184M . [6] Y ousef Bozorgnia, Norman A. Abrahamson, Linda Al Atik, Timoth y D. Ancheta, Gail M. Atkinson, Jac k W. Baker, Annemarie Balta y , David M. Bo ore, Kenneth W. Campb ell, Brian S.J. Chiou, Robert Darragh, Stev e Da y , Jennifer Donah ue, Robert W. Gra ves, Nick Gregor, Thomas Hanks, I. M. Idriss, Ronnie Kamai, T adahiro Kishida, Albert K ottk e, Stephen A. Mahin, Sanaz Rezaeian, Badie Row- shandel, Emel Seyhan, Shrey Shahi, T om Shantz, W alter Silv a, P aul Spudich, Jonathan P . Stewart, Jennie W atson-Lamprey , Kathryn W o o ddell, and Robert Y oungs. NGA-W est2 researc h pro ject. Earth- 77 quake Sp e ctr a , 30(3):973–987, August 2014. ISSN 19448201. doi: 10.1193/072113EQS209M. Publisher: Earthquak e Engineering Research Institute. [7] Serena Bradde and William Bialek. PCA Meets RG. Journal of Statistic al Physics , 167(3-4):462–475, Ma y 2017. ISSN 0022-4715, 1572-9613. doi: 10.1007/s10955- 017- 1770- 6. URL http://link.springer. com/10.1007/s10955- 017- 1770- 6 . [8] Kenneth W. Campb ell and Y ousef Bozorgnia. NGA-W est2 Ground Motion Mo del for the A verage Hori- zon tal Compone n ts of PGA, PGV, and 5% Damp ed Linear Acceleration Resp onse Spectra. Earthquake Sp e ctr a , 30(3):1087–1115, August 2014. ISSN 8755-2930, 1944-8201. doi: 10.1193/062913EQS175M. URL https://journals.sagepub.com/doi/10.1193/062913EQS175M . [9] Xu-Y ang Cao, De-Cheng F eng, and Mic hael Beer. A KDE-based non-parametric cloud approach for efficien t seismic fragility estimation of structures under non-stationary excitation. Me chanic al Systems and Signal Pr o c essing , 205:110873, December 2023. ISSN 08883270. doi: 10.1016/j.ymssp.2023.110873. URL https://linkinghub.elsevier.com/retrieve/pii/S0888327023007811 . [10] Brian S.-J. Chiou and Robert R. Y oungs. Update of the Chiou and Y oungs NGA Model for the A v erage Horizontal Component of Peak Ground Motion and Resp onse Sp ectra. Earthquake Sp e ctr a , 30(3):1117–1153, August 2014. ISSN 8755-2930, 1944-8201. doi: 10.1193/072813EQS219M. URL https://journals.sagepub.com/doi/10.1193/072813EQS219M . [11] Cit y and Coun t y of San F rancisco. Analysis neigh borho o ds. https://data.sfgov.org/dataset/ Analysis- Neighborhoods/p5b7- 5n3h , 2024. Accessed Octob er 21, 2025. [12] F ederal Emergency Management Agency (FEMA). Hazus Earthquak e Mo del T echnical Manual: Hazus 6.1. T echnical rep ort, F ederal Emergency Management Agency , W ashington, D.C., July 2024. URL https://www.fema.gov/flood- maps/products- tools/hazus . [13] P ablo Heresi and Eduardo Miranda. Structure-to-structure damage correlation for scenario-based re- gional seismic risk assessment. Structur al Safety , 95, Marc h 2022. ISSN 01674730. doi: 10.1016/j. strusafe.2021.102155. Publisher: Elsevier B.V. [14] W enjian Hu, Ra jiv R. P . Singh, and Ric hard T. Scalettar. Discov ering phases, phase transitions, and crosso vers through unsup ervised machine learning: A critical examination. Physic al R eview E , 95(6): 062122, June 2017. ISSN 2470-0045, 2470-0053. doi: 10.1103/PhysRevE.95.062122. URL https: //link.aps.org/doi/10.1103/PhysRevE.95.062122 . 78 [15] Nirmal Jay aram, Jac k W Bak er, N Jay aram, and J W Baker. Correlation mo del for spatially dis- tributed ground-motion intensities. Earthquake Engine ering & Structur al Dynamics , 38(15):1687–1708, 12 2009. ISSN 1096-9845. doi: 10.1002/EQE.922. URL https://onlinelibrary.wiley.com/ doi/full/10.1002/eqe.922https://onlinelibrary.wiley.com/doi/abs/10.1002/eqe.922https: //onlinelibrary.wiley.com/doi/10.1002/eqe.922 . [16] Ch ulyoung Kang, Oh Sung Kw on, and Junho Song. Ev aluation of correlation b et ween engineering demand parameters of structures for seismic system reliability analysis. Structur al Safety , 93, 11 2021. ISSN 01674730. doi: 10.1016/j.strusafe.2021.102133. [17] Alb ert Kottk e, Greg La vren tiadis, Nasser Marafi, M. Bahrampouri, and Renmin Pretell. ark ot- tk e/pygmm: v0.8.0 (2025-07-24), 2025. URL https://doi.org/10.5281/zenodo.16422451 . [18] Xinzheng Lu, F rank McKenna, Qingle Cheng, Zhen Xu, Xiang Zeng, and Stephen A Mahin. An op en- source framework for regional earthquake loss estimation using the cit y-scale nonlinear time history analysis. Earthquake Sp e ctr a , 36(2):806–831, Ma y 2020. ISSN 8755-2930, 1944-8201. doi: 10.1177/ 8755293019891724. URL https://journals.sagepub.com/doi/10.1177/8755293019891724 . [19] Ch u Mai, Katerina K onakli, and Bruno Sudret. Seismic fragility curves for structures using non- parametric representations. F r ontiers of Structur al and Civil Engine ering , 11(2):169–186, June 2017. ISSN 2095-2430, 2095-2449. doi: 10.1007/s11709- 017- 0385- y. URL http://link.springer.com/10. 1007/s11709- 017- 0385- y . [20] F rank McKenna. Op enSees: A F ramework for Earthquak e Engineering Simulation. Computing in Scienc e & Engine ering , 13(4):58–66, 2011. [21] F rank McKenna, Stev an Gavrilo vic, Jiny an Zhao, Kuanshi Zhong, Adam Zsarno czay , Barbaros Cetiner, Sina Naeimi, Sang ri Yi, Ak ash Bangalore Satish, Amin Pac kzad, P edro Arduino, and W ael Elhaddad. NHERI-SimCen ter/R2DT o ol: V ersion 5.5.0 (v5.5.0), 2025. URL https://doi.org/10.5281/zenodo. 16884221 . NHERI SimCenter, Rapid Regional Resilience Determination T o ol (R2DT o ol). [22] Sebin Oh, Sangri Yi, and Ziqi W ang. Long-range Ising mo del for regional-scale seismic risk analysis. Earthquake Engine ering & Structur al Dynamics , 53(12):3904–3923, 2024. [23] Op enStreetMap contributors. Planet dump retrieved from https://planet.osm.org . https://www. openstreetmap.org , 2017. 79 [24] Eric M. Thompson. An up dated V s30 map for california with geologic and top ographic constrain ts (v er. 2.0, july 2022), 2018. URL https://doi.org/10.5066/F7JQ108S . U.S. Geological Survey data release. [25] Dimitrios V amv atsikos and C. Allin Cornell. Incremental dynamic analysis. Earthquake Engine ering & Structur al Dynamics , 31(3):491–514, March 2002. ISSN 0098-8847, 1096-9845. doi: 10.1002/eqe.141. URL https://onlinelibrary.wiley.com/doi/10.1002/eqe.141 . [26] Lei W ang. Discov ering phase transitions with unsup ervised learning. Physic al R eview B , 94(19):195105, No vem ber 2016. ISSN 2469-9950, 2469-9969. doi: 10.1103/PhysRevB.94.195105. URL https://link. aps.org/doi/10.1103/PhysRevB.94.195105 . [27] Donald L. W ells and Kevin J. Copp ersmith. New empirical relationships among magnitude, rup- ture length, rupture width, rupture area, and surface displacement. Bul letin of the Seismolo gi- c al So ciety of A meric a , 84(4):974–1002, August 1994. ISSN 1943-3573, 0037-1106. doi: 10.1785/ BSSA0840040974. URL https://pubs.geoscienceworld.org/bssa/article/84/4/974/119792/ New- empirical- relationships- among- magnitude . [28] Meng jie Xiang, Jiaxu Shen, Zekun Xu, and Jun Chen. Structure-to-structure seismic damage correlation mo del. Earthquake Engine ering & Structur al Dynamics , 53(10):3205–3229, 2024. ISSN 1096-9845. doi: 10.1002/eqe.4172. URL https://onlinelibrary.wiley.com/doi/abs/10.1002/eqe.4172 . _eprint: h ttps://onlinelibrary .wiley .com/doi/p df/10.1002/eqe.4172. [29] Tian Y ou and Solomon T esfamariam. Spatial correlation in building seismic performance for regional resilience assessmen t. R esilient Cities and Structur es , 3(2):57–65, June 2024. ISSN 27727416. doi: 10.1016/j.rcns.2024.06.004. URL https://linkinghub.elsevier.com/retrieve/pii/ S2772741624000267 . [30] Jian Zhong, Sien Zhou, Hao W ang, and Huimin Hu. Regional seismic fragilit y of bridge netw ork deriv ed by cov ariance matrix mo del of bridge p ortfolios. Engine ering Structur es , 309, June 2024. ISSN 18737323. doi: 10.1016/j.engstruct.2024.118035. Publisher: Elsevier Ltd. [31] Minjie Zhu, F rank McKenna, and Michael H. Scott. Op enSeesPy: Python library for the Op enSees finite elemen t framework. Softwar eX , 7:6–11, January 2018. ISSN 23527110. doi: 10.1016/j.softx.2017.10.009. URL https://linkinghub.elsevier.com/retrieve/pii/S2352711017300584 . 80 [32] A dam Zsarnó czay , W ael Elhaddad, Barbaros Cetiner, Kuanshi Zhong, F rank McKenna, and Gre- gory Deierlein. SimCenter Earthquake T estb ed: San F rancisco, CA, 2023. URL https://www. designsafe- ci.org/data/browser/public/designsafe.storage.published/PRJ- 3880 . 81
Original Paper
Loading high-quality paper...
Comments & Academic Discussion
Loading comments...
Leave a Comment