MARLEM: A Multi-Agent Reinforcement Learning Simulation Framework for Implicit Cooperation in Decentralized Local Energy Markets
This paper introduces a novel, open-source MARL simulation framework for studying implicit cooperation in LEMs, modeled as a decentralized partially observable Markov decision process and implemented as a Gymnasium environment for MARL. Our framework…
Authors: Nelson Salazar-Pena, Alej, ra Tabares
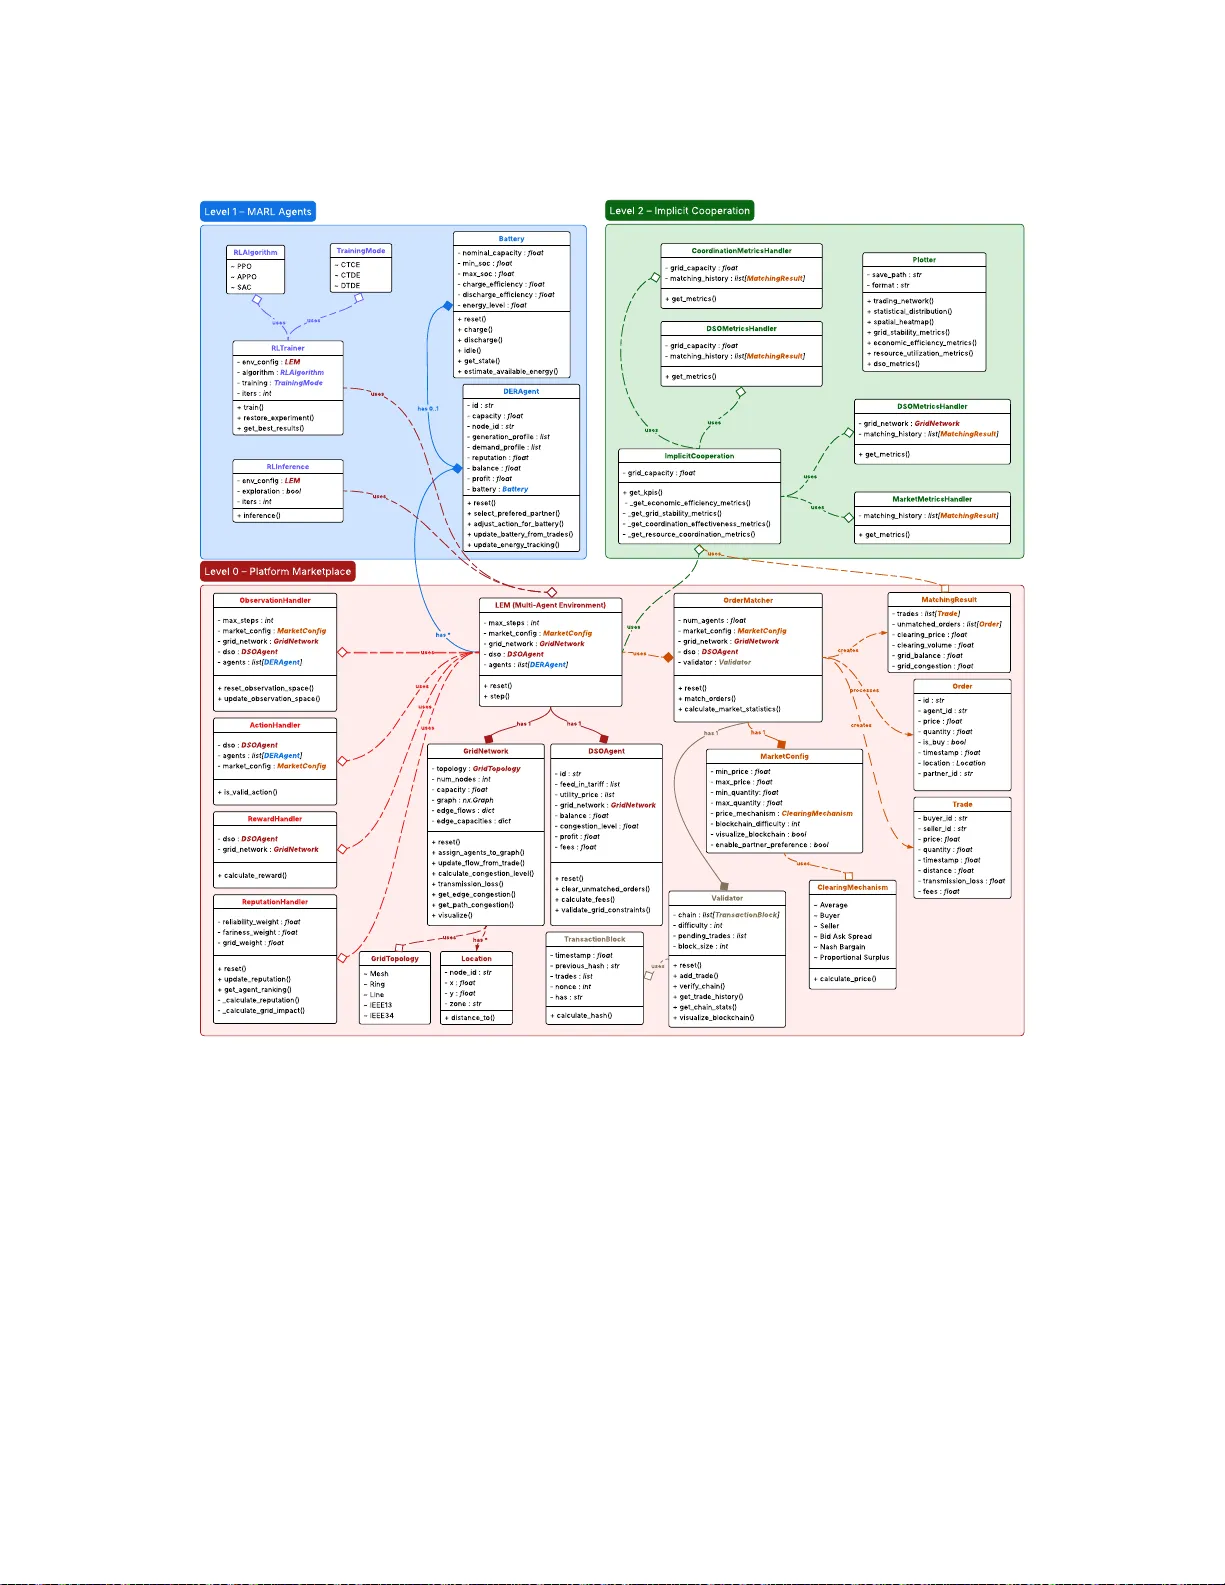
MARLEM: A Multi-Agent Reinf orc ement Learning Simulation Framew ork f or Imp licit Cooperation in Dec entralized Loc al Energy M arkets Nelson Salazar-P eña a , Alejandra T abares b , and Andrés González-Manc era a, * a Department of M echanical Engine ering, Universidad de los Andes, 111711, Bogotá D . C., Colombia b Department of Industrial Engine ering, Universidad de los Andes, 111711, Bogotá D . C., Colombia Abstract The pro liferation of distribute d energy resourc es requires advanc ed c oordination me chanisms f or Local Energy Markets (LEMs) to maintain grid stability and economic eciency , a challenge ill-suited to tra- ditional centralized control. A signicant research gap exists due to the lack of simulation frameworks that co hesively integrate realistic, dec entralized market dynamics, ph ysical grid constraints, and advanc ed Multi-Agent Reinf orcement Learning (MARL) c apabilities, especially f or studying emergent coordina- tion under partial observability . This paper introduces a nov el, open-source MARL simulation frame- w ork f or studying implicit cooperation in LEMs, modeled as a dec entralized partially observab le Markov decision process and implemented as a Gymnasium en vironment for MARL. Our framework features a modular market p latform with plug-and-play clearing mechanisms, p h ysically c onstrained agent mod- els (including battery storage), a realistic grid network, and a comprehensiv e analytics suite to evaluate emergent coordination. The main contribution is a nov el method to f oster implicit c ooperation, where agents’ observations and rewards are enhanced with system-lev el key performanc e indicators to enable them to independently learn strategies that benet the entire system and aim for co llectiv ely benecial outcomes without explicit communic ation. Through representative case studies (a vailable in a dedi- cate d GitHub repository in https://github. com/ salazarna/ marlem ), w e show the framew ork’s ability to analyze how di erent market congurations (such as v arying storage deplo yment) impact system perf or- mance. This illustrates its potential to facilitate emergent coordination, improv e market eciency , and strengthen grid stability . The proposed simulation framework is a exib le, extensib le, and reproducible tool f or researchers and practitioners to design, test, and validate strategies for future intelligent, decen- tralized energy systems. Keywor ds Local Energy Markets, Multi-Agent Reinforc ement Learning, Decentralize d P artially Observable Markov Decision Proc ess, Implicit Cooperation, Decentralize d Energy Systems, Simulation Framework * Corresponding author Email ad dresses: na.salazar10@uniandes.e du.c o (Nelson Sala zar-P eña ), a.tabaresp@uniandes. edu. co (Alejandra T ab ares ), angonzal@uniandes.e du.c o (Andrés González-Mancera ) 1 1 Intr oduction 1.1 Mo tivation The global energy sector is undergoing a fundamental paradigm shift, transitioning from a historically centralized generation model, reliant on a few large-scale, dispatchable f ossil-fuel power plants, towards a highly decentralized system characterized by the extensive proliferation of Distributed Energy Resources (DERs) [ 1 , 2 ]. This category of assets includes residential and commercial rooftop solar p hotov oltaics, b attery energy storage s ystems, electric v ehicles, and c ontrollable loads [ 3 ]. This trans- formation is driv en b y a c onuence of factors: international climate po licy mandates f or decarbonization, the declining c osts of renewab le and storage te chnologies making them economically viable for consumers, and a rising demand for energy autonom y and resilience against large-sc ale grid disruptions [ 2 ]. This evo lution marks the rise of the prosumer, an active market particip ant who not only consumes energy but also pro- duces, stores, and potentially manages it [ 4 ]. While this paradigm shift presents signicant opportunities for a more ecient, resilient, and sustainable energy future, it concurrently introduc es operational challenges, particularly for distribution networks [ 5 ]. The traditional unidirectional ow of pow er from central generators to passiv e consumers is being replace d by comple x, bidirectional ows inv olving numerous, heterogeneous actors. This necessitates more sophisticated methods of coordination and contro l to manage potential issues like grid congestion, v oltage instability , and the inherent v ariability of renewab le gener- ation [ 5 ]. In this conte xt, Local Energy M arkets (LEMs) hav e emerged as a promising framework for managing this emergent c om- ple xity at the distribution lev el [ 1 , 2 ]. By o ering a p latform for pe er-to-peer (P2P) energy trading and exibility servic es within a specic geographic c ommunity , LEMs aim to enhance local grid stability , promote the ecient utilization of loc al renewable resources, reduce reliance on bulk transmission systems (thereb y minimizing losses), and unlock the full economic potential of distributed assets b y allowing prosumers to directly monetize their exibility [ 1 , 2 ]. 1.2 Pro bl em statement Despite their potential, the ee ctive design and operation of ecient, stable, and scalable LEMs present a comple x scientic and engineering challenge, often c onceptualized as a trilemma [ 1 , 2 ]. First, achieving ecient and scalable coordination among a potentially massive population of autonomous, self-interested agents is a problem of immense comp lexity [ 6 ]. E ach agent (representing a home, a building, an ele ctric vehicle, or a c ommunity battery) makes decisions b ased on private objectiv es (e.g., minimizing c osts, maximizing rev enue) and limited, loc al information. This inherent dec entralization creates a non-stationary environment where the optimal strategy for any single agent depends on the concurrent, often unobservable, actions of all other particip ants [ 2 , 7 ]. Sec ond, the e conomic transactions constituting the market must not c ompromise the ph ysical integrity of the underlying distribution network [ 1 ]. Energy trades correspond to ph ysical pow er injections and withdrawals. Uncoordinate d actions, even if economic ally rational for individual agents (e.g., simultaneous battery discharging during peak prices), can lead to localized vo ltage violations, thermal overlo ading of lines, or unacceptab le power quality degradation, threatening grid security [ 1 , 2 ]. Therefore, an y viable LEM design must inherently respect or be c o-managed with these ph ysical c onstraints. LEM simulation software must thus tightly coup le economic decision-making with ph ysical grid simulation to capture these techno-e conomic interactions. Third, a practical LEM architecture must preserve the privacy and autonomy of its participants [ 6 ]. Centralized control solutions, which require agents to divulge sensitive consumption data or cede control authority to a central entity , often fac e signicant barriers due to privacy concerns, cyberse curity risks, and the potential creation of single points of f ailure [ 2 , 6 ]. Scala- bility also bec omes a major issue, as a central controller managing potentially a large number (hundreds or thousands) of DERs fac es immense computational burdens. Thus, truly de centralized approaches that respe ct agent autonomy and data privac y are highly desirable, if not essential, nec essitating software cap able of modeling and rigorously ev aluating such paradigms. The central problem, therefore, lies in discov ering mechanisms and system designs, and the appropriate simulation soft- ware to develop and test them, through which desirable system-lev el goals (supply-demand balanc e, aggregate economic ef- ciency , ph ysical grid security) can emerge from the uncoordinated, self-interested actions of independent entities operating under partial observ ability , without resorting to untenable c entralized contro l. 1.3 Research gap Addressing the LEM trilemma requires sophisticated modeling and simulation software capable of capturing the intricate in- terplay between adaptive agent learning (p articularly multi-agent reinforc ement learning (MARL)), comp lex market dynamics, and realistic p h ysical grid c onstraints. Howev er, a c omprehensive review of the existing literature (detailed in Section 2 ) rev eals 2 a signicant and critic al gap: there is no existing software that ee ctively unies realistic electrical netw ork simulation, exible energy market modeling, and agent-base d MARL within a single, standardized, easy-to-use framework [ 8 ]. Existing simulation tools often fall short due to fragmentation and specialization, hindering progress in understanding holistic ally integrated LEMs [ 2 , 7 , 8 ]: • Fragmen tation: M any traditional pow er system simulators (e.g., GridLAB-D , MA TPOWER) exc el at ph ysical model- ing but lack native support f or agent-based market interactions and adaptiv e learning capabilities [ 9 , 10 , 11 ]. Con versely , agent-base d modeling platforms tailored for energy markets (e.g., Lemlab/Hamlet [ 12 ]) often focus on optimization- base d agents or simplie d heuristics, lacking robust integration with state-of-the-art MARL algorithms needed to study emergent adaptive strategies [ 5 , 13 ]. This forces researchers into comple x co-simulation setups or requires them to ab- stract crucial aspects of the s ystem. • Abstraction: Numerous platf orms, particularly those f ocused on specic RL app lications like demand response (e.g., CityLearn [ 5 ] employs "c opper-plate" grid models, ignoring critic al p hysic al constraints like congestion and losses. This severely limits research vital techno-economic interactions and the potential for market actions to impact grid stability [ 8 ]. Others abstract the market mechanism itself, preventing the study of how dierent auction types or pricing rules inuence agent beha vior [ 7 ]. • Centralization bias: Framew orks integrating RL often target wholesale markets (e.g., ASSUME [ 5 ] or inherently rely on Centralized T raining with Decentralized Exe cution (CTDE) paradigms [ 5 , 14 ]. While CTDE is practical, it still nec essitates signicant c entralized c oordination during the learning phase, fundamentally c ontradicting the princip les of truly decentralize d, private, and resilient LEMs, and failing to capture the unique challenges of fully decentralize d learning [ 8 ]. • Limited f ocus on implicit coordination: Critically , no existing standardized, extensib le, and MARL-nativ e simula- tion framework is specically designed to inv estigate implicit coordination, where agents learn to coordinate without exp licit communication b y responding to shared en vironmental signals, within a ph ysically c onstrained, dec entralized market under the challenging Dec entralized T raining, Decentralize d Execution (DTDE) paradigm [ 2 , 8 ]. This capa- bility is essential for e xploring scalab le and privacy-preserving c oordination mechanisms. This lack of integrated, standardized, and appropriately f ocused tooling signicantly hinders progress in understanding, designing, and deplo ying truly decentralize d, intelligent, and ph ysically-aw are LEMs. 1.4 N ov elty and con tribution This research introduces a novel, open-source simulation framework engineered for investigating MARL in decentralized LEMs. This software is designed to ll the identied gap by providing the rst platf orm that cohesiv ely integrates the nec- essary components f or this research area. Specically , this work addresses the core challenges of LEM design and operation by enabling studies into: • How multi-agent simulation environments, particularly their inf ormation and incentiv e structures (observation and reward design), can be engineered within our unied software to foster the emergence of implicit c ooperation among self-interested MARL agents, thereb y enhancing grid stability and economic ecienc y . • How dierent decentralize d market mechanisms (e.g., auction types, pricing rules), implemented modularly in the software, inuence the learning dynamics, strategic behavior of agents, and the resultant market-level coordination and ec onomic outcomes within a unied simulation c ontext. • The impact of explicitly modeled ph ysical grid constraints, such as transmission losses and congestion (simulated via the software’s integrated grid component), on the trading strategies adopted by MARL agents and on ov erall market performanc e and stability . The presente d LEM software framew ork o ers sev eral c ontributions and nov elties specic ally aimed at bridging the iden- tied gaps in existing too ling: 1. Unied techno-economic MARL en vironment. It uniquely combines a modular, MARL-compatib le market (in- cluding nov el pref erence-base d matching) with a p h ysically realistic distribution grid model (including losses and c on- gestion) within a single, integrated Gymnasium environment, explicitly overc oming the market-vs-grid dichotom y and fragmentation prevalent in prior too ls [ 8 ]. 3 2. F ocus on full decentralization. Unlike man y existing tools biased towards CTDE [ 5 , 15 ], our software is architected to natively support and facilitate research into the DTDE paradigm [ 16 , 17 ], aligning with the princip les and re quirements of real-world de centralized systems [ 8 ]. 3. Implicit cooperation as a core construct. Its observation and reward structures are explicitly engineered using system-lev el key performance indicators (KPIs) to enable the study of emergent cooperation driven by shared envi- ronmental signals [ 18 , 19 ], moving beyond purely prot-maximizing objectives towards system-a ware agent learning within a fully dec entralized context [ 2 , 8 ]. 4. Standardization and modularity . Adherence to the widely adopted Gymnasium standard [ 20 ] ensures interoper- ability with a vast ec osystem of RL algorithms, while its modular design (especially for market and grid components) promotes reproducibility , extensibility , and ease of use f or the broader research c ommunity [ 2 , 7 , 8 ]. 5. Comprehensiv e anal ytics suite. It includes a set of integrated tools for quantifying emergent behaviors, market performanc e, grid stability , and coordination ee ctiveness, providing the empirical tools ne cessary to validate scientic claims directly within the software [ 7 ]. By providing this unique combination of features within a single, acc essible software package, our framework serves as a vital tool for advancing the understanding and development of truly dec entralized, intelligent, ph ysically-aw are, and ecient LEMs cap able of supporting the future energy grid [ 8 ]. 1.5 P aper structure This paper provides a detailed exposition of the framework’s design, implementation, and capabilities. The remainder of the manuscript is structured as f ollows: Section 2 provides a comprehensive review of related work, further detailing the research gap our framework addresses. Section 3 oers a detailed description of the framework’s methodology and architecture, cov ering the Dec-POMDP formulation, agent models, market design, grid integration, implicit cooperation mechanisms, and MARL paradigms. Section 4 outlines the experimental setup used to demonstrate the framework’s cap abilities. Section 5 presents and discusses the results from this experiment. Finally , Section 6 concludes the paper, summarizes the key contributions, and delineates directions f or future research. 2 Literature r evie w The development of our simulation framework is situate d at the conuenc e of ev olving research domains: decentralized energy systems, multi-agent systems, MARL for pow er system management, and the design of specialized simulation environments. A thorough review of the state-of-the-art across these areas is crucial to contextualize our contributions and delineate the research gap that our work aims to address. This section undertakes such a review , analyzing existing methodologies, algorithms, and simulation tools relev ant to LEMs. 2.1 Centralized and d ecentralize d energy markets The traditional paradigm for power grid management is inherently centralized, relying on a single entity , such as an Indepen- dent System Operator, to solv e large-scale optimization problems f or unit commitment and economic dispatch. This top-down approach has historically ensured grid reliability . How ever, the esc alating penetration of geographically dispersed and intermit- tent DERs fundamentally challenges the scalability and ecac y of centralized contro l. The signicant vo lume of data and the high-frequenc y decision-making required to coordinate hundreds or thousands of DERs render traditional methods compu- tationally intractable and inecient. In response, a signicant research trend has emerged toward decentralized energy systems, particularly in the form of LEMs. LEMs propose a bottom-up approach where prosumers can trade energy directly with one another in a P2P fashion. The theoretical advantages are numerous: enhanced grid resilience by reducing reliance on long-distance transmission, im- prov ed economic eciency by minimizing transaction costs, and greater prosumer empow erment. How ev er, these benets are contingent upon solving the comple x coordination problem at the local level. The primary trade-o is betwe en the theo- retical optimality of a centralize d controller with perf ect inf ormation and the scalability , robustness, and privac y aorded b y a dec entralized system. Our w ork is positioned in the latter area, inv estigating mechanisms that can close this performance gap by enab ling eectiv e coordination without a c entral authority . 4 2.2 M ulti-agen t systems in energy grid managemen t The c onceptualization of po wer s ystems as multi-agent s ystems is a w ell-established eld, oering a natural paradigm f or mod- eling the interactions of numerous distribute d entities [ 21 , 22 ]. Early applications primarily utilized rule-b ased or optimization- base d agents to tackle challenges such as load shedding, fault diagnosis, power restoration, and microgrid control [ 23 ]. These foundational w orks demonstrate d the f easibility of dec entralized coordination using pre dened communication protoco ls and heuristic strategies, often focuse d on achieving system stability or specic operational objectives [ 9 , 21 ]. F or instance, multi- agent systems hav e been emplo ye d for resource allocation and scheduling [ 23 ] and coordinating T ransmission System Operators and Distribution System Operators (DSOs) [ 24 , 25 ]. The strength of multi-agent systems lies in its ability to model heterogene- ity , bounded rationality , and emergent phenomena inherent in c omplex socio-te chnical systems like the pow er grid [ 26 , 27 ]. How ever, these traditional approaches to multi-agent systems often assume agents follo w xed rules or possess the compu- tational cap acity to so lve c omplex loc al optimization problems, which may be unrealistic for heterogeneous prosumers [ 5 , 26 ]. More critic ally , they typically lack the capacity for adaptiv e learning in dynamic, uncertain environments; agent behaviors are pre-programmed and cannot evo lve in response to changing market conditions or the strategic adaptations of other participants [ 26 ]. While valuable for demonstrating the potential of distributed control, these static approaches fall short of capturing the adaptive, strategic learning require d in modern, competitive LEMs where emergent behaviors and c omplex interactions dom- inate [ 14 , 28 ]. 2.3 Applic ation and limitations of MARL f or DER coordination MARL has emerged as a particularly promising paradigm f or o verc oming the limitations of traditional multi-agent s ystems, en- abling autonomous agents to learn sophisticate d, adaptive strategies directly from interaction within comp lex, non-stationary environments [ 29 , 30 ]. Its model-free nature allows agents to operate ee ctively even without explicit system models, making it w ell-suited f or the inherent uncertainties of LEMs [ 30 ]. The application of MARL in energy systems sp ans several key areas: • P2P energy trading: This is a core application where MARL agents learn bidding and scheduling strategies to trade energy surpluses and decits directly [ 4 , 6 , 31 , 32 ]. Studies vary signicantly in market mechanism c omplexity , ranging from detailed double-side d auctions [ 4 , 6 ] or continuous double auctions [ 6 ] to highly simp lied mechanisms b ased on supply-demand ratios [ 1 ] or abstracted clearing prices. While double auctions oer high economic delity , simplied models are often emplo yed when integrating c omplex p h ysical c onstraints [ 1 ]. Some approaches also utilize traditional distributed optimization methods like Alternating Direction Method of Multipliers as components or baselines [ 31 ], though these often struggle with practical issues and unrealistic agent assumptions [ 1 ]. • Ancillary services: MARL is exp lored for coordinating DERs to provide essential grid support services, such as vo ltage contro l [ 33 ] and frequenc y regulation [ 1 , 33 ]. These applic ations often focus on the ph ysical c ontrol aspects, sometimes simplifying the e conomic inc entives or market structures inv olv ed, treating the problem more as a cooperativ e contro l task than a market interaction. • Demand r esponse: MARL agents learn to adjust c onsumption patterns in response to price signals or direct re quests from aggregators or utilities [ 14 , 34 ]. Studies like MARL-iDR [ 14 ] demonstrate eectiv e coordination for incentiv e- base d demand response, often using CTDE paradigms [ 14 ]. Despite promising results, a critic al analysis of the existing literature rev eals common limitations in how the MARL prob- lem is often formulate d for LEMs: • State space: M any studies provide agents primarily with local state inf ormation (e.g., state of charge (SoC), prot) and basic market signals (e.g., previous clearing prices) [ 4 , 31 ]. While some works incorporate local grid information (e.g., vo ltage levels [ 1 ], the strategic use of system-level KPIs, such as overall grid c ongestion, social welf are, or market imb al- ance, as shared observational signals to facilitate implicit coordination without direct communic ation is signicantly underdevelope d. Agents often lack the necessary conte xtual information to understand the broader system impact of their actions. • Action space: The action space is frequently simplied. Man y studies utilize discrete actions (e.g., charge/ discharge levels [ 22 ] or limit continuous actions primarily to bidding quantities, assuming prices are xed or determined centrally [ 35 ]. Framew orks modeling sophistic ated P2P markets often lack explicit action components for strategic partner se- lection or reputation-based interactions, limiting the potential f or emergent social dynamics. Our framework employs a c ontinuous, multi-dimensional action sp ace including price, quantity , buy / sell direction, and a preferred partner ID , enabling richer strategic learning that enc ompasses both ec onomic and relational aspects. 5 • Rew ard function: The predominant approach relies heavily on maximizing individual agent prot [ 4 , 6 , 31 ]. While ec onomically intuitiv e, purely prot-driven rewards frequently lead to co llectively undesirable outcomes, such as mar- ket instability , strategic withholding, or disregard for ph ysic al grid constraints [ 1 , 35 ]. Although some works inc orporate penalties f or constraint vio lations (e.g., vo ltage penalties [ 1 ]), few employ structure d, multi-objective rewards designed to exp licitly incentivize emergent cooperation b y directly linking individual rewards to positiv e contributions to wards system-lev el KPIs. Our framework’s reward function, featuring a base reward modulated by a multiplic ative market- wide cooperation factor and an individual contribution f actor, represents a novel attempt to s ystematically address this gap and promote pro-social learning by making c ollectiv e succ ess directly benecial to the individual. A challenge identied across these app lications is a market-versus-grid dichotomy: studies ex celling in market delity often abstract the grid as an unc onstrained "copper plate" [ 4 , 6 , 36 ], while those with detailed grid models tend to simp lify the market signicantly [ 1 , 35 ]. This trade-o hinders the development of holistically realistic LEM simulations cap able of capturing the critic al techno-economic interdependencies. 2.4 Simulation framew orks for LEMs and MA RL The ev aluation and benchmarking of MARL strategies rely on suitable simulation environments. While numerous too ls exist, a c omparativ e review highlights the lack of a single platf orm adequately addressing the spe cic nee ds of research into decentral- ized, ph ysic ally-constrained LEMs, p articularly those focused on imp licit coordination and fully dec entralized learning. • Agent-b ased modeling tools: Frameworks such as Lemlab/Hamlet [ 12 ] oer modular agent-based modeling architec- tures specic ally for LEM research [ 5 ]. They provide tools f or testing various market designs and clearing mechanisms but primarily f ocus on traditional e conomic modeling and optimization-based agents. They generally lack nativ e, inte- grated support f or MARL algorithms and training paradigms, making it dicult to study adaptiv e learning dynamics [ 13 ]. • Optimization-based tools: Framew orks like OPLEM [ 37 ] and SIMTES [ 38 ] aim to integrate market design with network operation assessment [ 5 ]. OPLEM includes modules for various market types (P2P , auctions, time-of-use), while SIMTES employs co-simulation (integrating multi-agent systems, P andapow er [ 39 ], ns-3 [ 40 ]. Both incorpo- rate detailed grid models. How ever, their core logic relies on mathematical optimization solvers (linear programming, mixe d integer linear programming) for agent decisions and market clearing, rather than end-to-end MARL [ 5 ]. They serve well for benchmarking optimal solutions under simplifying assumptions but do not capture the learning dynam- ics or potential sub-optimalities inherent in MARL. SINTES appears to fall into this category as well, focusing on optimization within transactive energy s ystems. • Specialized RL en vironments f or energy: – CityLearn: A widely adopted, Gymnasium-comp liant en vironment focuse d on multi-agent demand response and building energy coordination [ 5 , 15 , 20 ]. Its primary strength is standardizing demand response research. How ever, it lacks an explicit P2P market mechanism and abstracts away the ph ysical po wer grid, making it un- suitable for studying market-grid interactions, P2P trading dynamics, or physic al constraints like congestion [ 5 , 20 ]. – ASSUME: An agent-base d framew ork modeling wholesale electricity markets with RL integration (specically the multi-agent TD3 algorithm under a CTDE paradigm) [ 5 , 41 ]. It features highly modular market designs (including EUPHEMIA-like auctions) and detaile d grid modeling (PyPSA integration) [ 5 ]. How ever, its f ocus on wholesale markets and its inherent reliance on CTDE make it unsuitable for studying fully dec entralized LEMs at the distribution level [ 5 ]. – RL-ADN: A high-performanc e RL environment focused on optimal battery storage dispatch in active distri- bution networks, f eaturing a "tensor power o w" solver [ 42 ]. It exc els in grid control research but lacks market mechanisms entirely [ 42 ]. – Other tools like energy-py [ 43 ] f ocus on single-agent optimization (e.g., battery storage), while marl-local-electricity applies MARL but is not presented as a general-purpose, modular framew ork [ 13 ]. • P ower system simulators: T ools like GridLAB-D (distribution networks) and MA TPO WER (transmission net- works) provide high-delity ph ysical grid modeling but are not inherently agent-based market simulators and lack MARL integration [ 9 ]. Grid2Op o ers a pow erful Gymnasium environment for transmission grid operation from a centralize d operator perspective, unsuitab le for dec entralized market simulation [ 44 ]. 6 • General MARL frameworks: Libraries like PyMARL/EPyMARL [ 45 , 46 ] and MARLlib [ 47 ] provide ex cellent algorithmic implementations but are domain-agnostic algorithm libraries, not environments. They often focus archi- tecturally on CTDE paradigms and lack the built-in domain-specic energy models neede d for LEM research. Co- simulation frameworks like Mosaik [ 41 ] oer exibility but require signicant integration eort to combine disp arate simulators (e.g., for market logic, grid p h ysics, and agent learning) [ 41 , 48 ]. T able 1 summarizes the key characteristics of the reviewed frameworks in relation to the requirements for studying dec en- tralized, ph ysic ally-aware LEMs using MARL, p articularly focusing on D TDE and implicit coordination. T able 1: Simulation frameworks f or local energy markets and multi-agent reinf orc ement learning. Framew ork Primary Focus Gym Compliant? Modular M arket? Grid Detail Supports DTDE? Ref Lemlab/Hamlet LEM (Optimization) No Y es (Optimization-based) V aries N/ A [ 12 ] OPLEM/SIMTES LEM/TES (Optimization) No Y es (Optimization-based) Detailed N/ A [ 37 , 38 ] CityLearn Demand Response Y es No Abstracted Ex ecution only [ 15 , 20 ] ASSUME Wholesale Markets (RL) No Y es (Auction-based) Detailed No (CTDE) [ 5 ] RL-ADN ESS Dispatch (RL) No No High Not specied [ 42 ] Grid2Op T ransmission Grid Ops (RL) Y es No High P aradigm-agnostic [ 44 ] PyMARL/MARLlib MARL Algorithms N/ A N/ A N/ A Limited (CTDE) [ 45 , 46 , 47 ] Our Framew ork Decentralized LEMs (MA RL) Y es Y es (MARL-native) Detailed Y es (Core F eature) - 2.5 Research gap and c ontribution opportunity This literature review reveals signicant gaps in the existing landscape of simulation tools and MARL applications for energy systems. The market-v ersus-grid dichotomy persists, with f ew framew orks successfully integrating high-delity models of both domains within a learning-base d paradigm [ 4 , 35 ]. Furthermore, the centralization-versus-de centralization dilemma remains unresolv ed in MARL training approaches [ 15 , 49 ]. Most advanced MARL energy frameworks rely on CTDE [ 5 , 14 ], which, while practical for training, requires a centralized entity with global information, fundamentally contradicting the principles of a truly dec entralized, private, and resilient LEM [ 44 , 50 ]. Consequently , a clear research gap e xists f or a MARL-nativ e simulation framework specically designed f or dec entralized LEMs that simultaneously features (i) a modular market mechanism suitable for MARL agents, (ii) the incorporation of re- alistic ph ysical grid constraints (losses, congestion), (iii) is built upon and facilitates research into the fully DTDE paradigm, and (iv) explicitly incorporates mechanisms (like shared KPI signals in observations and rewards) to study and foster implicit cooperation. Our proposed framework is designed to ll this gap. It provides the research community with the rst standardized, Gymnasium-comp liant, open-source tool that cohesiv ely integrates these four essential properties (recall Section 1.4 ). By pro- viding this combination, our framework serv es as a tool for adv ancing the understanding and development of truly decentral- ized, intelligent, ph ysic ally-aware, and ecient LEMs c apable of supporting the future energy grid. 3 M ethodo logy The simulation framework detailed in this paper is a comprehensiv e, open-source tool developed for the analysis of LEMs within a MARL paradigm. The problem is formally structured as a Dec-POMDP to accurately model the challenges of decision-making under uncertainty and limited information inherent in such decentralized systems. This formalization pro- vides the mathematical foundation upon which the interactions between agents and their environment are built, ensuring a principled appro ach to modeling the comp lex dynamics of the LEM. A core design principle of the framew ork is its implementation as a multi-agent en vironment conf orming to the Gymna- sium standard. This adherence is a critic al contribution, as it ensures compatibility with an extensiv e range of state-of-the-art RL libraries and algorithms. By adopting this widely recognized interf ace, the framework low ers the barrier to entry for other researchers, facilitating reproducib le experiments and allowing f or the standardized benchmarking of new MARL strategies. This documentation is structured to guide the user from a high-level understanding to granular implementation details, and includes detailed descriptions for each core module, a step-by-step description of the simulation loop, detailing how the modules interact at each trading period, and spe cics on the training and inf erence processes, including the MARL algorithms and training paradigms supporte d. 7 This detailed documentation ensures that the framew ork can serve not only as a tool for validation but also as a platf orm for future extension and development by the research community . For researchers seeking to engage with the framework at a deeper technical lev el, supplementary material is pro vided in a dedicate d GitHub repository ( https://github. com/ salazarna/ marlem ). 3.1 Simulation framew ork architectur e The framew ork is base d on a modular, thre e-level archite cture that provides a logical sep aration between the environment, the actors, and the emergent system dynamics (see Fig. 1 ). This separation of concerns represents a key design principle, aording high exibility and extensibility . It permits researchers to isolate and inv estigate individual components, such as substituting market mechanisms or agent learning algorithms, without necessitating alterations to the remainder of the system. This mod- ularity is fundamental to the framework’s ro le as a versatile research tool, enab ling systematic ablation studies and comp arative analyses of dierent LEM c ongurations. • Level 0 – Platform Marketp lace: This f oundational la yer simulates the ph ysical and ec onomic en vironment wherein the agents operate. It is not a passive b ackdrop but rather an active component possessing its own comp lex dynamics. This level consists of the Market Module , which provides a highly congurable platf orm for clearing energy trades, and the Grid Module , which models the p hysic al po wer network with v eridical constraints. This lay er serv es to ground the simulation in ph ysical reality b y enforcing established ph ysical la ws (e.g., congestion and transmission acc ording to the grid topo logy) and market regulations, thereb y creating a rich, high-delity en vironment that agents must learn to navigate. The delity of this lay er is essential, as it directly inuences the comp lexity of the policies agents must learn to achieve optimal performanc e. Detailed technical specications are provided in Section 3.3 for the Market Module and Section 3.5 f or the Grid Module . • Level 1 – MARL Agents: This layer contains the autonomous agent entities, which constitute the primary actors within the simulation. Each agent is modeled as an independent, economic ally self-interested participant equipped with its own DERs, such as a battery , and unique generation and demand proles. The agents learn their policies for market particip ation based on local observations, with the objective of maximizing their individual rewards. The comp lexity at this level emerges from the agents’ learning processes and their strategic interactions with the market and with one another. The central research challenge addressed by this framework lies in understanding the tension betwe en the agents ’ pursuit of individual rewards and the achiev ement of desirable colle ctive outcomes. The comp lete agent model, including battery dynamics and state management, is detaile d Section 3.4 . • Level 2 – Implicit Cooperation: This c onceptual lay er represents the principal scientic focus of the framework. It is not an explicit controller or algorithm but rather the emergent system-lev el coordination that arises from the engineered interactions betwe en Level 0 and Level 1. This cooperation is guided implicitly through the design of the information structure (i. e., the content of agent observ ations) and the incentiv e structure (i. e., the formulation of the rew ard func- tion). The framew ork provides the necessary instruments to both foster and quantify this emergent behavior, allowing the study of dec entralized coordination. The implementation details are in Section 3.6 . 3.2 F ormulation of the decen tralized partially o bserv abl e Mark ov de cision process The simulation is orchestrated by the Environment Module , which consists primarily of a Gymnasium multi-agent environ- ment that encapsulates the entire LEM. T o address the comp lexities of a dec entralized LEM, the problem is f ormally modeled as a Dec-POMDP . The Dec-POMDP is dened by the tuple ⟨ 𝐼 , S , 𝐴, 𝑇 , 𝑅 , Ω , 𝑂 ⟩ , where 𝐼 denotes the set of agents partic- ipating in the market, S the set of environment states, 𝐴 the joint action space, 𝑇 the state transition function, 𝑅 the reward function, Ω the joint observation space, and 𝑂 the observation function. Subindex 𝑖 denotes the state, space, or function for agent 𝑖 ∈ 𝐼 . This formulation is particularly well-suited as it explicitly acknowledges the core challenges of the problem: each agent must make decisions under uncertainty based on its own partial observ ations within a non-stationary environment where the state transition is c ontingent upon the joint action of all agents. Furthermore, the f ormulation pro vides a robust mathematical lens through which to analyze the LEM: • P artial observability , captured by Ω and 𝑂 ( 𝑜 | 𝑠 ′ , 𝑎 ) , directly models the information constraints fundamental to a dec entralized system. An agent cannot know the private internal state (e.g., battery level, nancial status) of its peers, reecting both privac y conc erns and the ph ysical reality of distributed s ystems. 8 Lev el 2 ? Im pli c it C oo pe rat io n Lev el 1 ? M AR L Ag en ts Lev el 0 ? P la tf or m M ar ke tp lac e Obs er v at io nH and le r - max _ st eps : in t - mar ket _ c onf ig : M ar ketCon fig - gr id _ ne tw or k : GridN etw ork - ds o : DSOAgent - ag ents : li st[ DER Age nt ] + rese t_ ob ser vat ion _ sp ace () + upd ate_obs erv ati on_spac e() LEM (M u lt i- A ge nt E n vi ro nm en t ) - max _ st eps : i nt - mar ket _ c onf ig : M arke tConf ig - gr id _ ne tw or k : GridN etw ork - ds o : DSOAgent - ag ents : li st[ DER Age nt ] + rese t() + step () Ac t io nH and le r - ds o : DSOAgent - ag ents : li st[ DER Age nt ] - mar ket _ c onf ig : M ar ketCon fig + is_ v alid _ ac tio n() R ew ar dHa nd le r - ds o : DSOAgent - gr id _ ne tw or k : GridN etw ork + calc ul ate_rew ard () DER Ag en t - id : str - c apac it y : f loat - no de_id : str - g ener atio n_prof il e : lis t - d emand _prof il e : li st - rep ut atio n : floa t - b alanc e : f l oa t - p rof it : float - b atter y : B a tter y + rese t() + selec t _ pr efe red _ p art ner () + adju st_acti on_for _ b atte ry () + upd ate_ba tter y_ f rom _ tr ades () + upd ate_ener gy_ t rac king () Ord er M at c her - num _ ag ents : float - mar ket _ co nf ig : M arke tConf ig - gr id_net w or k : GridN etw ork - ds o : DSOAgent - val idat or : Valida tor + re set () + m atc h_ or der s() + c alc ulat e_ m arke t_ s tati stic s( ) Im pl ic it Co op er at io n - gr id_cap ac ity : f lo a t + get _ k pis () - _ ge t_ ec on omi c_eff ic ienc y_ m etr ics () - _ ge t_ g rid _ st abi lity_met ric s( ) - _ ge t_ c oo rdi natio n_ e ff ect ive ness _ me tr ics () - _ ge t_reso urc e_ c oo rdin atio n_metr ic s() us es us es us es us es Gri dN et w o rk - to po log y : GridTopolog y - nu m_nod es : int - c apac it y : f loat - gr aph : nx. Graph - ed ge_fl ow s : dict - ed ge_cap ac itie s : dict + rese t() + assig n_ ag ent s_ to _ gr aph () + upd ate_fl ow _ f rom _ tra de( ) + calc ul ate_con ges tio n_ le vel( ) + tran smis sio n_ lo ss( ) + get _ ed ge_con ges tio n() + get _ p ath _ co nge sti on() + vis ualiz e() DSOAg ent - id : str - fe ed_in_tari ff : lis t - ut ilit y_ pr ic e : lis t - gr id_net w or k : GridN etw ork - bal anc e : float - co ng esti on_leve l : floa t - pr of it : float - fe es : f l oa t + re set () + c lear _ un matc hed _ or der s() + c alc ulat e_ f ees( ) + v alid ate_gri d_ c ons tr aints () Val id at or - ch ain : l ist[ Tra nsac tionBlock ] - dif f ic ult y : i nt - pe ndi ng_trad es : l ist - blo ck _ siz e : int + rese t() + add _ tr ade( ) + ver if y_ ch ain() + get _ tr ade_his tor y( ) + get _ c hain_stat s() + vis ualiz e_ b loc kc hain () Gri dTo po lo gy ~ Mes h ~ R ing ~ Line ~ IE EE 1 3 ~ IE EE 34 Loc a ti on - no de_id : str - x : float - y : float - zo ne : str + dist anc e_ t o() ha s * us es Bat te ry - no min al_ c apac it y : float - mi n_ so c : f loat - max _ so c : f lo a t - c harg e_ ef f ici ency : floa t - di sch arg e_ ef fi cie ncy : float - en ergy_leve l : float + rese t() + cha rge () + disc har ge( ) + idle () + get _ st ate() + esti mate _ avail able _ ener gy () ha s 0. .1 Ord er - id : str - age nt_id : s tr - pr ic e : float - qu anti ty : float - is_buy : bool - tim est amp : float - loc at ion : L oca tio n - par tn er_id : s tr M at ch in g R es ul t - tr ades : li st[ Tra de ] - unm atc hed _ or der s : list [ Order ] - cl eari ng_pr ic e : f l oa t - cl eari ng_ vo lum e : float - gr id_ba lanc e : float - gr id_co nge stio n : f lo a t Tra de - bu yer _ id : str - sell er_id : str - pr ic e: float - qu anti ty : float - tim est amp : float - dis tan ce : float - tr ansm issio n_loss : float - fe es : f l oa t pr oc ess es c reat es M ar ke tCo n f ig - min _ p ric e : f l oa t - max _ p ric e : f l oa t - min _ qu anti ty : float - max _ qu anti ty : float - pr ic e_ m ec hanis m : Cle ar ingM echa nism - blo ck ch ain_ d iff ic ul ty : int - vi sualiz e_bloc kc hain : bool - enab le_par tn er_pre fer enc e : bool ha s 1 Tra ns ac ti on Blo c k - t imes tam p : float - p rev ious _ has h : str - t rad es : lis t - n onc e : int - h as : str + cal cul ate_hash () R e pu t at ion Han d ler - rel iabi lity_wei ght : float - f arin ess_wei ght : float - gr id _ we igh t : f l oa t + rese t() + upd ate_rep ut atio n() + get _ age nt_ran king () - _ c alc ulat e_ rep ut atio n() - _ c alc ulat e_ gr id _ im pac t( ) RL Trai ne r - env_con fi g : LEM - alg or ithm : RL Algor ithm - tr ainin g : Tra iningM ode - it ers : i nt + trai n() + rest ore_exp erim ent () + get _ b est _ res ult s() RLAl go ri t hm ~ PP O ~ APP O ~ SA C Tra in in gM o de ~ CTCE ~ CTDE ~ DTDE RLInf er en ce - env_con fi g : LEM - exp lor atio n : bool - it ers : i nt + inf eren ce( ) Co ord i nat io n Me tr i cs Han d ler - gr id_cap ac ity : float - mat ch ing_his tor y : li st[ M atc hingResult ] + g et_met ri cs( ) DSOM et ri c sHan d ler - gr id_cap ac ity : float - mat ch ing_his tor y : li st[ M atc hingResult ] + g et_met ri cs( ) DSOM et ri c sHan d ler - g rid _netw or k : GridNet wor k - m atc hing _ h isto ry : li st[ M a tchingResult ] + get _ m etr ic s() M ar ke tM e tr ic s Han dl er - m atc hing _ h isto ry : li st[ M a tchingResult ] + get _ m etr ic s() Plo tt er - save _ p ath : str - fo rm at : s tr + trad ing _netw or k( ) + stat ist ica l_ di str ibu tio n() + spat ial_heat map () + gr id_stab ilit y_ me tr ics () + eco no mic _ ef fic ien cy_met ric s() + reso urc e_ u tiliz ati on_met ric s() + dso _ m etr ics () ha s * us es us es us es us es us es us es ha s 1 Cle ar in gM e ch an is m ~ A v erag e ~ Buyer ~ Seller ~ Bid As k Spre ad ~ Nash Bar gain ~ Propo rt ion al Surp lus + cal cul ate_pr ice () ha s 1 us es us es c reat es us es ha s 1 us es us es us es us es Figure 1: A high-level class diagram illustrating the relationships among the MARLEM framework’s core components. • Non-stationarity arises from 𝑇 ( 𝑠 ′ | 𝑠 , 𝑎 ) , which is conditioned on the joint action { 𝑎 1 ∈ 𝐴 1 , . . . , 𝑎 𝑖 ∈ 𝐴 𝑖 } ∀ 𝑖 ∈ 𝐼 . As each agent independently updates its policy , the environment’s dynamics appear to shift from the perspectiv e of an y single agent. • 𝑅 ( 𝑠 , 𝑎 ) is designed to tackle the credit assignment problem by providing signals that help agents correlate their indi- vidual actions with co llective outc omes, a crucial element f or fostering implicit c ooperation. 3.2.1 En vironment state space ( S ) and transition function ( 𝑇 ) The environment state 𝑠 ∈ S is a comprehensive snapshot of the entire LEM at a given trading period 𝑡 ∈ { 1 , . . . , 𝜏 } , although it is nev er fully visible to an y single agent. It is compose d of the temporal state (e.g., time of day), the c omplete market state (all 9 orders and trade histories), the ph ysical grid state (c ongestion on all lines), and the private internal states of all agents. The state transition function 𝑇 ( 𝑠 ′ | 𝑠 , 𝑎 ) is implicitly dened by the deterministic, sequential logic within the environ- ment’s step method. Giv en a joint action { 𝑎 1 ∈ 𝐴 1 , . . . , 𝑎 𝑖 ∈ 𝐴 𝑖 } ∀ 𝑖 ∈ 𝐼 , the environment transitions to a new state ( 𝑠 ′ ∈ S ) by rst processing agent actions into f ormal orders, then clearing the market, updating all agent and grid states based on the resulting trades, and nally advancing the simulation clock. This procedural denition of the state transition ensures a consistent and reproducib le evolution of the en vironment (see Section 3.9 ). 3.2.2 Join t observ ation space ( Ω ) The design of the observation spac e is of critical importance for enabling implicit cooperation. T o facilitate learning in a par- tially observable environment, each agent 𝑖 ∈ 𝐼 rec eives a local observation vector 𝑜 𝑖 ∈ Ω 𝑖 that constitutes a precisely struc- tured subset of the global state. It provides a suciently rich signal for decision-making without violating the principles of dec entralization and privacy . The observation v ector includes: • Mark et signals (public information): Publicly availab le information accessib le to an y market particip ant. This en- comp asses the last clearing price and vo lume, anonymize d statistics regarding P2P versus DSO trading vo lumes, the prevailing DSO buy (fee d-in tari) and sell (utility) prices, and the reputation score of each agent. These signals pro- vide a common ground of information, reducing uncertainty and allowing agents to form shared expectations about the market’s state. • Agent-specic signals (private information): The agent’s private information, which remains unobservable to other agents, thereby preserving privac y . This set of signals includes its current energy generation and demand fore- casts, the precise SoC of its b attery , its cumulative prot, and its dynamic reputation sc ore. This priv ate information is essential for the agent to tailor its strategy to its o wn specic circumstances and c onstraints. • Implicit cooperation KPIs (shared signals): A central and innovativ e feature of this framework is the inclusion of a selection of system-level KPIs within the observation ve ctor, such as social welf are, grid congestion, and supply- demand imbalanc e (se e Se ction 3.6 ). These KPIs work as a shared public signal that provides all agents with a consistent representation of the ov erall market health (analogous to a stock market index), thereby allowing them to learn the c or- relation betwe en their local actions and desirable global outcomes, ev en without direct communication. F or example, an agent can learn that actions contributing to an increase in the observe d grid congestion metric may lead to a lower future reward. 3.2.3 Action spac e ( 𝐴 ) Each agent’s action 𝑎 𝑖 ∈ 𝐴 𝑖 is dened as a continuous ve ctor, a formulation that permits ne-grained bidding strategies far more expressiv e than discrete action spac es. The four components are: 𝑎 𝑖 = ⟨ 𝑝 𝑏 𝑖 𝑑 , 𝑞 𝑏 𝑖 𝑑 , 𝛼 , 𝛽 ⟩ (1) where 𝑝 𝑏 𝑖 𝑑 represents the bid price, 𝑞 𝑏 𝑖 𝑑 denotes the bid quantity , 𝛼 ∈ { 0 , 1 } indicates the order type (0 for sell, 1 for buy), and 𝛽 ∈ { 0 , 1 , . . . , | 𝐼 + 1 | } is an inde x representing a preferre d trading partner (including the DSO and no pref erence). The inclusion of 𝛽 as an action component is another novel feature, enabling agents to learn not only what to bid, but also with whom to transact. This facilitates the study of more complex social dynamics beyond simple pric e-based interactions, such as the formation of trust netw orks, stable trading c oalitions, or c ommunity energy groups. T o ensure that actions are v alid within the simulation c ontext, two lay ers of constraints are applied. First, the raw continu- ous values f or price and quantity produce d by the agent’s polic y are clipped to predened market bounds ( 𝑝 𝑏 𝑖 𝑑 ∈ [ 𝑝 𝑚 𝑖 𝑛 , 𝑝 𝑚 𝑎 𝑥 ] , and 𝑞 𝑏 𝑖 𝑑 ∈ [ 𝑞 𝑚 𝑖 𝑛 , 𝑞 𝑚 𝑎 𝑥 ] ). Second, the agent’s requested 𝑞 𝑏 𝑖 𝑑 is then c onstrained f or ph ysical feasibility while c onsidering b at- tery limitations. The framework calculates the maximum energy an agent can ph ysically sell (based on its surplus generation and dischargeable b attery capacity) or buy (b ased on its decit and chargeable b attery capacity). 3.2.4 Rew ard function ( 𝑅 ) The reward function 𝑅 is the primary mechanism through which implicit cooperation is fostere d, translating the high-level objectiv e of system stability into a conc rete, optimizable signal for each agent. The reward for agent 𝑖 ∈ 𝐼 is a multi-objective function designed to b alance individual ec onomic incentiv es with system-level stability go als: 𝑅 𝑖 = 𝑅 𝑏 𝑎 𝑠 𝑒 ,𝑖 · ( 1 + 𝑓 𝑐 𝑜 𝑜 𝑝 · 𝑓 𝑐 𝑜 𝑛𝑡 𝑟 𝑖 𝑏, 𝑖 ) − 𝛾 𝐷 𝑆 𝑂 , 𝑖 − 𝛾 𝑈 𝐷, 𝑖 (2) 10 These components are engine ered to operate jointly: • 𝑅 𝑏 𝑎 𝑠 𝑒 ,𝑖 : This is a weighted sum representing the agent’s individual perf ormance, predominantly inuenc ed b y its eco- nomic prot from trades. This term drives the agent’s self-interested behavior, ensuring it learns eectiv e bidding strategies to operate on its own behalf. 𝑅 𝑏 𝑎 𝑠 𝑒 ,𝑖 is a composite function that includes the f ollowing c omponents: – Economic component: Based on the agent’s prot from successful trades. This component incentivizes agents to learn ee ctive bidding strategies. – Grid balance c omponent: Rewards agents f or actions that help to reduc e the o verall grid imbalanc e (i.e., buy- ing during times of surplus and selling during times of decit). – Resource alloc ation component: Rewards ecient use of resources (e.g., full exe cution of orders, and mini- mal unused cap acity). – T rading component: Rewards the agent’s particip ation in the market during the trading period 𝑡 ∈ { 1 , . . . , 𝜏 } . – Stability component: Rewards behaviors that contribute to long-term market stability (e.g., price consistenc y , and grid state improv ement). • 𝑓 𝑐 𝑜 𝑜 𝑝 : This market-wide cooperation factor is c alculated from system KPIs and functions as a multiplicativ e bonus on the agent’s base reward. Agents whose actions improve the ov erall market health (e.g., increase social w elfare, reduc e congestion) receiv e a signic antly higher rew ard. Simultaneously , when the market e xhibits stable and ecient charac- teristics (e.g., low congestion, high social welf are), all participating agents rec eive an augmented reward. This creates a shared incentiv e for system-level improv ements, analogous to a common-pool resource where the market’s health is a resource all agents benet from maintaining. In this way , the emergence of implicit cooperation is enc ouraged without the need f or explicit c oordination. • 𝑓 𝑐 𝑜 𝑛𝑡 𝑟 𝑖 𝑏, 𝑖 : This factor renes the cooperation incentive b y quantifying the degree to which agent 𝑖 ’s specic actions contribute d to the positive state of the market. It serves as an eectiv e credit assignment mechanism, helping an in- dividual agent to understand its specic positiv e or negative impact on the collectiv e. For instance, an agent that sells energy during a grid-wide decit, thereb y contributing to grid stability , will rec eive a higher contribution sc ore than an agent that sells during a surplus. • 𝛾 𝐷 𝑆 𝑂 , 𝑖 and 𝛾 𝑈 𝐷, 𝑖 : These are linear penalties applied for trading with the DSO and f or the unmet demand, enc ouraging agents to prioritize P2P transactions and fostering a self-sucient loc al market. This multi-fac eted reward structure is the primary mechanism through which implicit cooperation is fostered, guiding the dec entralized learning processes of individual agents tow ard emergent, system-lev el coordination. 3.3 LEM design and trading mec hanisms The Market Module provides a realistic and exible simulation of a decentralized LEM. Its primary novelty lies in a hybrid matching mechanism that combines agent-driven partner preferenc es with a classic price-b ased auction. This is complemented by congurable operational rules and integrate d me chanisms f or trust and se curity , which are c ritical for the real-world viability of such systems. The market operates in discrete trading periods 𝑡 ∈ { 1 , . . . , 𝜏 } , follo wing a systematic worko w from order submission to nal validation (see Algorithm 1 ). 3.3.1 Rol e of the distribution system operator The DSO is a critical component that fullls multiple roles essential for market stability and operation. First, it serves as the market maker of last resort, guaranteeing market clearing at every trading period 𝑡 ∈ { 1 , . . . , 𝜏 } . Second, it acts as a proxy for a real-world grid operator, managing grid stability and co llecting f ees for grid usage. The DSO maintains a b alance ( 𝐵 𝐷 𝑆 𝑂 ) representing the net energy position (see ( 3 )). 𝐵 𝐷 𝑆 𝑂 = 𝑡 𝑟 𝑎 𝑑 𝑒 𝑠 ( 𝐸 𝑠 𝑜 𝑙 𝑑 − 𝐸 𝑏 𝑜𝑢 𝑔 ℎ 𝑡 ) (3) The total fe e 𝐹 𝑡 𝑜𝑡 𝑎 𝑙 for a given trade is a composite of charges for congestion, usage per unit of distance of the transmis- sion lines (predened by the DSO), imbalances, voltage support, thermal limits, and cross-zone trading bonus/ penalty . The formulation f or 𝐹 𝑡 𝑜𝑡 𝑎 𝑙 is as fo llows: 11 Algorithm 1 M arket operation worko w at trading period 𝑡 ∈ { 1 , . . . , 𝜏 } 1: Input: Set of all agents 𝐼 , joint action { 𝑎 1 ∈ 𝐴 1 , . . . , 𝑎 𝑖 ∈ 𝐴 𝑖 } ∀ 𝑖 ∈ 𝐼 , current market state 𝑠 ∈ S . 2: Output: Set of ex ecute d trades, updated market state 𝑠 ′ ∈ S . ⊲ Phase 1: Order Collecti on and V a lidati on 3: O 𝑡 ← ∅ ⊲ Initialize empty set of valid orders 4: f or all agent 𝑖 ∈ 𝐼 d o 5: 𝑜 𝑖 ← ActionT oOrder ( 𝑎 𝑖 ) ⊲ Conv ert raw action to a f ormal order structure 6: if V alidateOrder ( 𝑜 𝑖 , 𝑠 ) is T rue then 7: O 𝑡 ← O 𝑡 ∪ { 𝑜 𝑖 } 8: end if 9: end f or ⊲ Phase 2: P2P Market Cleari ng 10: 𝑡 𝑟 𝑎 𝑑 𝑒 𝑝 𝑟 𝑒 𝑓 , O 𝑟 𝑒 𝑚 ← Pref erenceM atch ( O 𝑡 ) ⊲ Stage 1: Match mutual pref erences 11: 𝑡 𝑟 𝑎 𝑑 𝑒 𝑝 𝑟 𝑖 𝑐 𝑒 , O 𝑢𝑛𝑚 ← PriceM atch ( O 𝑟 𝑒 𝑚 ) ⊲ Stage 2: Clear via CDA 12: 13: 𝑡 𝑟 𝑎 𝑑 𝑒 𝑝 2 𝑝 ← 𝑡 𝑟 𝑎 𝑑 𝑒 𝑝 𝑟 𝑒 𝑓 ∪ 𝑡 𝑟 𝑎 𝑑 𝑒 𝑝 𝑟 𝑖 𝑐 𝑒 14: f or all trade ∈ 𝑡 𝑟 𝑎 𝑑 𝑒 𝑝 2 𝑝 do 15: UpdateAgentStates ( 𝑡 𝑟 𝑎 𝑑 𝑒 ) ⊲ Update energy , prot for buy er and seller 16: end f or ⊲ Phase 3: DSO Clearing and Finali zation 17: 𝑡 𝑟 𝑎 𝑑 𝑒 𝑑𝑠 𝑜 ← DSOClear ( O 𝑢𝑛𝑚 ) ⊲ Stage 3: Clear remaining orders with DSO 18: f or all trade ∈ 𝑡 𝑟 𝑎 𝑑 𝑒 𝑑𝑠 𝑜 do 19: UpdateAgentStates ( 𝑡 𝑟 𝑎 𝑑 𝑒 ) 20: end f or 21: 22: 𝑡 𝑟 𝑎 𝑑 𝑒 ← 𝑡 𝑟 𝑎 𝑑 𝑒 𝑝 2 𝑝 ∪ 𝑡 𝑟 𝑎 𝑑 𝑒 𝑑𝑠 𝑜 ⊲ Aggregate all trades from the trading period 23: V alidateBlock ( 𝑡 𝑟 𝑎 𝑑 𝑒 ) ⊲ Simulate blockchain validation f or the block of trades 24: 𝑠 ′ ← UpdateMarketState ( 𝑡 𝑟 𝑎 𝑑 𝑒 , 𝑠 ) ⊲ Update global pric es, vo lumes, reputations 25: ζ 𝑡 + 1 ← UpdateGridState ( 𝑡 𝑟 𝑎 𝑑 𝑒 , 𝑠 ) ⊲ Update congestion on the a ected e dges 26: 27: return 𝑡 𝑟 𝑎 𝑑 𝑒 , 𝑠 ′ 𝐹 𝑡 𝑜𝑡 𝑎 𝑙 = 𝐹 𝑐 𝑜 𝑛 𝑔 + 𝐹 𝑡 𝑟 𝑎𝑛 𝑠 + 𝐹 𝑖 𝑚𝑏 + 𝐹 𝑣 𝑜 𝑙 𝑡 + 𝐹 𝑡 ℎ 𝑒 𝑟 𝑚 𝑎 𝑙 + 𝐹 𝑧 𝑜 𝑛𝑒 ( 4 ) 12 𝐹 𝑐 𝑜 𝑛 𝑔 = 𝑓 𝑐 𝑜 𝑛 𝑔 · ( 𝐶 𝑡 − 𝐶 𝑡 ℎ 𝑟 𝑒 𝑠 ℎ 𝑜 𝑙 𝑑 ) · 𝑞 𝑖 𝑗 · 𝑝 𝑖 𝑗 (4a) 𝐹 𝑖 𝑚𝑏 = 𝑓 𝑖 𝑚𝑏 · | 𝐵 𝑖 𝑚 𝑝 𝑎 𝑐 𝑡 | · 𝑞 𝑖 𝑗 · 𝑝 𝑖 𝑗 (4b) 𝐹 𝑣 𝑜 𝑙 𝑡 = min ( 𝑉 𝑑𝑟 𝑜 𝑝 , 𝑉 𝑡 ℎ 𝑟 𝑒 𝑠 ℎ 𝑜 𝑙 𝑑 ) · 𝑞 𝑖 𝑗 · 𝑝 𝑖 𝑗 (4c) 𝐹 𝑡 ℎ 𝑒 𝑟 𝑚 𝑎 𝑙 = min ( 𝑓 𝑡 ℎ 𝑒 𝑟 𝑚 𝑎 𝑙 , 𝑓 𝑡 ℎ 𝑟 𝑒 𝑠 ℎ 𝑜 𝑙 𝑑 ) · 𝑞 𝑖 𝑗 · 𝑝 𝑖 𝑗 (4d) 𝐹 𝑧 𝑜 𝑛𝑒 = − 𝑓 𝑧 𝑜 𝑛𝑒 · 𝑞 𝑖 𝑗 · 𝑝 𝑖 𝑗 (4e) 𝑉 𝑑𝑟 𝑜 𝑝 = 𝑓 𝑣 𝑜 𝑙 𝑡 · 𝑑 𝑖 𝑗 (4f ) 𝑓 𝑡 ℎ 𝑒 𝑟 𝑚 𝑎 𝑙 = 𝐶 𝑡 − 𝑇 𝑡 ℎ 𝑟 𝑒 𝑠 ℎ 𝑜 𝑙 𝑑 1 − 𝑇 𝑡 ℎ 𝑟 𝑒 𝑠 ℎ 𝑜 𝑙 𝑑 (4g) 𝐵 𝑖 𝑚 𝑝 𝑎 𝑐 𝑡 = min 𝑞 𝑖 𝑗 | 𝐵 𝑔 𝑟 𝑖 𝑑 | , 1 if DSO buying/ selling during ex cess supp ly / demand − min 𝑞 𝑖 𝑗 | 𝐵 𝑔 𝑟 𝑖 𝑑 | , 1 if DSO buying/ selling during ex cess demand/ supp ly 0 for b alanced grid (4h) where 𝐶 𝑡 ∈ [ 0 , 1 ] is the congestion lev el at trading period 𝑡 ∈ { 1 , . . . , 𝜏 } , 𝐶 𝑡 ℎ 𝑟 𝑒 𝑠 ℎ 𝑜 𝑙 𝑑 ∈ [ 0 , 1 ] is the congestion interv en- tion threshold (80% grid capacity utilization by def ault), 𝐵 𝑖 𝑚 𝑝 𝑎 𝑐 𝑡 ∈ [ − 1 , 1 ] is the balance impact score, 𝑉 𝑑𝑟 𝑜 𝑝 is the v oltage drop, 𝑉 𝑡 ℎ 𝑟 𝑒 𝑠 ℎ 𝑜 𝑙 𝑑 ∈ [ 0 , 1 ] is the vo ltage drop threshold (5% vo ltage drop by default), 𝑑 𝑖 𝑗 is the distance along the network be- twe en agents 𝑖 and 𝑗 ∈ 𝐼 , 𝑇 𝑡 ℎ 𝑟 𝑒 𝑠 ℎ 𝑜 𝑙 𝑑 ∈ [ 0 , 1 ] is the thermal threshold for grid instability (20% grid capacity utilization for thermal limits by default), 𝐵 𝑔 𝑟 𝑖 𝑑 ∈ [ 0 , 1 ] is the balanc e of the grid at trading period 𝑡 ∈ { 1 , . . . , 𝜏 } (a positive balance indi- cates an exc ess supp ly , and a negativ e b alance indicates an e xc ess demand), 𝑓 are f actors for each charge which can be c ongured base d on grid characteristics, and 𝑞 𝑖 𝑗 and 𝑝 𝑖 𝑗 are the quantity and pric e for a trade between tw o agents (including a trade with the DSO). This fe e structure ensures that agents are incentivized to make grid-friendly trading decisions while providing the DSO with rev enue to maintain grid infrastructure and stability . Furthermore, it allows f or the analysis of various grid taring policies and their impact on P2P trading inc entives. 3.3.2 M ulti-stage ord er matching process An innovation of the framework is an algorithm to match the submitted orders, which clears the market utilizing a three- stage, sequential process (see Fig. 2 ). This h ybrid approach is designed to prioritize local and relationship-based trading while concurrently ensuring market liquidity and complete clearing. Moreo ver, it enables the study of the emergence of c ooperative behavior by allowing agents to balanc e the exploratory nature of an open, anonymous market with the exploitativ e potential of stable, trusted p artnerships. The sequential ordering of the stages is deliberate. • Stage 1: Prefer ence-based matching: The matcher initially attempts to fulll trades betwe en agents that hav e mu- tually specied each other as pref erred partners in their respectiv e bid orders. This stage explicitly enables the study of how stable, trust-b ased trading co alitions may form and whether they enhance or detract from ov erall market eciency . By processing these pre-arranged trades rst, the system allows established relationships to take priority ov er the more anon ymous and potentially vo latile open market, reecting a form of social ecienc y . • Stage 2: Price-b ased matching: All remaining orders are processe d through a double auction, an established and ec onomically ecient mechanism for anonymous trading. Buy orders are sorted in descending order of price, while sell orders are sorted in ascending order. T rades are subsequently execute d for all compatib le pairs where the buyer’s price meets or exc eeds the seller’s ( 𝑝 𝑏 𝑢𝑦 ≥ 𝑝 𝑠 𝑒 𝑙 𝑙 ). Reputation scores are used as a secondary sorting criterion to prioritize more trustworth y agents. • Stage 3: DSO clearing: An y orders that remain unmatched after the prec eding stages are cleared by the DSO. The DSO guarantees that all residual demand is met and all surplus is purchased. Howev er, it e xecutes these transactions at a less fav orable prices f or the agents: a low feed-in tari ( 𝑝 𝑓 𝑖 𝑡 ) for buying and a high utility price ( 𝑝 𝑢𝑡 𝑖 𝑙 𝑖 𝑡 𝑦 ) for selling. This price disparity , where 𝑝 𝑓 𝑖 𝑡 < 𝑝 𝑃 2 𝑃 < 𝑝 𝑢𝑡 𝑖 𝑙 𝑖 𝑡 𝑦 , creates a strong economic inc entive for agents to transact within the P2P market in the prec eding stages, thereby f ostering a self-sucient local market. 13 St a r t of M a t c h i n g an d C le a r i n g Ag e nt s s ub m it o rd er s Cre at e P2 P t r ad e Up d at e o r d er q ua nt it ie s Ord e r f u ll y m atc h ed ? M u t u al P r e f e re n c e N o M u t u al P r ef e r en c e N o ST A GE 1 : Pref e re nc e- b as ed m atc h ing ST A GE 2 : Pri c e- b as ed m atc h ing E n d o f M a t c h i n g an d Cle a r i n g ST A GE 3 : DSO c le ar in g Co mp at ib le m atc h f ou n d ? Y e s Y e s N o DSO b u y s a t f ee d - i n t ar i f f DSO s el ls a t ut i lit y p r ic e Cre at e P2 P t r ad e Un m a t c h e d Se ll Ord e r s Un m a t c h e d Bu y Ord e r s Figure 2: Diagram illustrating the multi-stage order matching and market clearing processes. 3.3.3 Clearing mec hanisms A key attribute of the framework is its modularity in market design. The transaction price for a P2P trade is determined by a congurab le clearing mechanism, which permits researchers to comp are the e ects of di erent pricing rules on agent beha vior and market outcomes. Implemented mechanisms include: • A verage pricing: A simple and equitable mechanism where the price is set at the midpoint of the bid and ask, ensuring a transparent and c omputationally ecient settlement (see ( 5 )). 𝑝 𝑖 𝑗 = 𝑝 𝑏 𝑢𝑦 + 𝑝 𝑠 𝑒 𝑙 𝑙 2 (5) • Pa y-as-bid (seller pricing): The trade is ex ecuted at the seller’s bid price ( 𝑝 𝑖 𝑗 = 𝑝 𝑠 𝑒 𝑙 𝑙 𝑒 𝑟 ). This rule may incentivize sellers to submit more strategic bids, which can have signicant implications for price discov ery and ov erall market eciency . • Pa y-as-o er (buyer pricing): The trade is exe cuted at the buyer’s oer price ( 𝑝 𝑖 𝑗 = 𝑝 𝑏 𝑢𝑦 𝑒 𝑟 ), which fa vors the seller since 𝑝 𝑏 𝑢𝑦 ≥ 𝑝 𝑠 𝑒 𝑙 𝑙 . • Nash bargaining pricing: The pric e is calculated to e qually divide the economic surp lus ( 𝑝 𝑏 𝑢𝑦 − 𝑝 𝑠 𝑒 𝑙 𝑙 ) betwe en the two agents (see ( 6 )). This approach promotes equitable outc omes and may foster greater long-term market participa- tion by ensuring f airness. 𝑝 𝑖 𝑗 = 𝑝 𝑠 𝑒 𝑙 𝑙 + 𝑝 𝑏 𝑢𝑦 − 𝑝 𝑠 𝑒 𝑙 𝑙 2 (6) 14 • Proportional surplus pricing: The surplus is divided proportionally based on each agent’s contribution to the sur- plus, measured against a ref erence market pric e ( 𝑝 𝑟 𝑒 𝑓 ). See ( 7 ). 𝑝 𝑖 𝑗 = 𝑝 𝑠 𝑒 𝑙 𝑙 + 𝑝 𝑏 𝑢𝑦 − 𝑝 𝑟 𝑒 𝑓 ( 𝑝 𝑏 𝑢𝑦 − 𝑝 𝑟 𝑒 𝑓 ) + ( 𝑝 𝑟 𝑒 𝑓 − 𝑝 𝑠 𝑒 𝑙 𝑙 ) · ( 𝑝 𝑏 𝑢𝑦 − 𝑝 𝑠 𝑒 𝑙 𝑙 ) (7) 3.3.4 Reputation and decen tralized v alidation T o address challenges of trust and security inherent in de centralized systems, the framew ork integrates two key f eatures: • Reputation system: The Reputation Module assigns a dynamic reputation score 𝑟 𝑖 ∈ [ 0 , 1 ] to each agent 𝑖 ∈ 𝐼 , which is a weighted av erage of their reliability , price fairness, and grid contribution. This score directly inuences market outcomes by serving as a tie-breaker in the double auction, rewarding reliable agents with preferential market acc ess. The reputation update process is iterative: after each trading period 𝑡 ∈ { 1 , . . . , 𝜏 } , the module analyzes comp leted trades, assesses each agent’s grid impact, calculates the new component scores, and updates the agent’s overall reputation, incorporating a deca y factor to weigh recent behavior more heavily . The reputation score is formally dened as: 𝑟 𝑖 = 𝑤 𝑟 𝑒 𝑙 · 𝛿 𝑟 𝑒 𝑙 , 𝑖 + 𝑤 𝑓 𝑎 𝑖 𝑟 · 𝛿 𝑓 𝑎 𝑖 𝑟 , 𝑖 + 𝑤 𝑔 𝑟 𝑖 𝑑 · 𝛿 𝑔 𝑟 𝑖 𝑑 , 𝑖 (8) where the scores 𝛿 measure reliability (ratio of matched to total order v olume), price fairness (deviation from market clearing price), and grid contribution (whether trades alleviate or exac erbate grid stress) for 𝑡 ∈ { 1 , . . . , 𝜏 } , and 𝑤 are the respectiv e weights. • Decentralized validation: The V a lidator Modu le emulates a blockchain ledger to ensure transactional integrity with- out a central arbiter. After each trading period 𝑡 ∈ { 1 , . . . , 𝜏 } , all ex ecuted trades are hashed (SHA-256), aggregated into a b lock, and validate d using a simp lied Proof-of- W ork consensus mechanism. Once validate d, the block is added to an immutable ledger. This procedure creates a transparent record of market activity , a critical feature for ensuring auditability and trust. While Proof-of- W ork has known energy ineciencies, it is emplo ye d here as a well-understood and straightforw ard model for simulating dec entralized c onsensus. 3.4 Agen t model and de cision-making process The agents within the framework are sophistic ated entities representing prosumers with their own DERs, each possessing unique characteristics and ph ysical constraints. The Agent Module serves as the fundamental building block, encapsulating the agent’s internal state, its ph ysical assets, and the logic that go verns its interactions with the market. 3.4.1 Agen t architecture and state manag ement Each agent is a self-c ontained entity characterized by a set of core attributes, including a unique identier, its ph ysical location on the grid, and time-series proles for its forec asted energy generation 𝐺 𝑡 and demand 𝐷 𝑡 for each trading period 𝑡 ∈ { 1 , . . . , 𝜏 } . The agent’s internal state is dynamic, tracking its balance 𝐵 𝑡 (where a positive balance indicates a surplus of energy , while a negative balance signies a decit) and prot, its evo lving reputation score 𝑟 , and its cumulative performance in the market. This includes tracking the total demand satised v ersus the demand deferre d, pro viding a measure of the agent’s energy se curity . The agent’s balance is estimated in ( 9 ), where 𝐸 𝑏 𝑜𝑢 𝑔 ℎ 𝑡 ,𝑡 and 𝐸 𝑠 𝑜 𝑙 𝑑 ,𝑡 are the quantities of energy bought and sold in the market at trading period 𝑡 ∈ { 1 , . . . , 𝜏 } , respectiv ely . 𝐵 𝑡 = ( 𝐺 𝑡 − 𝐷 𝑡 ) + ( 𝐸 𝑏 𝑜𝑢 𝑔 ℎ 𝑡 ,𝑡 − 𝐸 𝑠 𝑜 𝑙 𝑑 ,𝑡 ) (9) A key innov ation of our agent model is the integration of a partner selection mechanism. Agents can learn to select pre- ferre d trading p artners through their RL po licy , allo wing for the emergence of comp lex, reputation-based trading relationships. When not controlle d by the RL policy , agents can revert to a rule-based strategy that prioritizes partners based on a weighte d score of high reputation and short grid distanc e, promoting both trustworth y and ecient trades. The agent’s w orkow at each trading period 𝑡 ∈ { 1 , . . . , 𝜏 } is systematic: it processes the action from its policy , adjusts it for p h ysical constraints, creates a f ormal market order, and upon market clearing, updates its entire internal state based on the trade outcomes. For e xample, the cumulativ e prot is updated as in ( 10 ). prot 𝑡 + 1 = prot 𝑡 + 𝑡 𝑟 𝑎 𝑑 𝑒 𝑠 ( 𝑝 𝑠 𝑒 𝑙 𝑙 · 𝑞 𝑠 𝑒 𝑙 𝑙 − 𝑝 𝑏 𝑢𝑦 · 𝑞 𝑏 𝑢𝑦 ) (10) 15 3.4.2 Ph ysicall y constrained decision-making A central feature of the agent model is the exp licit enforc ement of ph ysical constraints, which grounds the agent’s learned ec onomic policies in ph ysical reality . Before a raw action from the agent’s polic y is submitted to the market, the agent’s action is c onstrained to ensure its feasibility , prev enting an agent from attempting to sell energy it does not possess or purchase energy it cannot store. The maximum sellable ( 𝑞 𝑠 𝑒 𝑙 𝑙 , 𝑚 𝑎𝑥 ) and purchasable ( 𝑞 𝑏 𝑢𝑦 ,𝑚 𝑎 𝑥 ) quantities for an agent at trading period 𝑡 ∈ { 1 , . . . , 𝜏 } are calculate d in ( 11 ) base d on its internal energy b alance and its battery state, where 𝐶 𝑛𝑜 𝑚 is the nominal c apacity of the b attery and 𝑆 𝑜 𝐶 𝑚 𝑖 𝑛 and 𝑆 𝑜 𝐶 𝑚 𝑎 𝑥 its operational state-of-charge (SoC) limits, and 𝐸 𝑑 𝑖 𝑠 𝑐 ℎ 𝑎 𝑟 𝑔 𝑒 𝑎𝑏 𝑙 𝑒 and 𝐸 𝑐 ℎ 𝑎 𝑟 𝑔 𝑒 𝑎𝑏 𝑙 𝑒 represent the ph ysically a vailable energy and storage c apacity in the b attery at that moment, respectively . 𝑞 𝑠 𝑒 𝑙 𝑙 , 𝑚 𝑎 𝑥 = max ( 0 , 𝐺 𝑡 − 𝐷 𝑡 ) + 𝐸 𝑑 𝑖 𝑠 𝑐 ℎ 𝑎 𝑟 𝑔 𝑒 𝑎𝑏 𝑙 𝑒 (11a) 𝑞 𝑏 𝑢𝑦 ,𝑚 𝑎 𝑥 = max ( 0 , 𝐷 𝑡 − 𝐺 𝑡 ) + 𝐸 𝑐 ℎ 𝑎 𝑟 𝑔 𝑒 𝑎𝑏 𝑙 𝑒 (11b) 𝐸 𝑑 𝑖 𝑠 𝑐 ℎ 𝑎 𝑟 𝑔 𝑒 𝑎𝑏 𝑙 𝑒 = ( 𝑆 𝑜𝐶 𝑡 − 𝑆 𝑜 𝐶 𝑚 𝑖 𝑛 ) · 𝐶 𝑛𝑜 𝑚 (11c) 𝐸 𝑐 ℎ 𝑎 𝑟 𝑔 𝑒 𝑎𝑏 𝑙 𝑒 = ( 𝑆 𝑜𝐶 𝑚 𝑎 𝑥 − 𝑆 𝑜 𝐶 𝑡 ) · 𝐶 𝑛𝑜 𝑚 (11d) 3.4.3 Battery storage dynamics The battery is an optional component dene d by a set of key ph ysical p arameters that govern its beha vior: 𝐶 𝑛𝑜 𝑚 , 𝑆 𝑜 𝐶 𝑚 𝑖 𝑛 and 𝑆 𝑜𝐶 𝑚 𝑎 𝑥 , and its charging and discharging eciencies ( 𝜂 𝑐 ℎ 𝑎 𝑟 𝑔 𝑒 ∈ [ 0 , 1 ] and 𝜂 𝑑 𝑖 𝑠 𝑐 ℎ 𝑎 𝑟 𝑔 𝑒 ∈ [ 0 , 1 ] ). The energy level of the battery ( 𝐸 𝑏 𝑎 𝑡 ,𝑡 | 𝑆 𝑜 𝐶 𝑚 𝑖 𝑛 · 𝐶 𝑛𝑜 𝑚 ≤ 𝐸 𝑏 𝑎 𝑡 ,𝑡 ≤ 𝑆 𝑜𝐶 𝑚 𝑎 𝑥 · 𝐶 𝑛𝑜 𝑚 ) evolv es at each trading period 𝑡 ∈ { 1 , . . . , 𝜏 } based on the net energy ow resulting from the agent’s internal balance and market activities. The charging and discharging dynamics ac count f or energy losses inherent in the storage proc ess. When charging with an amount of energy 𝐸 𝑖 𝑛 , the stored energy inc reases. Conversely , when a useful amount of energy 𝐸 𝑜𝑢 𝑡 is deliv ered b y the battery , the stored energy is depleted b y a greater amount to acc ount for discharge inecienc y (see ( 12 )). 𝐸 𝑏 𝑎 𝑡 ,𝑡 + 1 = ( min ( 𝐸 𝑏 𝑎 𝑡 ,𝑡 + 𝐸 𝑖 𝑛 · 𝜂 𝑐 ℎ 𝑎 𝑟 𝑔 𝑒 , 𝑆 𝑜 𝐶 𝑚 𝑎 𝑥 · 𝐶 𝑛𝑜 𝑚 ) max ( 𝐸 𝑏 𝑎 𝑡 ,𝑡 − 𝐸 𝑜𝑢 𝑡 𝜂 𝑑 𝑖 𝑐 ℎ 𝑎𝑟 𝑔 𝑒 , 𝑆 𝑜 𝐶 𝑚 𝑖 𝑛 · 𝐶 𝑛𝑜 𝑚 ) (12) The charge and discharge formulation in ( 12 ) ensure that these operations are always constrained by the battery’s instan- taneous SoC and its maximum charge/ discharge rates. This detailed modeling is essential for ac curately capturing the value of energy storage as a source of e xibility in the LEM. 3.4.4 Time series pr oles The behavior and decision-making conte xt for each agent are primarily driv en by their generation and demand proles. These time-series data are generated by a dedicated algorithm designed to produce realistic and stochastic inputs. The module can either load data from e xternal les, allowing for e xperiments based on real-w orld datasets, or generate it proce durally . • Generation proles: T o simulate renewable energy sources, generation proles are designed to mimic the output of a solar photov oltaic system. The generation 𝐺 𝑡 is modeled as a function of the agent’s capacity , a base solar irradiance curve (modeled as a Gaussian function c entered at midday), and stochastic noise components representing atmospheric ee cts: 𝐺 𝑡 = 𝐶 𝑛𝑜 𝑚, 𝑖 · 𝜆 𝑡 · ( 1 + 𝜀 𝑛𝑜 𝑖 𝑠 𝑒 + 𝜀 𝑐 𝑙 𝑜 𝑢𝑑 ) (13) where 𝐶 𝑛𝑜 𝑚, 𝑖 is the nominal cap acity (solar photov oltaic system plus battery) of agent 𝑖 ∈ 𝐼 , 𝜆 𝑡 is the solar irradiance at trading period 𝑡 ∈ { 1 , . . . , 𝜏 } modeled as a Gaussian function centered at noon, 𝜀 𝑛𝑜 𝑖 𝑠 𝑒 is a random noise term, and 𝜀 𝑐 𝑙 𝑜 𝑢𝑑 is a term that simulates the ee ct of cloud cov er, which can introduc e larger, more correlated v ariations. • Demand prol es: Demand proles are generated to resemb le typical c onsumption patterns, with peaks in the morn- ing and ev ening. This creates a natural temporal mismatch with so lar generation, thereby establishing the fundamental ec onomic driver f or energy trading and storage. This algorithm is also used to replic ate the DSO pricing proles in the Market Module (recall Section 3.3.1 ). The feed-in tari and utility price o ered b y the DSO are generated as step functions that ree ct typical wholesale market pric e variations, 16 with higher prices during peak demand hours. The algorithm ensures that the utility price is always higher than the feed-in tari, establishing the economic incentive for agents to engage in P2P trading. T o enhance realism, all generated proles are passe d through a smoothing lter to reduce abrupt changes and create more natural time-series data. 3.5 Ph ysical grid mod el and constraints T o capture the critic al interp lay between market activities and ph ysical infrastructure, the framework incorporates a Grid Mod- ule . This component is indispensable for studying the coupling betwe en e conomic decisions and their real-w orld consequenc es on the stability and eciency of the electrical grid. It grounds the LEM in ph ysical reality , f orcing agents to learn policies that are not only protable but also p hysic ally viable. 3.5.1 Grid topo logy and agen t allocation The ph ysical po wer distribution netw ork is modeled as a weighted, undirecte d graph G = ⟨V , 𝜉 ⟩ , where agents are located at nodes 𝑣 ∈ V and interconnected b y edges 𝑒 ∈ 𝜉 . A key feature is its support f or multiple topology types: • Pred ened topologies: F or standardized, reproducible experiments, the framework includes canonical models from electrical engine ering literature, such as the IEEE 13-node and IEEE 34-node test fee ders. • Procedural topologies: For systematic analysis of network structure, algorithmically generated networks like mesh, ring, and line topologies c an be created. Each agent is assigned a location corresponding to a specic node 𝑣 ∈ V . The electrical distance betw een two agents 𝑑 𝑖 𝑗 is then c alculated not as a simp le Euclidean distanc e but as the length of the shortest path through the network grap h betwe en their respectiv e nodes ( 𝑣 𝑖 and 𝑣 𝑗 ). This distance is a critical input f or calculating the p hysic al eects of energy transf ers. 3.5.2 Mod eling ph ysic al constraints The Grid Module imposes two fundamental ph ysical constraints on all energy transactions, which have direct ec onomic con- sequenc es and create comp lex learning challenges for the agents. • T ransmission losses: Energy is inevitab ly dissipated during transport ov er pow er lines. The framework models these losses ( ℓ 𝑖 𝑗 ) for a trade of quantity 𝑞 𝑖 𝑗 ov er an electrical distance 𝑑 𝑖 𝑗 as a linear function considering a congurab le loss factor 𝜅 (see ( 14 )). ℓ 𝑖 𝑗 = 𝑑 𝑖 𝑗 · 𝑞 𝑖 𝑗 · 𝜅 (14) These losses ℓ 𝑖 𝑗 derates 𝑞 𝑖 𝑗 as it is transported through the grid, and are incorporated into trading fees by the DSO, creating a direct economic incentiv e for agents to prioritize local transactions with nearby peers. This is a primary driver f or the formation of ge ographically clustere d, community-level energy markets. • Congestion: The po wer ow F on each pow er line 𝑒 ∈ 𝜉 is monitored relative to its maximum cap acity . The total grid cap acity is distributed among the edges ( 𝐶 𝑒 ), with lower-impe dance (shorter) edges typically having higher capacity . The congestion level ζ at an edge 𝑒 ∈ 𝜉 is the ratio between the current pow er ow at that edge and its maximum cap acity (see ( 15 )). ζ 𝑒 = F 𝑒 max ( 𝐶 𝑒 ) (15) After each trading period 𝑡 ∈ { 1 , . . . , 𝜏 } , the pow er ow F on each power line 𝑒 ∈ 𝜉 along the shortest path of ev ery ex ecuted trade is update d. Crucially , the resulting grid-wide c ongestion lev el ζ is then fed back into the agents’ observ a- tion space as a system-lev el KPI. This mechanism allows agents to learn strategies that co llectively alleviate grid stress, such as reducing power transfers along highly loade d corridors. This demonstrates a form of emergent, decentralize d congestion management, a c ritical function for the stability of future grid operations. 17 3.5.3 Dynamic grid state updates and managemen t The state of the grid is not static but evo lves dynamically in response to market activities. This is managed through a systematic update process that oc curs after each trading period 𝑡 ∈ { 1 , . . . , 𝜏 } . • P ower ow update process: For each trade, the algorithm rst identies the shortest path betwe en the buyer and seller on the network graph. Then, the power o w F on every edge 𝑒 ∈ 𝜉 along that path is incremented by the trade quantity 𝑞 𝑖 𝑗 (considering transmission losses). This ensures that the ph ysical impact of every ec onomic transaction is reected in the grid ’s state. T rades that w ould violate cap acity constraints can be penalized or disallo we d by the DSO . • Grid balance calculation: The ov erall health of the grid is monitored through a grid balance metric 𝐵 𝑔 𝑟 𝑖 𝑑 , which quanties the net energy surplus or decit within the LEM. This is calculated in ( 16 ) as the sum of all agents’ net energy positions. A value of 𝐵 𝑔 𝑟 𝑖 𝑑 close to zero indic ates a self-sucient market, while large deviations signify a hea vy reliance on the e xternal grid, a key indicator of system perf ormance. 𝐵 𝑔 𝑟 𝑖 𝑑 = 𝑖 ∈ 𝐼 ( 𝐺 𝑖 − 𝐷 𝑖 + 𝐸 𝑏 𝑜𝑢 𝑔 ℎ 𝑡 ,𝑖 − 𝐸 𝑠 𝑜 𝑙 𝑑 , 𝑖 ) (16) 3.5.4 Zonal grid structure T o enable the study of more comp lex, large-scale power systems and sophistic ated market designs, the framework supports a zonal grid structure. This f eature allows the main grid graph G to be partitioned into a set of distinct, connecte d subgraphs, known as zones, where each zone Z = ⟨V , 𝜉 ⟩ ⊆ G . Although it is congurable, by default the framework applies a bonus (negative f ees) if the buy er and seller are in the same zone. This zonal denition serves two primary research purposes. First, it allows for the modeling of geographic ally or electri- cally distinct areas within a larger grid, each with potentially dierent characteristics. Second, it f acilitates the implementation of advance d market mechanisms, such as location-based marginal pricing or zonal congestion management schemes. For exam- ple, trades occurring between agents in dierent zones can be subjected to additional fees or constraints, simulating the costs and limitations of transferring power across wider areas. This provides a comprehensiv e tool f or analyzing the scalability and hierarchical c ontrol of dec entralized energy markets. 3.6 Implicit cooperation and perf ormance measur ement A central h ypothesis of this research is that self-interested agents, operating in a shared environment with well-designed in- centiv es, can learn to cooperate implicitly without direct communic ation. The Implicit Cooperati on Module is fundamental to this process. It does not enforce cooperation, but rather measures and incentivizes it by providing agents with system-level information that promotes c ollectiv e benets. The Implicit Cooperati on Module calculates a suite of KPIs that serve as fee dback signals, guiding the agents’ learning process toward mutually benecial outcomes. These KPIs are integrated both into the agents’ observation space, providing a shared signal of the system’s state, and into the reward function, directly rewarding actions that contribute to market health. This creates a f eedb ack loop where individual actions are shaped by their imp act on the colle ctive. 3.6.1 The coordination f eedback l oop The mechanism for fostering implicit cooperation operates through a closed fee dback loop that integrates the KPIs into the learning process, functioning as the shared signals at each trading period. By including these KPIs in each agent’s observation ve ctor, all agents receiv e a consistent, shared signal about the state of the s ystem. At the end of a trading period 𝑡 ∈ { 1 , . . . , 𝜏 } , the Gri d Module calculates the ph ysic al outcomes (e.g., c ongestion), and the Market Modu le records the ec onomic outcomes (e.g., pric es, v olumes). This data is then consume d b y the Imp licit Cooper ation Module , which c omputes the system-level KPIs. These KPIs are not merely logged for post-hoc analysis but are actively injected back into the en vironment in two w ays: 1. As shared observ ations: A curated ve ctor of KPIs is appended to each agent’s local observation. This provides all agents with a consistent, shared signal about the colle ctive state of the system, allowing them to learn the correlation betwe en their local actions and global outc omes. 2. As rewar d components: The KPIs are used as direct inputs to the calculation of the 𝑓 𝑐 𝑜 𝑜 𝑝 and 𝑓 𝑐 𝑜 𝑛𝑡 𝑟 𝑖 𝑏, 𝑖 terms in the reward function (recall ( 2 )). This creates a direct and tangible incentiv e for agents to take actions that improv e these system-lev el metrics, eectiv ely aligning individual self-interest with the co llective good. 18 This continuous ow of information from global state to local signals is what enables agents to learn coordinate d, pro- social behaviors without requiring explicit communication or a central c ontroller. The feedb ack mechanism adapts to changing market conditions. 3.6.2 Key perf ormance indic ators The framework calculates a comprehensiv e suite of KPIs, categorized to provide a multi-fac eted view of system performanc e. The fo llowing are the indicators use d to measure emergent cooperation: 1. Economic eciency KPIs: This set of metrics measures the market’s ability to create value and facilitate ecient price disc ov ery . • Social welfar e: The total economic value of all trades, representing the sum of consumer and producer surplus. It serves as the primary indic ator of ov erall market eciency . Social W elf are = 𝑡 𝑟 𝑎 𝑑 𝑒 𝑠 𝑝 𝑡 𝑟 𝑎 𝑑 𝑒 · 𝑞 𝑡 𝑟 𝑎 𝑑 𝑒 (17) • Mark et liquidity: The total vo lume of energy traded, indicating market activity and depth. Liquidity = 𝑡 𝑟 𝑎 𝑑 𝑒 𝑠 𝑞 𝑡 𝑟 𝑎 𝑑 𝑒 (18) • A verage bid-ask spread: The av erage dierenc e betwe en buy and sell order prices, measuring market eciency . Spread = E [ 𝑝 𝑎 𝑠 𝑘 ] − E [ 𝑝 𝑏 𝑖 𝑑 ] (19) • Price vo latility: The standard deviation of the clearing price ov er a time window , indicating market stability . 2. Grid stability KPIs: This set of metrics assesses the p hysic al health and operational eciency of the electric al grid. • Supply-d emand imbalance: The net energy imbalanc e normalized by grid c apacity , measuring how well sup- ply and demand are b alanced. A value near zero suggests stable operation that does not strain the wider grid. Imbalanc e = | Í 𝑞 𝑏 𝑢𝑦 − Í 𝑞 𝑠 𝑒 𝑙 𝑙 | 𝐶 𝑔 𝑟 𝑖 𝑑 (20) • Grid gongestion: The a verage congestion lev el across all power lines 𝑒 ∈ 𝜉 as dene d in ( 15 ), indicating ph ysical stress on the infrastructure. Low congestion levels are indicativ e of a system operating well within its ph ysical limits, enhancing reliability . • Grid balance: The ov erall energy balanc e of the grid, calculate d as the dierenc e betwe en total generation and consumption as in ( 16 ). 3. Resource coor dination KPIs: These metrics evaluate how e ectiv ely DERs are utilized and coordinated. • DER self-consumption: The proportion of total energy transacted that occurs in P2P trades as opposed to with the DSO. A high value is indicative of a self-sucient and ee ctive local market, reducing reliance on centralize d utilities. Self-Consumption = Í 𝑞 𝑃 2 𝑃 Í ( 𝑞 𝑃 2 𝑃 + 𝑞 𝐷 𝑆 𝑂 ) (21) • Fle xibility utilization: The proportion of availab le exib le energy that is actively utilized in P2P trading. This metric measures how eectiv ely agents utilize their energy exibility resources (generation surplus, demand decit, and battery c apacity). Flexibility Utilization = Í 𝑞 𝑝 2 𝑝 Í 𝑞 𝑎𝑣 𝑎 𝑖 𝑙 𝑎𝑏 𝑙 𝑒 (22) 19 where Í 𝑞 𝑎𝑣 𝑎 𝑖 𝑙 𝑎𝑏 𝑙 𝑒 is the total available exibility across all agents, considering the sellable exibility (surplus generation plus battery discharge capacity), and the buyable exibility (decit demand plus battery charge ca- pacity) at a giv en trading period 𝑡 ∈ { 1 , . . . , 𝜏 } . 4. Coordination eectiv eness KPIs: These metrics measure the emergence and eectiv eness of coordination among agents. • Coordination score: A measure of coordination, reecting the market’s balanc e. A score approaching 1 indi- cates perf ect system b alance. Coordination Score = 1 − Imbalanc e (23) • Coordination conv ergence: Measures the stability of trading volumes ov er a recent window , indicating if a stable, c oordinated pattern has emerged. It is calculated similarly to the pric e vo latility metric. 3.7 M ulti-agen t reinf orcemen t learning framew ork While the prece ding sections hav e detailed the environment’s design, this subsection desc ribes the MARL framework respon- sible f or training the agents’ policies. A signicant contribution of our work is the framework’s native support for comp aring dierent MARL training and inferenc e paradigms, which is essential for studying the trade-os betwe en centralization and dec entralization in learning and control. This is a core research instrument that allows for the rigorous, side-by-side evalua- tion of coordination strategies under varying degrees of inf ormation sharing and architectural c onstraints. The entire training and inf erence pipeline is managed by a dedicated T r ainer Module and Inference Module , respectively , built upon established libraries like Ray RLlib [ 51 ], to ensure robustness, scalability , and reproducibility . A detailed treatment of the MARL framework, including its full mathematical and implementation specics, is reserved for a f orthcoming p aper; the fo llowing serves as a c omprehensive o verview of its key c omponents and capabilities. 3.7 .1 T raining and e xecution paradigms A primary research objective of this work is to evaluate the perf ormance and scalability of dierent levels of dec entralization. T o this end, the framew ork is designed to seamlessly imp lement and c ompare three canonical MARL paradigms, each oering a unique balanc e of performanc e, scalability , and real-world deplo yability . • Centralized T raining, Centralized Execution (CTCE): In this paradigm, a single, centralize d polic y has access to the full global state (conc atenated observations of all agents) and outputs a joint action for all agents simultaneously . This model serv es as a theoretical upper bound f or s ystem perf ormance, as it represents the ideal of perfe ct inf ormation and fully coordinated ex ecution. While often intractable in real-world systems due to its violation of decentralization principles and exponential scaling challenges, it provides a benchmark for quantifying the performanc e gap betwe en the theoretical optimum and more practic al, decentralize d approaches. • Centralized T raining, Decen tralized Ex ecution (CTDE): This is a popular and practic al paradigm that represents a hybrid appro ach. Agent policies are trained oine in a centralize d simulator with access to global information (e.g., the states and actions of other agents, centralized critics). This allows the learning algorithm to solve the cre dit assign- ment problem and learn comple x, coordinated strategies. During inferenc e, howev er, each agent’s policy operates in a fully decentralized manner, relying only on its own local observation. This approach is highly compelling because it allows for sop histicated, coordinated strategies to be learned oine while still producing policies that are deplo yab le in a realistic, dec entralized setting without requiring a central c ontroller at runtime. • Decentralized T raining, Decentralized Execution (DTDE): This represents the fully dec entralized ideal, most closely mirroring the constraints of man y real-world systems. Each agent learns its policy independently , based only on its own stream of local observations and rewards, without a centralized training coordinator. This paradigm is highly scalable and robust to single points of failure. How ever, it fac es signicant theoretical challenges related to the non-stationarity of the en vironment (as other agents’ policies are constantly changing) and the diculty of credit assignment. Our framework’s f ocus on implicit c ooperation through shared KPI signals in the observation and rew ard functions is specically designe d to address these challenges and make DTDE a more viable and e ectiv e approach. 20 3.7 .2 Reinfor cement learning alg orithms and infrastructure The framew ork integrates with high-perf ormance RL libraries to implement the learning algorithms. While the modular design is algorithm-agnostic, our experiments primarily leverage state-of-the-art policy gradient and actor-critic methods suitable for multi-agent environments and c ontinuous action spac es. W e highlight three imp lemented algorithms: • Pro ximal policy optimization (PPO ): A robust on-po licy algorithm rec ognized for its stability and sample eciency [ 52 ]. Its core innovation is a clipped objective function that prevents destructively large policy updates, making it a strong and reliable b aseline for c omplex c ontrol tasks. • Asynchronous pro ximal policy optimization (APPO): APPO enhances scalability for distributed training through o-polic y corre ctions (V -trac e), which allows the algorithm to learn from o-policy data more ee ctively [ 52 ]. This is particularly valuable in multi-agent environments where agents may have dierent learning rates and exploration strategies, leading to o-polic y data that standard PPO cannot handle eciently . • Soft actor-critic (SAC): An o-polic y algorithm that encourages e xploration by adding an entropy bonus to the ob- jectiv e [ 53 ]. This principle d approach to b alancing e xploration and exploitation makes it highly e ective in c ontinuous contro l tasks, often leading to more robust and performant nal policies, which is p articularly valuable for discov ering nov el coordination strategies in the LEM. T o manage the complexity of large-scale MARL experiments, the training infrastructure incorporates advanc ed tech- niques such as P opulation-Based T raining [ 54 ], which is a h ybrid approach that jointly optimizes the neural netw ork weights and hyperp arameters of a population of agents, dynamically allocating computational resources to the most promising train- ing runs. This automates the dicult process of hyperp arameter tuning and often leads to more robust and higher-performing nal po licies, which is particularly benecial in the non-stationary context of MARL. The entire experimental w orkow , from training and checkpointing to metrics colle ction and nal inferenc e, is managed to ensure reproducibility and rigorous scientic comp arison. 3.8 Analytics and visualizations An Analyti cs Module and a Visuali zation Module are integrated into the framework, providing a suite of tools for process- ing, analyzing, and plotting the high-dimensional data generated during simulation runs. This module is essential for moving beyond ra w numerical outputs to a qualitativ e understanding of the emergent dynamics within the LEM. The visualization cap abilities are categorized to provide distinct perspe ctives on the simulation outc omes: • Analysis of social and relational d ynamics: T o inv estigate the emergenc e of trading relationships and market struc- ture, the framework can generate a trading netw ork gure. In this plot, agents are rendered as nodes in a graph, and the execute d trades are represented as edges connecting them. The thickness of an edge is proportional to the total vo lume of energy traded between the two agents, and the grayscale tone of each edge represents the distance betwe en the agents, providing a visualization of the market’s social fabric. This allows for the direct observation of how stable trading co alitions and preferred p artnerships evo lve o ver time. • Economic perf ormance analysis: T o understand the statistical properties of market outcomes, the Visuali zation Module can generate price and vo lume distribution plots. These histograms and kernel density estimates reveal the distribution of market clearing prices and trade v olumes, o ering insights into price stability , market liquidity , and the ov erall eciency of pric e discov ery under dierent market me chanisms. • Spatio-temporal pattern rec ognition: T o analyze the ph ysical dimension of market activity , a spatial distribution of trading activity plot can be generated. This visualization renders the grid topology as a heatmap, where the co lor inten- sity of dierent nodes or areas c orresponds to the volume of trading activity . This is particularly useful f or identifying the emergence of localized trading hubs and for correlating economic activity with ph ysical grid phenomena, such as congestion. • P erformance dash boards: F or a high-lev el, comp arative o verview of di erent experimental scenarios, the framew ork provides a suite of metrics dashboards. These composite plots summarize the most critical KPIs from the Analyti cs Module into a single, easily digestible f ormat. Dedicated dashboards are av ailable for grid stability , ec onomic eciency , resource utilization, and DSO perf ormance, allo wing researchers to quickly assess and comp are the multi-fac eted out- comes of their e xperiments. 21 3.9 Compl ete simulation worko w The preceding sections have detailed the individual components of the framework; this nal subsection elucidates how these modules are orchestrated into a comp lete, end-to-end simulation loop. The step method within the LEM en vironment man- ages this sequenc e of operations, ensuring that data ows logically betw een the agents, market, grid, and c oordination modules at each discrete trading period 𝑡 ∈ { 1 , . . . , 𝜏 } . Understanding this workow is essential f or appreciating how the framework maintains state consistenc y and facilitates the agent learning process. The entire process at each trading period 𝑡 ∈ { 1 , . . . , 𝜏 } is c onceptualized as a sequence of eight distinct p hases, from initial agent de cision to the nal observation and reward fee dback (see Fig. 3 ). A detailed breakdown of the simulation proc ess is as fo llows: 1. Action processing and validation: The workow begins with the ra w action rec eived from the MARL po licies. For each agent, the rst and most critic al step is to ground its intended action in ph ysical reality . Agents limit each action base d on the current generation, demand, and the agent’s battery state. Subsequently , the Acti on Module performs a rule-base d validation, ensuring the action’s components (price, quantity , buy / sell, partner) fall within the predened market bounds. This two-step validation ensures that only ph ysically and economic ally plausible actions proceed to the next p hase. 2. Ord er creation and market submission: V alidated actions are then formatted into formal orders. If the agent’s polic y is not directly controlling partner choice, a rule-based selection method can be inv oked here, scoring potential partners based on reputation and grid distance. This phase culminates in a co llection of structured orders ready for market submission. 3. Mark et clearing and trade ex ecution: The collection of orders is passe d to the Market Module which ex ecutes its three-stage clearing proc ess: it rst attempts to match mutually preferre d p artners, then processes the remaining orders through the price-based double auction (factoring in reputation scores), and nally clears any residual unmatched orders with the DSO . The output of this phase is a list of all ex ecuted trades and summary statistics. 4. Energy tracking and battery updates: The list of all ex ecuted trades is use d to update the ph ysical state of each agent (e.g., internal energy tracking variab les and change in the battery’s SoC), and grid state (e.g., balanc e and congestion). 5. Rew ard calculation and KPI updates: With the economic and ph ysical outcomes of the trading period 𝑡 ∈ { 1 , . . . , 𝜏 } now determined, the Impli cit Cooperati on Module gathers all necessary data (trades, agent states, grid conditions) to compute the full suite of system-level KPIs. These KPIs are then passed to the reward function, which calculates the nal, c omposite reward for each agent, combining their individual perf ormance with the c ooperation bonuses deriv ed from the system-wide KPIs. 6. State transitions and en vironment updates: This phase advances the simulation’s global state, and the environ- ment’s internal clock is incremented. Crucially , agent-level states that depend on the full market outcome, such as nancial balanc es and reputation scores, are updated b ased on the results from the Reputation Module . 7. Observation update and information sharing: The Observation Module constructs the next local observation for each agent ( 𝑜 𝑖 ,𝑡 + 1 ∈ 𝑂 𝑖 ). This new observation ve ctor is assemble d from the newly update d en vironment state, includ- ing the agent’s private information, public market signals, and the system-lev el KPIs calculated in Phase 5. This step closes the information loop , providing agents with the f eedb ack necessary f or their next decision. 8. Episode managemen t and termination: Finally , the environment checks f or termination conditions (e.g., reaching the maximum number of trading periods 𝜏 f or the episode). If the episode has not conclude d, the en vironment returns the newly generated observ ations and c omputed rew ards to the MARL algorithm, and the entire workow repeats f or trading period 𝑡 + 1 ∈ { 1 , . . . , 𝜏 } . This orchestrated worko w ensures that every agent’s action inuences the market and grid, the colle ctive outcome is measured and translated into shared signals (KPIs), and those signals are then used to inform and incentivize the agents’ de- cisions in the subsequent trading period. This constitutes the core feedb ack loop that enables the study of emergent, implicit cooperation within a c omplex, de centralized system. 4 Experimental setup T o evaluate the capabilities of the proposed LEM simulation framework and demonstrate its utility , a computational experi- ment was designed. This section details the experimental scenario , implementation specics, and baseline models for c ompar- ison. While the framework supports a wide range of experiments, this paper focuses on a single, comprehensiv e case study: 22 LEM Env Loo p DER Ag en t R LTrai n er R LIn f e re nc e M A R L Ag e nt s LEM Plat f or m M ar ke t pl ac e Im pl ic i t Co op er at io n Im pl ic i t Co op er at io n Ord er M at c h er R e pu t at io n Han d le r Val id at or M A R L A ge nt s Plat f or m M ar ke t pl ac e Plat f or m M ar ke t pl ac e Plat f or m M ar ke t pl ac e R eg ist er ag ent Init ializ e rep utat ion trac ki ng Prov ide K P Is Subm it o rde r (b uy/ sell) Chec k o rd er f esib ilit y w it h gr id c on str aints Ord er M at c h er Loop Subm it trad es fo r valid ati on Trad e co nf irm atio n Up date rep utat ion f or eac h age nt R ep or t ag ent re put atio n Up date KPIs R et ur n tr ades cl eari ng Ma tch ord ers and cle ar mar ket R et ur n (ob s, rew , do ne, in fo ) Up date pol icy (M AR L) Com put e ac tio n (lo cal obs and KPIs) DSO Ag e nt Gri d Ne t w or k Plat f or m M ar ke t pl ac e Plat f or m M ar ke t pl ac e Up date gr id st ate Forw ard ord er f or matc hin g Clear unm atc hed ord ers Inf orm un cle ared orde rs Forw ard cle ared ord ers Valid ate tr ansac tio ns bl ock s Figure 3: A sequence diagram f or the simulation w orkow of the MARLEM framew ork. battery storage coordination. This case study is selected for its ability to demonstrate the interplay between individual agent cap abilities (energy storage), market dynamics, ph ysical constraints, and the emergence of implicit coordination, thereb y uti- lizing all core modules of the framew ork. Readers interested in the full suite of implemented case studies (see Section 4.3 ) or wishing to rep licate the experiments describe d here can nd detailed c ongurations and corresponding implementations in the project’s dedic ated GitHub repository ( https://github. com/ salazarna/ marlem ). 4.1 Case stud y: battery storage coordination This case study showc ase and analyzes the role of battery energy storage systems in decentralized LEMs, leveraging the frame- work’s integrate d models. The primary goal is to analyze how dierent b attery c ongurations and deplo yment strategies aect the emergence of im- plicit c oordination among agents (MARL or otherwise), inuence ov erall market eciency (e.g., price vo latility , social welf are), and contribute to grid stability through enhanc ed exibility . The simulation environment is congured with 7 agents operating on a 24-hour daily cy cle in a grid network with a mesh topology and a nominal capacity of 1200 kW . A bid-ask spread clearing mechanism is emplo yed, chosen specically because the inherent dierenc e between buy and sell prices creates clear economic incentiv es for storage arbitrage, thus highlighting the value that agents learn (or exploit, if they do not learn) from their batteries. The market allows f or a wide price range (i.e., 35-280 $/MWh) and quantity range (i.e., 0.1-200 kWh) to ac commodate storage-driv en strategies. In this paper w e showc ase tw o distinct scenarios (although readers can nd six comprehensiv e scenarios in the dedicated GitHub repository), each featuring agents with the same base generation cap acity (i.e., 60 kW , with some random variation) and associated proles but with di erences in the deplo yment of their batteries: 1. No battery: A baseline scenario estab lishing performanc e without an y storage e xibility , f orcing agents into real-time market particip ation only . All agents are congured to ha ve no b attery . 2. Strategic battery: Explores deployment where agent proles (generation/ demand timing) and storage cap abilities (varying ratios 0.5-1.2, high 95% ecienc y) are spe cically designed a priori to f acilitate c oordinated load balancing and time-shifting across the c ommunity (e.g., agents with morning generation peaks p aired with storage potentially serving agents with evening demand peaks). 23 4.2 Baseline models T o evaluate the performanc e achieved by the agents within case study , the fo llowing baselines are essential for establishing conte xt: • Zero-in telligence agents: This baseline serves as a low er bound on performance. Agents operate without an y learn- ing or strategic foresight. At each time step, they submit random bids using a uniform random distribution within price bounds that are valid within the market’s price and quantity limits and respect their individual ph ysical con- straints (e.g., battery SoC, generation availability). Comparing MARL performance (when trained) against this base- line demonstrates that learned policies are non-trivial and achieve meaningful economic and coordination outcomes beyond random chanc e. For the purposes of clarity and demonstration of the cap abilities of the framew ork, the results presented in Section 5 will utilize these zero-intelligenc e agents to illustrate the impact of dierent congurations (e.g., battery sc enarios). • MARL with CTCE paradigm: As detailed in Section 3.7.1 , this paradigm acts as a theoretical upper bound within the context of the MARL algorithms used. A single polic y , trained with acc ess to the full global state and controlling all agents simultane ously using the same underlying MARL algorithm (e.g., PPO , APPO or SA C), represents the best achievab le performanc e under conditions of perfect information and perf ect coordination attainable by that algorithm. Comparing decentralized exe cution results (CTDE or DTDE) against the CTCE benchmark allows for quantifying the performanc e degradation attributable to partial observability and independent decision making inherent in de- centralize d ex ecution. While full MARL training is deferred to future work (see Section 6 ), this benchmark remains relevant f or contextualizing potential perf ormance. 4.3 Other impl emented c ase studies Beyond the focus on battery storage coordination, the framework’s versatility is further demonstrated by other fully imple- mented case studies a vailable in the de dicated GitHub repository . These include: • Mark et mechanism comparison: Compares six dierent pricing/ clearing rules to assess their impact on eciency and agent strategies. • Agent heterogeneity and market power: Explores market dynamics under v arying lev els of agent size concentration (balanc ed, monopoly , oligopoly). • DSO intervention strategies: Ev aluates how dierent DSO regulatory stances (permissiv e, moderate, strict) ae ct market particip ation and grid stability . • Grid topology and congestion eects: Examines the inuence of network structure and cap acity limits on trading patterns and c oordination. These additional studies, while not detailed here, underscore the framework’s cap acity as a comprehensive tool f or LEM research. 5 Results and discussion This section presents the analytical capabilities and techno-economic sensitivity of the proposed simulation framework. As outlined in Section 4 , the ndings presented here are generated using the zero-intelligence agent baseline. By comp aring the no battery and str ategic battery scenarios using non-learning agents that operate under randomized but v alid heuristics, we can demonstrate the framew ork’s high-delity modeling. This allo ws us to observe how the ph ysics of the system (the market rules, grid constraints, and agent asset congurations) shape the outcomes, independent of the learned MARL policies. The results from full MARL training, which constitutes the ne xt work of this research, are detailed in Se ction 6 . 5.1 Frame work cap ability demonstration The c ore capability of the framework is its ability to quantify the systemic imp act of dierent ph ysical asset c ongurations. By simulating and contrasting these two scenarios, we can observe how the presence and strategic deplo yment of storage funda- mentally alter market outcomes, ev en when agent behavior is non-strategic. 24 5.1.1 Price vo latility and market stability A primary function of a battery is temporal arbitrage (buying low and selling high) which stabilizes prices. Our framework captures this economic-p hysic al interaction. Fig. 4 presents a c omparativ e of the statistic al distribution of P2P market clearing prices o ver the 24-hour simulation f or both scenarios of the case study . The no battery scenario (se e Fig. 4a ) serv es as a baseline and sho ws a v olatile market. The price distribution is multi-modal, with at two distinct price clusters. This is statistical evidence of a fractured market, where agents are entirely subject to the temporal mismatch betwe en generation driving low prices (e.g., the cluster near 140 $/MWh) and demand driving high prices (e.g., the cluster near 230 $/MWh). The mean of $173.6 is pulled aw ay from the median of $157.5, further indicating a skewed and unstable market. The strategi c battery scenario (see Fig. 4b ) demonstrates a transf ormation of the market structure. The distribution be- comes unimodal in a stable price regime that appro ximates a normal distribution. This is quantitatively conrme d by the fact that the mean of $152.2 and median of $158.5 are now almost identical, which is a f eature of a symmetrical, stable, and predictab le market. This result demonstrates that the mere presence of strategically congured battery acts as a stabilizing asset, even with non- intelligent agents. The battery provides temporal exibility , allowing the market to bridge the gap between high-generation and high-demand periods. This arbitrage eectiv ely clips the price extremes and allows the market to conv erge to a stable clearing price. This nding validates the framework’s high-delity techno-economic model, proving its cap ability to capture the emergent, systemic e ects that ph ysical assets ha ve on market dynamics. 5.1.2 Grid stability and sy stem coordination The framework’s Impli cit Cooper ation Module is designe d to quantify system stability b y measuring the supply-demand imbal- ance and calculating the coordination sc ore as dened in ( 23 ). T o illustrate this, Fig. 5 and Fig. 6 shows the net grid imbalance and the P2P trading ratio ov er the 24-hour simulation cy cle, respectively . The no battery scenario shows a volatile imbalanc e prole, mirroring the temporal mismatch between generation and demand. This forc es a heavy and continuous reliance on the DSO to act as a sink or source, resulting in a low coordination core. The strategi c battery scenario demonstrates a smoother net load prole with a higher ov erall coordination score. The agents’ batteries, ev en when operated b y zero-intelligenc e po licies, pro vide a passive damper that absorbs s ystemic disturb ances. The design of the str ategic battery scenario (i. e., agents with morning generation and storage, agents with ev ening demand and storage) creates a natural, system-wide c omplementarity . 5.1.3 Mark et structure and economic eciency Beyond scalar metrics, the framework’s Visua lization Module provides insights into the structure of the market. Fig. 7 illus- trates the structural changes to the market’s social and spatial characteristics enab led by storage. Fig. 7 visualizes the P2P trading network, where nodes represent agents and edges represent the volume of trade betw een them. The no battery scenario (see Fig. 7a ) depicts a market where most agents (blue nodes) are in a net-demand state, force d to buy all their energy from the DSO (main seller). This demonstrates a market with no liquidity , no self-suciency , and a lo w vo lume of P2P trading. The str ategic battery scenario (see Fig. 7b ) shows that agents hav e mostly dierentiate d into clear roles (i.e., agents with morning/ afternoon generation are net sellers, agents with evening demand are net buyers), and trade more with each other. This indicates that the temporal e xibility from batteries has create d the market. Furthermore, the role of the DSO has reverse d from being the main seller in the no battery scenario to being the main buy er. This result showc ases the LEM has transitioned from a state of energy decit, dependent on the external grid, to a state of self-suciency and is now a net exporter of its surp lus. This validation pro ves the framew ork’s ability to capture systemic changes in market structure and ec onomic ow . 5.2 Discussion The results from the zero-intelligence agent simulations validate the framework’s design, demonstrating that the underlying techno-ec onomic model is suciently high-delity to capture the impact of ph ysical asset congurations on market and grid performanc e. T able 2 presents a quantitative summary c omparing the no battery and str ategi c battery scenarios, f ocusing on the aggregate agent rewards, which serv e as a proxy f or ov erall market viability and agent protability . The str ategic battery scenario achieves a positive a verage aggregate reward of +42929.5, a reversal from the baseline’s large negative reward of -61556.1. This demonstrates the economic and systemic value that strategically deploy ed storage resources, 25 P rices 100 125 150 175 200 225 250 275 P rice ($/kWh) Distribution of Clearing Prices Mean: $173.6 Median: $157.5 V olumes 50 100 150 200 250 V olume (kWh) Distribution of T rade V olumes Mean: 138.5 kWh Median: 147.3 kWh Statistical Distributions of Mark et Prices and V olumes (a) No battery sc enario. P rices 75 100 125 150 175 200 225 250 P rice ($/kWh) Distribution of Clearing Prices Mean: $152.2 Median: $158.5 V olumes 50 75 100 125 150 175 200 225 V olume (kWh) Distribution of T rade V olumes Mean: 107.2 kWh Median: 90.9 kWh Statistical Distributions of Mark et Prices and V olumes (b) Strategic battery sc enario. Figure 4: Statistical distributions of market clearing pric es and trade vo lumes for the c ase study . even when operated non-strategically , provide to the market ecos ystem by enabling temporal arbitrage. This validation provides a testbed f or quantifying the value of dierent s ystem designs and ph ysical assets. The framework is prov en to be sensitive to the ph ysical prerequisites for coordination (i.e., storage); the str ategic battery scenario , for instance, creates clear, complementary roles that are ideal for future MARL agents to learn to ll. While this study held the market mechanism constant, the inuence of storage on price volatility directly demonstrates the framework’s cap ability to analyze the coupling between market mechanisms and ph ysical assets. Furthermore, this case study directly ad- dresses the impact of p h ysical grid constraints. The battery p arameters (e.g., SoC or eciency) are a f orm of temporal ph ysical constraint, and their presence inuences agent behavior and market outcomes, validating the framework’s cap acity to test the market-versus-grid dichotom y . While the presented 7-agent study validates the framework’s functional capabilities, a formal quantitative scalability anal- ysis remains a c ritical c omponent of future w ork. This w ould inv olv e ex ecuting simulations with inc reasing agent populations (e.g., 10, 50, 100+ agents) to plot computational time and analyze the impact of agent count on market KPIs, thereby testing the framework’s perf ormance under lo ad. W e must reiterate that the results presented in this paper are illustrative and emplo y a zero-intelligence agent baseline to validate the simulation framework’s cap ability . A full MARL training is required to understand the emergent behavioral dynamics and the full potential of implicit c ooperation (authors will publish this work in a f orthcoming p aper). 26 0 5 10 15 20 T ime Step 40 60 80 100 120 140 160 180 200 Grid Balance Deviation Grid Balance Deviation Over Time 0 5 10 15 20 T ime Step 0.0 0.2 0.4 0.6 0.8 1.0 P2P R atio P2P Coordination Ratio 0 5 10 15 20 T ime Step 0.0 0.2 0.4 0.6 0.8 1.0 Coor dination Scor e Coordination Effectiveness Score 7 8 9 10 11 12 13 14 Number of T rades 0 2 4 6 8 10 12 F r equency 12 2 6 2 1 Distribution of T rade Counts (a) No battery sc enario. 0 5 10 15 20 T ime Step 0 10 20 30 40 50 60 70 Grid Balance Deviation Grid Balance Deviation Over Time 0 5 10 15 20 T ime Step 0.0 0.2 0.4 0.6 0.8 1.0 P2P R atio P2P Coordination Ratio 0 5 10 15 20 T ime Step 0.0 0.2 0.4 0.6 0.8 1.0 Coor dination Scor e Coordination Effectiveness Score 6 7 8 9 10 11 12 13 14 Number of T rades 0 1 2 3 4 5 6 F r equency 1 6 3 4 2 2 3 1 1 Distribution of T rade Counts (b) Strategic battery sc enario. Figure 5: Grid balanc e deviation ov er time for the c ase study . 0 5 10 15 20 T ime Step 100 125 150 175 200 225 250 275 P rice ($/kWh) Clearing Price Over Time 0 5 10 15 20 T ime Step 0 50 100 150 200 250 V olume (kWh) T rading V olume Over Time T otal V olume P2P V olume DSO V olume 0 5 10 15 20 T ime Step 0.0 0.2 0.4 0.6 0.8 1.0 P2P R atio P2P T rading Ratio Over Time 0 5 10 15 20 T ime Step 0 2 4 6 8 10 12 14 Number of T rades 10 10 7 7 14 12 7 10 7 10 7 10 7 7 9 9 7 7 7 12 7 7 10 Number of T rades Over Time (a) No battery sc enario. 0 5 10 15 20 T ime Step 75 100 125 150 175 200 225 250 P rice ($/kWh) Clearing Price Over Time 0 5 10 15 20 T ime Step 0 50 100 150 200 V olume (kWh) T rading V olume Over Time T otal V olume P2P V olume DSO V olume 0 5 10 15 20 T ime Step 0.0 0.2 0.4 0.6 0.8 1.0 P2P R atio P2P T rading Ratio Over Time 0 5 10 15 20 T ime Step 0 2 4 6 8 10 12 14 Number of T rades 8 9 7 7 7 8 10 11 6 8 12 12 9 7 7 9 12 11 14 13 7 9 10 Number of T rades Over Time (b) Strategic battery sc enario. Figure 6: P eer-to-peer trading ratio o ver time f or the case study . Finally , as with all simulations, the c omponent models are abstractions that require continuous validation and calibration against real-world data to impro ve their delity . 6 Conclusion and futur e work In this paper, we have presented a nov el, open-sourc e simulation framework spe cically designe d f or the study of de centralized LEMs using MARL. Addressing a gap in the current landscape of energy simulation tools, specically the lack of a unied platf orm that integrates realistic market mechanisms, ph ysical grid c onstraints, and advanc ed MARL c apabilities within a stan- dardized and dec entralized paradigm, our framework provides a robust, extensible, and Gymnasium-compliant environment for researching the c omplex dynamics of future energy s ystems. The primary contribution is the LEM simulation framework itself. Its architecture and formulation as a Dec-POMDP ov ercomes the prevalent market-versus-grid dichotom y by cohesiv ely unifying a modular market platf orm (featuring a hybrid preferenc e/ price-based matching and reputation systems) with a physic ally grounded grid model (incorporating transmission losses and congestion management). The framework is architected to support and facilitate research into fully dec entralized learning and e xecution paradigms, moving beyond the limitations of centralized training assumptions common in prior w ork. 27 321.6 kWh 40.9 kWh 315.5 kWh 182.4 kWh 321.6 kWh 119.8 kWh 2.1 kWh 103.1 kWh 17.7 kWh 0.1 kWh 9.1 kWh 5.4 kWh 3.5 kWh 0.1 kWh 56.6 kWh 3.6 kWh 4.8 kWh 58.3 kWh 1.7 kWh 13.7 kWh 22.2 kWh 14.2 kWh 2.5 kWh 11.2 kWh 17.6 kWh 3.4 kWh 37.0 kWh 23.5 kWh DSO no_battery_004 no_battery_005 no_battery_007 no_battery_002 no_battery_006 no_battery_001 no_battery_003 Local Energy Mark et T rading Network Agent T ypes Buyers Sellers 0.0 0.2 0.4 0.6 0.8 1.0 1.2 Distance (km) (a) No battery sc enario. 235.4 kWh 53.5 kWh 182.5 kWh 70.7 kWh 186.9 kWh 141.9 kWh 248.8 kWh 17.0 kWh 63.7 kWh 30.8 kWh 1.6 kWh 48.3 kWh 12.0 kWh 9.1 kWh 30.2 kWh 28.0 kWh 15.5 kWh 0.2 kWh 9.8 kWh 0.6 kWh 6.7 kWh 24.7 kWh 49.2 kWh 24.8 kWh 31.5 kWh 15.8 kWh 38.9 kWh DSO morning_gen_001 coordinator afternoon_gen_002 evening_dem_001 evening_dem_002 morning_gen_002 afternoon_gen_001 Local Energy Mark et T rading Network Agent T ypes Buyers Sellers 0.0 0.2 0.4 0.6 0.8 1.0 1.2 Distance (km) (b) Strategic battery sc enario. Figure 7: Local energy market trading netw ork for the strategic b attery scenario of the c ase study . T able 2: P erf ormance c omparison of the sc enarios no battery and str ategic battery for the case study . Metric No Battery Strategic Battery A verage Rew ard -61556.1 +42929.5 Final Reward -30827.1 +78202.6 Battery Ratio 0.00 0.74 A verage Ecienc y - 95% SOC Range - 10-90% A second key contribution is the framework’s explicit f ocus on enabling the study and fostering of implicit cooperation. W e achieve this through a no vel methodologic al approach embedded within the framew ork: the enrichment of agents’ partial observations with system-lev el KPIs and the integration of these KPIs into a multi-objective reward function. This creates a unique feedb ack loop, demonstrating a viable pathw ay for guiding autonomous, self-interested agents towards collectiv ely benecial, coordinate d behaviors without nec essitating explicit c ommunication or centralize d control. This work lays the foundation for future research enabled by the developed framework. The immediate next step is a comprehensiv e validation of the implicit cooperation mechanisms facilitated by this framework. This inv olves conducting large-scale MARL training experiments utilizing the framework’s full capabilities. Specically , we will train agents using the implemented state-of-the-art MARL algorithms (i.e., PPO, APPO, and SAC) across the spectrum of training and inferenc e paradigms: CT CE as a benchmark, the practical CTDE approach, and, most importantly , the fully dec entralized DTDE paradigm that aligns with real-world LEM principles. These experiments will systematically evaluate how dierent market designs, grid conditions, and learning parameters inuence the emergence and eectiv eness of implicit coordination, quanti- fying the trade-os betwe en decentralization, perf ormance, and stability . Beyond this core validation, the modularity and extensibility of the framew ork open sev eral promising a venues f or future research: • Integrating more sophisticated DER models: Enhancing the delity of agent models by incorporating more de- tailed representations of battery degradation, charging/ discharging patterns of electric vehicles, building thermal dy- namics, or heterogenous agent objectiv es (e.g., risk av ersion, fairness c oncerns). • Expl oring advanced MARL algorithms: Implementing and benchmarking a wider suite of cutting-edge MARL algorithms, including those incorporating communication protocols (to contrast with implicit methods), alternative value dec omposition techniques, or model-base d approaches. • Scalability analysis: Conducting a formal quantitative scalability analysis by executing simulations with increasing 28 agent populations (e.g., 10, 50, 100+ agents) to plot computational time and analyze the impact of agent count on market KPIs. • Applic ation to real-world data: V alidating and calibrating the simulation framework using empiric al data from pilot LEM projects or real distribution netw orks to enhance its accurac y and practical relev ance for po licy analysis. • Analysis of communication constrain ts: Extending the framework to explicitly model the impact of realistic com- munication network limitations (latency , b andwidth) and potential threats (e.g., f alse data injection) on the robustness and security of dec entralized market operations. W e believe this LEM simulation framework will serve as a useful tool for the research community , polic ymakers, and industry practitioners striving to design, analyze, and deplo y the intelligent, resilient, ecient, and truly decentralize d energy systems require d for a sustainable future. Ref erences [1] C. Feng, A. L. Liu, P eer-to-P eer Energy T rading of Solar and Energy Storage: A Networke d Multiagent Reinforc ement Learning Approach (Oct. 2024). , doi:10.48550/arXiv.2401.13947 . [2] A. W eidlich, T . Künzel, F. Klumpp, Bidding Strategies for Flexib le and Inexible Generation in a P ow er Market Simula- tion Model: Model Description and Findings, in: Proceedings of the Ninth International Conf erence on Future Energy Systems, A CM, Karlsruhe Germany , 2018, pp. 532–537. doi:10.1145/3208903.3214347 . [3] California Independent System Operator, P acic Gas & Electric, Southern California Edison, San Diego Gas & Electric, Coordination of transmission and distribution operations in a high distributed energy resource electric grid , White paper, Gridworks, California, USA, prepared by sta of CAISO, PG&E, SCE, SDG&E with support from Gridworks (June 2017). URL https://gridworks.org/wp- content/uploads/2017/01/Gridworks_ CoordinationTransmission.pdf [4] D . Qiu, J. W ang, J. W ang, G. Strbac, Multi-Agent Reinforcement Learning for Automated P eer-to-P eer Energy T rading in Double-Side Auction M arket, in: Procee dings of the Thirtieth International Joint Conference on Articial Intelligenc e, International Joint Conferenc es on Articial Intelligence Organization, Montreal, Canada, 2021, pp. 2913–2920. doi: 10.24963/ijcai.2021/401 . [5] N. Harder, K. K. Miskiw , M. Khanra, F. Maurer, P . P atil, R. Qussous, C. W einhardt, M. Klobasa, M. Ragwitz, A. W ei- dlich, ASSUME: An agent-based simulation framework for exploring electricity market dynamics with reinforc ement learning, SoftwareX 30 (2025) 102176. doi:10.1016/j.softx.2025.102176 . [6] D . Qiu, J. W ang, Z. Dong, Y . W ang, G. Strbac, Mean-Field Multi-Agent Reinforc ement Learning for P eer-to-P eer Multi-Energy T rading, IEEE T ransactions on Po wer Systems 38 (5) (2023) 4853–4866. doi:10.1109/TPWRS.2022. 3217922 . [7] R. Henry , D . Ernst, Gym-ANM: Reinforcement learning en vironments for active network management tasks in electric- ity distribution systems, Energy and AI 5 (2021) 100092. doi:10.1016/j.egyai.2021.100092 . [8] F. Charbonnier, B. P eng, T . Morstyn, M. McCulloch, Centralised rehearsal of decentralised cooperation: Multi-agent reinforc ement learning for the scalab le coordination of residential energy exibility (Jun. 2023). , doi:10.48550/arXiv.2305.18875 . [9] R. M. Czekster, T ools for modelling and simulating the Smart Grid (Nov . 2020). , doi:10. 48550/arXiv.2011.07968 . [10] D . P . Chassin, K. Schneider, C. Gerkensmeyer, GridLAB-D: An open-source power systems modeling and simulation environment, in: 2008 IEEE/PES T ransmission and Distribution Conferenc e and Exposition, IEEE, Chicago , IL, USA, 2008, pp. 1–5. doi:10.1109/TDC.2008.4517260 . [11] R. D. Zimmerman, C. E. Murillo-Sanchez, R. J. Thomas, MA TPOWER: Steady-State Operations, Planning, and Analysis T ools for P ow er Systems Research and Educ ation, IEEE T ransactions on P ow er Systems 26 (1) (2011) 12–19. doi:10.1109/TPWRS.2010.2051168 . [12] M. Zade, S. D. Lumpp, P . T zscheutschler, U. W agner, Satisfying user preferences in community-b ased local energy mar- kets — Auction-based clearing approaches, Applied Energy 306 (2022) 118004. doi:10.1016/j.apenergy.2021. 118004 . 29 [13] N. T . Mbungu, R. M. Naidoo, R. C. Bansal, V . V ahidinasab, Overview of the Optimal Smart Energy Coordination for Microgrid App lications, IEEE Acc ess 7 (2019) 163063–163084. doi:10.1109/ACCESS.2019.2951459 . [14] J. V an Tilburg, L. C. Siebert, J. L. Cremer, MARL-iDR: Multi-Agent Reinf orcement Learning for Incentiv e-Based Residential Demand Response, in: 2023 IEEE Belgrade P owerT ech, IEEE, Belgrade, Serbia, 2023, pp. 1–8. doi: 10.1109/PowerTech55446.2023.10202941 . [15] K. Nwey e, K. Kaspar, G. Buscemi, T . Fonse ca, G. Pinto, D. Ghose, S. Duddukuru, P . Pratapa, H. Li, J. Mohammadi, L. Lino F erreira, T . Hong, M. Ouf, A. Capozzoli, Z. Nagy , CityLearn v2: Energy-exible, resilient, occup ant-centric, and carbon-a ware management of grid-interactive communities, Journal of Building P erformanc e Simulation 18 (1) (2025) 17–38. doi:10.1080/19401493.2024.2418813 . [16] G. W en, J. Fu, P . Dai, J. Zhou, DTDE: A new c ooperative multi-agent reinforc ement learning framework, The Innov ation 2 (4) (2021) 100162. doi:10.1016/j.xinn.2021.100162 . [17] A. D. Domınguez-Garcıa, C. N. Hadjicostis, Coordination of Distributed Energy Resources for Provision of Ancillary Services: Architectures and Algorithms. [18] D . Li, N. Lou, Z. Xu, B. Zhang, G. Fan, Ecient Communication in Multi-Agent Reinforc ement Learning with Implicit Consensus Generation. [19] S. Li, J. K. Gupta, P . Morales, R. Allen, M. J. Kochenderfer, Deep Implicit Coordination Graphs for Multi-agent Rein- forc ement Learning (2021). [20] J. R. Vázquez-Canteli, Z. Nagy , S. Dey , G. Henze, CityLearn: Standardizing Research in Multi-Agent Reinforc ement Learning for Demand Response and Urb an Energy Management. [21] S. Keren, C. Essayeh, S. V . Albrecht, T . Mortsyn, Multi-Agent Reinforc ement Learning for Energy Networks: Compu- tational Challenges, Progress and Open Problems. [22] D . Biagioni, X. Zhang, D. W ald, D. V aidh ynathan, R. Chintala, J. King, A. S. Zamzam, P owerGridw orld: A framework for multi-agent reinforcement learning in power s ystems, in: Proce edings of the Thirteenth A CM International Confer- ence on Future Energy Systems, A CM, Virtual E v ent, 2022, pp. 565–570. doi:10.1145/3538637.3539616 . [23] C. Zhu, M. Dastani, S. W ang, A survey of multi-agent deep reinforc ement learning with communication, Autonomous Agents and Multi-Agent Systems 38 (1) (2024) 4. doi:10.1007/s10458- 023- 09633- 6 . [24] A. G. Givisiez, K. P etrou, L. F. Ochoa, A Review on TSO-DSO Coordination Models and So lution T echniques, Ele ctric P ow er Systems Research 189 (2020) 106659. doi:10.1016/j.epsr.2020.106659 . [25] T . Alazemi, M. Darwish, M. Radi, TSO/DSO Coordination for RES Integration: A Systematic Literature Review , En- ergies 15 (19) (2022) 7312. doi:10.3390/en15197312 . [26] M. Klein, U. J. Frey , M. Reeg, M odels Within Models – Agent-Based Modelling and Simulation in Energy Systems Analysis, Journal of Articial Societies and Social Simulation 22 (4) (2019) 6. doi:10.18564/jasss.4129 . [27] S. T rimarchi, F. Casamatta, L. Gamba, F. Grimaccia, M. Lorenzo, A. Nicc olai, A Review of Agent-Based Models for Energy Commodity Markets and Their Natural Integration with RL Models, Energies 18 (12) (2025) 3171. doi:10. 3390/en18123171 . [28] A. Akhatova, L. Kranzl, F. Schipfer, C. B. Heendeniya, Agent-Based Modelling of Urban District Energy System Decarbonisation—A Systematic Literature Review , Energies 15 (2) (2022) 554. doi:10.3390/en15020554 . [29] S. Li, Structured cooperativ e multi-agent coordination , Phd thesis, Stanford University , Stanford, CA, department of Aeronautics and Astronautics Engineering (M ay 2022). URL https://purl.stanford.edu/cr844qy0850 [30] J. R. Vázquez-Canteli, Z. Nagy , Reinforc ement learning for demand response: A review of algorithms and modeling techniques, Applie d Energy 235 (2019) 1072–1089. doi:10.1016/j.apenergy.2018.11.002 . [31] R. May , P . Huang, A multi-agent reinforc ement learning approach for inv estigating and optimising peer-to-peer pro- sumer energy markets, Applied Energy 334 (2023) 120705. doi:10.1016/j.apenergy.2023.120705 . [32] C. Sabillon, A. A. Mo hamed, A. Golriz, B. V enkatesh, Comprehensiv e platform f or distribution transactive energy mar- kets, IET Generation, T ransmission & Distribution 15 (16) (2021) 2344–2355. doi:10.1049/gtd2.12182 . [33] L. Qiu, Multi-Agent Reinforc ement Learning for Coordinated Smart rid and Building Energy Management Across Ur- ban Communities. 30 [34] S. Oh, J. Jung, A. Onen, C.-H. Lee, A reinforcement learning-based demand response strategy designed from the Aggre- gator’s perspectiv e, Frontiers in Energy Research 10 (2022) 957466. doi:10.3389/fenrg.2022.957466 . [35] H. Markgraf, M. Altho, Safe Multi-Agent Reinforcement Learning for Price-Base d Demand Response, in: 2023 IEEE PES Innovativ e Smart Grid T echno logies Europe (ISGT EUROPE), IEEE, Grenoble, France, 2023, pp. 1–6. doi:10. 1109/ISGTEUROPE56780.2023.10407281 . [36] J. Guerrero , A. Chapman, G. V erbic, Decentralized P2P Energy T rading under Network Constraints in a Low- V oltage Network (Sep . 2018). , doi:10.48550/arXiv.1809.06976 . [37] C. Essayeh, T . Morstyn, OPLEM: Open Platf orm for Local Energy Markets, Applied Energy 373 (2024) 123848. doi: 10.1016/j.apenergy.2024.123848 . [38] L. S. Melo , F. L. T of oli, D. Issicaba, M. E. P . Monteiro , G. C. Barroso, R. F. Sampaio , R. P . S. Leão, Co-simulation platf orm for the assessment of transactive energy systems, Electric P ow er Systems Research 223 (2023) 109693. doi: 10.1016/j.epsr.2023.109693 . [39] L. Thurner, A. Scheidler, F. Schäf er, J.-H. Menke, J. Dollichon, F. M eier, S. Meinecke, M. Braun, P andapow er - an Open Source Python T ool for Conv enient M odeling, Analysis and Optimization of Electric P ow er Systems, IEEE T ransactions on P ow er Systems 33 (6) (2018) 6510–6521. , doi:10.1109/TPWRS.2018.2829021 . [40] K. W ehrle, M. Güneş, J. Gross (Eds.), Modeling and T oo ls for Network Simulation, Springer Berlin Heidelberg, Berlin, Heidelberg, 2010. doi:10.1007/978- 3- 642- 12331- 3 . [41] C. Steinbrink, M. Blank-Babazadeh, A. El-Ama, S. Holly , B. Lüers, M. Nebel- W enner, R. P . Ramírez Acosta, T . Raub , J. S. Schw arz, S. Stark, A. Nieße, S. Lehnho, CPES T esting with mosaik: Co-Simulation Planning, Execution and Analysis, Applied Scienc es 9 (5) (2019) 923. doi:10.3390/app9050923 . [42] S. Hou, S. Gao, W . Xia, E. M. Sala zar Duque, P . P alensky , P . P . V ergara, RL-ADN: A high-performanc e Deep Reinforce- ment Learning environment f or optimal Energy Storage Systems disp atch in active distribution netw orks, Energy and AI 19 (2025) 100457. doi:10.1016/j.egyai.2024.100457 . [43] A. Green, energy-py: Reinforc ement learning for energy systems, https://github.com/ADGEfficiency/ energy- py , acc essed: 2024 (2024). [44] A. Marot, B. Donnot, G. Dulac-Arnold, A. Kelly , A. O’Sullivan, J. Vieb ahn, M. A wad, I. Guyon, P . P anciatici, C. Romero, Learning to run a P ow er Network Challenge: A Retrospective Analysis (Oct. 2021). , doi:10.48550/arXiv.2103.03104 . [45] M. Samv elyan, T . Rashid, C. S. de Witt, G. Farquhar, N. Nardelli, T . G. J. Rudner, C.-M. Hung, P . H. S. T orr, J. Foer- ster, S. Whiteson, The StarCraft Multi-Agent Challenge (Dec. 2019). , doi:10.48550/arXiv. 1902.04043 . [46] G. P apoudakis, F. Christianos, L. Schäfer, S. V . Albrecht, Benchmarking multi-agent deep reinforcement learning algo- rithms in cooperativ e tasks , in: Procee dings of the Neural Inf ormation Processing Systems T rack on Datasets and Bench- marks (NeurIPS), 2021. URL [47] S. Hu, Y . Zhong, M. Gao, W . W ang, H. Dong, X. Liang, Z. Li, X. Chang, Y . Y ang, Marllib: A scalable and ecient multi-agent reinforc ement learning library , Journal of Machine Learning Research (2023). [48] C. Steinbrink, A. A. V an Der Meer, M. Cvetko vic, D. Babazadeh, S. Rohjans, P . P alensky , S. Lehnho, Smart grid co- simulation with MOSAIK and HLA: A comp arison study , Computer Science - Research and Development 33 (1-2) (2018) 135–143. doi:10.1007/s00450- 017- 0379- y . [49] Z. Tian, S. Zou, I. Davies, T . W arr, L. Wu, H. B. Ammar, J. W ang, Learning to Communicate Implicitly by Actions, Pro- ce edings of the AAAI Conference on Articial Intelligence 34 (05) (2020) 7261–7268. doi:10.1609/aaai.v34i05. 6217 . [50] T . F onseca, L. L. Ferreira, B. Cabral, R. Severino, K. Nwey e, D. Ghose, Z. Nagy , EVLearn: Extending the cityLearn framework with electric v ehicle simulation, Energy Informatics 8 (1) (2025) 16. doi:10.1186/s42162- 024- 00445- w . [51] E. Liang, R. Liaw , P . Moritz, R. Nishihara, R. F ox, K. Goldberg, J. E. Gonzalez, M. I. Jordan, I. Stoica, RLlib: Abstractions for Distribute d Reinforc ement Learning (Jun. 2018). , doi:10.48550/arXiv.1712.09381 . [52] J. Schulman, F. W olski, P . Dhariwal, A. Radford, O. Klimov , Pro ximal P olic y Optimization Algorithms (Aug. 2017). arXiv:1707.06347 , doi:10.48550/arXiv.1707.06347 . 31 [53] T . Haarnoja, A. Zhou, P . Abbeel, S. Levine, Soft Actor-Critic: O-P olicy Maximum Entropy Deep Reinforc ement Learn- ing with a Stochastic Actor (Aug. 2018). , doi:10.48550/arXiv.1801.01290 . [54] M. Jaderberg, V . Dalibard, S. Osindero, W . M. Czarnecki, J. Donahue, A. Razavi, O. Vin yals, T . Green, I. Dunning, K. Simony an, C. F ernando, K. Kavukcuoglu, P opulation Based T raining of Neural Networks (Nov . 2017). arXiv: 1711.09846 , doi:10.48550/arXiv.1711.09846 . 32
Original Paper
Loading high-quality paper...
Comments & Academic Discussion
Loading comments...
Leave a Comment