Competing Risk Analysis in Cardiovascular Outcome Trials: A Simulation Comparison of Cox and Fine-Gray Models
Cardiovascular outcome trials commonly face competing risks when non-CV death prevents observation of major adverse cardiovascular events (MACE). While Cox proportional hazards models treat competing events as independent censoring, Fine-Gray subdist…
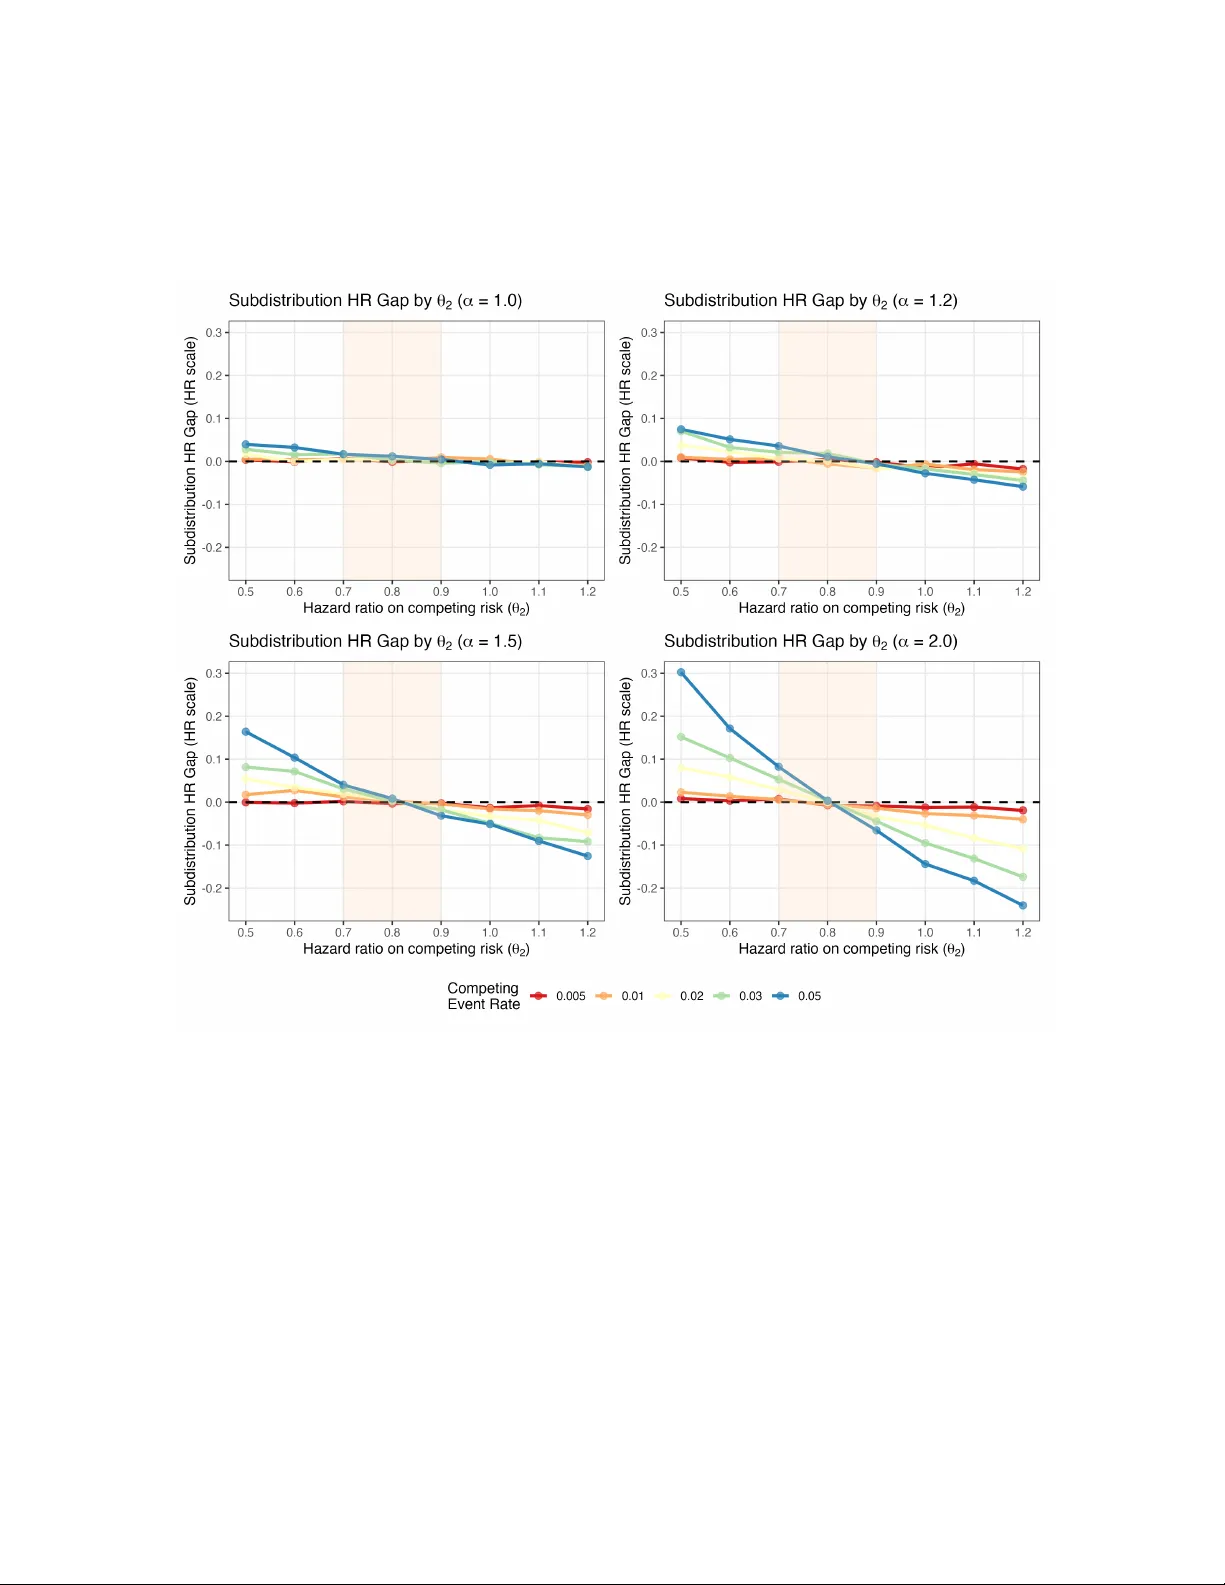
Authors: ** *저자 정보가 논문 본문에 명시되지 않아 제공할 수 없습니다.* **
Comp eting Risk Analysis in Cardio v ascular Outcome T rials: A Sim ulation Comparison of Co x and Fine-Gra y Mo dels T uo W ang ∗ and Y u Du † Global Statistical Sciences, Eli Lilly and Compan y , Indiana, United States F ebruary 19, 2026 Abstract Bac kground: Cardiov ascular (CV) outcome trials commonly encoun ter comp eting risks when non-CV death prev en ts observ ation of the primary endp oin t - ma jor adverse cardio v ascular even ts (MA CE). Standard Cox proportional hazards mo dels treat these comp eting even ts as indep endent censoring, while Fine-Gra y sub distribution hazard models are recommended for explicitly handling comp eting risks. Despite different estimands, both approaches are widely used in practice. This sim ulation study compares the tw o approaches across clinically relev an t scenarios to understand when they yield concordan t versus divergen t estimates and to provide practical guidance in CV outcome studies. Metho ds: W e conduct Mon te Carlo simulations generating correlated time-to-ev ent data using biv ariate copula mo dels. W e systematically v ary the comp eting even t rate (0.5% to 5% annually), treatmen t effect on the competing ev ent (50% reduction to 50% increase in hazard), and correlation b et w een primary and comp eting ev ents (indep enden t to strong p ositive correlation). Results: At competing even t rates typical of CV outcome trials (appro ximately 1% annually), Co x and Fine-Gra y pro duce nearly iden tical estimates of hazard ratios on a v erage, regardless of correlation strength or treatment effect direction. Substan tial divergence o ccurs only when comp eting rates are large with directionally discordant treatment effects. Imp ortan tly , neither estimator provides unbiased estimates of the true marginal hazard ratios when competing risk ev ent rate is high and treatment effects divergen t, although under sp ecific conditions of indep endence or consisten t treatment effects across ev en t types, closer approximation to the marginal hazard ratio can b e achiev ed. Conclusions: In typical CV outcome trial settings where comp eting ev ent rates remain low, Co x and Fine-Gray mo dels provide nearly identical estimates though they target different esti- mands. Cox models treating competing ev ents as censored remain appropriate for primary analysis ∗ tuo.wang@lilly.com † du_yu@lilly.com 1 due to their sup erior in terpretabilit y compared to Fine-Gray sub distribution hazards. Pre-sp ecified Co x mo dels should not b e abandoned in fa vor of comp eting risk metho ds. Imp ortantly , Fine-Gray mo dels do not constitute prop er sensitivit y analyses to Cox mo dels p er ICH E9(R1), as they target different estimands rather than testing assumptions of the same estimand. As supplemen- tary descriptive analysis, cumulativ e incidence using the Aalen-Johansen estimator can provide transparency ab out comp eting risk impact. The inconsistency of b oth estimators relative to the true marginal hazard ratio under certain high comp eting-risk scenarios motiv ates consideration of alternativ e approaches such as inv erse probabilit y of censoring weigh ting, multiple imputation, or inclusion of all-cause mortality in primary comp osite endp oints when deemed justified. Keyw ords: comp eting risks; Fine-Gray mo del; cardiov ascular trials; Cox prop ortional haz- ards; sub distribution hazard 1 In tro duction Cardio v ascular outcome trials (CV OTs) ev aluate treatment effe cts on comp osite endp oints that t ypi- cally include ma jor adverse cardio v ascular ev ents (MA CE-3: CV death, non-fatal m y o cardial infarc- tion, or non-fatal strok e). When patien ts die from non-CV causes b efore exp eriencing the primary endp oin t, these comp eting even ts preven t observ ation of the primary outcome and create a comp eting risk scenario requiring careful analytical consideration. In most CV OTs, non-CV death serves as the primary comp eting risk. The standard analytical approac h in most rep orted CV OTs uses Cox prop ortional hazards mo d- els ( Cox , 1972 ) that treat non-CV death as indep enden t censoring. Recen t large-scale trials with semaglutide illustrate this approach: the SELECT trial ev aluates MACE in patien ts with preexisting CV disease and o v erweigh t or ob esity but without diab etes( Lincoff et al. , 2023 ), while the FLO W trial assesses kidney outcomes in patients with type 2 diab etes and chronic kidney disease ( Perk ovic et al. , 2024 ). Ho w ev er, the indep enden t censoring assumption may b e inappropriate when comp eting ev en ts are informatively related to the primary endp oint—for instance, when b oth CV and non-CV deaths share common risk factors such as age, comorbidity burden, or disease severit y . Journal editors and review ers, particularly at high-impact ven ues such as The New England Jour- nal of Me dicine (NEJM), increasingly scrutinize the handling of competing risks in CV outcome tri- als. NEJM’s statistical rep orting guidelines sp ecifically address this issue in their “Considerations in Time-to-Ev en t Analyses” ( New England Journal of Medicine , 2022 ), stating that “when a substan tial prop ortion of participants exp erience a comp eting even t that precludes the o ccurrence of the primary outcome, alternative analytical approac hes such as the Fine-Gray mo del may b e considered.” The guidelines emphasize ev aluating whether censoring by comp eting even ts might b e informative. How- ev er, critical questions remain: What constitutes a “substan tial prop ortion” of comp eting even ts? A t what threshold do es the choice b etw een Cox and Fine-Gra y models affect or alter trial conclu- sions? How do es the dependency b etw een competing even ts and primary ev ents impact the result? Is Fine-Gra y mo del the b est mo del to handle comp eting risk? The NEJM guidelines do not provide quan titativ e b enchmarks for these decisions, leaving inv estigators uncertain about when comp eting risk metho ds add v alue v ersus unnecessary complexity . When comp eting ev ents are present, tw o analytical approaches are commonly used, each targeting 2 fundamen tally different estimands. T able 1 summarizes key distinctions b etw een the Cox prop ortional hazards mo del and the Fine-Gray sub distribution hazard mo del. Despite targeting at differen t esti- mands, b oth approaches are widely used in practice, and understanding when they yield concordant v ersus divergen t n umerical results has imp ortant practical implications for trial design, analysis plan- ning, and interpretation. A k ey question is whether the choice b etw een these methods affects trial conclusions in typical CVOT settings. T able 1: Comparison of Cox Prop ortional Hazards and Fine–Gray Sub distribution Hazard Mo dels in the Presence of Comp eting Risks Dimension Co x Prop ortional Hazards Mo del Fine-Gra y Sub distribution Hazard Mo del T arget estimand Cause-sp ecific hazard ratio Sub distribution hazard ratio Risk set definition Individuals who are even t-free at each time p oint (comp eting even ts treated as censored) Individuals who are even t-free, including those who hav e exp erienced a comp eting even t (who remain in the risk set with time-dep endent weigh ts) Handling of comp eting even ts Comp eting even ts are treated as indep enden t censoring Comp eting even ts are explicitly incorp orated through weigh ting in the sub distribution hazard Key mo del assumption Prop ortional cause-sp ecific hazards; indep enden t censoring by comp eting ev en ts Prop ortional sub distribution hazards In terpretation of treatmen t effect T reatment effect on the instantaneous rate of the primary even t among individuals who remain even t-free T reatment effect on the instantaneous rate of the primary even t in the sub distribution (including those ev en t-free or having exp erienced comp eting even ts) The Co x proportional hazards model ( Co x , 1972 ) is the most widely used approac h in CVOTs, treating comp eting ev ents as censored observ ations. This mo del estimates the instantaneous risk (hazard) of the primary CV ev ent among patien ts still at risk. The hazard ratio quantifies the treatmen t effect on the rate of primary even t o ccurrence, conditional on not y et having exp erienced either the primary or comp eting ev en t. This estimand addresses: “Among patien ts who remain ev ent-free, how do es treatmen t affect the rate of primary CV ev ents?” This in terpretation is straightforw ard and aligns naturally with clinical reasoning ab out treatment mechanisms. In the SOUL trial, the primary Co x analysis yields a hazard ratio of 0.86 (95% CI: 0.77-0.96) for MA CE-3 ( McGuire et al. , 2025 ), with non-CV death o ccurring at appro ximately 1.4 p er 100 patient- y ears. The Fine-Gra y sub distribution hazard mo del ( Fine and Gray , 1999 ) is often recommended for explicitly handling comp eting risks. This approach mo dels the sub distribution hazard, whic h relates directly to cumulativ e incidence functions. The subdistribution hazard ratio quantifies treat- 3 men t effects on the sub distribution hazard—the instantaneous rate of primary even t o ccurrence in the sub distribution, which includes b oth patients who remain at risk and those who hav e exp erienced comp eting ev ents (with mo dified weigh ts). While the sub distribution hazard relates to cumulativ e incidence probabilities, the sub distribution hazard itself is difficult to interpret clinically as mentioned b y multiple publications ( Austin and Fine , 2017 ; Austin et al. , 2021 ; Armbruster et al. , 2024 ; Gregson et al. , 2024 ). As an empirical example, the FIGARO-DKD trial ( Pitt et al. , 2021 ) ev aluates the effect of finerenone on CV outcomes in patients with chronic kidney disease and type 2 diab etes. The primary Cox anal- ysis yields a hazard ratio of 0.87 (95% CI: 0.76-0.98) for the primary comp osite CV outcome, while the Fine-Gray comp eting risk analysis accounting for death as a comp eting even t yields a sub distribu- tion hazard ratio of 0.87 (95% CI: 0.77-0.98), demonstrating numerical concordance b etw een metho ds. Notably , the finerenone FDA lab el includes only Cox mo del results, not Fine-Gra y mo del results, highligh ting regulatory acceptance of Cox mo dels as the primary analytical approach when comp eting ev en t rates are low. A critical but often o verlooked issue is that neither the Co x model nor the Fine-Gray mo del necessarily provides a consisten t estimator of the marginal hazard ratio—the treatment effect on the primary even t in the ov erall population—when competing risks are present and treatment affects b oth even t t yp es. Despite extensive metho dological literature on comp eting risks, practical guidance remains limited regarding when the choice betw een Cox and Fine-Gra y mo dels affects trial conclusions in CVOTs. F urthermore, understanding the conditions under which b oth estimators fail to reco v er consisten t estimates of the marginal hazard ratio has important implications for method selection. This sim ulation study addresses these gaps by systematically comparing Cox prop ortional hazards mo dels and Fine-Gray sub distribution hazard mo dels across parameter ranges relev ant to CV outcome trials, with key parameters calibrated from historical CVOT data. Sp ecifically , we aim to: (1) quantify the divergence b etw een Cox and Fine-Gray mo del estimates across realistic scenarios; (2) iden tify parameter thresholds where mo del choice substantially impacts trial in terpretation; (3) c haracterize scenarios where neither estimator provides consisten t reco v ery of the marginal hazard ratio; and (4) provide evidence-based guidance for analytical approach selection in CVOTs. The remainder of this pap er is organized as follows. Section 2 describ es the simulation design, data generating mechanism, and statistical analyses. Section 3 presen ts simulation results comparing the t w o metho ds across sc enarios, with emphasis on typical CVOT parameter ranges. Section 4 discusses implications and practical recommendations. Section 5 pro vides conclusions. 2 Metho ds W e conduct a Monte Carlo simulation study mimicking CV outcome trials in a real-w orld setting, where MACE-3 serves as the primary endp oint and non-CV death acts as the comp eting risk. 4 2.1 Sim ulation Set-up W e generate correlated ev e n t times using a biv ariate Gumbel-Hougaard copula, which allows flexible sp ecification of dep endence b et ween primary CV even ts and comp eting non-CV death while main tain- ing exp onential marginal distributions. Let T 1 denote time to the time to first MACE-3 even t and T 2 denote time to comp eting non-CV death. F or a patien t with treatmen t assignment Z (where Z = 1 indicates treatment and Z = 0 indicates control), the joint surviv al function is: S ( t 1 , t 2 | Z = z ) = P ( T 1 > t 1 , T 2 > t 2 | Z = z ) = exp {− [( θ z 1 · λ 1 · t 1 ) α + ( θ z 2 · λ 2 · t 2 ) α ] 1 /α } (1) where λ 1 and λ 2 are baseline ev en t rates, θ 1 and θ 2 are treatmen t hazard ratios for each ev en t t yp e, and α is the copula dep endence parameter that controls the correlation b etw een ev en ts ( Oakes , 1989 ). Data generation steps. F or each simulated trial dataset: 1. Randomization: Generate treatment assignmen t Z i ∼ Binomial( n = 1 , p = 0 . 5) for eac h patien t 2. Correlated uniform v ariables via Gumbel-Hougaard copula: Generate biv ariate uniform random v ariables ( U 1 i , U 2 i ) that follow the Gum b el-Hougaard copula structure. The copula data generation is implemented using the gumbel pack age in R ( Dutang , 2024 ). The parameter α determines correlation b etw een T 1 and T 2 through Kendall’s tau: τ = 1 − 1 /α . W e examine four correlation levels representing h yp othesized v arying degrees of shared risk factors and pathophysiology: • α = 1 . 0 ( τ = 0): Independence • α = 1 . 2 ( τ = 0 . 167): W eak p ositive correlation • α = 1 . 5 ( τ = 0 . 333): Moderate p ositive correlation • α = 2 . 0 ( τ = 0 . 500): Strong p ositive correlation 3. T ransform to even t times: Con vert correlated uniform v ariables to even t times based on in v erse of the cumulativ e distribution function: T 1 i = − log( U 1 i ) / ( λ 1 · θ Z i 1 ) T 2 i = − log( U 2 i ) / ( λ 2 · θ Z i 2 ) 4. Administrativ e censoring: Generate C i ∼ Uniform(3 , 5) years to mimic staggered uniform enrollmen t of 2 years and maximum follow-up of 5 years. 5. Determine observ ed outcomes: • If T 1 i < min( T 2 i , C i ): Observe primary CV even t at time T 1 i • Else if T 2 i < C i : Observe comp eting non-CV death at time T 2 i • Else: Righ t-censored at time C i 5 F or eac h simulated trial, w e randomize 500 patients 1:1 to treatment or con trol, generate correlated ev en t times from the copula with λ 1 = 0 . 035 p er patient-y ear and θ 1 = 0 . 80 (representing 3.5% annual MA CE-3 rate with 20% hazard reduction), apply administrative censoring uniformly distributed ov er 3 to 5 y ears, and replicate each scenario 2,000 times. W e selected a sample size of 500 patients to main tain computational efficiency . Preliminary simulations with larger sample sizes ( n = 10 , 000, reflecting typical large CVOTs) yielded v ery similar patterns of metho d concordance and bias, but with substantially increased computational burden. W e systematically v ary three parameters across scenarios. The copula dep endence parameter α tak es v alues of 1.0, 1.2, 1.5, and 2.0, corres ponding to Kendall’s τ of 0 (indep endence), 0.167 (weak correlation), 0.333 (mo derate correlation), and 0.500 (strong correlation), represen ting v arying degrees of shared risk factors b etw een CV and non-CV even ts. The comp eting ev en t rate λ 2 ranges from 0.005 to 0.05 p er patient-y ear (0.5% to 5% annually), spanning from very low to mo derately high comp eting risk, with historical CVOTs suggesting typical rates of approximately 1% ann ually for non-CV death ( Lincoff et al. , 2023 ; McGuire et al. , 2025 ). The treatment effect on comp eting even ts θ 2 ranges from 0.5 to 1.5, representing three clinically relev ant scenarios: • θ 2 < 1: T reatment reduces comp eting ev en ts (directionally consistent b enefits) • θ 2 = 1: T reatmen t has no effect on comp eting even ts (neutral scenario) • θ 2 > 1: T reatment increases comp eting ev en ts (directionally discordant effects) 2.2 Statistical Analyses F or each simulated dataset, we fit tw o mo dels: Co x prop ortional hazards mo del treating comp eting even ts as censored. The Cox model estimates the hazard ratio for the primary CV ev ent, treating non-CV deaths as censored observ ations. The mo del for the hazard function is: h ( t | Z ) = h 0 ( t ) · exp( β Cox Z ) (2) where h 0 ( t ) is the baseline hazard for the primary even t and the treatment effect is quantified by d HR Cox = exp( β Cox ). This hazard ratio represents the treatment effect on the instantaneous rate of primary CV even ts among patients who remain even t-free, conditional on not yet ha ving exp erienced either the primary or comp eting ev en t. This estimand addresses: “Among patien ts who remain even t- free, how do es treatment affect the rate of primary CV even ts?” The Cox mo del is implemented using the survival pack age in R ( ? ). Fine-Gra y subdistribution hazard model. The Fine-Gra y mo del estimates the subdistribution hazard ratio, whic h relates to cum ulative incidence. The model for the subdistribution hazard function is: h ∗ ( t | Z ) = h ∗ 0 ( t ) · exp( β FG Z ) (3) 6 where h ∗ 0 ( t ) is the baseline sub distribution hazard and the treatment effect is quantified by d sHR FG = exp( β FG ). The sub distribution hazard ratio quantifies treatmen t effects on the subdistribution haz- ard—the instantaneous rate of the primary even t o ccurrence in the sub distribution, which includes b oth patients who remain at risk and those who ha ve exp erienced comp eting ev en ts (with mo dified w eigh ts). While the s ubdistribution hazard itself is difficult to interpret clinically , it directly corre- sp onds to treatmen t effects on cum ulativ e incidence probabilities. The Fine-Gray model is implemented using the cmprsk pack age in R ( Gray , 2022 ). 3 Results Across all simulation scenarios including wide ranges of comp eting even t rates ( λ 2 from 0.5% to 5% ann ually), treatmen t effects on competing ev ents ( θ 2 from 0.5 to 1.5), and even t correlations (Kendall’s τ from 0 to 0.50), we find that Cox and Fine-Gra y metho ds generally produce concordan t results. In t ypical CVOT settings with non-CV death rates of approximately 1% annually—as observed in trials suc h as SELECT and SOUL—the tw o metho ds produce v ery similar estimates on av erage. This concordance holds across v arying degrees of correlation b etw een CV and non-CV even ts and across differen t treatmen t effect profiles on comp eting ev en ts, provided the comp eting even t rate remains lo w. The div ergence b etw een Cox and Fine-Gray estimates is primarily driven by three factors: the comp eting even t rate, the treatment effect on comp eting even ts, and the correlation b etw een primary and comp eting even ts. W e examine the impact of each factor while holding the others constant to understand their individual contributions to metho d divergence. 3.1 Comparison Bet w een Cox and Fine-Gra y Mo dels When even ts are indep endent ( α = 1 . 0, τ = 0), Cox and Fine-Gra y mo dels yield nearly identical estimates. As ev ent correlation increases, Fine-Gray sub distribution hazard ratios tend to diverge from Cox estimates, but even at strong correlation ( α = 2 . 0, τ = 0 . 50), the mean absolute difference remains mo dest. Figures 1 – 4 illustrate the concordance betw een Cox (red solid lines) and Fine-Gray (blue dashed lines) estimates across the four correlation lev els. A t low comp eting even t rates (upp er panels showing λ 2 = 0 . 005 , 0 . 008 , 0 . 01), the t wo metho ds track closely together across all v alues of θ 2 , with minimal div ergence. As comp eting rates increase (lo w er panels showing λ 2 = 0 . 02 , 0 . 03 , 0 . 05), the methods b egin to diverge, particularly when treatmen t effects on competing even ts differ substantially from effects on primary ev en ts ( θ 2 far from 0.80). How ever, even at the highest comp eting rate examined (5% annually), the divergence b etw een Cox and Fine-Gray remains mo dest when treatment effects are directionally consistent ( θ 2 b et w een 0.7 and 1.0). When comp eting even t rates remain at or b elow 2% annually—the range typical of contempo- rary CVOTs—the absolute difference b etw een Co x and Fine-Gra y estimates remains small (typically less than 0.02 on the hazard ratio scale) regardless of treatment effect direction or even t correlation, pro vided treatment effects are not extremely discordan t. As comp eting rates increase to 5% ann u- ally , differences b etw een metho ds become more apparen t but remain mo dest when θ 2 is close to θ 1 . Substan tial divergence emerges only when comp eting rates exceed 5% annually combined with highly 7 discordan t treatment effects ( θ 2 < 0 . 7 or θ 2 > 1 . 0). This pattern holds consistently across all levels of ev en t correlation examined. 3.2 Comparison with T rue Marginal Hazard Ratio Bey ond comparing Cox and Fine-Gray metho ds with each other, w e examine how well e ac h method reco v ers the true marginal hazard ratio. An imp ortant finding is that neither the Cox mo del nor the Fine-Gra y mo del consisten tly recov ers the true marginal hazard ratio ( θ 1 = 0 . 80) under most scenarios with non-negligible comp eting risks. Figure 5 – 6 presents the Co x HR and Fine-Gray sHR bias (deviation from true HR = 0.80) across all four correlation levels, demonstrating a critical pattern: bias is minimal when the treatment effect on comp eting even ts ( θ 2 ) is similar to the treatment effect on primary even ts ( θ 1 = 0 . 80 ), regardless of comp eting even t rate or correlation structure. The shaded region ( θ 2 = 0.7-0.9) highligh ts this zone of minimal bias, where all curves conv erge near zero regardless of the comp eting ev en t rate ( λ 2 ) or correlation level ( α ). This demonstrates that directional consistency of treatment effects is more important than the absolute magnitude of comp eting risk rates in determining estimator accuracy . Both estimators can provide v alues close to the true marginal hazard ratio under specific conditions. When primary and comp eting ev en ts are indep endent ( α = 1 . 0), b oth metho ds closely approximate 0.80 regardless of comp eting ev en t rate or treatment effect on competing even ts, as evidenced by estimates clustering near the reference line in Figure 1 . Similarly , when treatment effects are identical across b oth even t t yp es ( θ 2 = θ 1 = 0 . 80), b oth methods yield estimates near 0.80 regardless of correlation or comp eting even t rate. How ever, outside these sp ecial conditions, b oth estimators show substan tial deviation from the true marginal HR of 0.80, particularly at comp eting rates exceeding 5% ann ually combined with directionally discordant treatment effects. When treatment reduces comp eting even ts more strongly than primary even ts ( θ 2 < 0 . 7), b oth Co x and Fine-Gray sho w mo dest p ositive bias that increases with comp eting even t rates. Conv ersely , when treatment has neutral or harmful effects on comp eting ev ents ( θ 2 > 0 . 9), negative bias emerges for b oth methods, particularly at higher comp eting rates. Ho wev er, across the parameter range typical of CVOTs (comp eting rate ≤ 2%, θ 2 b et w een 0.7 and 1.0), bias remains minimal for b oth metho ds regardless of correlation level. Correlation b etw een CV and non-CV even ts mo dulates the magnitude of bias but do es not funda- men tally alter the patterns. As correlation increases from indep endence ( α = 1 . 0) through mo derate ( α = 1 . 5) to strong ( α = 2 . 0) levels, the range of bias expands sligh tly , but the pattern of minimal bias when θ 2 ≈ 0 . 80 p ersists across all correlation levels. 4 Discussion This simulation study pro vides systematic evidence comparing Cox prop ortional hazards mo dels and Fine-Gra y sub distribution hazard mo dels across parameter ranges relev ant to CV outcome trials. Our findings demonstrate that in typical CVOT settings c haracterized b y low comp eting ev en t rates of appro ximately 1% ann ually , the t w o metho ds pro duce concordant results. The k ey determinants of 8 Figure 1: Estimated (sub distribution) hazard ratio by θ 2 ( α = 1 . 0). T rue HR = 0.80 (horizontal dashed line) metho d divergence are the comp eting even t rate and treatment effect direction on comp eting even ts, rather than even t correlation alone. When treatmen t demonstrates consistent b enefits across primary and comp eting even ts—an increasingly common pattern for mo dern therapies with pleiotropic mech- anisms suc h as GLP-1 receptor agonists—metho ds remain concordant even at mo derately elev ated comp eting rates. Substantial metho d divergence emerges primarily when comp eting rates exceed 2% ann ually com bined with directionally discordant treatment effects, a scenario outside typical con tem- p orary CVOT parameters. An imp ortant finding is that neither the Cox mo del nor the Fine-Gray mo del consistently recov ers the true marginal hazard ratio under most scenarios with non-negligible comp eting risks. This incon- sistency refers to the deviation of b oth estimators from the underlying true marginal hazard ratio when comp eting risks are present and treatment affects b oth even t types. While b oth metho ds can achiev e close approximation to the true marginal effect under sp ecial conditions—sp ecifically when even ts are indep enden t or when treatment effects are identical across even t types—they generally fail to recov er the marginal causal treatment effect in realistic comp eting risk scenarios. Additionally , the Fine-Gray mo del presents substantial interpretational challenges. W e wan t to highligh t a few imp ortan t p oints 9 Figure 2: Estimated (sub distribution) hazard ratio by θ 2 ( α = 1 . 2). T rue HR = 0.80 (horizontal dashed line) regarding comp eting risk analysis. 4.1 Dep enden t vs. Indep enden t Comp eting Risks Not all comp eting risks w arran t special analytical consideration. NEJM statistical guidance distin- guishes b etw een dep endent and indep endent comp eting risks ( New England Journal of Medicine , 2022 ). A comp eting risk is considered dep endent when it is correlated with the even t of interest, such that patien ts exp eriencing the comp eting even t would hav e had different risk of the primary outcome com- pared to those who remain ev en t-free. Our sim ulation study considers b oth dep endent and indep endent comp eting risks by v arying the strength of correlation and different treatment effects. The practical implication is that in vestigators should consider the lik ely degree of dependence b et w een comp eting even ts and primary even ts when deciding whether comp eting risk metho ds add v alue. When comp eting even ts are truly indep endent, standard Cox mo dels are appropriate regardless of comp eting even t rates. When comp eting even ts are dep endent (typical in CVOTs with non-CV death), our sim ulations show that Fine-Gray mo dels add minimal v alue as long as comp eting rates remain low (approximately 1%) and treatment effects are directionally consistent—the scenario. 10 Figure 3: Estimated (sub distribution) hazard ratio by θ 2 ( α = 1 . 5). T rue HR = 0.80 (horizontal dashed line) 4.2 Co x Mo del Remains V alid in T ypical CV OT Settings F or the ma jority of CV outcome trials, our findings supp ort several practical recommendations. When comp eting even t rates are exp ected to remain rare compared to the primary endp oint—simple Cox prop ortional hazards mo dels treating comp eting even ts as censored provide v alid primary analyses with clear in terpretability . Ev en without formal comp eting risk mo deling, transparently rep orting presp ecify descriptive summaries of comp eting even t by treatmen t group provides v aluable context. In t ypical CVOT settings where comp eting even t rates remain at approximately 1%, we do not exp ect to see substan tial differences b etw een Co x and Fine-Gray metho ds, and due to in terpretational challenges asso ciated with sub distribution hazards in the Fine-Gra y mo del, the simple Cox mo del remains the preferred approach for primary analysis. As a supplemen tary descriptiv e analysis, cumulativ e incidence at pre-sp ecified time p oints can b e rep orted for the primary outcome with non-CV death mo deled as a comp eting risk using the Aalen-Johansen estimator. 11 Figure 4: Estimated (sub distribution) hazard ratio by θ 2 ( α = 2 . 0). T rue HR = 0.80 (horizontal dashed line) 4.3 Imp ortance of Pre-Sp ecified Analysis Pre-sp ecified analytical approaches should take priorit y , and pre-sp ecified Cox mo dels should not be abandoned p ost-ho c simply because comp eting risks app ear relev ant after unblinding data. This principle is fundamental to maintaining trial in tegrity and is emphasized across multiple regulatory guidelines. 4.4 Fine-Gra y Mo del is Not a Sensitivit y Analysis to Cox Mo del A key principle highlighted in the ICH E9(R1) Addendum on Estimands and Sensitivity Analysis is that ”sensitivit y analyses should in vestigate the robustness of the o verall conclusions to deviations from assumptions made in the primary analysis,” and should target the same estimand as the primary analysis except for the assumption under ev aluation. In many CV outcome trials, how ev er, it has b ecome common practice to conduct Fine-Gray comp eting risk analyses as ”sensitivit y analyses” to the Cox prop ortional hazards mo del. Conceptually , this practice is misaligned with the purp ose of sensitivit y analyses. 12 The Cox mo del estimates a cause-specific hazard ratio under the assumption of indep endent cen- soring by comp eting even ts, whereas the Fine-Gray mo del targets an entirely different estimand—the sub distribution hazard—whose interpretation reflects a blend of direct and indirect pathw ays through b oth primary and comp eting ev en ts. Imp ortantly , the Fine-Gray mo del do es not relax or test the indep enden t censoring assumption underpinning the Co x mo del; instead, it answers a fundamentally differen t scien tific question. As a result, comparing Cox and Fine-Gra y estimates do es not constitute a sensitivity analysis in the sense defined b y ICH E9(R1), b ecause differences b etw een the t w o do not indicate lack of robustness of the primary estimand, but reflect that the mo dels target different esti- mands altogether. Prop er sensitivity analyses should instead m odify assumptions relev ant to the same estimand (e.g., through inv erse probabilit y w eighting to assess departures from independent censoring), rather than substituting a differen t estimand-based metho d. 4.5 Include All-Cause Mortality in Comp osite Endp oin t An imp ortant alternativ e that sidesteps comp eting risk complications entirely is including all-cause mortalit y in the comp osite endp oint, particularly when treatment demonstrates b enefits for b oth CV and non-CV death. Clinical trials of incretin-based therapies such as SELECT, SOUL, and REWIND, along with meta-analyses, demonstrate that GLP-1 receptor agonists b enefit multiple metabolic risk factors and reduce all-cause death risk ( Lincoff et al. , 2023 ; McGuire et al. , 2025 ; Gerstein et al. , 2019 ; Lee et al. , 2025 ). This approach offers several adv antages: it captures the full mortality b enefit of the in terv ention without artificial partitioning into comp eting comp onents, it av oids the complexities and in terpretational c hallenges of comp eting risk mo deling, it eliminates concerns ab out cause-of-death misclassification, and it aligns with patient-cen tered outcomes where total mortality risk matters more than its categorization. How ever, including all-cause death in the comp osite endp oint changes the clinical question of interest and may dilute the treatment effect if non-CV death is not exp ected to b enefit from treatment. 4.6 Alternativ e Metho ds to Handle Comp eting Risk The inconsistency of b oth standard metho ds relative to the true marginal hazard ratio motiv ates consideration of alternative approaches when marginal causal effects are the target of inference. In- v erse probability of censoring weigh ting (IPCW) metho ds mo del the probability that patients remain uncensored and w eigh t observ ations b y inv erse probabilities ( Austin and Fine , 2025 ). How ever, in CV OTs with MACE-3 as the primary endp oint, mo deling the probability of non-CV death also suffers from comp eting risk from CV death, creating a circular dep endency . Multiple imputation approaches accoun t for the fact that patients who die tend to b e at higher risk for the unobserved outcome ( Greg- son et al. , 2024 ; W ang et al. , 2023 ). Multistate mo dels explicitly model transitions b et ween health states ( Co ok and Lawless , 2018 ), providing rich information ab out disease progression but increasing analytical complexity . 13 4.7 Study Limitations Our simulation study has sev eral limitations. W e use the Gum b el-Hougaard copula, which restricts atten tion to p ositive asso ciations b etw een even ts. While p ositive correlation is most clinically relev ant for CV OTs, other dep endence structures could yield different results. Our data generation assumes prop ortional hazards for b oth even t types throughout follow-up, whereas real trials ma y exhibit non- prop ortionalit y due to treatment lag effects or w aning effects o ver time. Our simulation focuses on the t ypical CVOT setting where comp eting ev en t rates are relatively low. F or clinical trials in other therap eutic areas such as oncology , where comp eting ev ent rates can b e substantially higher, the conclusions in this pap er ma y not apply . 5 Conclusion The concordance of Co x and Fine-Gray metho ds in t ypical CV OT settings—where comp eting even t rates remain at approximately 1%—provides reassurance that analytical approach selection, while imp ortan t to pre-specify , has limited impact on trial conclusions under these conditions. Our simulation results demonstrate that the c hoice b etw een metho ds matters primarily when comp eting ev ent rates are high and treatment effects are directionally discordant, scenarios uncommon in typical CV outcome trials. These evidence-based findings should inform trial design, proto col dev elopment, statistical analysis planning, and regulatory discussions around competing risk metho dology , supp orting the con tin ued use of in terpretable Cox prop ortional hazards mo dels as the primary analytical approach for most CV outcome trials. Conflicts of In terest All authors are employ ees and minor shareholders of Eli Lilly and Company . Data Av ailabilit y Statemen t Data sharing is not applicable to this article as no new data were created or analyzed in this study . Ethics Statemen t This research is a simulation study that do es not inv olve human participants, animal sub jects, or the collection of individual patien t data. All analyses are based on simulated data generated through Mon te Carlo metho ds using publicly av ailable statistical softw are. No ethics approv al was required for this metho dological research. 14 Figure 5: Cox HR Bias b y θ 2 across correlation lev els. The figure sho ws bias in Cox HR estimates (devi- ation from true HR = 0.80) across differen t treatmen t effects on competing risk ( θ 2 , x-axis) for differen t comp eting ev ent rates. F our panels represen t differen t correlation strengths ( α = 1 . 0 , 1 . 2 , 1 . 5 , 2 . 0). The shaded region ( θ 2 = 0 . 7 − 0 . 9) demonstrates minimal bias when treatment effects are directionally con- sisten t across primary and comp eting even ts. When θ 2 ≈ θ 1 = 0 . 80, all curves conv erge near zero bias regardless of comp eting even t rate or correlation level. 15 Figure 6: Fine-Gray sHR Gap by θ 2 across correlation levels. The figure shows bias in Fine-Gra y sHR estimates (deviation from true HR = 0.80) across different treatment effects on comp eting risk ( θ 2 , x-axis) for different comp eting ev ent rates. F our panels represen t differen t correlation strengths ( α = 1 . 0 , 1 . 2 , 1 . 5 , 2 . 0). The shaded region ( θ 2 = 0 . 7 − 0 . 9) demonstrates minimal gap when treatment effects are directionally consisten t across primary and comp eting ev en ts. When θ 2 ≈ θ 1 = 0 . 80, all curv es conv erge near zero bias regardless of comp eting ev en t rate or correlation lev el. 16 References Arm bruster, S., Sk ali, H., and W ei, L.-J. (2024). Pitfalls of choosing a study end p oint including cardio v ascular death in comparative clinical trials. Cir culation , 150(23):1823–1825. Austin, P . C. and Fine, J. P . (2017). Practical recommendations for reporting Fine-Gray mo del analyses for comp eting risk data. Statistics in Me dicine , 36(27):4391–4400. Austin, P . C. and Fine, J. P . (2025). Inv erse probability of treatmen t weigh ting using the prop ensit y score with comp eting risks in surviv al analysis. Statistics in Me dicine , 44(5):e70009. Austin, P . C., Steyerberg, E. W., and Putter, H. (2021). Fine-gra y sub distribution hazard mo dels to sim ultaneously estimate the absolute risk of different ev ent t yp es: cumulativ e total failure probabilit y ma y exceed 1. Statistics in Me dicine , 40(19):4200–4212. Co ok, R. J. and Lawless, J. F. (2018). Multistate mo dels for the analysis of life history data . Chapman and Hall/CRC. Co x, D. R. (1972). Regression models and life-tables. Journal of the R oyal Statistic al So ciety: Series B (Metho dolo gic al) , 34(2):187–220. Dutang, C. (2024). gumb el: p ackage for Gumb el c opula . R pack age version 1.10-3. Fine, J. P . and Gray , R. J. (1999). A proportional hazards mo del for the subdistribution of a competing risk. Journal of the A meric an Statistic al Asso ciation , 94(446):496–509. Gerstein, H. C., Colhoun, H. M., Dagenais, G. R., Diaz, R., Lakshmanan, M., Pais, P ., Probstfield, J., Riesmey er, J. S., Riddle, M. C., Ryd´ en, L., et al. (2019). Dulaglutide and cardiov ascular out- comes in t ype 2 diab etes (rewind): a double-blind, randomised placeb o-controlled trial. The L anc et , 394(10193):121–130. Gra y , B. (2022). cmprsk: Sub distribution Analysis of Comp eting R isks . R pack age version 2.2-11. Gregson, J., Poco ck, S. J., Anker, S. D., Bhatt, D. L., Pac ker, M., Stone, G. W., and Zeller, C. (2024). Comp eting risks in clinical trials: Do they matter and how should w e account for them? Journal of the Americ an Col le ge of Car diolo gy , 84(11):1025–1037. Lee, M. M., Sattar, N., Pop-Busui, R., Deanfield, J., Emerson, S. S., Inzucchi, S. E., Mann, J. F., Marx, N., Mulv agh, S. L., P oulter, N. R., et al. (2025). Cardio v ascular and kidney outcomes and mortalit y with long-acting injectable and oral glucagon-like p eptide 1 receptor agonists in individuals with t yp e 2 diab etes: a systematic review and meta-analysis of randomized trials. Diab etes c ar e , 48(5):846–859. Lincoff, A. M., Brown-F randsen, K., Colhoun, H. M., Deanfield, J., Emerson, S. S., Esb jerg, S., Hardt- Lindb erg, S., Hovingh, G. K., Kahn, S. E., Kushner, R. F., et al. (2023). Semaglutide and cardiov as- cular outcomes in ob esity without diab etes. New England Journal of Me dicine , 389(24):2221–2232. 17 McGuire, D. K., Marx, N., Mulv agh, S. L., Deanfield, J. E., Inzucchi, S. E., Pop-Busui, R., Mann, J. F., Emerson, S. S., Poulter, N. R., Engelmann, M. D., et al. (2025). Oral semaglutide and cardio v ascular outcomes in high-risk type 2 diab etes. New England Journal of Me dicine , 392(20):2001–2012. New England Journal of Medicine (2022). Statistical rep orting guidelines: Considera- tions in time-to-even t analyses. Av ailable at: https://www.nejm.org/author- center/ statistical- reporting- guidelines . Accessed Nov ember 2024. Oak es, D. (1989). Biv ariate surviv al models induced b y frailties. Journal of the A meric an Statistic al Asso ciation , 84(406):487–493. P erk ovic, V., T uttle, K. R., Rossing, P ., Mahaffey , K. W., Mann, J. F., Bakris, G., Baeres, F. M., Idorn, T., Bosch-T rab erg, H., Lausvig, N. L., et al. (2024). Effects of semaglutide on chronic kidney disease in patients with t yp e 2 diab etes. New England Journal of Me dicine , 391(2):109–121. Pitt, B., Filippatos, G., Agarwal, R., Anker, S. D., Bakris, G. L., Rossing, P ., Joseph, A., Kolkhof, P ., No w ack, C., Sc hlo emer, P ., et al. (2021). Cardio v ascular even ts with finerenone in kidney disease and type 2 diab etes. New England Journal of Me dicine , 385(24):2252–2263. W ang, T., Zilinsk as, R., Li, Y., and Qu, Y. (2023). Missing data imputation for a multiv ariate outcome of mixed v ariable types. Statistics in Biopharmac eutic al R ese ar ch , 15(4):826–837. 18
Original Paper
Loading high-quality paper...
Comments & Academic Discussion
Loading comments...
Leave a Comment