Decision Quality Evaluation Framework at Pinterest
Online platforms require robust systems to enforce content safety policies at scale. A critical component of these systems is the ability to evaluate the quality of moderation decisions made by both human agents and Large Language Models (LLMs). Howe…
Authors: 정보가 제공되지 않음 (논문에 저자 명시 없음)
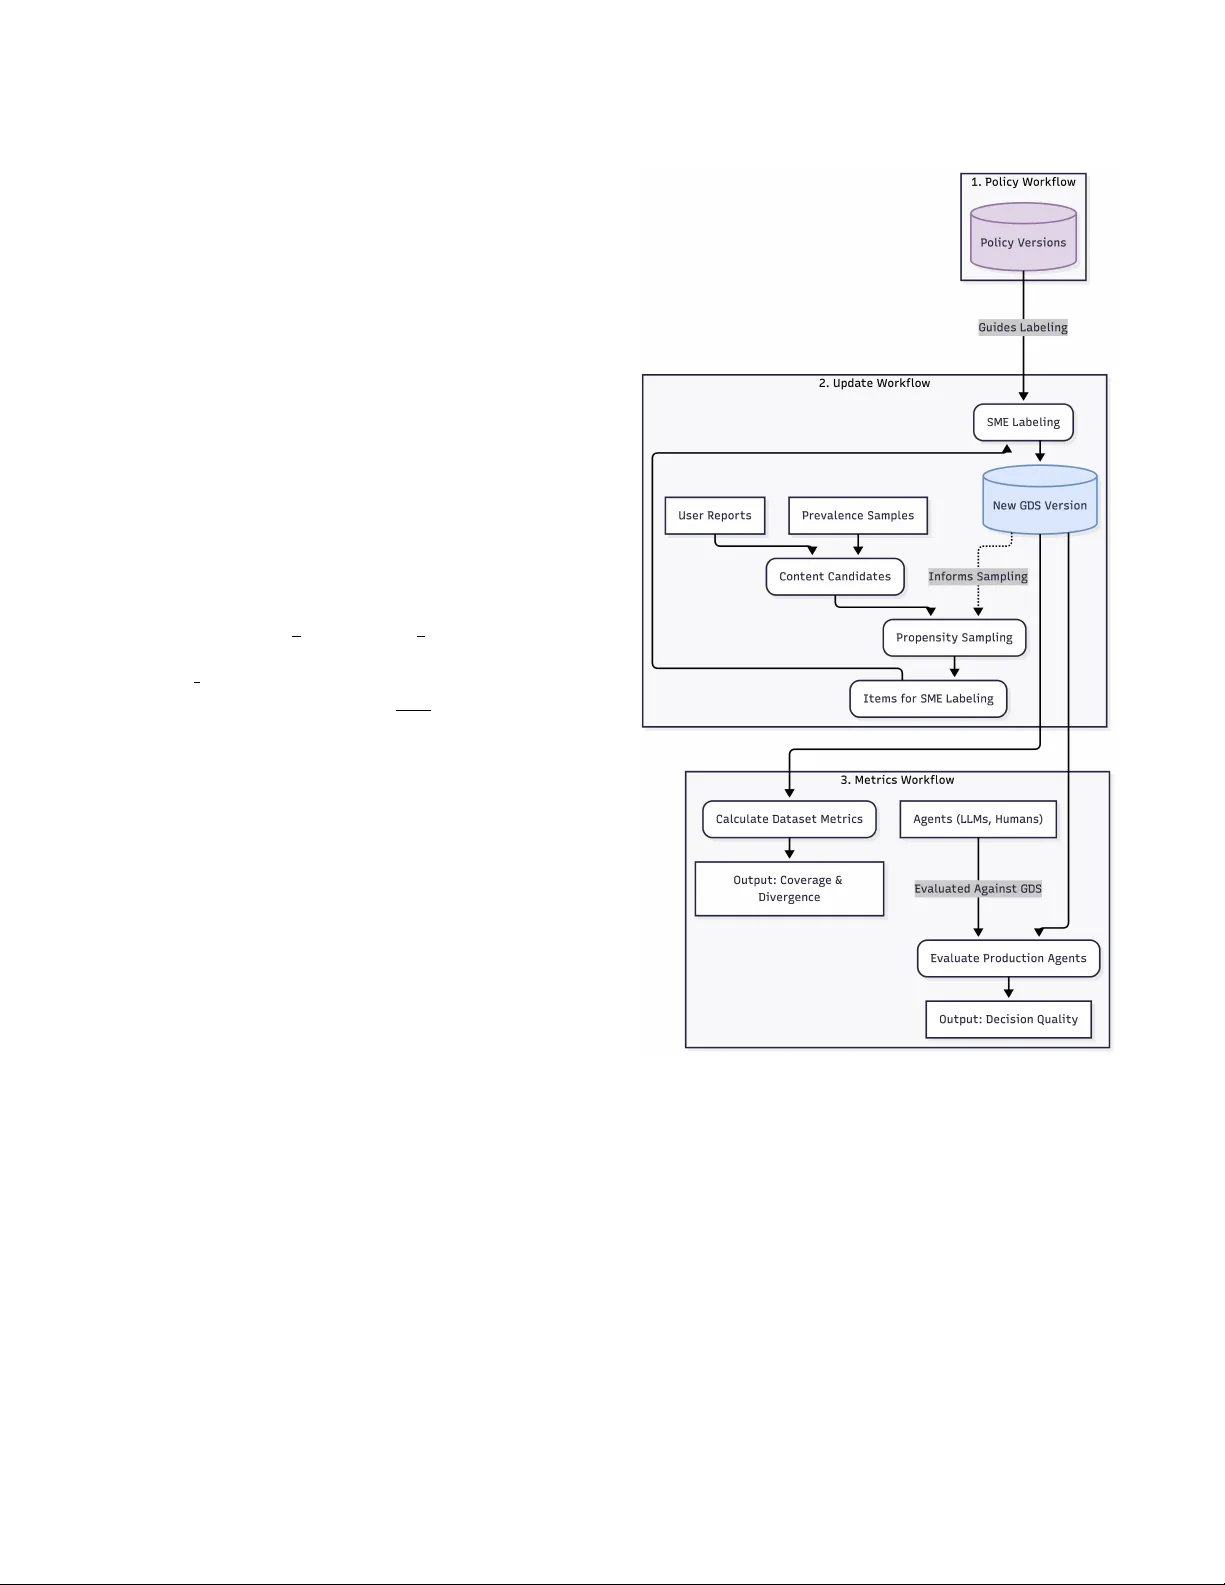
Decision ality Evaluation Framework at Pinter est Y uqi Tian Pinterest San Francisco, CA, USA yuqitian@pinterest.com Robert Paine ∗ Pinterest San Francisco, CA, USA rpaine@pinterest.com Attila Dobi Pinterest San Francisco, CA, USA adobi@pinterest.com Ke vin O’Sullivan Pinterest New Y ork, NY, USA kosullivan@pinterest.com Aravindh Manickavasagam Pinterest Richmond, V A, USA amanickavasagam@pinterest.com Faisal Farooq Pinterest Murphy , TX, USA arooq@pinterest.com Abstract Online platforms require robust systems to enfor ce content safety policies at scale. A critical component of these systems is the abil- ity to evaluate the quality of moderation decisions made by both human agents and Large Language Models (LLMs). Howe ver , this evaluation is challenging due to the inherent trade-os between cost, scale, and trustworthiness, along with the complexity of ev olv- ing policies. T o address this, we pr esent a comprehensive Decision Quality Evaluation Framework dev eloped and deployed at Pinter- est. The framework is centered on a high-trust Golden Set (GDS) curated by subject matter experts (SMEs), which serves as a ground truth benchmark. W e introduce an automate d intelligent sampling pipeline that uses propensity scores to eciently expand dataset coverage. W e demonstrate the framework’s practical application in several key areas: benchmarking the cost-performance trade-os of various LLM agents, establishing a rigorous methodology for data- driven prompt optimization, managing comple x policy evolution, and ensuring the integrity of policy content prevalence metrics via continuous validation. The framework enables a shift from sub- jective assessments to a data-driven and quantitative practice for managing content safety systems. CCS Concepts • Applied computing → Document management and text pro- cessing ; • Information systems → Data management systems ; • Mathematics of computing → Probability and statistics . Ke ywords Decision quality , Consensus, LLM A CM Reference Format: Y uqi Tian, Robert Paine, Attila Dobi, Ke vin O’Sullivan, Aravindh Manick- avasagam, and Faisal Far ooq. 2026. Decision Quality Evaluation Framework ∗ W ork done at Pinterest. Permission to make digital or hard copies of all or part of this work for personal or classroom use is granted without fee provided that copies are not made or distributed for prot or commercial advantage and that copies bear this notice and the full citation on the rst page. Copyrights for components of this work owned by others than the author(s) must be honor ed. Abstracting with credit is permitted. T o copy other wise, or republish, to post on servers or to redistribute to lists, r equires prior specic permission and /or a fe e. Request permissions from permissions@acm.org. KDD ’26, Jeju, Korea © 2026 Copyright held by the owner/author(s). Publication rights licensed to A CM. ACM ISBN 978-x-xxxx-xxxx-x/Y Y YY/MM https://doi.org/XXXXXXX.XXXXXXX at Pinterest. In Proceedings of The 32nd ACM SIGKDD Conference on Knowl- edge Discov ery and Data Mining (KDD ’26). A CM, New Y ork, NY, USA, 7 pages. https://doi.org/XXXXXXX.XXXXXXX 1 Introduction User trust is paramount to the success of online platforms. At Pinter- est, our goal is to cultivate a safe and inspiring environment for our users. T o achieve this, we establish comprehensiv e content safety policies and community guidelines across various policy areas [ 10 ]. These broad principles ar e then translated into detailed internal en- forcement policies for our operational teams. This complex policy landscape requires scalable enforcement through a combination of machine learning models, human agent lab eling, and, increasingly , Large Language Models (LLMs). The integrity of decisions guided by these internal policies directly impacts user safety and trust. The broader challenge of platform go vernance at scale is a sig- nicant area of research, encompassing the technical and political complexities of algorithmic content moderation [ 4 ]. Studies have explored the critical dynamics of human-machine collaboration in these moderation systems [ 5 ] and conducted large-scale empirical investigations into how community norms ar e enforced on major platforms [ 2 ]. While this prior work establishes the operational and social challenges of mo deration, our paper addresses a comple- mentary and foundational need: the development of a rigor ous and scalable evaluation framew ork to measure and ensure the quality and consistency of those moderation decisions. The use of Generative AI has become critical in our content safety operations, from prevalence measurement [ 3 ] to complex policy interpretation. These powerful systems, ho wever , must op- erate within a landscape dened by several r elated challenges. A signicant challenge in the Content-Safety domain is the inher- ent ambiguity and comple xity of policies, which leads to incon- sistent application by both human and automated agents. This is compounded by the extreme rarity of content and the high cost associated with obtaining high-quality labels from subject matter experts (SMEs). These pressures giv e rise to a fundamental trade- o between trustworthiness, scale , and cost, a concept w e term the “Pyramid of T ruth” shown in Figur e1. At the apex ar e the ex- pensive but essential SMEs, while the base consists of scalable but less reliable agents, creating a persistent b ottleneck for creating high-quality evaluation data. Without a systematic way to manage this trade-o, several critical problems emerge: KDD ’26, August 9–13, 2026, Jeju, K orea Tian et al. Figure 1: The Hierar chy of Trustworthiness for Labeling Sources, illustrating the trade-o b etween label quality and scalability . Policy Experts are the authors and ultimate in- terpreters of the written policy . SMEs are highly-trained sp e- cialists who produce the highest-quality labels for creating ground truth datasets like the GDS. Leads are experienced review ers who oversee the quality of the scalable agent work- force at the base. • Silent quality regr essions: Without a trustworthy evaluation standard, the decision quality can silently degrade ov er time if not monitored. • Comparison across labeling methods: W e lack an objective method to compare the decision quality of dierent labeling vendors or to evaluate the eectiveness of dierent prompts for LLMs on an “apples-to-apples” basis. • Shifting content distributions: Production content landscapes are dynamic. New threat vectors emerge regularly and model updates alter the distribution of content, complicating the measurement of model and agent performance over time. These challenges ar e central to the w ell-studied problem of learn- ing from noisy lab els, where statistical models infer a consensus ground truth by weighting each labeler’s reliability . Such models can eectively quantify cost-quality trade-os, for instance, by esti- mating how many non-expert votes are equivalent to a single expert judgment [ 13 ]. Howev er , our Decision Quality Evaluation Frame- work takes a complementar y and operational approach. Rather than treating ground truth as a statistical estimate, we use experts in the highly leveraged role of curating a stable , ground truth GDS. This GDS then serves as an explicit and reliable benchmark to measure the quality of all other agents, from scalable human teams to LLMs. This framework is especially critical for ee ctively managing LLMs. A key insight is that it is fundamentally easier to mov e the needle on LLM decision quality than on non-expert human quality . Unlike a global workforce of human agents, which is costly and slow to r etrain, an LLM’s decision-making pr ocess can b e altered in seconds via prompt engineering. However , harnessing this agility requires a rigorous and r eliable evaluation framework to measur e the impact of these changes. Without one, “pr ompt optimization” remains a subjective art rather than a data-driven science. This paper makes the following contributions: • W e introduce a comprehensive framework for decision qual- ity evaluation, featuring an automated intelligent sampling pipeline that uses propensity scores to eciently curate and expand dataset coverage . • W e dene the GDS, a no vel dataset construct that ser ves as a foundational benchmark for balancing the trade-os between trustworthiness, coverage, and cost. • W e present a set of metrics to evaluate both the quality of the datasets themselves ( semantic coverage and distributional divergence) and the quality of the de cisions made by various labeling agents. • W e demonstrate the practical application of this framework at Pinterest for use cases such as prompt optimization and prevalence validation. Through this framework, we can continuously validate the trust- worthiness of enforcement decisions, set explicit quality standards for dierent use cases, and ensur e the reproducible evaluation of all agents within our content safety ecosystem. The remainder of the pap er is structured as follows: Se ction 2 details our proposed frame work, including the core concepts of the GDS, the metrics used to evaluate decision and dataset quality , and the overall system design. Section 3 presents sev eral practical applications of the framework at Pinter est, demonstrating its utility in areas such as LLM prompt optimization and validating prevalence measurements. Finally , Se ction 4 oers concluding remarks and discusses the broader implications of our work. 2 Framework 2.1 Overview The proposed evaluation framework is built upon the foundational concepts of trustworthiness and repr esentativeness to enable reli- able oine evaluation of decision quality . Trustw orthiness ensures that each label within our e valuation datasets accurately reects the intent of the written p olicy . This eliminates ambiguity and provides a stable, ground truth reference for measuring correctness. Representativeness is composed of two key concepts: • Coverage : The dataset must encompass the full spectrum of content on the platform, including diverse examples of con- tent and critical edge cases. This ensures that performance is measured across all relevant scenarios. • Density : This measures how closely the dataset’s statisti- cal distribution of content types aligns with the production environment. These principles guide the practical design of our evaluation datasets, which are dened by a trade-o b etween four key dimen- sions: • Cost: The resources r equired to curate, label, and maintain the dataset. Decision ality Evaluation Framework at Pinterest KDD ’26, August 9–13, 2026, Jeju, K orea Figure 2: An illustration of design trade-os. The GDS ( left) is optimized for Trustw orthiness and Coverage . In contrast, typ- ical Scalable Datasets (right), such as those from production- scale agents, are optimized for Size and low Cost. This is a conceptual diagram as we have not actually quantied values and scales for Size, Cost, Trustworthiness and Representa- tiveness. • Size: The number of labeled examples in the dataset. • Trustw orthiness: The degree to which lab els reliably reect the written policy intent. • Coverage: The extent to which the dataset r epresents the diversity of policy content and platform scenarios. As illustrated in Figure 1, dierent labeling sources oer varying levels of trustw orthiness and scalability . SMEs produce the highest- quality lab els but are costly and limited in capacity . In contrast, agents like large-scale human teams, LLMs, and Machine Learning (ML) models oer scalability at a lower cost but with r educed trust- worthiness. T o navigate the trade-os dene d by this “Pyramid of Truth” shown in Figure 1, our framew ork’s strategy is to create and maintain a foundational and high-trust dataset, the GDS. The GDS consists of high-quality lab els created and adjudicated by SMEs. Its primary purp ose is to serve as the ground truth refer- ence for label correctness. This dataset is optimized for maximum trustworthiness and broad coverage. This focus on quality and comprehensive cov erage, howe ver , results in a high cost per label, which naturally limits its size. As Figure 2 illustrates, the design of the GDS r epresents an ex- plicit choice. It prioritizes maximum trustworthiness and br oad coverage ov er size and cost. This makes it an expensive but essen- tial asset for reliably evaluating agent p erformance on complex edge cases and ensuring our interpretation of policy is measured cor- rectly . This pap er focuses exclusively on the methods for creating, maintaining, and utilizing the GDS as the foundational benchmark for all decision quality evaluation. 2.2 Decision Quality Metrics T o evaluate the de cision quality of dierent lab elers, our framework breaks down the assessment into tw o components: reliability and correctness. Analyzing them together provides a powerful diagnos- tic for our policy feedback lo op. Reliability measures the consistency of judgments among dif- ferent labelers. W e use Cohen’s Kappa 𝜅 [ 9 ] to quantify inter-rater reliability . This metric corr ects for the probability that labelers may agree by chance and provides a standardized measure of agreement. A high Kappa score indicates that our labeling guidelines are being applied consistently . As such, reliability serves as a dir ect proxy for the eectiveness of our internal policy guidelines and training. A low Kappa score signals that the policy is ambiguous or training has been ineective, triggering a review . The formula for Cohen’s Kappa is 𝜅 = 𝑝 𝑜 − 𝑝 𝑒 1 − 𝑝 𝑒 , (1) where 𝑝 𝑜 is the relative observed agreement among labelers, and 𝑝 𝑒 is the hypothetical probability of chance agreement. Correctness is evaluated against the GDS as the ground truth. W e employ a comprehensive suite of metrics to provide a holistic view of performance, as dierent applications may prioritize dier- ent aspects of quality . These metrics include: accuracy , precision, recall, negative precision, negative recall, False Positive Rate (FPR), False Negative Rate (FNR), informedness, and markedness. By analyzing reliability and correctness together , we can diag- nose distinct failure mo des. High reliability paired with low cor- rectness indicates that lab elers are all making the same mistake consistently , which can be a systematic misunderstanding of the policy . This would require a dierent intervention (e .g., broad re- training on a specic subpolicy or concept) than low reliability . 2.3 Dataset Metrics T o ensure our GDS is a robust foundation for evaluation, we must also measure its intrinsic quality , specically its representativeness. The GDS must be compr ehensive enough to ensure that evaluations against it are meaningful. W e measure this through two key metrics: “semantic coverage ” and “ distributional divergence. ” Semantic Coverage is use d to measure the diversity of our dataset. W e dene this metric using semantic IDs generated from our internal PinCLIP image embe ddings [ 1 ], which build upon foun- dational work in multi-modal models, such as CLIP [ 11 ] and SigLIP [ 14 ]. These embeddings are quantized using a Residual-Quantized V ariational Autoencoder (RQ- V AE) [ 7 , 12 ], which produces a hier- archical sequence of discrete codes. The rst layer of this V AE has a codebook of 2 8 = 256 unique codes, each representing a high-level semantic cluster . Let the set of all 256 possible rst-layer codes be 𝐶 = { 𝑐 1 , 𝑐 2 , . . . , 𝑐 𝐾 } and 𝐾 = 256 , where each code 𝑐 𝑗 represents a high-lev el semantic cluster . Given a dataset 𝐷 and a function 𝑓 : 𝐷 → 𝐶 that maps each item in the dataset to its rst-layer code, we dene the set of ob- served codes as 𝐶 𝑜𝑏 𝑠 = { 𝑓 ( 𝑑 ) | 𝑑 ∈ 𝐷 } . The coverage of the dataset is then formally dene d as the p ercentage of these foundational semantic codes that are observed: Semantic Coverage = | 𝐶 𝑜𝑏 𝑠 | | 𝐶 | = | 𝐶 𝑜𝑏 𝑠 | 256 (2) A higher coverage value signies that the dataset encompasses a broader range of the visual concepts captured by the embedding space, which in turn guides our data augmentation strategy . Distributional Divergence quanties how the statistical pro- le of our dataset compares to the data distribution in our liv e production environment. While high coverage is a goal for the GDS, it is often intentionally not distributionally representative of KDD ’26, August 9–13, 2026, Jeju, K orea Tian et al. production, as we ov ersample for rare content and edge cases. This metric allows us to understand and quantify that dierence. W e dene two probability distributions over the 𝐾 = 256 rst- layer semantic clusters, 𝐶 = { 𝑐 1 , . . . , 𝑐 𝐾 } : • The Production Distribution ( 𝑃 𝑝𝑟 𝑜𝑑 ): This is the empirical probability distribution of semantic clusters calculated from a large representativ e sample of our live pr oduction trac. For each cluster 𝑐 𝑗 , its probability 𝑃 𝑝𝑟 𝑜𝑑 ( 𝑐 𝑗 ) is its relative frequency in the production environment. • The Dataset Distribution ( 𝑃 𝐷 ): This is the empirical pr oba- bility distribution of semantic clusters in our dataset 𝐷 . For each cluster 𝑐 𝑗 , its probability 𝑃 𝐷 ( 𝑐 𝑗 ) is its relative frequency in the dataset. W e quantify the divergence between our dataset distribution ( 𝑃 𝐷 ) and the production distribution ( 𝑃 𝑝𝑟 𝑜𝑑 ) using the Jensen-Shannon Divergence ( JSD) [ 8 ]. JSD is a symmetric and bounde d metric that measures the statistical distance between probability distributions. It is dened as follows: 𝐽 𝑆 𝐷 ( 𝑃 𝐷 | | 𝑃 𝑝𝑟 𝑜𝑑 ) = 1 2 𝐷 𝐾 𝐿 ( 𝑃 𝐷 | | 𝑀 ) + 1 2 𝐷 𝐾 𝐿 ( 𝑃 𝑝𝑟 𝑜𝑑 | | 𝑀 ) , (3) where 𝑀 = 1 2 ( 𝑃 𝐷 + 𝑃 𝑝𝑟 𝑜𝑑 ) is the p ointwise mean of the two distribu- tions, and 𝐷 𝐾 𝐿 ( 𝑃 | | 𝑄 ) = Í 𝐾 𝑗 = 1 𝑃 ( 𝑐 𝑗 ) log 2 𝑃 ( 𝑐 𝑗 ) 𝑄 ( 𝑐 𝑗 ) denotes the Kullback- Leibler divergence. The JSD score, calculated with a base-2 logarithm, is b ounded between 0 (for identical distributions) and 1 (for maximally dierent distributions). T ogether , coverage and distributional similarity pr ovide a com- prehensive prole of our dataset’s content, quantifying b oth its conceptual breadth and its statistical r elationship to the pr oduction environment. 2.4 Design The framework is op erationalized as an automate d system built around three modular and interconnected workows that run on a regular cadence shown in Figure 3. This cyclical process ensures our evaluation benchmarks and quality metrics remain current with the dynamic nature of our platform. • Policy workow : This workow captures the policy taxon- omy and its versions. It provides a canonical lookup for every policy , its associated labels and the entity type to which it applies. This ensures that all labels and decisions are tied to a specic, immutable version of the policy . A s the diagram shows, its output directly guides labeling to ensure that all decisions made are consistent with the current and correct policy interpretation. • Update workow : This workow is responsible for creating a New GDS V ersion. It ingests content candidates, intelli- gently selects a subset for labeling, and publishes the result as an immutable and versioned dataset. (1) Ingests Candidates: It sources content from various streams, such as User Reports and Prevalence Samples, to create a pool of Content Candidates for potential inclusion in the GDS. Figure 3: The automate d evaluation framework, showing the three core workows. The Update W orko w creates a new GDS version, which triggers the Metrics W orkow . The resulting coverage metric is fed back to inform future sam- pling, creating an intelligent lo op. (2) Selects for Labeling using Propensity Sampling: T o e- ciently increase the coverage of the GDS, w e employ a model-driven activ e sampling strategy . As the diagram illustrates, this Propensity Sampling step is guided by two inputs: the pool of Content Candidates and, the e xisting GDS V ersion, via the “Informs Sampling” feedback loop. Specically , an XGBoost mo del is trained to predict the propensity score 𝑝 ( item ∈ GDS | embedding ) based on an item’s PinCLIP embeddings. For the next labeling batch, Decision ality Evaluation Framework at Pinterest KDD ’26, August 9–13, 2026, Jeju, K orea we use inverse propensity sampling, prioritizing candi- dates with a low score . This actively seeks out novel and underrepresented items, ensuring our limite d SME La- beling budget is spent on content that most ee ctively expands the GDS’s coverage . (3) Publishes New Dataset V ersion: The selected Items for SME Labeling are sent to SMEs. Once their labels are col- lected, the items are integrated into the GDS to publish a New GDS V ersion. • Metrics workow : This automated worko w runs imme- diately after a New GDS V ersion is published, closing the evaluation loop. It takes the new GDS as input and computes two categories of metrics in parallel: (1) Dataset Metrics: The workow rst performs the Calculate Dataset Metrics step. This measur es the intrinsic quality of the New GDS V ersion, producing the nal Output: Co v- erage & Divergence (as described in Section 2.3). (2) Decision Quality Metrics: Simultaneously , production Agents (LLMs, Humans) are evaluated. As the diagram shows, they are Evaluate d A gainst GDS in the Evaluate Production Agents step. This pr ocess generates the nal Output: De- cision Quality metrics (e.g., accuracy , recall, as described in Section 2.2). This versioned and modular design ensures that our evaluations are reproducible and can adapt to the evolving landscape of content safety policies and enforcement mechanisms. 3 Applications The principles of the proposed framew ork have been applied at Pinterest to measure decision quality in key content safety areas, enabling a data-driven approach to policy enforcement. This section details three key applications within adult dontent as an example . T o evaluate our labelers, we curate d an adult content GDS. The GDS is well-balanced between positive and negative examples and has wide semantic coverage of the problem space, ensuring it provides a robust and comprehensive benchmark. 3.1 Benchmarking Agent Quality and Driving LLM Optimization A primary challenge in large-scale content moderation is the ob- jective comparison of diverse labeling agents. This process of em- pirically evaluating and comparing the p erformance of dierent human- AI teams is a cornerstone of the research eld dedicated to the science of human-AI decision making [ 6 ]. T o address this, we utilized the adult content GDS to establish the unied qual- ity benchmark across both human teams and LLM-based systems. This provides a quantitative basis for agent selection, p erformance tracking, and prompt engineering. The results of this analysis are presented in T able 1, with all numbers shown as percentage dier- ences relative to the 1x non-expert human performance baseline. Performance comparisons reect research benchmarks used for internal optimization and production systems employ ensemble approaches not r epresented by individual agent metrics. A key take- away from Table 1 is that the LLMs demonstrate quality on par with a single non-expert human, but a gap still remains to reach SME-level quality . Beyond static comparisons, a key application is using the frame- work to drive the optimization of LLM behavior through pr ompt engineering. In this workow , the GDS serves as the xed evalua- tion set for iterative development. Engineers can modify a prompt, test it against the GDS, and r eceive immediate, trustworthy feed- back. This transforms prompt dev elopment from a subjective art into a quantitative science, enabling teams to establish formal exit criteria. For example, a team could dene a quality bar relative to a baseline, such as achieving an Informedness score of 5% higher than a non-expert human, which signals a prompt is ready for production. The min FPR prompt and the balanced prompt in T able 1 are the outputs of two such optimization cycles, each targeting a dierent exit criterion. The framew ork is ecient in guiding dev elopment toward a specic and measurable target. The benchmarking results reveal critical performance trade-os between dierent agent types. For instance , the 3x human majority conguration exemplies a high-certainty agent. It improves upon the single human baseline across key metrics, achie ving a 2.5% higher precision and a 4.0% higher recall, while simultane ously reducing the FPR by 2.8%. This indicates it is highly reliable when identifying content as in-scope policy and rarely makes mistakes on out-of-scope content, making it a trustworthy baseline. In con- trast, the Gemini 2.5 pro with a balanced prompt demonstrates a clear trade-o: it delivers a substantial 22.5% gain in recall over the baseline, but this comes at the cost of a much higher FPR, which in- creases by 47.7%. Our framework quanties this trade-o precisely , allowing for a principle d labeler selection based on task-specic error costs. This rigorous evaluation extends to the crucial task of cost- performance optimization when selecting a mo del. Dierent models, even within the same family , come with distinct latency and cost proles. Our framew ork provides the quantitative data needed to make informed nancial decisions. For instance, when comparing GPT -4.1 and GPT -4o, our r esults indicate that GPT -4.1 oers a su- perior performance prole for our needs. Compared to the human baseline, it achieves a higher gain in recall (+9.0% vs. +6.6%) and, critically , a smaller p erformance decit in informedness ( -11.0% vs. -12.3%). This quantied performance gap is the critical input required to determine if the marginal gain fr om one model justies its associated cost. By translating abstract model capabilities into concrete metrics, our framework moves the decision from a subjec- tive choice to a quantitative cost-benet analysis, allowing us to condently select the model that provides the optimal trade-o for any given application and budget. 3.2 Managing Policy Update The dynamic nature of Content-Safety requires that content policies constantly evolve to address emerging changes and the latest trends. A key challenge is not just adapting to these changes, but rst quantitatively understanding the change itself. Our framework provides a no vel methodology for this, centered on dual-labeling the GDS to characterize the “policy delta” . Stage 1: Characterizing the Policy Delta. T o understand the pre- cise impact of a p olicy update, the existing GDS is r elabeled by SMEs under the new policy guidelines. This creates tw o sets of KDD ’26, August 9–13, 2026, Jeju, K orea Tian et al. T able 1: Relative de cision quality metrics for dierent labelers measured on an adult content GDS. All values are shown as percentage p oint dierences relative to the “1x human” baseline. For performance metrics (e.g., Acc., F1), positive values indicate an improvement over the baseline. For error metrics (FPR, FNR), negative values indicate an improvement (a reduction in errors). Labeler Acc. Prec. Recall F1 Neg. Prec. Neg. Rec. FPR FNR Inform. Marked. Pred. Pos. Frac. Pos. Prev . 1x human (Baseline) 0.0 0.0 0.0 0.0 0.0 0.0 0.0 0.0 0.0 0.0 0.0 0.0 3x human majority +3.6 +2.5 +4.0 +3.4 +4.1 +2.8 -2.8 -4.0 +6.8 +6.7 +1.0 -0.2 Gemini 2.5 ash (min FPR) -6.7 -18.1 +17.3 -1.2 +10.0 -39.9 +39.9 -17.3 -22.6 -7.9 +26.9 +0.3 Gemini 2.5 ash (balanced) -10.9 -23.0 +22.6 -2.7 +18.7 -57.2 +57.2 -22.6 -34.6 -4.2 +37.3 +0.3 Gemini 2.5 pro (min FPR) -7.0 -19.0 +19.5 -1.0 +13.5 -43.5 +43.5 -19.5 -24.1 -5.3 +29.7 +0.3 Gemini 2.5 pro (balanced) -6.9 -19.8 +22.5 -0.5 +20.5 -47.7 +47.7 -22.5 -25.3 +0.8 +33.2 +0.3 GPT -4.1 (balanced) -3.2 -10.9 +9.0 -0.5 +3.4 -20.0 +20.0 -9.0 -11.0 -7.4 +13.8 +0.3 GPT -4o (balanced) -4.1 -10.8 +6.6 -1.5 +1.0 -18.9 +18.9 -6.6 -12.3 -9.7 +11.9 +0.3 GPT -5 (min FPR) -5.8 -1.0 -10.3 -6.8 -7.8 +0.5 -0.5 +10.3 -9.8 -8.7 -6.0 +0.4 GPT -5 (balanced) +0.9 -8.2 +13.5 +3.1 +9.9 -16.5 +16.5 -13.5 -3.0 +1.8 +15.0 +0.3 Figure 4: The Sankey diagram visualizing the policy delta on the GDS, showing the ow of items from old SME labels to new SME lab els after a policy update. ground truth labels for the same content: GDS_labels_v1 (old pol- icy) and GDS_labels_v2 (new policy). By comparing these two label sets, we can generate a “policy delta” analysis, often visual- ized as a Sankey diagram (Figure 4). This diagram visualizes this policy delta, showing the ow of items between their labels under the old and new policies ( e.g., from “negative ” to “positive ”) This provides product and policy teams with a clear and quantitative map of the change’s impact before any enforcement agents are modied. Stage 2: Evaluating Agent Adaptation. Once the new policy is established, the framework is used to measure the decision quality of all enforcement agents, such as human agents and new LLM prompts, against the new standard. In this process, the agents’ decisions on the GDS items are evaluated solely against the new SME labels ( GDS_labels_v2 ). This provides a clear , unambiguous benchmark of each agent’s compliance with the current, corr ect policy . This comprehensive evaluation is sucient to detect regr essions, as an agent that has degraded on still-valid rules will exhibit lower ov erall performance against the new label set. More br oadly , this evaluation process culminates in a full re-benchmarking of the entire agent ecosystem, including 1x human, 3x human majority , and various LLM cong- urations, against the new policy ground truth. The result is the decision quality analysis presented in T able 1, ensuring our under- standing of agent performance and their associated cost-tradeos remains current as our safety policies evolv e. 3.3 Prevalence V alidation Accurately estimating the prevalence of rare policy content at plat- form scale is a critical yet challenging task. The se metrics inform strategic policy and business decisions, and their integrity is para- mount. Our platform recently transitioned from using costly 3x human majority labels to a more scalable LLM-based approach for this task. This shift resulted in o ver 30x in cost savings and a 10x reduction in labeling turnaround time. This transition from a trusted human consensus to an automate d system necessitates a rigorous and continuous validation frame- work to ensure the LLM’s quality does not degrade over time, which would silently bias our prevalence metrics. T o achieve this, we use the GDS to implement a continuous monitoring system with two distinct tracks, each designed to dete ct a dierent type of potential failure. First, we monitor for content drift by regularly evaluating the LLM’s performance on new content added with each GDS release. This process answers the critical question: “Is the model’s quality degrading as real-world content patterns evolve?” By focusing the evaluation on the newest GDS items, we can quickly detect if our LLM is failing to generalize to emerging adversarial trends. A signif- icant drop in performance on this new data triggers an immediate investigation and potential prompt updates. This pre vents ev olving content from invalidating our measurement system. Second, we validate system stability . This process tests for tech- nical issues by periodically re-evaluating the same LLM and prompt against a specic GDS version that was used to establish the initial decision quality baseline for the current policy . In this task, both the data and the model conguration are constant. Therefore, any signicant change in decision quality metrics would not be due to content changes, but would instead indicate a potential system-level issue, such as a pipeline bug, an unintende d change in a depen- dency , or non-determinism in the infer ence stack. This allows us Decision ality Evaluation Framework at Pinterest KDD ’26, August 9–13, 2026, Jeju, K orea to isolate engineering instability from model quality degradation caused by evolving content. These two processes, working in concert, provide a comprehen- sive safeguard for our pre valence estimation pipeline. By continu- ously validating our LLM agent against both ev olving content ( con- tent drift) and a xed b enchmark (system stability), the framew ork ensures the integrity of our most critical platform-wide metrics over the long term. 4 Conclusions In this paper , we pr esented a comprehensiv e framework for the systematic evaluation of content moderation decisions at scale. Our work is motivated by the nee d to manage the trade-os be- tween cost, trustworthiness, and scale, while taking advantage of the agility of modern LLMs. Our primar y contribution is a holistic system built around a high-trust and expert-curated GDS, an intel- ligent sampling pipeline for dataset curation, and a set of robust, automated workows for continuous evaluation. Through practical applications at Pinterest, we demonstrated that the framework provides a p owerful solution to several real- world challenges. W e have shown its ability to: • Quantify performance trade-os between human agents and various LLM congurations, enabling data-driven cost- benet analysis. • Provide a rigorous metho dology for prompt engineering, transforming it from a subjective art into a quantitative sci- ence with clear exit criteria. • Characterize and manage the entire policy evolution lifecy- cle, from understanding the impact of a policy change to measuring agent adaptation. • Safeguard the integrity of critical prevalence metrics by con- tinuously monitoring for both content drift and system in- stability . The broader implication of this work is a blueprint for op era- tionalizing responsible AI dev elopment in the Content-Safety do- main. By cr eating a r eliable, reproducible, and intelligent evaluation system, we provide a pathway for organizations to move from sub- jective quality assessments to a continuous, data-driven practice. A promising direction for future work is to lev erage the GDS to build a ne w class of large-scale evaluation datasets. These datasets would intentionally sacrice a degree of trustworthiness for massive gains in size and cost-eciency by using the GDS as a benchmark to calibrate labels from more scalable sources. The availability of such datasets, which we term the “Gold-Certied Set” , would enable a broader range of applications that require large-scale data, such as oine ML model evaluation. Acknowledgments This work cannot be accomplished without the help from Minli Zang, T ony Paek, Xiaohan Y ang, Benjamin Thompson, and Monica Bhide. W e would like to thank them for their support and contribu- tions throughout this project. References [1] Josh Beal, Eric Kim, Jinfeng Rao, Rex Wu, Dmitry Kislyuk, and Charles Rosenberg. 2026. PinCLIP: Large-scale Foundational Multimodal Representation at Pinterest. (2026). [2] Eshwar Chandrasekharan, Mattia Samory, Shagun Jhav er , Hunter Charvat, Amy Bruckman, Cli Lampe, Jacob Eisenstein, and Eric Gilbert. 2018. The Internet’s hidden rules: An empirical study of Reddit norm violations at micro, meso, and macro scales. Proce edings of the ACM on Human-Computer Interaction 2, CSCW (2018), 1–25. [3] Faisal Farooq, Aravindh Manickavasagam, and Attila Dobi. 2025. How Pinter est Built a Real- Time Radar for Violative Content Using AI. Pinterest Engineering (Medium). https://medium.com/pinterest- engineering/how- pinterest- built- a- real- time- radar- for- violative- content- using- ai- d5a108e02ac2 Accessed 2026-01- 20. [4] Robert Gorwa, Reuben Binns, and Christian Katzenbach. 2020. Algorithmic content moderation: T echnical and political challenges in the automation of platform governance. Big Data & Society 7, 1 (2020), 2053951719897945. [5] Shagun Jhaver , Iris Birman, Eric Gilbert, and Amy Bruckman. 2019. Human- machine collaboration for content regulation: The case of reddit automoderator. ACM Transactions on Computer-Human Interaction (TOCHI) 26, 5 (2019), 1–35. [6] Vivian Lai, Chacha Chen, Q V era Liao, Alison Smith-Renner , and Chenhao T an. 2021. T owar ds a science of human-ai decision making: a survey of empirical studies. arXiv preprint arXiv:2112.11471 (2021). [7] Doyup Lee, Chiheon Kim, Saehoon Kim, Minsu Cho, and W o ok-Shin Han. 2022. Autor egressive image generation using residual quantization. In Pr oceedings of the IEEE/CVF conference on computer vision and pattern recognition . 11523–11532. [8] Jianhua Lin. 2002. Divergence measures based on the Shannon entropy . IEEE Transactions on Information theor y 37, 1 (2002), 145–151. [9] Mary L McHugh. 2012. Interrater reliability: the kappa statistic. Biochemia medica 22, 3 (2012), 276–282. [10] Pinterest. 2025. Community guidelines. https://p olicy .pinterest.com/en/ community- guidelines. Last updated: December 2025. Accessed: 2026-01-30. [11] Alec Radford, Jong W ook Kim, Chris Hallacy, Aditya Ramesh, Gabriel Goh, Sandhini Agarwal, Girish Sastry , Amanda Askell, Pamela Mishkin, Jack Clark, et al . 2021. Learning transferable visual mo dels from natural language supervision. In International conference on machine learning . PmLR, 8748–8763. [12] Anima Singh, Trung Vu, Nikhil Mehta, Raghunandan K eshavan, Maheswaran Sathiamoorthy , Yilin Zheng, Lichan Hong, Lukasz Heldt, Li W ei, Devansh T andon, et al . 2024. Better generalization with semantic ids: A case study in ranking for recommendations. In Proceedings of the 18th ACM Conference on Recommender Systems . 1039–1044. [13] Rion Snow , Brendan O’Connor , Dan Jurafsky , and Andre w Y Ng. 2008. Cheap and fast–but is it good? e valuating non-expert annotations for natural language tasks. In Proceedings of the 2008 conference on empirical methods in natural language processing . 254–263. [14] Xiaohua Zhai, Basil Mustafa, Alexander Kolesnikov , and Lucas Beyer . 2023. Sig- moid loss for language image pre-training. In Proceedings of the IEEE/CVF inter- national conference on computer vision . 11975–11986. Received 20 February 2007; revised 12 March 2009; accepted 5 June 2009
Original Paper
Loading high-quality paper...
Comments & Academic Discussion
Loading comments...
Leave a Comment