Fault Detection in Electrical Distribution System using Autoencoders
In recent times, there has been considerable interest in fault detection within electrical power systems, garnering attention from both academic researchers and industry professionals. Despite the development of numerous fault detection methods and t…
Authors: Sidharthenee Nayak, Victor Sam Moses Babu, Ch
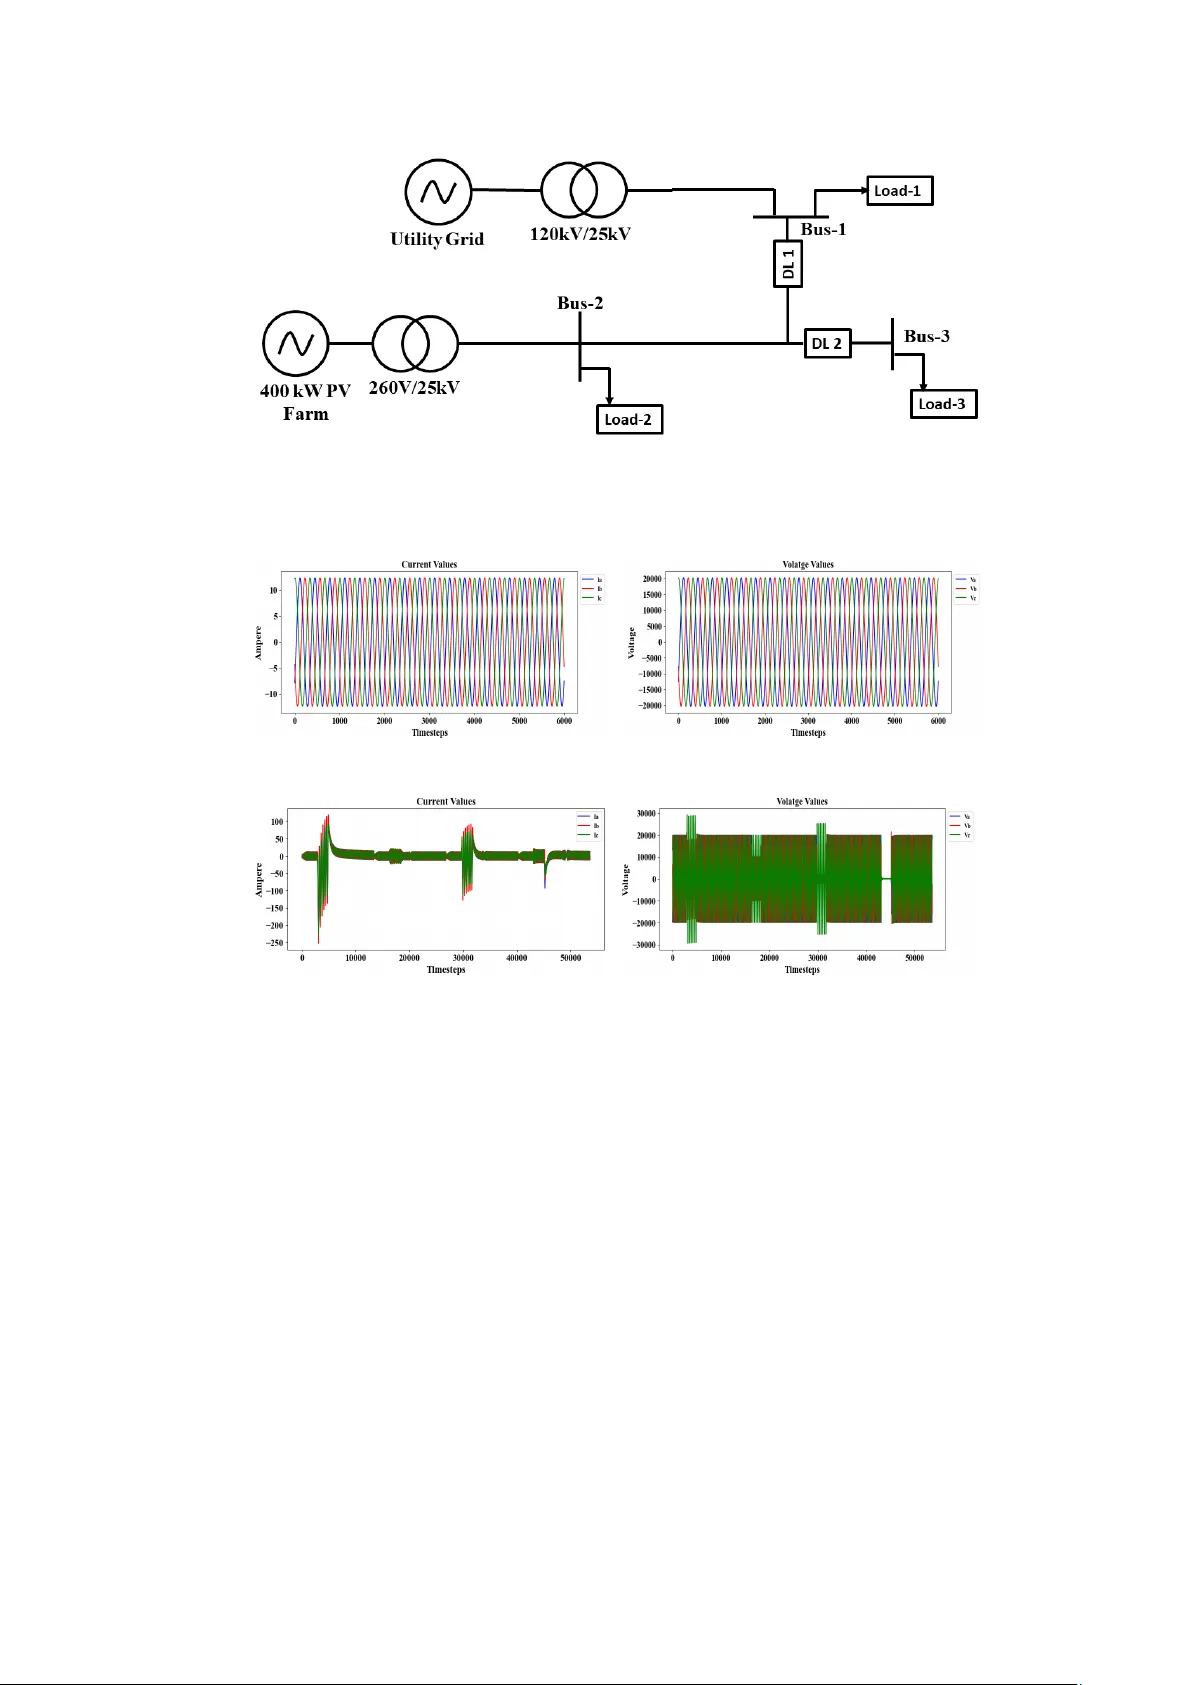
F ault Detection in Electrical Distribution System using Auto enco ders Sidharthenee Na y ak 1,2 , Victor Sam Moses Babu 1,3 , Chandrashekhar Nara y an Bhende 2 , Prat yush Chakrab ort y 3 , Ma yukha P al 1,* 1 ABB Abilit y Inno v ation Cen ter, Asea Bro wn Bo v eri Compan y , Hyderabad, 500084, India. 2 Sc ho ol of Electrical Sciences, Indian Institute of T ec hnology Bh ubanesw ar, Bh ubaneswar, 751013, India. 3 Departmen t of Electrical and Electronics Engineering, BITS Pilani Hyderabad Campus, Hyderabad, 500078, India. *Corresp onding author(s). E-mail(s): ma yukha.pal@in.abb.com ; Abstract In recent times, there has b een considerable in terest in fault detection within electrical p o w er systems, garnering attention from both academic researchers and industry professionals. Despite the dev elopment of numerous fault detection metho ds and their adaptations ov er the past decade, their practical application remains highly challenging. Given the probabilistic nature of fault o ccurrences and parameters, certain decision-making tasks could b e approac hed from a probabilistic standp oin t. Protective systems are task ed with the detection, classification, and lo calization of fault y voltage and current line magnitudes, cul- minating in the activ ation of circuit break ers to isolate the fault y line. An essen tial asp ect of designing effective fault detection systems lies in obtaining reliable data for training and testing, which is often scarce. Leveraging deep learning tec hniques, particularly the p o w erful capabilities of pattern classifiers in learn- ing, generalizing, and parallel processing, offers promising av en ues for intelligen t fault detection. T o address this, our pap er prop oses an anomaly-based approach for fault detection in electrical p o w er systems, employing deep auto encoders. Additionally , we utilize Conv olutional Auto encoders (CAE) for dimensionality reduction, which, due to its fewer parameters, requires less training time com- pared to con v en tional auto encoders. The proposed method demonstrates superior p erformance and accuracy compared to alternative detection approac hes by 1 ac hieving an accuracy of 97.62% and 99.92% on simulated and publicly av ailable datasets. Keyw ords: fault detection, autoenco der, CNN, distribution system 1 In tro duction The electric pow er grid pla ys a vital role in modern so ciet y , reliably supplying electric- it y to residential, commercial, and industrial sectors. As our dep endence on electricity gro ws, there is a corresp onding increase in the need for robust and effective electri- cal distribution systems (EDSs). Guaranteeing the safet y and dep endabilit y of these systems requires mitigating risks and ensuring unin terrupted p ow er deliv ery .[ 1 , 2 ] Therefore, the adoption of sophisticated methods for detecting and classifying faults is crucial to optimize the p erformance of EDSs.[ 3 , 4 ] These tec hniques serv e as a critical to ol in identifying and managing faults, optimizing maintenance efforts, and ultimately strengthening the o v erall resilience of the grid [ 3 , 5 ]. The electrical p o w er system, comprising v arious dynamic elemen ts, is susceptible to disturbances and faults, necessitating swift fault detection and protection op eration to maintain stability [ 6 ]. It is important to swiftly detect and classify faults on transmission lines, with pro- tection systems initiating relays to preven t outages [ 6 ]. Effectiv e fault detection and classification, ensuring rapid restoration of the p o w er system, are imp erativ e for ser- vice reliability and minimizing outages [ 7 ]. Protection schemes m ust promptly detect and remov e affected segments during a fault incident to minimize its impact [ 8 ]. Ho wev er, the expansion of modern p o w er net w orks poses challenges for protection sys- tems, requiring integrated schemes capable of monitoring different grid la yers. Wide Area Protection (W AP) using phasor measuremen ts from Phasor Measuremen t Units (PMUs) has b een prop osed, y et c hallenges remain in interpreting data and identifying fault y comp onen ts [ 9 ]. Existing fault detection algorithms for transmission netw orks often rely on iter- ativ e solutions or require numerous PMUs, while distribution netw orks face issues due to distributed generation impacting fault lev els and relay op eration [ 10 , 11 ]. Syn- c hrophasor measurements offer a more reliable alternativ e but are curren tly limited to distribution netw orks, highlighting the need for an integrated scheme applicable to b oth distribution and transmission netw orks [ 9 ]. F ault diagnosis is categorized into t w o main t yp es: mo del-based and pro cess history-based approac hes. Mo del-based metho ds inv olv e analyzing faults by repre- sen ting a system or pro cess using either quantitativ e or qualitative mo dels. On the other hand, pro cess history-based tec hniques rely on empirical data gathered from the pro cess, establishing connections b et w een inputs and desired outputs without prior mathematical modeling. F eature extraction is crucial in process history-based metho ds as it helps capture essen tial information from empirical data for pattern recognition. With adv ancemen ts in signal pro cessing and a deep er understanding of pow er sys- tems, v arious techniques hav e emerged for direct measuremen t and transformation, enabling the extraction of inherent fault c haracteristics. Commonly utilized methods 2 for feature extraction in the literature include W av elet and F ourier transforms, which effectiv ely isolate fault-related characteristics with robustness and precision. [ 12 – 15 ]. Ho wev er, these classical metho ds may yield inaccurate results due to assumptions ab out line parameters. Artificial neural net w orks (ANNs) and support v ector machines (SVMs) are robust pattern recognition methodologies capable of efficiently generaliz- ing dynamic parameters using b oth sup ervised and unsup ervised learning approac hes. [ 16 ]. Recen tly , mac hine learning algorithms hav e b een widely used b y com bining sig- nal pro cessing approaches to rapidly and accurately identify faults [ 17 – 19 ]. Signal pro cessing techniques extract the features from initially captured voltage and current signals to determine fault o ccurrence and their types [ 20 ]. Unfortunately , the selec- tion of faulted features across differen t frequency ranges is often arbitrary , leading to inconsistency in results. Therefore, enhancing the fault detection accuracy for EDSs has emerged as a significant researc h fo cus. Also, existing fault detection techniques are supervised approac hes, whic h poses c hallenges for real-time applications due to the requiremen t of prior lab eling, and achieving online fault detection and clustering with a high degree of accuracy remains elusive. Recently auto encoders hav e emerged as an in teresting option for anomaly detection in a time series because it needs to b e trained only on one type of data that is normal data. In [ 21 ] authors hav e used deep auto en- co ders for anomaly detection in wireless com m unication netw orks. Similarly [ 22 ] ha v e used auto encoders for anomaly detection in videos. In our prop osed method we ha ve used a deep con v olutional auto encoder mo del to detect faults in the distribution and transmission system. At first, the mo del is trained on normal time-series data of current whic h has no fault. During training the auto enco der learns to reconstruct the normal time series data and the maxim um reconstruction error is chosen as the threshold. While testing, the current signals with v arious t yp es of faults are given to the model. If the reconstruction error is more than the threshold then those segments of the signal w ere iden tified as fault segments. The mo del was trained and tested on b oth simulated and publicly av ailable datasets and ga ve high accuracy for fault detection in b oth datasets. The key contributions of this pap er are as follows: 1. The work prop oses the use of conv olutional autoenco ders for detecting faults in p o w er systems. 2. The autoenco der model p erformed better than other traditional ML models ac hiev- ing a high accuracy for detecting faults. It ac hiev ed a notable accuracy of 97.62% on the simulated dataset and 99.92% on the publicly a v ailable dataset. The pap er is structured as follows: section 2 pro vides a detailed exploration of the auto encoder structure and how it is used for anomaly detection. Section 3 out- lines information about the datasets used and ev aluation metrics with a discussion of obtained results. Finally , section 5 summarizes the pap er. 2 Materials and Metho ds The architecture of the prop osed mo del for signal classification is illustrated in Fig. 2 . 3 Fig. 1 : Flo w c hart of the prop osed fault detection process Fig. 2 : Arc hitecture of auto encoder used in the prop osed algorithm 2.1 Auto enco ders The architecture of an auto enco der is illustrated in Fig. 2 . An auto enco der represents a sp ecialized neural net w ork designed primarily to compress input data in to a mean- ingful represen tation and subsequently reconstruct it to closely resem ble the original input.[ 23 ] Auto encoders were initially in troduced by Rumelhart et al. [ 24 ] as neural net w orks trained to reconstruct their input. They are primarily utilized for unsup ervised learn- ing to deriv e a meaningful representation of the data, whic h could b e applied to tasks lik e clustering. Typically , the enco der is b e form ulated as a function dep enden t on certain parameters. 4 g i = A ( x i ) (1) Where g i ∈ R p is the output of the enco der blo c k in Figure 1 when we ev aluate it on the input x i . The decoder (and the output of the net work that we will indicate with ˜ x i ) is b e written as a second generic function of the latent features [ 25 ] ˜ x i = B ( g i ) = B ( A ( x i )) (2) Where ˜ x i ∈ R n . The problem, as formally defined in [2], is to learn the functions A : R n → R p (enco der) and B : R p → R n (deco der) that satisfy arg min A,B E [∆( x , B ◦ A ( x )] (3) Here, E represen ts the exp ectation across the distribution of x , and ∆ stands for the reconstruction loss function, quantifying the disparity b et w een the deco der’s output and the input. T ypically , the input discrepancy is ev aluated using the ℓ 2 -norm. In the most popular form of auto encoders, A and B are neural netw orks [ 26 ]. When A and B are linear op erations, a linear auto encoder is obtained [ 27 ]. In the scenario where non-linear operations are omitted, the linear autoenco der con v erges to the same laten t representation as Principal Comp onen t Analysis (PCA) [ 28 ]. Consequently , an auto encoder serves as an extension of PCA, as it will learn a non-linear manifold instead of merely identifying a low-dimensional hyperplane where the data resides. The enco der reduces and extracts relev ant features from the input and reduces the input dimension. The b ottlene ck is the compressed representation obtained at the enco der output. The deco der decompresses the b ottlene ck to give an output whose dimension is equal to the dimensions of the input. The loss function used in the training would b e the error b et w een the input giv en to the autoenco der mo del and the reconstructed output. Auto encoders hav e the following features [ 29 ]: • They are tailored to specific datasets, implying their effectiveness in compressing data resembling what they w ere trained on. • They op erate with loss, leading to a degradation in the quality of decompressed outputs compared to the original inputs, con trasting with lossless arithmetic compression. • They p ossess the adv an tage of automatic learning from data samples, facilitating the training of customized versions optimized for particular input types without necessitating additional engineering efforts, solely relying on appropriate training data. 2.2 Auto enco ders for anomaly detection The fundamental concept of auto encoder-based anomaly detection revolv es around prioritizing the understanding of normal patterns rather than explicitly mo deling anomalies. During training, the autoenco der is trained to accurately reconstruct data 5 Fig. 3 : Detailed la y ers of the CNN-based autoenco der mo del con taining normal patterns, suc h as normal time series data, by minimizing a loss function assessing the fidelity of reconstructions. Subsequently , up on completion of training, the mo del excels in reconstructing data featuring normal patterns but strug- gles with anomalous data, as it hasn’t been exp osed to them during training. Anomaly detection is accomplished b y ev aluating the reconstruction metrics, lik e reconstruction error, whic h serve as indicators of anomalies. In this w ork, the auto enco der is trained on the current signal of a single phase under normal op erating conditions. The recon- struction error b et w een the predicted and original current signals is selected as the error threshold. Now for each phase, the current signals with faults are given to the mo del for prediction. The segmen ts of the signal for whic h the reconstruction error is more than the error threshold are detected as an anomaly segment and hence the fault segment is detected. 2.3 Mo del architecture In this paper we ha v e used a Con v olutional Neural Net work (CNN) based arc hitecture i.e., both enco der and deco der are CNN models. The en tire input signal is divided in to samples of fixed length using ov erlapping windows. Supp ose the entire signal has N data p oin ts, and if the fixed length is taken as T then the entire signal is divided in to segmen ts of length T . So a total of N − T + 1 samples are generated. Each sample is passed through the CNN-based enco der which creates a lo w er-dimensional represen tation of the input. This compressed representation is passed into the decoder whic h decompresses and regenerates. The detailed architecture of the enco der and deco der model is sho wn in Fig. 3 . 6 T able 1 : Ev aluation metrics to assess mo del performance Metric F ormula Accuracy A s = T P + T N T P + T N + F P + F N Precision P s = T P T P + F P Recall R s = T P T P + F N Specificity S F s = T N T N + F P F1-score F 1 s = 2 × P s × R s P s + R s 2.4 Ev aluation Metrics After the mo del detected the fault segments in the entire signal, it w ould classify eac h data p oin t as faulty or not faulty . The ov erall p erformance of our mo del is ev al- uated from the confusion matrix. There are four terms namely T rue Positiv es (TP), F alse P ositiv es (FP), F alse Negatives (FN), and T rue Negatives (TN) are included in this ev aluation matrix. Ev aluation indicators namely accuracy , sp ecificit y , Recall, F1- score, and precision were ev aluated to assess the p erformance of our mo del. [ 30 ] These ev aluation indicators are calculated utilizing the formulas given in T able 1 . 3 Dataset 3.1 Sim ulation Mo del The sc hematic of the sim ulation mo del is sho wn in Fig. 4 . The sim ulation is performed in MA TLAB/SIMULINK. The considered system consists of a solar PV farm of four 100 kW PV arrays connected to a distribution system. The distribution system con- sists of 2 feeders of 8 km and 14 km supplying 3 loads. There are 3 buses in the system and the PV farm is connected to Bus 2 where the three-phase voltage and cur- ren t measuremen ts are measured and given as input to the proposed mo del for fault detection. F our types of faults: single Line-to-Ground (LG) i.e., AG, double Line-to- Ground (LLG) i.e., ABG, triple Line-to-Ground (TLG) i.e., ABCG, and Line-to-Line i.e., AB faults w ere generated at a distance of 1 km with a fault resistance of 0.01 ohm. The sampling rate of the sim ulation is 5e -5 seconds i.e., 320 samples pe r cycle of 60Hz frequency . Each fault is sim ulated for 100 milliseconds i.e., 2000 samples. Using the three-phase voltage and current measurements at Bus 2, we p erform the prop osed metho ds for fault detection. Fig. 6 shows the current and voltage signals of all three phases from the simulation mo del. Fig. 5a and 5b sho ws the curren t and v oltage sig- nals with no fault. Fig. 6a and 6b shows the current and voltage signals with four t yp es of faults i.e., LG, LLG, TLG and, LL faults. 7 Fig. 4 : Single Line Diagram of simulation mo del consisting of a 400 kW solar PV farm connected to the grid with three loads and tw o feeders. (a) Current signals with no fault (b) V oltage signals with no fault (c) Current signals with four t ypes of faults (d) V oltage signals with four types of faults Fig. 5 : Curren t and V oltage signals of all three phases from the simulation mo del 3.2 Public dataset W e ha ve also tested the mo del on a public dataset obtained from Kaggle [ 31 ]. The dataset originated from a p o w er system sim ulated in MA TLAB for fault-detection purp oses. It is used for statistical comparision of the performance of our mo del with other traditional ML mo dels. 8 (a) Current signals with different types of faults (b) V oltage signals with different types of faults Fig. 6 : Curren t and V oltage signals of all three phases from the public dataset T able 2 : Ev aluation metrics for simu- lated and public dataset Metric Simulated data Public data Accuracy 97.62 99.92 Precision 96.85 99.89 Recall 91.35 1.00 Specificity 99.23 99.74 F1-score 94.02 99.94 4 Results and Discussion 4.0.1 Sim ulated data The auto encoder mo del was trained on the curren t signal of phase A under no-fault conditions. After the mo del was trained, it was giv en the phase A normal current signal for reconstruction. The reconstruction error of each sample in the signal w as noted and the highest reconstruction error was taken as the threshold v alue α . Fig. 7 sho ws the distribution of the reconstruction error across differen t samples when the mo del was given the training data for reconstruction. Next, the faulty current signal of each phase w as given to the mo del for reconstruction separately . The segments for whic h the reconstruction error was greater than the threshold ( α ) w as detected as the fault segmen t. Fig. 8 sho ws the distribution of the reconstruction error across differen t samples when the mo del was giv en the test data, i.e., the signal with fault segmen ts for reconstruction. Fig. 9 sho ws the curren t signals of all three phases with detected fault segmen ts by the mo del. In this pro cess, the mo del iden tified each data p oin t as either fault y or not fault y , and the resulting confusion matrix is shown in Fig. 10 . T able 2 sho ws the ev aluation metrics when the mo del was ev aluated on a sim ulated dataset. 4.0.2 Public data T o further ev aluate the mo del efficiency , w e tested the model on a publicly a v ailable dataset in Kaggle, which consisted of around 7600 data points. Similar to the simulated 9 Fig. 7 : Distribution of reconstruction error of the mo del on train data. Eac h bin represen ts the n umber of segmen ts of data ha ving a given MAE loss. The highest reconstruction error is chosen as the threshold( α ) for detecting the faults. (a) Phase A (b) Phase B (c) Phase C Fig. 8 : Distribution of reconstruction error of the mo del on test data of all three phases. dataset, the auto encoder mo del w as trained on the current signal of phase A with no faults. The reconstruction error of each sample in the signal was noted, and the highest reconstruction error w as tak en as the threshold v alue. Then, the faulty current signal of each phase w as given to the mo del for reconstruction separately . The segments for whic h the reconstruction error was greater than the threshold was detected as the fault segmen t. Fig. 8 sho ws the distribution of the reconstruction error across differen t samples when the model was given the test data, i.e., the signal with fault segmen ts for reconstruction. Fig. 9 shows the current signals of all three phases with detected fault segmen ts b y the model. The resulting confusion matrix is sho wn in Fig. 10 . T able 10 (a) Phase A (b) Phase B (c) Phase C Fig. 9 : Current signals of three phases with highligh ted fault segments detected by the mo del (a) Simulated data (b) Public data Fig. 10 : Confusion matrices 2 shows the ev aluation metrics when the model was ev aluated on the public dataset. Our mo del’s p erformance w as compared against the performance of other traditional ML mo dels that were a v ailable in Kaggle and w as found to b e p erforming at par or ev en b etter than other ML mo dels. T able 3 shows the comparison scores. Th us b y lev eraging the abilit y of autoenco ders to capture complex patterns in data and detect deviations from learned normal patterns, they can b e effectiv e to ols for anomaly detection in time series data. 5 Conclusion In this w ork, we in tro duced a metho dology that uses CNN based auto enco der mo del for efficien t electrical fault detection. A large fault dataset w as sim ulated with four dif- feren t t ypes of faults. The prop osed metho d show ed consistency in detecting each fault. 11 (a) Phase A (b) Phase B (c) Phase C Fig. 11 : Current signals of three phases with highlighted fault segments detected by the mo del on public dataset T able 3 : Comparision of our mo del p erformance with other ML mo dels Models Accuracy Logistic Regression [ 32 ] 60.11 Support V ector Machine [ 32 ] 99.66 K Neighbors Classifier [ 32 ] 99.34 Proposed Mo del 99.92 F or further ev aluation, the mo del w as tested on a publicly av ailable dataset that con- tained v arious t yp es of faults and was found to give a very high accuracy for detecting fault y p oin ts and p erformed b etter than other traditional ML mo dels. Th us, the pro- p osed methodology could offer practical b enefits in terms of enhancing fault detection accuracy , reducing do wntime, and improving system reliability . F uture research could fo cus on testing the prop osed methodology for a wide range of even ts and exploring its applicabilit y in other domains b ey ond electrical systems. Additionally , integrating real-time data and adaptive learning algorithms could further enhance its capabilities. Ac kno wledgmen ts Sidharthenee Nay ak and K. Victor Sam Moses Babu would like to thank ABB Ability Inno v ation Cen tre, Hyderabad, for their financial support in carrying out their researc h w ork. The author Ma yukha Pal would like to thank the ABB Ability Inno v ation Cen ter, Hyderabad, for their support in this work. 12 Data and Co de Av ailabilit y The public dataset for our analysis is from a free public database (h ttps://www.k aggle.com/datasets/esath y aprak ash/electrical-fault-detection-and- classification/data). The co des that support the findings of this study are av ailable from the corresp onding author up on reasonable request. References [1] D. M. Reddy , D. Dwiv edi, P . K. Y emula, and M. Pal, “Data-driven approach to form energy resilient smart microgrids with iden tification of vulnerable no des in activ e electrical distribution netw ork,” arXiv pr eprint arXiv:2208.11682, 2022 [2] D. Dwiv edi, P . K. Y em ula, and M. P al, “Ev aluating the plan- ning and op erational resilience of electrical distribution systems with distributed energy resources using complex net work theory ,” R enew- able Ener gy F o cus , vol. 46, pp. 156–169, 2023. [Online]. Av ailable: h ttps://www.sciencedirect.com/science/article/pii/S1755008423000625 [3] Dwivedi, D., Babu, K., Y emula, P . K., Chakraborty , P ., and P al, M. (2022). Ev al- uation of energy resilience and cost b enefit in microgrid with p eer-to-peer energy trading. arXiv pr eprint arXiv:2212.02318 . [4] Dwivedi, D., Mitikiri, S. B., Babu, K., Y emula, P . K., Srinin v as, V. L., Chakraborty , P ., & P al, M. (2023). Adv ancemen ts in Enhancing Resilience of Electrical Distribu- tion Systems: A Review on F rameworks, Metrics, and T echnological Inno v ations. arXiv pr eprint arXiv:2311.07050 . [5] Babu, K. V. S. M., Dwivedi, D., Chakraborty , P ., Y emula, P . K., & P al, M. (2023, Ma y). A Resilient P o w er Distribution System using P2P Energy Sharing. In 2023 IEEE IAS Glob al Confer enc e on Emer ging T e chnolo gies (GlobConET) (pp. 1-6). IEEE. [6] M. Jamil, S. K. Sharma, and R. Singh, “F ault detection and classification in elec- trical p o wer transmission system using artificial neural netw ork,” SpringerPlus , v ol. 4, no. 1, pp. 1–13, 2015. [7] M. Singh, B. P anigrahi, and R. Mahesh w ari, “T ransmission line fault detection and classification,” in 2011 International Confer enc e on Emer ging T r ends in Ele ctric al and Computer T e chnolo gy . IEEE, 2011, pp. 15–22. [8] R.-A. Tˆırnov an and M. Cristea, “Adv anced techniques for fault detection and classification in electrical p o w er transmission systems: An ov erview,” in 2019 8th International Confer enc e on Mo dern Power Systems (MPS) . IEEE, 2019, pp. 1–10. [9] M. A. Ebrahim, F. W adie, and M. A. Ab d-Allah, “Integrated fault detection algo- rithm for transmission, distribution, and microgrid net w orks,” IET Ener gy Systems 13 Inte gr ation , vol. 1, no. 2, pp. 104–113, 2019. [10] P . Mayukha, A. K. Bharati, and S. S. Belkho de, “Data analytics for smart electrical protection systems,” Mar. 2 2023, uS Paten t App. 17/983,609. [11] D. Dwivedi, P . K. Y emula, and M. Pal, “Dynamopm u: A physics informed anomaly detection, clustering and prediction metho d using non-linear dynamics on µ pm u measurements,” IEEE T r ansactions on Instrumentation and Me asur ement , 2023. [12] S. A. Aleem, N. Shahid, and I. H. Naqvi, “Metho dologies in pow er systems fault detection and diagnosis,” Ener gy Systems , v ol. 6, pp. 85–108, 2015. [13] I. Y.-H. Gu and E. Styv aktakis, “Bridge the gap: signal pro cessing for p o wer qualit y applications,” Ele ctric Power Systems R ese ar ch , vol. 66, no. 1, pp. 83–96, 2003. [14] D. Das, N. K. Singh, and A. K. Sinha, “A comparison of fourier transform and w av elet transform methods for detection and classification of faults on transmission lines,” in 2006 IEEE Power India Confer enc e . IEEE, 2006, pp. 7–pp [15] A. Ab dollahi and S. Seyedtabaii, “Comparison of fourier & wa v elet transform metho ds for transmission line fault classification,” in 2010 4th International Power Engine ering and Optimization Confer enc e (PEOCO ). IEEE, 2010, pp. 579–584. [16] K. Li, L. Lai, and A. David, “Application of artificial neural netw ork in fault lo cation technique,” in DRPT2000. International Confer enc e on Ele ctric Utility Der e gulation and R estructuring and Power T e chnolo gies. Pr o c e e dings (Cat. No. 00EX382) . IEEE, 2000, pp. 226–231 [17] J. J. Q. Y u, Y. Hou, A. Y. S. Lam, and V. O. K. Li, “Intelligen t fault detec- tion sc heme for microgrids with wa v elet-based deep neural net w orks,” IEEE T r ansactions on Smart Grid , vol. 10, no. 2, pp. 1694–1703, 2019. [18] M.-F. Guo, N.-C. Y ang, and W.-F. Chen, “Deep-learning-based fault classifica- tion using hilb ert–h uang transform and conv olutional neural netw ork in p ow er distribution systems,” IEEE Sensors Journal , v ol. 19, no. 16, pp. 6905–6913, 2019. [19] J. C. Arouche F reire, A. R. Garcez Castro, M. S. Homci, B. S. Meiguins, and J. M. De Morais, “T ransmission line fault classification using hidden mark o v mo dels,” IEEE A c c ess , vol. 7, pp. 113 499–113 510, 2019. [20] K. Chen, C. Huang, and J. He, “F ault detection, classification and lo cation for transmission lines and distribution systems: a review on the methods,” High V oltage , vol. 1, no. 1, pp. 25–33, 2016. 14 [21] Z. Chen, C. K. Y eo, B. S. Lee, and C. T. Lau, “Auto enco der-based netw ork anomaly detection,” in 2018 Wir eless tele c ommunic ations symp osium (WTS) . IEEE, 2018, pp. 1–5 [22] M. Rib eiro, A. E. Lazzaretti, and H. S. Lopes, “A study of deep con v olutional auto-enco ders for anomaly detection in videos,” Pattern R e c o gnition L etters , vol. 105, pp. 13–22, 2018. [23] D. Bank, N. Ko enigstein, and R. Giryes, “Auto encoders,” Machine le arning for data scienc e handb o ok: data mining and know le dge disc overy handb o ok , pp. 353–374, 2023. [24] D. E. Rumelhart, G. E. Hin ton, R. J. Williams et al. , “Learning in ternal represen tations by error propagation,” 1985. [25] U. Mic helucci, “An introduction to auto encoders,” arXiv pr eprint arXiv:2201.03898 , 2022 [26] M. Ranzato, F. J. Huang, Y.-L. Boureau, and Y. LeCun, “Unsupervised learning of inv ariant feature hierarc hies with applications to ob ject recognition,” in 2007 IEEE c onfer enc e on c omputer vision and p attern r e c o gnition . IEEE, 2007, pp. 1–8 [27] P . Baldi and K. Hornik, “Neural netw orks and principal comp onent analysis: Learning from examples without lo cal minima,” Neur al networks , vol. 2, no. 1, pp. 53–58, 1989. [28] E. Plaut, “F rom principal subspaces to principal components with linear auto en- co ders,” arXiv pr eprint arXiv:1804.10253 , 2018. [29] Keras blog. [Online]. Av ailable: https://blog.k eras.io/ building-auto encoders-in- k eras.html [30] B. S. Deo, M. Pal, P . K. Panigrahi, and A. Pradhan, “Supremacy of attention- based transformer in oral cancer classification using histopathology images,” International Journal of Data Scienc e and Analytics , pp. 1–19, 2024. [31] Dataset. [Online]. Av ailable: h ttps://www.k aggle.com/datasets/ esath yaprak ash/electrical-fault-detection-and-classification. [32] Comparision. [Online]. Av ailable: h ttps://www.k aggle.com/code/ y aarvnpatr/detection-of-the-electrical-faults 15
Original Paper
Loading high-quality paper...
Comments & Academic Discussion
Loading comments...
Leave a Comment