Conference Proceedings of the Inaugural Conference of the International Society for Tractography (IST 2025 Bordeaux)
This collection comprises the abstracts presented during poster, power pitch and oral sessions at the Inaugural Conference of the International Society for Tractography (IST Conference 2025), held in Bordeaux, France, from October 13-16, 2025. The co…
Authors: ** *International Society for Tractography (IST) – 다수의 연구자 및 기관이 공동 참여* (예시) Luc Florack, Rick Sengers, Stephania Assimopoulos
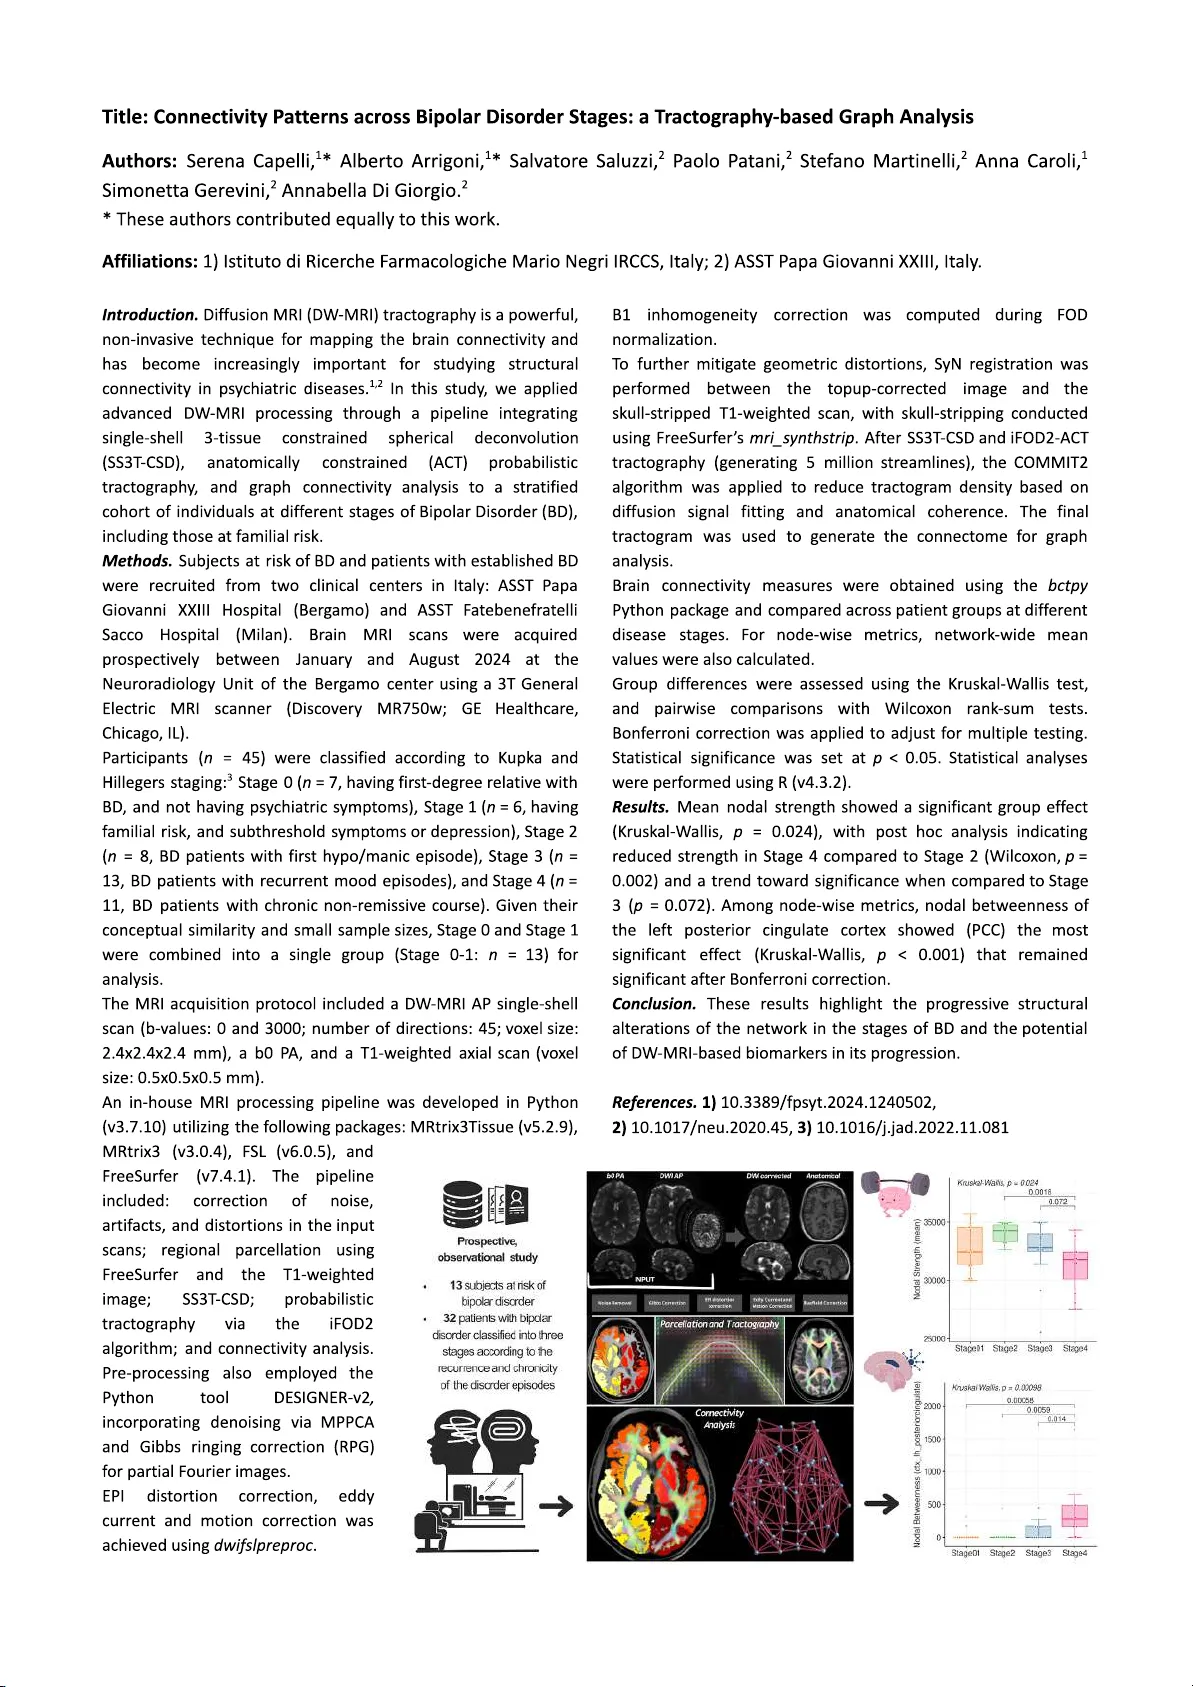
International Society for T ractography Connecting People & Expertise to Shape the Future of T ractography Conference Proceedings IST 2025 Bordeaux October 13 th - 16 th , 2025, Bordeaux, France Title: Conferenc e Proceedings of the Inaugural Conference of the International Society for T ractography (IST Bordeaux 2025) IST 2025 Bordeaux - Scientific Organizing Committee Proceedings Editors: Flavio Dell’Acqua 1 , Maxime Descoteaux 2,3,4 , Graham Little 5 , Laurent Petit 4,6 Proceedings Reviewers: Dogu Baran A ydogan 7,8 , Stephanie Forkel 9,10,1 1,12 , Alexander Leemans 13 , Simona Schiavi 14 , Michel Thiebaut de Schotten 15,16 Affiliations: 1 Institute of Psychiatry , Psychology and Neuroscience, King's College London, London, United Kingdom 2 Computer Sciences Department, Université de Sherbrooke 3 Imeka Solutions Inc., Sherbrooke, Canada 4 IRP OpT eam, CNRS Biologie, France and Université de Sherbrooke, Canada 5 Jump Ship Labs, Edmonton, Canada 6 Université Bordeaux, CNRS, CEA, IMN, GIN, UMR 5293, F-33000, Bordeaux, France 7 Department of Neuroscience and Biomedical Engineering, and Advanced Magnetic Imaging Center , Aalto NeuroImaging, Aalto University School of Science, Espoo, Finland 8 A.I. Virtanen Institute for Molecular Science s, University of Eastern Finland, Kuopio, Finland 9 Donders Institute for Brain and Cognition Behaviour , Radboud University , Nijmegen, the Netherlands 10 Max Planck Institute for Psycholinguistics, Nijmegen, the Netherlands 1 1 Brain Connectivity and Behaviour Laboratory , Sorbonne Universities, Paris, France 12 Centre for Neuroimaging Sciences, Department of Neuroimaging, Institute of Psychiatry , Psychology and Neuroscience, King's College London, London, UK 13 Image Sciences Institute, University Medical Center Utrecht, Utrecht, Netherlands 14 ASG Superconductors S.p.A., Genoa, Italy 15 Groupe d’Imagerie Neurofonctionnelle, Institut des Maladies Neurodégénératives 5293, Centre National de la Recherche Scientifique (CNRS), University of Bordeaux, Bordeaux 33076, France 16 Brain Connectivity and Behaviour Laboratory , Sorbonne Universities, Paris 75006, France Description: This collection comprises the abstracts presented during poster , power pitch and oral sessions at the Inaugural Conference of the International Society for T ractography (IST Conference 2025), held in Bordeaux, France, from October 13-16, 2025. The con ference was designed to foster meaningful exchange and collaboration between disparate fields. The overall focus was on advancing research, innovation, and community in the common fields of interest: neuroanatomy , tractography methods and scientific/clinical applications of tractography . The included abstracts cover the latest advancements in tractography , Diffusion MRI, and related fields including new work on; neurological and psychiatric disorders, deep brain stimulation targeting, and brain development. This landmark event brought together world-leading ex perts to discuss critical challenges and chart the future direction of the field. Comments: Proceedings of the Inaugural Conference of the International Society f or T ractography (IST Conference 2025). Held at the Institut des Maladies Neurodégénératives in Bordeaux, France, October 13-16, 2025. Society website: www .tractography .io . T able of Contents Page Title First Author Last Author 1 The emergence of consciousness from the brain connectome Denis Le Bihan Denis Le Bihan 2 White-matter SEEG stimulation identifies a role for the IFOF in semantic control D Giampiccolo F Chowdhury 3 White Matter Microstructural Alterations in Y oung Heavy Alcohol Users: Evidence from 7T Diffusion Imaging of the Anterior Thalamic Radiation. Alan N. Francis Ihsan M. Salloum 4 Advanced reconstruction of white matter tracts in preterm neonates from clinical diffusion MRI data. Laurie Devisscher Jessica Dubois 5 Reduced White Matter Microstructure in Opiate Use Disorder: A Diffusion MRI Study Richard Nkrumah Gabriele Ende 6 Bimetric Invariants for Geodesic T ractometry and Machine Learning Luc Florack Rick Sengers 7 Normative T ract Profiles of White Matter Microstructure and Metabolite Ratios Along the Superior Longitudinal Fasciculus in Healthy Human Brain Archith Rajan Sanjeev Chawla 8 Cross-Species Cortical Parcellation via Homology Consensus Graph Representation Learning from Diffusion MRI T ractography Y azhe Zhai Y e Wu 9 Cross-species Standardised Cortico-Subcortical T ractography Stephania Assimopoulos Stamatios N Sotiropoulos 10 Spatial Pointwise Orientation T racking (SPOT): Resolving the spatial layout of fibre ODFs for super-resolution streamlining Saad Jbabdi Amy Howard 1 1 Estimating Brain Fibers via V olumetric Cortical Folding Deformation Generating fibers without diffusion data o r machine learning Besm Osman Maxime Chamberland 12 Limbic Network Microstructure and Macrostructural Changes in Children with ADHD: A Longitudinal Diffusion MRI Study Sila Genc Alison Wray 13 Integrating Jacobian Determinant and LDDMM for Evaluating White Matter Remodeling in MDD Patients Following SSRI T reatment Zhaoxian Ming Jiaolong Qin 14 Connectome-based consensus graph learning for fine-scale subcortical parcellation Zhonghua W an Y e Wu 15 Automated Mapping of Cranial Nerves Pathways in Human Brain: A Multi-Parametric Multi-Stage Diff usion T ractography Atlas Lei Xie Y uanjing Feng 16 Critical white matter tracts for bimanual motor skill learning: Exploring structural connectivity in acute stroke. Coralie van Ravestyna Y ves V andermeeren 17 ON-Harmony: A multi-site, multi-modal travelling-heads resource for brain MRI harmonisation with integration of UK Biobank scanners Shaun W arrington Stamatios N Sotiropoulos 18 Curvature properties on Estimating Asymmetric Fiber Orientation Distribution Mojtaba T aherkhani T im B. Dyrby 19 Quantifying the white matter pathways supporting written word production using tractometry Romi Sagi Michal Ben-Shachar 20 Estimating microscopy-informed fibre orientations from dMRI data in the UK Biobank Silei Zhu Amy F .D. Howard 21 A microscopy-trained model to predict super-resolution fibre orientations from diffusion MRI Silei Zhu Amy F .D. Howard 22 Superficial white matter association with cognitive decline using UKBiobank database (N=13747) Nabil Vindas Jean-François Mangin 23 Mapping the Superior Longitudinal System: anatomical insights from BraDiPho Laura V avassori Silvio Sarubbo 24 Sulcal morphology reflect the organization of short U-shape association fibers Arnaud Le T roter Olivier Coulon 25 Do current automated tractography methods hold up in tumour and epilepsy pathology? A comparison of six methods with expert manual tractography Steven Greenstein Joseph Y uan-Mou Y ang 26 MouseFlow , a pipeline for diffusion MRI processing and tractogram generation in mouse brain validated using Allen Brain Atlas Connectivity with m2m. Elise Cosenza Laurent Petit 27 Inferior Frontal Projections of the Arcuate Fasciculus T ractography in Broca's Area: V alidation against Direct Cortical Electrical stimulation Language Mapping performed in a Paediatric Epilepsy Surgery Case Joseph Y uan-Mou Y ang Wirginia Maixner 28 Exploring the macaque precentral gyral white matter using 1 1.7T dMRI Fanny Darrault Frédéric Andersson 29 Micro- and macrostructural fiber tract changes during pediatric posterior fossa tumor surgery . Pien E.J. Jellema Jannie P . Wijnen 30 Multicenter approach for validation of white matter tracts involved in cognition M.J.F . Landers G.J.M. Rutten 31 BundleParc: automatic bundle parcellation in tumor data Antoine Théberge François Rheault 32 Linking Continuous and Interrupted Human Central Sulcus to the V ariability of the Superficial White Matter using a β-V ariational AutoEncoder C. Mendoza J.-F . Mangin 33 Can a reduced diffusion MRI protocol achieve optic radiation tractography comparable to those reconstructed using a multi-shell diffusion MRI acquisition for temporal lobe epilepsy surgery planning and surgical image-guidance? Joseph Y uan-Mou Y ang Wirginia Maixner 34 Combining tractography and intracranial EEG to define the structural epileptic network Arash Sarshoghi Sami Obaid 35 Harmonizing Free W ater Metrics in Aging: A Comparative Study of Single-Shell and Multi-Shell Diffusion MRI Stanislas Thoumyre François Rheault 36 Mapping the structural connectome of temporal lobe epilepsy variants to improve surgical outcomes Emna Guibene Sami Obaid 37 Implicit Neural T ractography: Mapping White Matter in Continuous Space Ruben Vink Maxime Chamberland 38 Unveiling the functional specialization of human circuits with naturalistic stimuli Ovando-T ellez M. Michel Thiebaut de Schotten 39 Local Spherical Deconvolution (LSD) for T ractography of High-Resolution Diffusion MRI of Chimpanzee Brains A. Anwander C. Eichner 40 Robust pipeline to bring automated tractography into neurosurgical practice R. Bakker G.J.M. Rutten 41 nf-pediatric: A robust and age-adaptable end-to-end connectomics pipeline for pediatric diffusion MRI Anthony Gagnon Maxime Descoteaux 42 T ractography in the Developing Knee Joint at Microscopic Resolution Nian W ang Nian W ang 43 T ract morphing: A novel 3D mesh-based voxel-wise framework for multimodal white matter tract analysis Saludar C V Shim 44 T ract-Specific DKI Reveals Early White Matter Microstructure Alterations in Alzheimer's Disease Santiago Mezzano Catherine A Morgan 45 Mapping Reward Processing Circuits- Cortico-Striatal White Matter T racts and their Associations to Psychopathological T raits Santiago Mezzano Flavio Dell'acqua Acqua 46 High-resolution diffusion MRI and tractography in the in-vivo & ex-vivo non-human primate brain at 10.5T Mohamed Kotb Selim Stamatios N. Sotiropoulos 47 SBI Meets T ractography: A new approach for Bayesian inference in diffusion MRI models J.P . Manzano-Patrón Stamatios N. Sotiropoulos 48 A Deep Diffusion Model Approach for Dif fusion MRI White Matter Fiber T ractography Y ijie Li Fan Zhang 49 Deconstructing DTI-ALPS: Clarifying the biological interpretation in aging and cerebral small vessel diseases Ami T suchida Stephanie Debette 50 Supervised Learning for T ractogram Alignment Gabriele Amorosino Paolo Avesani 51 DeepDisco: A Deep Learning Framework for Rapid Brain Connectivity Estimation Anna Matsulevits Michel Thiebaut de Schotten 52 White matter bundle segmentation with deformation features in glioma patients Chiara Riccardi Paolo Avesani 53 Identifying the Microstructural Neurobiological Signature of Brain Lesions and Disconnected T issue Using the UK Biobank Anna Matsulevits Mallar Chakravarty 54 Diffusion MRI tractography to reduce risks of postoperative neurological deficits: A systematic review and meta-analysis Guido L. Guberman Sami Obaid 55 Surface-based T ractography uncovers 'What' and 'Where' Pathways in Prefrontal Cortex Marco Bedini Daniel Baldauf 56 GPU tractography: What can we learn from half a trillion streamlines? Y anis Aeschlimann Romain V eltz 57 A principled mathematical study of the limit of fiber tractography Samuel Deslauriers-Gauthier Romain V eltz 58 Unbiased tractogram density optimisation for robust estimation of white matter connectivity difference s Philip Pruckner Robert Smith 59 Intraoperative fast fibre tract segmentation in paediatric tumour patients Dana Kanel Jonathan D. Clayden 60 Integrating normative and patient models of tractography for accurate prognosis in human glioblastoma Joan Falcó-Roget Alberto Cacciola 61 Improving tractography reconstruction with asymmetric FOD tractography: preliminary evidence on the cortico-spinal tract Richard Stones Flavio Dell'Acqua 62 T ractography on Implicit Neural Representations of Diffusion MRI Sanna Persson Rodrigo Moreno 63 Connectivity Patterns across Bipolar Disorder Stages: a T ractography-based Graph Analysis Serena Capelli Annabella Di Giorgio 64 Predicting Facial Nerve Condition and Functional Outcome in Cerebellopontine Angle T umours Using MRI-Based Models Alberto Arrigoni Simonetta Gerevini 65 Assessment of Different T ractography Methods for Superficial White Matter Reconstruction Xi Zhu Fan Zhang 66 Structural connectivity-based individual parcellations using various tractography algorithms C. Langlet J.-F . Mangin 67 Using Large Language Models to Inform T ractography Elinor Thompson Daniel C. Alexander 68 T owards Whole-Brain T ractography of the Mouse from Serial Optical Coherence T omography Charles Poirier Maxime Descoteaux 69 Probing the clinical value of tractography reconstruction for glioma surgery Ludovico Coletta Silvio Sarubbo 70 Pre- versus postoperative tractography in patients with (supra)sellar tumors: correlations to optic pathway deformations and vision Andrey Zhylka Nico Sollmann 71 A comprehensive, high-resolution 7T atlas of structural brain connectivity in humans Hélène Lajous Patric Hagmann 72 Improved Riemannian FOD averaging for fiber bundle priors incorporation in FOD-based tractography algorithms G. Ville J. Coloigner 73 Multimodal Interactive White Matter Bundles Virt ual Dissection Garyfallidis E Paolo Avesani 74 Multi-compartment tractometry approach for white matter neuroinflammation investigation in late-life depression Nathan Decaux Julie Coloigner 75 An Atlas of the augmented Corticospinal tract Guillaume Mahey Bertrand Michel 76 Extracting tract-specific neurodegeneration by differentiating converging fibers using fixel-based analysis Lloyd Plumart Frans W . Cornelissen 77 Quantifying the Impact of Probabilistic Streamline T urning Angle on Brainstem-Inclusive Whole-Brain Connectomes Monica Duran Brittany T ravers 78 The Connectome Analysis for Pediatric Epilepsy Surgery (CAPES) Study: Leveraging Normative Disconnectome Mapping to Predict Seizure Outcomes Sudarsan Packirisamy Alexander G. Weil 79 SWM bundles segmentation using streamlines and voxel information in V AE latent space S. Navarrete P . Guevara 80 Nevrolens 2.0: Augmented Reality Atlas for Cross-Species Neuroanatomical Understanding Thanh P . Doan Ekaterina Prasolova-Førland 81 High-Resolution T ractography Shows Later Maturation of Superficial White Matter Across the Lifespan J. Urbina-Alarcón C Beaulieu 82 Structural Connectivity Mapping of the Central Amygdala Vinod Kumar Ivan de Araujo 83 Post-operative Clinical Outcome Is Not Correlated to Fronto-Striatal T ract Involvement by Dif fuse Gliomas of the Supplementary Motor Area: Preliminary Results Jahard Aliaga-Arias Francesco V ergani 84 T ractoSearch: a Faster Streamline Search for Scalable Etienne St-Onge Etienne St-Onge T ractography Analysis 85 Amount of white matter activation and microstructures explain depression recovery in subcallosal cingulate deep brain stimulation Ha Neul Song Helen S. Mayberg 86 Generation of synthetic data for validating tractography-based cortical parcellation and fiber clustering algorithms Elida Poo Pamela Guevara 87 Principal Component Analysis of Diffusion MRI and Magnetization T ransfer Metrics Reveals Distinct Lesion Microstructure in Multiple Sclerosis E. Hernandez- Gutierrez A. Ramirez- Manzanares 88 Hybridization Strategies for Robust Brain T ractography Jesús Martínez-Miranda Alonso Ramírez-Manzanar es 89 Clinical-ComBA T : T owards Flexible Harmonization of White Matter measures in Clinical Diffusion MRI Manon Edde Pierre-Marc Jodoin 90 V ariability of white matter activation pathways for connectomic targeting in subcallosal cingulate deep brain stimulation Ha Neul Song Ki Sueng Choi The emer g ence of c onsciousness from the brai n c onn ectom e Den is Le Bihan 1 1 Neuro S p in , CEA , Pa ri s - Sac la y U ni versi ty , Sa c l ay , Fra nc e Diusio n MRI , now a pil l a r o f m edic a l im a gin g , wa s intr od uced in 1985 1 , dem on stra ng h ow th e d i usiv e m o on of water mo lec ul es co uld be sp a ally en co ded with MRI to p ro du c e im a ges r evea ling th e un der lyin g str uctur e of bi olo gi cal ssu es on a micro sc op ic scale. A majo r su beld o f diusi on MR I ( Di usio n T en sor I magin g or D T I 2 ) ma k es it po ssib le to ob ta in no n- in va sively , fr om the an iso tro p i c mo vem ent of water mo lecules in the br a in's white ma er , 3 - dim ensio nal im a g es of th e cerebr a l c on necon s makin g up the Co nn ec tom e. DTI has o pen ed up new a venu es to invesg ate brain di seases , recentl y extend ing to p sychia try , revealin g ho w men ta l illn esses c ou ld be seen as diso rd ers of th e Con nectom e's sp ac eme , i n a n ew f ramewor k w h ic h mer ges stru c tur a l (ana tom ic al) c on n ecvity an d f un c on a l co nn ec vity between neu ral no des . Giv en tha t t her e is a nite limi t on the a con po tena l p rop aga on sp eed withi n the co nn ectom e, fu nco nal “ distan c es” between neu ral no des ( geo desics ) , th us, dep end on b oth the spaa l distances between n od es a nd th e me to pr op a g ate between them, th rou g h a relavisc c onnec tome spac e me with f ou r intr ica ted dim ensi o ns 3 . Neural no des ac t as “ masses” which, d epen din g o n th eir d egree o f acva on , “ c u rve” th e fu nco nal c on nect o m e sp a c eme a nd th e ow o f a con po tenals aro un d th em , a s f or gr a vity in the U niv erse . Notably , the p rop aga on sp ee d dep end s on a x on a l leng th: lon ger ber s c a rry faster sp eeds bec a use they a re su rro un ded by a th ic ker myel in shea th . I n pa ents in min imally c on sc io u s states t he den sity o f f un c on a l c o nn ec on s is kno wn to decrease, with the disap pearance of the sh ort ( slow) co nn ec o n s to the b enet of lo ng - rang e (f a st) co n n ec on s 4 . T hi s su g gests th a t c on sc io us a c vity mu st be associa te d with a slo w d own of the over a ll pr o paga o n sp eed, by mo bil izing sho rt rang e co n n ec on s, in a sim il ar wa y a gr av itao nal eld slows the speed o f lig ht a c co rdi ng to g ener a l rela vity . In sh or t, th e e qui valen t of the gra vitao nal e ld f or the co nnecto me must be c onsc iou sness , wh ich a p pears as both the so ur c e and the resu lt o f c o nn ec ted n eural a c tivity w ith in th e C o nn ec to me . Fo llo win g r ec ent develo p ment in th eorec a l ph ysics 5 , w e co nj ec tur e tha t the Con nectom e sho uld b e co n sider ed to ha ve ve dim ensi o n s , th e h d im ensi on allowin g the n atu ral, i mmateria l emerg ence of c on sc iou sn ess a s a d ual f or m of the 4D spac eme a c vity emb edd ed in o ur m aterial cereb ral c ortex 3 . T his cur va tur e ma y b e esma t e d from D T I (str uctur a l) an d rs - fMR I (f un c on a l) da ta , pr ovid in g a qu a nta ve an d d yn am ic sig na tu re o f c on sc io usn ess, a s sho wn in sub jects in di eren t stages o f sleep 6 . A dvanced d i usio n MRI meth od s and recent pr og ress in g radien t hard w are will fu rth er allo w to esm a te axon diameter s w ith in th e Con nectom e 7 , w hic h w i l l a ll ow maps of co n d ucon velo c ies to be ob ta in ed, w ith imp lic a on s to b eer un der sta nd p sychi a tric syn dr om es, su c h as in dep ressio n 3,8 and psy c ho c d isor der s 3,9 . REFER EN CES: 1. L e Bihan D, Br e ton E . Im age r ie de d i usion i n - vivo par r és onanc e m ag né que nuc léa ir e, C R A c ad Sc i (P aris) 301,15, 1109 - 1112,1985. 2. Bass er PJ , Mae llo J, L e Bihan D., MR Di usion T ensor Sp ec tr o sc o py and Im aging. Biop hys. J . 6 6 :2 5 9 - 267, 1994. 3. L e Bihan D. Fr o m b lac k h ole entr o py to consc iousness: The dime n sions of the b r ain connec tome . En tro p y 2023; 25: 1645. hps: //d oi.or g /1 0 .33 9 0 /e 2 5 1 2 1 6 45 ; Le Bihan D. Sc aling in t he b r ain. Brain Mulp h y sics . 2 0 2 4 ; 7: 1 0 0 1 0 2 . d o i: 10 .1 01 6 /j.br ain.2 02 4 .10 0 1 0 2 4. De me r tzi, A ., Ta g l i a z u c c h i , E . , Dehae ne, S., Dec o, Ge t al. Huma n Con sc io usness Is Supp or te d by Dynamic Co mple x P ae r ns o f Br ai n Signal Coordina o n. Sci. Ad v . 2019, 5 , eaat7 6 0 3 . 5. Maldac e n a, J. M. The Lar ge N L imit of Su per confor ma l Field Theories and Super gra vity . A d v. Th eo r . Ma th . P hys . 1 9 9 8 , 2 , 2 3 1 – 252. 6. Gilson, M.; T ag li azuc chi, E.; Cofre , R. Ent ropy produc on o f mulva r iate O r nste in - Uh l en b eck p rocess es co r relates wi th co n sci o u s n e s s le v e ls in the hu m an br ain. Ph ys. R ev . E 2023, 107 , 0 2 4 1 2 1 . 7. Huang SY , Tian Q , Fan Q , e t al. High -gra dient di usion MRI r eve als disnct es mat es o f ax on diam et er index within die r ent m aer tracts i n th e i n v i v o h u man b rai n . Br a in Str u ct Fu n c. 2020 M a y; 225(4) : 1277 - 1291. doi: 10 .1 00 7 /s0 0 4 29 - 019 - 01961 -2 8. Mulder s P C, v an Eijndhoven PF , Sche ne A H, Bec kma nn C F , T endolkar I. Re sng -sta te func o nal connec vity in ma jor depr essi v e disor der: A r evie w . Neu ro s ci . Bi o b e h a v Re v . 2 0 1 5 ; 5 6 : 3 3 0 - 444. 9. Be r k ov itc h, L. ; Ch arles, L. ; Del Cu l, A .; Ham n dani, N. ; De laves t, M.; Sarra zin, S.; Mangin, J. - F. ; G u e v a ra , P.; J i , E . ; d ’A l b i s , M . - A. ; e t a l . Disru pon o f c onscious ac c e ss in psychosis is ass ocia te d wit h alt er ed struct ural bra in connec vit y . J. Neuro sci. 2021, 41 , 5 1 3 – 523 . 1 White- matter SEEG s timulation identifies a role for the IFOF in semantic control D Giampiccolo1,2, N Li 3, A Granados4, L B inding1, E Jeffer ies 5, R Jackson5, A O’Keeffe1, V Litvak1, U V ivekananda1, N B ur ge ss1, F Xiao1, J Oliveira1, A McEvoy1,2, J Duncan1, B Diehl1#, A Miser occhi1,2#, F Chowdhury1# 1 U CL Q ueen Squar e IoN 2 National Hospital for Neur ology and Neurosur gery , Queen Squar e , London 3 Charit – Univers ittsmedizin Berlin, 4 King’ s C ollege London, London, UK 5 University of Y o rk Backgrou nd: W e rec ently pr oposed that the inferior fronto-occipital fasciculus (IFOF) would support multim oda l semantic c ontrol, 1 but this proposal has to be tested Met hods: We a dopted a nov el S EE G sti mulation technique wit h stable whit e matter c ontacts in 16 patients implanted (7 le ft, 2 bilater al, 7 r ight) for drug -re sistant epilepsy . Ea ch pa tient’ s I FOF wa s identified on native pre operative high-resolution tractography and tested with a multimodal neuropsychologica l battery . W e calculate d volume of tissue activated (VT A) for each stimulation site in the native space to c onfirm IFOF stimulation location in Lea dDBS. V T As we re the n normalised and use d for tract -wise two - sample t- test after permutation using a 760 μm ex-vivo normative connectome. Results: 56 c ontac ts pairs in the IFOF were t ested (4320 trails, 1429 with stimulation). IFOF stimul ation impaired picture naming (p <0.001), but also non-la nguage doma ins such a s visual sema ntics ( p <0.001), face -p erception (p <0.001) , tool use (p <0.001 ) , p er severations (p <0.001), hallucinations (p <0.001) within the same pair of c ontacts a nd among di f fe rent IFOF contacts i n the s ame p a tient. VT A an a lysis in Le adDBS confirme d a role of the IFOF and showed a graded dorso-ventral dif ferentiation its streamlines. Conclusion s: Using this novel, powe rful white matter sti mulation tec hnique, our re sults de monstrate that IFOF stimulation impacts multi mo da l se mantic control. Besides, SEEG white matter stimulation may represent a powerful technique to disentangle contri bution to func tion beyond language in both hemisphere s. References: 1. Giampiccolo D , H erbet G, Duffau H . T he inferior f ronto -occipital fasciculus: bridging phylogeny , ontogeny a nd functional anatomy . Brain . 2025. 2 Title: White Matter Microstructural Alterations in Y oung Heavy Alcohol Users: Evidence from 7T Diffusion Imaging of the Anterior Thalamic Radiation. Authors: Alan N. Francis, PhD; Ihsan M. Salloum, MD, MPH Department of Neuroscience, School of Medicine, University of Texas Rio Grande Valley Abstract Background: Adolescence and young adulthood are critical periods of neurodevelopment during which alcohol use may exert long-lasting effects on brain structure and function. Diffusion tensor imaging (DTI) enables assessment of white matter microstructural integrity through metrics such as fractional anisotropy (FA) and radial diffusivity (RD), which provide insights into axonal organization and myelination. Methods: This study examined white matter alterations in heavy alcohol users compared to light users using ultra-high-field 7 Tesla DTI data from the Human Connectome Project. Twenty-four heavy alcohol users were matched to Twenty-four light users based on age and sex. TRACULA (TRActs Constrained by UnderLying Anatomy) was employed to reconstruct major white matter tracts. Probabilistic tractographic analyses focused on the bilateral anterior thalamic radiation (ATR), a pathway implicated in executive function and cognitive control. Results: Heavy alcohol users exhibited significantly higher FA in the left ATR compared to light users (p = 0.033), alongside significantly lower RD in the same region (p = 0.017). These findings suggest altered white matter microstructure, potentially reflecting aberrant myelination or compensatory reorganization in response to alcohol- related neurotoxicity. Conclusions: The observed microstructural alterations in the left ATR may represent early biomarkers of alcohol-induced neuroadaptation, with potential implications for cognitive functioning. These results underscore the vulnerability of developing white matter to the effects of heavy alcohol use and highlight the need for early intervention. Future longitudinal studies are warranted to assess the functional consequences of these alterations and their potential reversibility with sustained abstinence. 3 Title: Advanced reconstruction of white matter tracts in preterm neonates from clinical diffusion MRI data. Authors and Affiliations: Laurie Devisscher 1,2,3 , Yann Leprince 2 , Nicolas Elbaz 4 , Chloé Ghozland 5 , Parvaneh Adibpour 1,2 , Catherine Chiron 1,2 , Sara Neumane 1,2 , Aline Gonzalez-Carpinteiro 1,2 , Lucie Hertz-Pannier 1,2 , Marianne Barbu-Roth 3 , Alice Heneau 5 , Valérie Biran 1,5 , Marianne Alison 1,4 , Jessica Dubois 1,2 1.Université Paris-Cité, INSERM, NeuroDiderot, F-75019 Paris, France 2.Université Paris-Saclay, C EA, NeuroSpin, UNIACT, F-91191 Gif-sur-Yvette, France 3.Université Paris-Cité, CNRS, Integrative Neuroscience and Cognition Center, F-75005 Paris, France 4.Assistance Publique-Hôpitaux de Paris - APHP, Robert- Debré Hospital, Department of Pediatric Radiology, F-75019 Paris, France 5.Assistance Publique-Hôpitaux de Paris - APHP, Robert-Debré Hospital, N eonatal Intensive Care Unit, F-75019 Par is, France Introduction: Our study aims to develop a robust pipeline with diffusion MRI (dMRI) and tractography to automatically extract a wide range of white matter bundles in the whole brain of p reterm infants at term equivalent age with anatomical particularities such as cerebral lesions, increased volumes of cerebral ventricles and extracerebral cerebrospinal fluid (CSF). As a first step, we here focused on sensory and motor tracts (cortico-spinal tract, CST) to characterize the developing mi c rostructural properties. Methods: We collected and analyzed 3T-MRI c linical data of 105 very and extremely preterm b abies (gestational age at b irth: 24-32 weeks), scanned at term equivalent age (38-43 weeks of post-men strual age–wPMA). We used the baby-XTRACT tool implemented in FSL that provides tractography protocols for mapping 42 white matter bundles (19 bilateral and 4 central tracts) defining seeding, stop and e xclusion regions on the Schuh neonatal template [3]. A key point of this study was to obtain a robust registration of individual images to the template despite the brain anatomical specificities of our population. We optimized this registration by creating brain masks from a combination of iBEAT and drawEM segmentations [4][5] of super-resolved T2w images (0.8mm is otropic,obtained with NiftyMIC[6]), which enabled us to remove part of the CSF. Individual dMRI images w ithout diffusion weighting (b=0) were then coregistered to T2- weighted images, which were themselves registered to the template [7]. The registrations were conducted using Ants 2.5.3 with finely tuned parameters. Besides, following the pre-processing of dMRI data (b=1000 s/mm 2 with 42 directions), multiple fibre orientations w ere estimated with BEDPOSTX w ith a two fibres model [8]. Tractography was performed with PROBTRACKX through the baby-XTRACT framework and tract reconstructions were visually checked for the CST. Maps of d iffusion tensor imaging (DTI) metrics were estimated, allowing u s to compute the tract-density-weighted averages of m etrics in the CST. To further evaluate the appr o ach robustness, we assessed th e correlation between metrics and PMA at sca n. Results: Despite a wide range of b rain anatomical features, we were able to a chieve optimal registration for all infants (Figure a) as well as correct CST reconstructions (Figure b). The exploration of CST microstructure confirmed a decrease of mean, axial and radial diffusivities with PMA at scan, a s well as an increase in fractional anisotrop y (Figure c).Residual inter-individual variabilit y might rely on other factors. Conclusion: This study provides a proof of c oncept for applying the ba by-XTRACT tool to clinical diffusion MRI data in very preterm infants with cerebral inju ry. T his approach allowed us to obtain accurate extraction of the CST and will be generalized to other white m atter tracts. By characterizing the tract microstructural p roperties, we w ill explore the effects of several clinical factors beyond PMA at scan (e.g., ges tational age at birth, respiratory, digestive and infection complications, brain severity score proposed by Kidokoro et al [9]) . This approach will also be applied to MRI data collected at 2 months o f c orrected age in a subgroup of 39 b abies with longitudinal data to evaluate the effect of an e a rly motor training [10]. [1]de Kieviet et al. JAMA 2009 [2]Ouyang et al. Neuroimage 2019 [3] Warrington et al. Sci Adv 2022 [4]Makropoulos et al. I EEE Transactions on Med. Imaging 2014 [5]Wang et al. N at Protoc 2023 [6]Ebner et al. NeuroImage 2020 [7]Schuh et al. BioRxiv 2018 [8]Hernández et al. PLoS One 2013 [9] Kidokoro et al. AJNR 2013 [10]Dumuids-Vernet et al. Frontiers in pediatrics 2023 4 Reduced Wh ite Ma er Micros tructure in Opiate Use Disorde r: A Diusion MRI Study Richard Nkru mah 1 , Lea W etz el 2 , Jusn Böh mer 3 , Ka tharina Eidenmüller 2 , W o lf gang Somm er 2,4 , Hendrik W alter 3 , Gabriele End e 1 1 Departmen t of Neuroimaging, Cent ral In st ute of Ment al Health, Heidel berg Univ ersity , Germany 2 Departmen t of Addicve Beha vior & Addicon Medi c ine, Cent ral In stute of M ental Health, Hei de lber g Univer s ity , Germany 3 Departmen t of Psy chiatry and Ps ychother apy , Charité – Univ ersitätsmedizin Berlin, Germany 4 Departmen t of Psy chopharmacology , Centr al Instute o f Mental Health, Heidelberg Univ ersity , Germany Introd ucon: Subst ance use disorder s (SUD), parcularly in volving opiat es, cann abis, and nicone, are associat ed with widespre ad white maer (WM) alter aons that may underlie cognive and beha vioral dysfu ncons 1 . T radional diusion tensor imaging (DTI) provides insight int o gener al WM micros tructure but is limit ed in re so lving cros sing bers. Fix el - based analysis (FBA), an adv anced tractogr aphy - based method, o ers higher specicity by quanfying bre density (FD), br e cross - secon (FC), and their product (FDC), enabling a mor e accur ate a sses sment of white ma er pa tho logy 2 . Metho ds: Parcipan ts = 143 adults (Contr ols = 51, Opiate = 17, Cannabis = 51, Nicone = 24), recruite d across two sites (Berlin and Mannheim). All substan ce users met DSM - 5 criter ia for addicon. Imaging & Analysis: Diusion - weight ed imaging acquir ed using single - shot spin - echo EPI sequence with the f ollowing par ameters: TR/TE=3200 / 63ms, matrix = 110 × 110, 72 slices, 2 × 2 × 2mm 3 and 60 direcons with a b valu e of 100 0 s/mm 2 and processed using M Rtrix 3 . Measures: DTI= Fr aconal Anisotropy (F A) & Mean Diusivity (MD) . FBA= FD, FC & FDC . Sta scs: Independent t - tes ts comparing each user group to contr ols, adjusn g for age, se x, and site. FWE co rrecon using thresh o ld - free clus ter enhancemen t (TFCE) with p < 0.05. Results: DTI and FBA r esults highlighn g reduced F A, increased MD, and decr eased FDC in opia te users. Conclus ion s: T r actograp h y - based F BA rev eal that opiate use is associat ed with the most extensiv e WM micro - and m acros tructur al altera ons, par cularly in tracts supporng memory and emoon regulaon (e.g., fornix ) 4 . Cannabis and nicone use show more localiz ed changes 5 . These ndings highligh t the potential clinical ulity of advan ced tr actograph y techniques like FBA in idenfying subst ance - specic brain altera ons, potenall y inf orming tailor ed interv enons and subst ance - specic biomark er dev elopment i n SUD . Re ferenc es 1. H ampt on WH et al. (2019). Subst ance abuse and whit e maer: Findi ngs, limita ons, and future of D TI researc h. 2. Raelt D A et al. (2017). Inv esga ng whit e maer bre density and morph ology using x el - based analysi s.. 3. T ournier , J. D., et al. ( 2019). MRtri x3: A fast , exi ble and open sowar e framework f or medical i m age proc essing and visual isaon. 4. Wollman SC et al. (2015). White ma er abnor malies in her oin users: A meta - analy sis. 5. C ourtney KE et al. (2022). Can nabis a nd nicone co - use d u ring adolesce n ce aec ts WM integrity . Reduced bre densi ty and cross - secon in le fornix in opiate users co mpared to healthy controls. No signican t results were foun d for either FD or FC measu res in opiate users , nor between cannabis or nicone users and healthy controls. Dierences betwee n substance users an d healthy control in D TI measures. AF: Arcuate fasciculus, AT: Anterior thalamic rad iaon, ST: Sup e rior thalamic radiaon, CS T: Corcal spinal trac t, MLF: Middle Longitudinal Fascicu lus, Cin: Cingulum, S LF: Superior longitu dinal fasciculus, UF: Uncina te fasciculus, R: right Opiate Users: DTI: Signicantly reduced FA and increased MD across mul ple WM tracts (e.g., corcospinal tract, arcuate fasciculus). FBA: Signicant reducon in FDC in the le fornix, indicang disrupted limbic connecvity. Cannabis Users: Red uced FA in the middle longitudinal fas ciculus (MLF), suggesng localized WM alteraons. Nicone Users: Increased MD in the corcospinal tract, possibly reecng demyelinaon or reduced axonal packing. 5 Bimetric In variants f or Geodesic T ractometry and Machine Learning †‡ Luc Florack, Rick Sengers, Eindhov en University of T echnology , The Netherlands Introduction. Unlike streamline tractography , geodesic tractography [1, 2] must contend with the implications of the Hopf-Rinow theorem, which states that any two points in the brain can be geodesically connected. This requires additional criteria to distinguish anatomically plausible tracts from arbitrary geodesics. Specification of two side conditions will single out one (or at best a fe w) candidate(s), but this in itself begs the question of anatomical validity [3]. Giv en a candidate tract, we would therefore like to assess its anatomical plausibility . Complete systems of bimetric tractometric invariants provide data driv en evidence for this purpose. By integration with pattern recognition or machine learning trained on expert feedback, geodesic redundancy enables optimization of specificity without loss of sensitivity . Theory . A tractometric in variant of a putativ e tract ω is a functional ε ( ω ) → R independent of curve parameterization and spatial coordinates. Completeness of a system of inv ariants entails that all data evidence is accounted for giv en some symmetry constraint. The system is said to be irreducible if there are no mutual dependencies among its elements. It is notoriously hard to construct such systems in general [4], but some simple known instances are rele vant for our purpose. Application. W e focus on global inv ariants assigned to an entire tract, and impose the constraint that only zeroth order data confined to the tract’ s spatial locus are admitted. A trivial example is the complete irreducible system { ε i ( ω ) = ϑ i ( D ) } i =1 , 2 , 3 of DTI eigenv alue averages ϑ i ( D ) along a tract, which is equivalent to the set of DTI power traces { ϖ i ( ω ) = tr D i } i =1 , 2 , 3 (‘polynomial in variants’). Completeness implies that DTI matrix powers D k for k ↑ 4 play no role (Cayley-Hamilton). Adding curve orientation requires an extension of this system with 2 additional inv ariants. T o construct polynomial inv ariants there is a simple visual ‘diagrammar’, with the following elements: Diagrammar . ϱ ij is the Euclidean metric, with dual ϱ ij (identity matrices in Cartesian coordinates); D ij is the DTI tensor , with inv erse D ij (acting as a space curving metric for geodesic tractography); v i is the geodesic unit tangent; endpoints • and ↓ symbolize free indices that may be connected (‘contraction’) and thereby resolved. Consecutive labels ↔ and ↗ annihilate pairwise. These rules make it easy to construct in variants, viz. any closed diagram (without dangling • or ↓ ) is a polynomial inv ariant, vice versa. The ‘tadpole’ diagram for the tangent vector v i has only one free index and could be replaced by the dyadic tensor v i v j without loss of generality (with some superficial diagrammatic consequences). Example. A complete irreducible system of global tractometric in variants based on lowest order DTI data and tract orientation is shown below . Replacing ↔ by ↗ yields an equiv alent system. T rivial inv ariants hav e been omitted. The diagrams are insightful pictures corresponding to algebraic expressions. A simple, unsupervised and spatially unbiased clustering of the 3 -dimensional scatter plot of the three loop diagram features only (equiv alent to the DTI eigenv alue av erages along tracts), ignoring the interplay with tract orientation, is consistent with the neuroanatomical branching of the CST into medial and lateral sub- bundles. The example also shows the idea of pruning using pattern recognition or machine learning algorithms, in this case an unsupervised isolation forest algorithm, increasing the internal micro-structural coherence by removing anomalous tracts (per cluster). Interestingly coherence outliers tend to be spatial outliers, despite the fact that no spatial information is encoded in our tractometric in variants (e.g., no exclude re gions have been used in the CST figure belo w). Conclusion. Geodesics are optimal-diffusion paths and as such form a natural yet highly redundant set of primitives for tractography . Anatomically plausible geodesics (‘true positives’) require disambiguating criteria in terms of meaningful tractometric inv ariants in a necessarily bimetric setting. Completeness ensures that, under specified symmetries, no information is a priori discarded. W e have sketched the idea by constructing a small yet potentially powerful irreducible system to feed pattern recognition and machine learning methods for anatomical specificity . This system can be enriched with additional global inv ariants, or generalized to include local in variants, at a concomitant computational price. [1] L. Florack and R. Sengers, “High-angular resolution diffusion tensor imaging: Physical foundation and geometric frame work, ” F rontiers in Physics , vol. 12, 2024. [2] L. Florack, R. Sengers, and A. Fuster , “Geodesic tractography , ” in Handbook of Diffusion MR Tr actography: Ima ging Methods, Biophysical Models, Algorithms and Applications (F . Dell’Acqua, M. Descoteaux, and A. Leemans, eds.), ch. 15, pp. 275–295, Elsevier , 2025. [3] K. G. Schilling et al. , “Brain connections deriv ed from diffusion MRI tractography can be highly anatomically accurate—if we know where white matter pathways start, where they end, and where the y do not go, ” Brain Structur e and Function , vol. 225, pp. 2387–2402, 2020. [4] P . J. Olver , Classical Invariant Theory , v ol. 44 of London Mathematical Society Student T exts . Cambridge: Cambridge University Press, 1999. † International Society for Tractograph y: Inaugural Conference, October 13–16, 2025, Centre Broca, Bordeaux, France. ‡ This publication is part of the project Bringing T ractography into Daily Neurosurgical Practice with the project number KICH1. ST03.21.004 of the research program Key Enabling T echnologies for Minimally Invasi ve Interventions in Healthcare, which is (partly) financed by the Dutch Research Council (NWO). Elisabeth-T weeSteden Hospital (T ilburg), Erasmus Medical Center (Rotterdam), Amsterdam Univ ersity Medical Center (Amsterdam) and Medtronic are gratefully acknowledged for their support. 6 Normative Tract Profiles of White Matter Microstructure and Metabolite Ratios Along the Superior Longitudinal Fasciculus in Healthy Human Brain Archith Rajan 1 , Sourav Bhadur i 2 , Subhanon Bera 2 , Laiz Laura d e Godoy 1 , Mauro Hana o ka 1 , Sulaiman S h eriff 3 , Suyash Mohan 1 , and Sanjee v Chawla 1 1 Department of R a diology, Univer sity of Penns ylvania, Philadelph i a, PA, United St ates, 2 Institute for A d vancing I n telligence (IAI ), TCG CREST, K olkata, India, 3 Department of R a diology, Univ ersity of Miami, M iami, FL, Unit ed States, Purpose: Superior longitudinal fasciculus (SLF) i s the lar g est associatio n tract in the brai n. The SLF is critical i n multiple normal functions like cognition , visuospatial attention and memory , and its micr o structural inte grity is known to b e compromised in several neur o psychologica l conditions [ 1]. Several stu dies have also reporte d significant metab o lite alterations i n several neurolo gical and neuropsychiatric d isorders incl u ding schizophrenia [2] . Despite documen ting significant d i ffe rences in dif fu sion MRI derived param eters between normal contro l s and schizophrenia pa tients, no signif i cant differ ences in metabolite patter ns from brain reg i ons encompassi ng SLF were observed b etween two gro ups in a study [3] . This might be due to the fact that conve ntional proton M R spectroscopy (1H-M RS) and diffusion MRI ( dMRI) voxels were not co-registere d together . W ith this limitation in mind, this metho dological study was de signed ( i) to overlay metabolite maps o n SLF-I and II s e gments (ii) to assess the metabolite distri b ution along th e path of SLF-I an d II segments across v arious regions an d (iii) to eval u ate the relationships am ong metabolite r a tios and ( d MRI) derived parameters from these segments in normal heal thy adults. Methods: Ana tomical images, WBSI and high angular resolution di ff u sion i maging (HARDI) sequences were acquired from 10 healthy normal adults (age: 33.67 ± 2 .52 years; 7M/3F) on a 3T MRI scanner . T o evaluate the intrasubject variability , one subject underwent MRI scans three t imes. The preprocessing pipeline is illustrated in Figure 1 . T he WBSI data were analyzed using MIDAS package with the standard processing st eps [4]. Quality assurance was evaluated by considering Cramer-Rao lower bounds (<20%), line shape, line width (2-12Hz), C SF contamination, and d e gree of residual water and lipid signals. Parametric m aps of choline (C ho) / N- acetylaspartate (N AA) and choline (Cho) / c reatine (Cr) were computed. Subsequently , only those voxels in the maps that had greater than 50% pr o bability o f w hite matter tissue w ere retained for further analysis. A three-shell diffusion imaging protocol with b-values of 3 00, 800 and 200 0 s/mm 2 and a total of 109 unique diffusion encoding directio n s, with 9 interspersed b 0 images, was used to generate neurite o rientatio n dispersion density imaging (NODDI) derived in tra-cellular volume fraction (ficvf), i sotropic volum e fraction (fiso) and orientation density index (ODI) an d d iff usion te n sor i maging (DTI) d erived mean diff u sivity (MD) and fractional aniso tropy (F A) maps. The whole brain tractograms were generated and an automated tool [5] wa s used to d elineate t h e segme nt s I a nd II of SLF . White matter ma p s of Cho/Cr and Cho/NAA were then co-registered to non-diff u sion weighted (b 0 ) image using the W a ter signal intensity maps. The SLF I and II segments were divided into 20 anatomically distinct sections and section-wise mean values of parameters (MD, F A, ficvf, fiso, ODI, Cho/NAA and Cho/Cr) for each tract pro file were computed [6] from all the subjects. Repeatability was determined by calculatin g the coefficients of v ariation (CVs), intra-classcorrelation (ICC), and repeatability coe ffi c ient (RC) of WBSI and dMRI de rived parameters for each SLF segments. T o assess the covariance between microstructural and metabolite metrics, mixed effect linear models were assessed, with WB SI par ameters as the depe ndent variable for mean tract pr o files from 1 0 subjects. The significa n ce level was set at p<0.01. Results: T h e white matter metaboli t e maps of Cho/NAA and Cho/Cr were successfully overlai d over SLF segme nts I and II in all cases. Repeatabili t y analyses revealed the intra-subject CVs in the acceptable range o f 0.8% (ficvf: SLF I right) to 13.36% (Cho/NAA: SLF II right). Metabolite measures from the SLF-I right were the most reliable (ICC: 0.944 a n d 0.845; CV : 0.023 and 0.032; RC: 0.33 and 0.20 for Cho/Cr and Cho/NAA respectively). The mean inter -subject CVs across the sections of trac t profiles were in the range of 3.2% (MD: SLF I right) to 23.1% (fiso: SLF II left). Strong linear associations were observed between the tract profiles of the metabolite ratio maps and the corresponding tract profiles o f dMRI parameter maps, with the model including all t he d MRI parameters showing a consistent association for the segments SLF I ri g ht, SLF II right and SLF II left: Cho/NAA ~ f (1 + ODI + fis o + ficvf + F A + MD) Adjusted R 2 = 0.953, 0.954, 0 .818, 0.81 1 for SLF I right, SLF I l eft, SLF II rig ht and SLF II left respectivel y Cho/Cr ~ f ( 1 + ODI + fiso + ficvf + F A + MD) Adjusted R 2 = 0.968, 0.945, 0 . 965, 0.804 for SLF I r ight, SLF I left, SLF II right and SLF II left respectivel y Discussion and Conclusion: Our findings may b e u seful for simultaneo u sly assessing metabolite alterations and white matter microstructure of SLF-I and II segments under multiple pathological condition s. The proposed approach may allow more ob j ective and unbiased assessmen t of re gional metabol ite patterns along the path of SLF as opposed to the conventional single and multi-voxel MR spectroscopy methods of placing distinct large voxels along a specific section o f the tract. Our study is smal l and cross-sectiona l involving only ten normal healthy individuals and wou ld require further validation in larger cohorts. Such multi-parametric normative tract profiles of white matter m i crostructure a n d metabolism could serve as the basis for earl y detection of neurodegenerati on in various pathologies. References: [ 1] Xu F . , et al. (2022). Frontiers in Psychiatry , 13, 9 99384,[2] Hardy C., et al. (201 1 ). R adiology , 261(2), 542-550., [3] Rowland L. M ., et al. (2009). Neuropsychopharm acolog y , 34(6), 15 1 4-1522., [4] Maudsley A. A., et a l. (2006). NMR in Biomedi c ine, 19(4) , 492-503., [5]W asserthal J ., et a l.(2018). Neu roimage, 183 (2018): 239-253. [ 6] Chamberland M ., et al. (2019). N e uroImage, 20 0 , 89-100 Figure 1: Overview of the image processing pipeline to generate along tract profiles 7 Cr oss-Species Cortical Par cellation via Homology Consensus Graph Repr esentation Learning from Diffusion MRI T ractography Y azhe Zhai 1 , Y ifei He 1 , Jiaolong Qin 1 , Fan Zhang 2 , and Y e Wu 1 ,* 1 School of Computer Science and T echnology , Nanjing University of Science and T echnology , Nanjing, China 2 School of Information and Communication Engineering, University of Electronic Science and T echnology of China, Chengdu, China Introduction Cross-species cortical parcellation seeks to identify conserved brain regions by analyzing human and macaque brains together[1]. However, accurate alignment is challenging due to differences in cortical folding and anatomy[2]. W e propose a two-stage clustering framework that combines structural and geometric connectivity to better identify homologous parcels while maintaining species-specific features. Methods W e group cortical vertices into super-vertice s by minimizing a weighted sum of geodesic and feature-space distances for consistency across species. Next, we create a vertex-cluster matrix by mapping streamline endpoints to cortical vertices and a vertex-atlas matrix by aggregating overlaps with the XTRACT atlas [3]. These form multi-view graphs optimized through low-rank tensor learning to create a shared low-dimensional embedding. Finally , we apply spectral clustering and align human and macaque parcels using pairwise matching via the Dice coefficient. Fig.1 The pipeline of our method and results. Results Our framework consistently produced biologically meaningful parcellations across a range of cluster counts, with optimal balance at 20–30 parcels. When benchmarked against established atlases (Y eo [4], Schaefer[5], Glasser [6]) and ablations using only vertex–cluster or vertex–tract features, our two-stage method achieved superior homogeneity in both species. Cross-species alignment, quantified by a novel Mapping Consistency Index against Brodmann, B05, and Markov references, alignment by Xu et al. [7], exceeded 0.85 for humans to macaque and 0.75 for macaque to humans in 20 parcels. Conclusion W e present a two-stage framework for cross-species cortical parcellation that combines geometric and connectivity features. W e use multimodal fusion and low-rank tensor learning to identify homologous regions. References 1. Eichert, N., et al.: Cross-species cortical alignment identifies different types of anatomical reorganization in the primate te mporal lobe. eLife 9, e53232 (2020). 2. V an Essen, D., C., et al.: Cerebral cortical folding, parcellation, and connectivity in humans, nonhuman primates, and mice. Proc. Natl. Acad. Sci. 1 16, 26173–26180 (2019). 3. W arrington, S., et al.: XTRACT - Standardised protocols for automated tractography in the human and macaque brain. NeuroImage 217, 1 16923 (2020). 4. Thomas Y eo, B., T ., et al.: The organization of the human cere bral cortex estimated by intrinsic functional connectivity . J. Neurophysiol. 106, 1 125–1165 (201 1). 5. Schaefer, A., et al.: Local-Global Parcellation of the Human Cerebral Cortex from Intrinsic Functional Connecti vity MRI. Cereb. Cortex 28, 3095–31 14 (2018). 6. Glasser, M ., F ., et al.: A multi-modal parcellation of human cerebral cortex. Nature 536, 171–178 (2016). 7. Xu, T ., et al.: Cross-species functional alignment reveals evolutionary hierarchy within the connectome. NeuroImage 223, 117346 (2020). 8 Cro ss-species St andardised C ortico-Subcortical T ractography Steph ania Assim opoulos 1 , Shau n W arrington 1 , Dav ide F ollon i 2 , Kath erine Brya nt 3 , W ei T ang 4 , Saad Jbabdi 5 , Sara h Heilbron ner 6 , Rog ier B Mars 5 , Stam atios N S otirop oulos 1 1 Sir Pete r Mansfi eld Imag ing Cen tr e, Schoo l of Med icine, Un iversity of Nottin gham, U K; 2 Nash Fa mily De partment of Neuroscience and Frie dman Br ain Institute , Icahn S chool o f Medicin e at Mo unt Sina i, New Y ork, NY , USA; 3 Centre de Recherche en Ps ychologi e et Neu r o sciences , UMR 7 077, CN RS/Univ ersité Aix-Mar seille, F rance; 4 Luddy S chool of Informat ics, Com puting a nd Engin eering, I ndiana U niversity Bloomi ngton, IN , USA ; 5 Oxford Centre for Integrat ive Neuroimaging, U niversity of Oxfo r d , UK; 6 Baylor C ollege o f Medici ne, Hous ton, TX, USA. Intr oduction: White matter (WM) bundles connecting cortical areas with subcortical nuclei are crucial for relaying and modula ting cortical function [1]. Their disruption is linke d to abnormal function and pathology in neur odegen erative and mental health (MH) disorder s [ 2,3]. Diffusio n MRI (dMRI) and tractography enable exploration and reconstructio n of such WM bundles [4], b ut their r elative size, the complexity and assoc iated bottlen ecks, make their estim ation chal lenging [5]. As a result, cortico- subcorti cal WM tracts are under -represented in dM RI tractogr aphy studies. Here, we introduce a se t of standardised tractography protocol s for delineating tracts between the cortex and various deep subcortic al struct ures, including the caudate, putamen , amygda la, thalamus and hippocamp us. Our protocols were first devised in the macaque brain, guided by chemical tracer literatur e, and then extended to the human. W e assessed the tract reconstru ctions against tracer studies patterns and their robustne ss to data quality . W e subsequently incorporated these protocols into a common space framework [6,7] to assess their eff icacy in connectivity-ba sed cross-sp ecies predic tion of homologo us cortical structure s and subcortica l nuclei. Method s: W e built upon our pre vious cross-spec ies tractog raphy fra mework (FSL-XT RACT [8]). Using prior anatomical knowle dge from macaque tracers, we defined new generalisable p rotocols i n templa te space fo r the amyg dalofugal tract (AMF), the M uratoff bundle (MB) and the striatal bundle (StB) (e xternal ca psule) for its frontal, sensorim otor , tempora l and parietal parts, adding to our previous protocol s for hippocam pal and thalamic tracts [8]. Due to their close proximity , we also d evelope d new pr otocols f or the respective extreme capsule (E mC) parts (frontal, temporal, parietal) and revised previously protocols for the uncinate fascicul us (UF), the anterior commissur e (AC) and the fornix (FX). Each protoco l includes a unique combination of seed, target, waypoin t, exclusion masks, delin eated in standard macaqu e space (F99), and then correspo ndingly d efined in human s tandard (MNI) space. Using dMRI data from 6 ex- vivo rhesus macaqu e brains [6] (from PRIME- DE) and 50 HCP subjects [9], we performed tractogr aphy in human and ma caque. Results: Trac tography recon struction s are shown in Fig 1. These we re tes ted for robustne ss against data quality (HCP & UK Biobank data in the human) and temp late spaces (F99 & NMT in the macaqu e) – results not shown. Subs equently , we ensured that reconst ructed tracts follow principle s known from tracers in the macaque and how these translate to humans (Fig. 2). Fig. 2A demonst rates how white matter relative spatial org anisation is preser ved betwee n the recon structed bundles. Fig. 2B shows how differe nt cortical areas connect to the putamen, as revealed by tracer injectio ns (from super ior to inferior: more connect ions to parietal, sensorimoto r, frontal and temporal ). T ractography of the StB parts reveals similar patterns in the putamen, both for the macaque and the human. Lastly , we used these species- matched tractogra phy protocols (new & origin al XTRA CT [8] – 59 tracts in total) to map homologous grey matter regions in humans and macaqu es. Fig. 3A shows how similar frontal cortical regions across macaqu es and humans connect similarly to the same set of bundle s (blue and orange polar plots, respect ively). The similarity of su ch tractogr aphy patter ns can therefo re be used to identify homologou s regions between species [6, 7]. Fig. 3B demonstrat es maps of (dis)sim ilarity (KL diverg ence) between tractography patterns across the whole macaque/hum an corte x, when neighbouring seed frontal regions are selected in the human (first column) /macaque (second column) (dmPFC & vmPFC , OFC & FOp). Predictability of these regions based solely on their tractogr aphy pa tterns ag rees well with referen ce atlas bounda ries, show ing the richnes s of info rmation these p atterns convey . Conclus ion: Bui lding upon our pre vious wo rk on FSL-XTRAC T [ 6, 8, 10], w e introd uced standardised protoco ls for auto mated cortico- subcorti cal tractography in the macaque and human brain. W e demonstrate the robustness of the reconstructed patterns against t racers and their value i n mappi ng homo logous grey ma tter regions acr oss speci es. Refer ences : [1 ] Haber SN. Dialogues Clin Neurosci 18:7–21, 2016 . [2] Heller AS. Front Syst Neurosc i 2016. [3] W eerase kera A, Psych iatry Res Neuroim aging 340:11 18 06, 2 024. [4] J babdi S, N at N eurosci 11:1546–55, 2015. [5] Catani M, Neuro Image 17:77– 94, 2002. [6] Mars RB, eLife 7:1–15 , 201 8. [7] W arri ngton S, Sci Adv . 8:eabq2022, 202 2. [8] W arr ington S, NeuroIm age 217:116923, 20 20. [9] V a n Essen DC, N euroIma ge 80:62– 79, 2013 . [10] Assimop oulos S , Brain S tructure and Fun ction 202 4. StB t Em C t StB p Em C p Em C f StB f MB MB Em C t Em C p Em C f StB t StB p StB f StB m MB UF AM F AC StB m MB UF AM F AC Ma caqu e Hu man F i g u r e 1 Figure 1: Cross-species cortico- subcortical tractography. Figure 2: (A) Rel ative spatial organisation of WM bundles is preserv ed with tra ctography, follow ing patterns of tracers. (B) Connectivit y patterns between different cortical ar eas (parietal, sensorimotor, front al, temporal) and the p u tamen as found with tractography, are in agreement with tracer patterns. Macaque Tractography Tempo ral Fronta l Sensor imotor Parieta l Sen s Mo t Fro nt Par Te mp Human Tractography High (path probability) Low (path probability) Macaque Tracers B Macaque Tractography Human Tractography Macaque Tracers MB Fron tal StB/ EC Fron tal EmC MB Fron tal StB/ EC Fron tal EmC # 2 EC EmC MB AMF AC AM F AC UF AM F AC UF A Figure 3: (A) P atterns of connectivity of cortical areas to WM bundles are similar across specie s for correspo nding cortical areas. (B) Cross-species cortical ROI prediction based on tractography patterns. Reference Atlas Boundaries Human à Macaque Macaque à Human B dm PFC vmP FC A CBD CBP FMI IFO EmCf FA SLF1 STR UF MB StBf ATR ATR CBD CBP FMI FX IFO UF StBf AMF SLF2 9 Spat ial P ointwis e Orientati on T rack ing (SP OT): Re solving the spat ial lay out of fibr e ODF s for s uper-r esolution streamli ning Saad Jb abdi 1 , Amy H owa rd 1,2 1 Oxfor d Centre for Integ r ative Neur oimaging, Uni versi t y of Oxf ord, UK 2 Depar tment of Bioengineering, Imperi al Col lege Lond on, London, U nited King dom Intro duction A f undamental and unsolv ed cha lleng e in di;usion MRI tract ograp hy is to u ncov er the spa tial dist ributi on of orienta tions within an imagin g vo xel from the vox elwise fibr e orienta tion distribu tions (FODs). Stream lining in tr actogr aphy attem pts to solv e this prob lem thro ugh a co mbina tion of in terpolation and heuristics [1], such as penalisin g sha rp turns in the stre amlining. Althou gh this approa ch has been succe ssful over the year s in mappin g larg e coherent bundles , trac togra phy notoriou sly still su;ers from "bottleneck" iss ues where the FOD can ambiguou sly repre sent di;er ent underlying orientation configu r ations [2]. The problem is that once we've built an FOD , it is too late to reco ver the underlyi ng pointwise orientatio ns. Her e we propos e a potentia l par adigm shift: ra ther than estim ating pointwis e orientation s thr ough stre amlining after fitting FODs , we prop ose to model the underlying pointw ise orienta tions dire ctly in a forward model of the data that byp as ses the need for fitting FODs (Fig 1A). Poo ling the data acros s neighbo urhoods of vo xels make s this model tr actable (invertible) . We pres ent a pr eliminary v ersion of th e model in simu lated and real da ta, and sugges t how this type of appr oach can be used for joint modelling of dMRI and polarise d light imaging (PLI) data from the same tis sue , wher e the PLI f urther cons tr ains the mod el. Method s At the c ore of the f orward mod el are simp le multi-lay er perceptr ons (MLP s, wh ich in these exp eriments hav e 4 layer s, 256 neu rons per lay er , tanh activ ations, linear o utput). The MLPs take a s inpu t the (x, y ,z) coor dinates of any point in space (not neces sarily at the centr e of a vo xel), and outp ut either a 3D vector (f or modellin g the orienta tion vecto r field) or a sc alar (for mo delling e .g. the di;u sion coe;ici ent). T o enable modelling o f both hi gh and l ow fr equencie s in the spa tial do main, we ins ert a Fou rier Feat ure embed ding lay er betw een the inpu t and the MLP s [3]. The outputs of the M LPs (f or the vec tor and sc alar fields) ar e then used w ithin forwar d models of the da ta (Fig 1B ). For e xample , to pre dict di;usion d ata, sam ple positions from withi n a v ox el are f ed thro ugh the MLP s to g enera te orienta tions and s calars, then fed thr ough the di;usio n model equa tion for a stick given a set of b vals/b vecs , and then av erag ed over the v ox el. The pr edicted sig nal is the n compar ed to the mea sured di ;usion dat a to c alculate a mean squa red erro r loss . This is summ ed over a neighb ourho od of v oxe ls to c alculate the o ver all lo ss used for tr aining the ML Ps . Other data , such as pola rised light imaging (PLI), c an be similarly pred icted from the orienta tion vector field, enablin g the joint mod elling of multiple m odalities (optiona l extr a). SPO T was ev aluated u sing simulat ed di;usion d ata from an orienta tion vector field (h ere 2D) whi ch we aimed to rec ov er . For com parison wit h interpolati on, the dat a was r esamp led onto a 100 x100 grid using s plines of or der 3 (with Scip y's map_co ordinat es), and a te nsor was fit ted in each pix el to obt ain a pri ncipal orienta tion per pix el. Ne xt, we as sess ed the impac t of jointly fi tting a single dMR I vox el alongs ide one or tw o slides of high-res olution PLI in tersectin g the v oxel. Finally , we sho w some ear ly res ults fitting SPO T to in vivo dMRI d ata ( 60 directio ns, 2mm is otropic , b=1k). Res ults Pr eliminary res ults are shown in fig ure s 2-4. In 2D sim ulations, we compa re SPO T to sp line interpola tion (Fig 2 ) for di;er ent grid siz es (1x1, 2x 2 and 4 x4) to demons tra te the e;ect o f including n eighbourhoo d inf ormation. SP OT o utperfor ms interpola tion in terms o f the res olved poin twise orient ation s and th e FOD s. When jo intly fitting to MRI and PLI (F ig 3), SPO T manages to reco ver the und erlying pointwi se orienta tions from a single vo xel (no nei ghbou rhood inform ation) ev en with a sm all amount of PLI as additional co nstr aint . Resu lts compar ing SPO T to cons traine d spherical d econv olution (CS D) in in vivo da ta (Fig 4) sho w how FO Ds with cr ossing fi bres res olve into str eamlines ben ding onto the corte x in SPO T . Refer ences [1] Beh rens et al. 2 014, https:// doi. or g/10.101 6/B978-0- 12-396 460- 1.00019-6 [2] Maie r -Hein et a l. 2017, https:// doi. org/10.1 038/ s41467-017-0 1285- x [3] T ancik M et al. 2 020, https:// doi. org /10.4855 0/ arXiv .2006.10739 Fig2 Fig3 Fig4 Fig1 10 Folding Fig 1: Deformation of simplified fetal-like fib er mo dels resulting in organized anatomically-aligned structures. Fig 2: MLF bundle generated with only deformation data compared with T ractSeg di T usion data-based MLF. Deformation bundle Folded Deformation bundle Unfolded T ractSeg bundle Estimating Brain Fibers via V olumetric Cortical Folding Deformation Generating bers without diusion dat a or machine learning Besm Osman, Ruben Vink , Andrei Jalba and Maxime Chamberland Eindhoven University of T echnology , The Netherlands Methods W e dev elop ed a vo l u m e tr i c , su b je ct -sp e cific cortical folding mo del based on reversed unfolding. The mo del estimates the deformation b etw een a smo oth fetal brain and the intricate folding pattern observ ed in an individual's T1-weigh ted MRI. This is achiev ed b y simulating quasi-static cortical growth as a reversible process within a constraint-based system (Macklin et al. 2016). W e begin with a T1w scan from a HCP Y oung A dults sub ject (Essen et al 2012), from which we extract a cortical surface and generate a volumetr ic mesh. W e approximate the deformation b y resolving constrain ts for surface area and volume, gradually scaled from neonatal to fetal values, yielding a deformation that appro ximates cortical dev elopment in rev erse. W e use this deformation model to study how simplified fetal fibers are shap ed by cortical folding. T o isolate the contribution of deformation alone, we explicitly a void using any diffusion data for fib er generation. The pip eline takes as input a set of Desikan cortical parcellation lab els, from which we generate simple geometries (straigh t lines or quadratic Bézier curves) betw een labeled regions in the fetal mo del. Fiber p oints __ are deformed b y maintaining barycen tric co ordinates within linearly in terp olated tetrahedra with vertices ___ , suc h that . Res u lt s W e first demonstrate ho w our pip eline generates and deforms whole-brain fetal-like fib er configurations, as shown in Figure 1. F etal Mo del A consists of short, randomly oriented fibers distributed throughout the brain v olume. Despite the random initialization, the deformed fib ers exhibit clear directionality , whic h is consisten t with theories suggesting that tension-induced cortical growth contributes to fib er alignment. Expanding fib ers during deformation tend to align with primary or secondary p eaks found in FO D data, particularly near the surface. F etal Mo del B consists of radial fib ers extending from the cortical surface tow ard the cen ter. The resulting deformation shows that fiber tips near the surface curve tow ard gyri and aw ay from sulci (see purple circle), consistent with previous observ ations (Garcia et al. 2021). W e also show that fib er bundles can b e syn thesized using this deformation-based approac h. The Middle Longitudinal F ascicle (MLF) is generated by connecting regions corresponding to four lab els from the Desikan parcellation atlas via Bézier curv es. In Figure 2, we compare our generated bundle to T ractSeg (W asserthal et al. 2018) output. The deformation-based bundle is similar in orien tation and shape, despite using neither diffusion data nor filtering . The only specified inputs are the atlas lab els (middle temporal, sup erior temporal, inferior parietal, and supramarginal) and a single control point defining the Bézier curv e midp oints. In conclusion , w e present a sub ject-sp ecific cortical folding pipeline that appro ximates volumetric deformations b et w een fetal and neonatal configurations. By deforming simplified fetal-like fibers through this mo del, we generate anatomically plausible bundles wi tho u t the use of diffusion data. Results align with kno wn fib er bundles and geometry , demonstrating the potential of cortical deformation extracted from T1-weigh ted scans as a source of anatomical information to inform fib er structure. F uture work will include validation using fetal MRI and refinement of the fetal fiber model to pro duce more anatomically realistic fetal geometries. Schilling, Kurt G., Gao, Yurui, et al. (2017). “Can Increased Spatial Resolution Solve the Crossing Fiber Problem for Diffusion MRI?” Alenya, Mireia et al. (2022). “Computational Pipeline for the Generation and V alidation of Patient-Specific Mechanical Models of Brain Development”. In: Brain Multiphysics 3 Macklin, Miles, et al. (2016). “XPBD: Position-Based Simulation of Compliant Constrained Dynamics”. In: Proceedings of the 9th International Conference on Motion in Games. Garcia, Kara E et al. (2021). “A Model of T ension-Induced Fiber Growth Predicts White Matter Organization during Brain Folding” In: Nature Communications 12.1 Wasserthal, Jakob et al. (2018). “TractSeg - Fast and Accurate White Matter Tract Segmentation”. In: NeuroImage 183 V an Essen DC et al (2012). “The Human Connectome Project: a data acquisition perspective.” In: Neuroimage 2012 Oct 1 Cai, L.Y et al. (2024). “Convolutional-recurrent neural networks approximate diffusion tractography from T1-weighted MRI and associated anatomical context.” In Proceedings of Machine Learning Research St-Onge et al. (2018). "Surface-enhanced tractography (SET)" In: NeuroImage 169 Folding Introduction Diffusion data app ear insufficient for distinguishing true fib ers from spurious ones due to fundamental limitations of dMRI (Schilling et al. 2017), motiv ating the searc h for anatomical information within structural MRI that can inform fiber bundle geometry (St-Onge et al. 2018, Cai et al. 2024). Computational models hav e sho wn that cortical folding structure predicts various asp ects of underlying fibers (Garcia et al. 2021). Unfortunately , curren t cortical folding models are unable to reproduce sub ject-specific gyrification patterns due to the complexity of the underlying mechanisms and high inter-sub ject variabilit y (Alen ya et al. 2022), making them unsuitable for sub ject-sp ecific analysis in tractograph y . In this work, w e presen t a sub ject-sp ecific computational mo del that sim ulates cortical fold deformations from the fetal to neonatal stage using anatomical features deriv ed from T1-weigh ted MRI alone. W e demonstrate p otential use of the deformation field by generating and deforming simplified fetal-like fiber geometries from unfolded (fetal) to a folded (neonatal) configuration resulting in comparable fib er geometry to state-of- the-art tractograph y algorithm wi th o u t the use of any diffusion data. F olding of generated fib ers using our volumetric mo del. Video: https://besm.dev/misc/ist-abstract 11 Background: ADHD is increasingly conceptualized as a disorder of disrupted structural connectivity (1). While cortical white matter has been extensively s tudied, subcortical networks — particularly the limbic system — remain underexplored, de spite their central role in emotion regulation a nd behaviour (2). The current s tudy uses advanced diffusion MRI acquisition and manual tractography to overcome prior limitations in resolving complex limbic pathways. Methods: We analysed multi-shell HARDI data from 169 participants (72 ADHD, 97 controls) scanned at three timepoints between ages 9 and 14 using a Siemens 3T s ystem. Acquis itio n employed a multi -band acc elerated sequence (b = 1000/2000/2800 s/mm²; 130 di rections), a llowing for high a ngular resolution. P reprocess ing in Explor e DTI ( 3) included EPI and motio n correction, B-matrix rotation, and rob ust tensor es timation via REKINDL E. Deterministic Constrained Spherical Deconvolution (CSD) trac tography was used to reconstruct whole - brain white matter fibres (CSD) (4). Limbic sys tem white matter were isolated using manual tractography and anatomical ROIs. Microstructure was a ssessed us ing diffusion kurtosis imaging (DKI), specifically kurtosis anisotropy (KA), a sensitive marker of myelination a nd fibre c omplexity (5). Connec tomes were built using Destrieux-base d nodes, and macrostructural features were evaluated us ing graph theory metric s such as routing efficiency and network density (6). Results: Children with ADHD s howed significantly lower KA in the bilateral c ingulum bundle across a ll timepoints , suggesting reduced myelination. Within the ADH D group, highe r symptom severity was associa t e d with lower routing eff iciency and network dens ity in limbic circuits, highlighting altered macrostructural connectivity. Conclusion: Using dMRI and tractography techniqu es , this study captures lo ngitudinal changes in subcorti cal lim bic networks previously di fficult to r e solve. Findi ngs provi de comp elling evi dence for disrupted lim bic connectivity in ADHD , broadening our understanding of the dis order's neural mechanisms and ope ning promising avenues for future exploration of subcortical brain networks. References : 1 .Sudre G, Norman L, Bouyssi-Kobar M, Price J , S hastri GG, Shaw P. A Mega-analytic Study of White Matter Microstructural Differences Across 5 C ohor ts of Youths With Attention -Deficit/Hyperactivity Disorder. Biological Psychia t ry. 2023;94(1): 18 -28. 2. Catani M, Dell'acqua F, Thiebaut de Schotten M. A r evised limbic system model for memory, emotion and behaviour. Neurosci Bio behav Rev. 2013;37(8):1724-37. 3. Leema n s A, Jeurissen B, Sijbers J, J ones DK, editors. ExploreDTI: a graphical toolbox for pr ocess ing, analyzing, and vi sualiz ing diff usion MR da ta. Proc Intl Soc Mag Reson Med; 2009. 4. Tax CM, Jeurisse n B, Vos SB , Vier gever MA, L eem ans A. Rec ur sive c alibr ation of the fiber respons e function f or s pher ical deco nvolution of diff usion MR I data. Neuroimage. 2014;86:67-80. 5 .Maiter A, Rieme r F, Allinson K , Zac cagna F, Crispin-Ortuzar M, Gehrung M , et al. Investigating the relationship between diffusion kurt osis tensor imaging (DKTI) and histology within the normal human brain. Scientific Reports. 2021;11(1):8857. 6 .Rubinov M, Sporns O. C ompl ex network measures of brain connectivity: Uses and interpretations. Ne ur oImage. 2010;52(3):1059 -69. 12 Integrating Jacobian Determinant and LDDMM for Evaluating White Matter Zhaoxian Ming 1 , Zhijian Y ao 2 , Y ifei He 1 , Y u Xie 1 , Y e Wu 1, * , and Jiaolong Qin 1, * 1 School of Computer Science and T echnology , Nanjing University of Science and T echnology , Nanjing, China 2 Department of Psychiatry , the Affiliated Brain Hospital of Nanjing Medical University , Nanjing, China Introduction Dif fusion Magnetic Resonance Imaging (dMRI) is key for studying white matter (WM) changes in depression by revealing microstructural alterations[1]. However, current metrics often miss broader structural alterations, hindering understanding of antidepressant-induced neuroplasticity . This study proposes a framework combining the Jacobian determinant and lar ge deformation diffeomorphic metric mapping (LDDMM) to evaluate WM fiber bundle remodeling. Methods The study investigated dMRI data from 51 patients with major depressive disorder (MDD) before and after 12-week antidepressant selective serotonin reuptake inhibitor (SSRI) treatment. Following standard preprocessing, a two-level method was used for fiber bundle segmentation, initially identifying inter-regional fibers with the Y eo atlas and MRtrix3[2, 3], which were then subdivided using K-means clustering. Centroid fibers representing these bundles were generated using QuickBundles clustering[4]. The LDDMM algorithm then registered each category's pre- and post-treatment centroid fibers to capture morphological changes. Momentum vectors were derived through LDDMM’ s iterative optimization, and the Jacobian determinant was calculated from perturbed point displacements. After quantifying WM longitudinal alterations by Jacobian determinant, a correlation analysis was conducted to explore the relationship between these alterations and clinical improvement, as measured by reduction in Hamilton Depression Rating Scale (HAMD) scores, in MDD patients. Specifically , Pearson’ s correlation analysis was used, and the false discovery rate (FDR) method with q = 0.05 was applied for multiple corrections. Results FDR correction identified 32 WM fiber clusters with deformation significantly correlating with clinical improvement (Fig. 1b). Specifically , most significant positive results involve fibers connecting somatomotor-limbic regions (r = 0.35 ~ 0.6, p corr <0.02), somatomotor-putamen (r = 0.35 ~ 0.6, p corr <0.03), somatomotor-accumbens (r = 0.6 ~ 0.9, p corr <0.01), limbic-putamen/pallidus (r = 0.35 ~ 0.65, p corr <0.03), and amygdala-accumbens (r = 0.8 ~ 0.95, p corr <0.04). Negative results involve fibers connecting limbic-default mode network/amygdala/brainstem (r = -0.7 ~ -0.3) and central executive network-accumbens (r = -0.7 ~ -0.3, p corr <0.04). These findings are in line with prior research [5]. Conclusion This study integrates LDDMM and Jacobian determinant analysis to explore the ef fects of SSRI treatment on WM fiber structure. The results indicate that the Jacobian determinant is a valuable metric for quantifying WM changes related to SSRI treatment and aiding in the understanding of neuroplasticity . Fig.1 Pipeline and Results. (a) Methodological pipeline: Initial segme ntation of WM fibers using the Y eo atlas and MRtrix3, followed by fiber clustering, central bundle extraction, and shape deformation cal culation. (b) The color of the triangle elements in the result matrix indicates a significant correlation between the deformation of their c orresponding fiber clusters and the reduction ratio of total HAMD scores. References 1. Glozman T , Bruckert L, Pestilli F , Y ecies DW , Guibas LJ, Y eom KW (2018) Framework for shape analysis of white matter fiber bundles. NeuroImage 167:466–477 2. Thomas Y eo BT , Krienen FM, Sepulcre J, et al (201 1) The organization of the human cerebral cortex estimated by intrinsic functional connectivity . J Neurophysiol 106:1125–1 165 3. T ournier J-D, Smith R, Raffelt D, T abbara R, Dhollander T , Pietsch M, Christiaens D, Jeurissen B, Y eh C-H, Connelly A (2019) MRtrix3: A fast, flexible and open software framework for medical ima ge processing and visualisation. NeuroImage 202:1 16137 4. Garyfallidis E, Brett M, Correia MM, W illiams GB, Nimmo-Smith I (2012) QuickBundles, a method for tractography simplifica tion. Front Neurosci. https://doi.org/ 10.3389/fnins.2012.00175 5. Y ang R, Chen J, Y ue S, et al (2025) Disturbed hierarchy and mediation in reward-related circuits in depression. NeuroImage Clin 45:103739 13 Connectome-based consensus graph learning for fine-scale subcortical parcellation Zhonghua W an 1 , Y u Xie 1 , Y azhe Zhai 1 , Lei Xie 2 , Y ifei He 1 , and Y e Wu 1 ,* 1 School of Computer Science and T echnology , Nanjing University of Science and T echnology , Nanjing, China 2 College of Information Engineering, Zhejiang University of T echnology , Hangzhou, China Introduction Subcortical regions like the thalamus and amygdala are essential for sensory processing and memory[1]. Dif fusion MRI maps their complex white matter pathways, making it a powerful tool for identifying structurally informed subcortical subdivisions. W e present a novel framework for fine-scale subcortical parcellation by integrating tractography-based connectivity and voxel-level features within a multiscale consensus graph learning framework. Methods W e propose a multiscale subcortical parcellation framework combining tractography-based structural connectivity with voxel-level anatomical features using diffusion MRI data from 171 healthy participants in the Human Connectome Project (HCP). Whole-brain tractography was used with deterministic and probabilistic algorithms and registered to MNI152 space. Streamlines connecting brain regions were clustered into fiber bundles, allowing us to create sparse voxel-wise structural connectivity matrices. W e utilized a 3D extension of the SLIC[2] supervoxel algorithm to group similar voxels and recalculated connectivity matrices at the supervoxel level (Fig. 1a-b). A consensus graph representation learning strategy[3] was employed to produce individualized and population-consistent parcellations, leading to a group-level atlas generated by averaging embeddings across subjects (Fig.1c). Fig.1 Overview of the proposed method. (a) Fiber cluster feature representation; (b) 3D-SLIC; (c) Consensus graph learning combining spectral embedding and low-rank tensor learning; (d) Atlas comparison; (e) Coefficient of variation. Results Figure 1d shows strong alignment between our atlas and established subcortical atlases, including AAL3 [4] for the thalamus, HOA2 [5] for the hippocampus, and the Melbourne subcortical atlas [6] for the pallidus and putamen. W e assessed the robustness of our parcellation by calculating the coef ficient of variation (CV) for the Silhouette Index (SI) and Davies–Bouldin Index (DB) across 171 subjects, indicating low inter-subject variability and high intra-subject stability . Conclusion This study introduces a multiscale framework for subcortical parcellation that combines diffusion MRI connectivity with anatomical features for improved segmentation and a population-level atlas. References [1] N. A. Puccetti et al. , ‘Linking Amygdala Persistence to Real-W orld Emotional Experience and Psychological W ell-Being’, J. Neur osci. , vol. 41, no. 16, pp. 3721–3730, Apr . 2021. [2] R. Achanta, A. Shaji, K. Smith, A. Lucchi, P . Fua, and S. Süsstrunk, ‘SLIC Superpixels Compared to State-of-the-Art Superpixel Methods’, IEEE T rans. Pattern Anal. Mach. Intell. , vol. 34, no. 1 1, pp. 2274–2282, Nov . 2012. [3] Z. Li, C. T ang, X. Liu, X. Zheng, W . Zhang, and E. Zhu, ‘Consensus Graph Learning for Multi-V iew Clustering’, IEEE T rans. Multimed. , vol. 24, pp. 2461–2472, 2022. [4] E. T . Rolls, C.-C. Huang, C.-P . Lin, J. Feng, and M. Joliot, ‘Automated anatomical labelling atl as 3’, Neur oImage , vol. 206, p. 116189, Feb. 2020. [5] R. J. Rushmore et al. , ‘Anatomically curated segmentation of human su bcortical structures in high resolution magnetic resonance imaging: An open science approach’, Fr ont. Neur oanat. , vol. 16, p. 894606, Sep. 2022. [6] Y . Tian, D. S. Ma rgulies, M. Breakspear , and A. Zalesky , ‘T opographic organization of the human subcortex unveiled with fu nctional connectivity gradients’, Nat. Neur osci. , vol. 23, no. 1 1, pp. 1421–1432, Nov . 2020. 14 Automa ted Mapping of Cranial Nerve s Pathw ays in H uman Brain: A Multi-Para metric Multi- Stage D iffusion T ractogra phy Atlas Lei Xie 1 , Qingru n Zeng 1 , Y e W u 2 , Y uanjing Feng 1,* 1 Zhejiang U niversity of T ech nology , C hina. 2 Nanjing U niversity of Science and T echn ology , C hina Intr oduction The crania l nerves (CNs ) play a crucia l role in various essenti al functio ns of the human brain, and mappin g the pathw ays of them fro m dif fusion M RI prov ides valu able pre opera tive insig hts into the spa tial relat ionsh ips between indiv idual CNs and key tissues. In this work, we present what we believe to be the first study to develop a comp rehensive dif fusion tra ctogr aphy atlas for a utom ated m apping o f CN pathw ays in the hum an bra in. Meth ods In this work , we pres ent what we beli eve to be the first stud y to deve lop a compr ehensive diffu sion tract ograp hy atlas for automa ted mappin g of CN pathwa ys in the human brain. The CN atlas is generated by fiber clusteri ng by using the streamlin es gen erated by multi-p aram etric fiber tractogr aphy (Fig.1(b) ) for each pair of CNs , whic h can identi fy 8 fiber bundle s associated with 5 pairs of CNs, includi ng the optic nerve CN II, oculomot or nerve CN III, trigem inal n erve CN V and f acial-v estibuloco chlear nerve CN VII/VIII . Instead of d ispos able cluste ring, we explore a new strategy of mul ti-stage fiber clusterin g (Fig. 1(c)) for multiple analys is of approxim ately 1M streaml ines gener ated f rom the 50 subjects f rom t he Human Conn ectome Pr oject (HCP ). Resu lts we demon strate the applicatio n of the propose d CN atlas for auto mated mappin g of the pathways in new subjects from d ifferen t acquireme nt sites, inc ludin g the H CP datas et, the multi -shell dMR I (MDM) da taset, P A patients , and CP pat ient. Qu alitative and qu antitative experim ental results (Fig.1(d ) a nd (Fig.1(e))) demon strate th at the proposed metho d has idea l colocalis ation with exper t manual id entificatio n. Conc lusion In thi s wor k, we prop ose a com prehensive multi-par ametric di ff usion tract ograp hy atlas fo r automate d mapping the pathw ays of CN s in th e human b rain. Refer ences [1]. Q. Z eng, J. H uang, J . He, S. Chen, L. Xie, Z. Chen, W . G uo, S. Y ao, M. Li, M . Li et a l., “Autom ated ide ntification of the retinoge niculate visual pa thway us ing a hig h-dimen sional tr actograp hy atlas,” IEEE Transactions o n Cognit ive and Develop mental S ystems, vol. 16, no. 3, pp . 818–82 7, 2023. [2]. J. H uang, M. Li, Q. Z eng, L. X ie, J. He, G. Chen , J. Liang , M. Li, and Y . Feng , “Autom atic ocu lomotor nerve identific ation bas ed on dat a-driven fiber clu stering, ” Human Brain M apping, vol. 43, n o. 7, pp. 2164– 2180, 20 22. [3]. F . Zhan g, G. Xi e, L. Leu ng, M. Mooney , L. Eppr echt, I. N orton, Y . Rath i, R. Kiki nis, O. Al-Mefty , N. M akris, A. Golby , and L. O ’Donne ll, “Creat ion of a n ovel trig eminal tr actograp hy atlas for autom ated trig eminal nerve id entificati on,” Neuroim age, vo l. 220, p . 117063, 06 202 0. [4]. Q. Z eng, M. Li, S. Y ua n, J. He, J. W ang , Z. Che n, C. Zha o, G. Ch en, J. Li ang, M. Li et al., “Automa ted facia l- vestibul ocochlea r nerve c omplex i dentifica tion bas ed on dat a-driven tractogra phy clus tering,” N MR in Biomed icine, vo l. 34, no. 1 2, p. e46 07, 2021 . [5]. L. J. O’Donn ell and C .-F . W estin , “Autom atic trac tography segmen tation us ing a hig h-dimen sional w hite matt er atlas,” IEEE Transactions on Medical Imaging , vol. 26, no. 11, pp. 1562 –1575, 2 007 Fig.1 Over view of CN atlas generati on pipelines . (a) Structu ral and diffusio n MRI were passed throu gh correspo nding prepr ocessing ste ps for anato mical defi nition and tracking. (b) Fiber tractography f or the re constructio n of CN pathway s from the seeding images. ( c) Multi- stage fiber c lustering atlas generation using trac tography data from HC P dataset. (d) R econstruct ion results o n HCP data. ( e) Reconstruction results on p atient data. 15 Critical white ma tter tracts for bimanual motor skill learning : Exploring structur al connectivity in acute s troke . Authors: Coralie van Ravest yn a,b, c , Laurence Dricot b , Nicolas Delinte b, c , Benoi t Bihin d , Bea trijs De Coene e , Nicolas Mulqui n e , Y ves V andermeer en a,b, c Affiliations: a UCLouv ain/CHU UCL Namur (Go dinne), Neurology Departme nt, Stroke Uni t/Motor Learnin g Lab , Yvo ir, Be lgium; b UCLouv ain, Institute of NeuroS cience (IoNS), NEUR Division , Bru ssels, Belgium ; c UCLouv ain, Louvain Bionics, Louvain -la-Neuve, Belgium; d UCLouv ain, CHU UCL Namu r (Godinn e), Scien tific Support Unit (USS), Yvoir, Belgium; e UCLouv ain/CHU UCL Namur (Godi nne), Radiolo gy Department, Yvoir, B elgium Introdu ction . Bimanual motor skill learning (bim-MSkL) is centr al to most activities of daily life 1 and may be impaired after str oke . Since a bilate r al network involvin g sensory-(pre)moto r and higher - order ar eas supports b im-MSkL 2 , the int egrity of the whi te matter tr acts (WMT) involv ed in this networ k is es sential for the eKicient tr ansmission of informat ion 3 . The expl or ation of WMT disrupted by acute strok e may rev eal connections critical for bim-MSkL between motor and/ or cognitiv e area s. Objective s . T o identify micro structur al degr adations or disco nnections within WMT as sociated with impa ired bi m-MSkL. Methods . 90 (sub)acute str ok e patients and 62 age-mat ched healthy individuals (HI) train ed during three consecutiv e days with a bim-MSkL robotic cooper ation task (REA²Plan, Axinesis) 4 . P atients we re scanned using multim odal MRI for perfor ming WMT micr ostructur al integrity and tr actogr aphy analyse s. Resul ts . Bim-MSkL quantified thro ugh speed-accur acy trade-oK was impair ed in patient s compar ed to HI (-0.52 [a.u .], p<0.001). Altered WM integrity index ed by tr act-aver aged diKusion- tensor imaging (DTI) and neurite orientation dispersi on and density imaging (NODDI) metrics including fr actional anisotro py , axial and r adial diKusivity and orientation dispersion index in the corticospin al tract (CS T), corpus callosu m (CC) and superior longitudinal fas ciculus (SLF) was ass ociated with poorer bim-MSkL. Further tr actogr aphy analyses are still ongoing and will be pre sented at the Confer ence . These include: (1) subdiv iding these main tr acts of interest into equidist ant segments to enhance the spa tial res olution of mi cro structur al integrity asses sments and to char acterize the variation of integrity metric s along each tract length; (2) inves tigating the rela tionships bet ween these variations and s troke -rela ted injury by quan tifying the distance from each tr act s egment to th e lesion, under the hypothesis that segments closer to the a cutely inf arct ed zone exhibit grea ter structur al compromise ; (3) perform ing whole brain analyse s to quantify the inter-hemispheric asymetry of WMT integrity induced by an acuter stroke; and (4) correla ting tract -specific damage an d asym metr y measur es with bim-MSkL. Conclu sion . Acutely damaged micros tructur al integrity and/ or disconnectio ns of key WMT correla te with poorer bim-MSkL, providi ng a fine dis section of the network underlying bim-MSkL and paving the way f or developing biom ark ers that cou ld allow per sonalising rehabili tation. Refer ences: 1. Winstein et al. Strok e 47(6):e98–e169 (201 6) 2. V ahdat et al. J Neuro sci 31(47):1690 7- 15 (2011) 3 . T aubert et al. J Neur osci. 30(35 ):11670- 7 (2010) 4. Riga e t al. Strok e . 53(7):2 361 -2368 (2022 ). 16 ON-Harmony: A multi-site, mult i-modal travelli ng-heads r esource for brain MRI harmo nisation with integration o f UK Biobank sc anners Shaun W arring ton 1 , Andrea T orchi 1 , Oliv ier Mougin 2 , Jon Camp bell 3 , Asante Nt ata 1,4 , Mar tin C raig 1 , Step hania Assimopo ulos 1 , Fide l Alfaro- Alma gro 3 , Step hen M Sm ith 3 , Adam J Le wandowsk i 5,6 , Karl a L Miller 3 , Mar k Jen kinso n 3,7 , Paul S Mor gan 1 , and Stam atios N So tiropo ulos 1 1 Sir Peter Mansfi eld Imag ing Centr e, Schoo l of Med icine, U niversity of Notti ngham, U K. 2 Sir Peter Mansfi eld Imag ing Centr e, Schoo l of Phy sics, Uni versity of Notti ngham, U K. 3 Oxford Centre fo r Integr ative Ne uroimag ing, Univ ersity of Oxford , UK. 4 National Physica l Laborat ory , UK . 5 Nuffield Dep artment of Populati on Healt h, Unive rsity of O xford, U K. 6 UK Biob ank Ltd , UK. 7 Australi an Institu te for M achine Le arning ( AIML), School of Compu ter and Mathem atical Scie nces, The Un iversity o f Ade laide, A ustrali a. Intr oduction: MRI quan tifiability is hindered by non-biol ogical sources of variability , e.g scanner hardwa re/softw are 1–3 . Several approa ches aim to standard ise/harmonise acquisi tion and pro- cessing 4–6 , but lack of harmo nisation is an open challeng e. W e ran one of the mo st comprehen sive, freely accessibl e, multi-mo dal travelling heads studies, ON-Harmony 7–9 (Fig1): 20 subjects, each scanned in up to 8 3T scanners, 3 vendors (Siemen s/Philips/GE) and 5 modalitie s (T1w/ T2w/dM RI/swMRI/fMR I), plus within-sc anner/ within-s ubject repeat s, enabling within- scanner , between -scanner and between-sub ject variabil ity to be mappe d a cross mul ti-modal im aging-derived phenoty pes (IDPs). W e have recently scanned 11 of the subjects at the Stock port UK Biobank (UKB) imaging centre (Reading UKB centre also planned ), enabling linkage of UK B population- level imaging data with various clinical scanners. Here, we showcase the data and reuse scenarios for assessing harmonisation ef ficacy . Method s: ON-Harm ony consists of 2 primary phases (10 subjects each), plus the UKB extension. Acquisit ion protoc ols were al igned with the UKB imaging study 10 , while respecti ng best practices and hardware limitations (i.e. parameters not simply nominal ly-matc hed) 8 . Each subject was scanned in at least 6 diffe rent scanners (out of a collection of 8 scanners) and 9 subjects had 5 additiona l within-sca nner repeats. 1 1 participan ts were re-scan ned at the UKB centre (1 subject with 5 within-s canner repeats). All data und erwent qual ity control through visual inspecti on and then using MRIQC 11 (T1w/T2w /fMRI) and eddyQC 12 (dMRI). Data were proce ssed with a m odified ver sion 8 of the UKB pipeline 13 . Hu ndreds of IDPs we re deriv ed for ea ch sessio n, allowing us to quantify IDP variability . Results: Fig2a shows a subject’ s raw data, depicting sessio ns across scanners (column s) and modalities (rows ). W e assessed between-se ssion IDP similarity for within-s canner , between -scanne r , between-subje ct pools (Fig2b). Between-sub ject variabil ity has little overlap with scan-rescan variability , however , it o verlaps quite substant ially with between- scanner variabili ty . W e explore d how ON-Harm ony can be used to assess harmo nisation effic acy , e.g. ComBat 14,15 (explicit harmon isation). Pre/post harmon isation between-sca nner variability was compare d to within-scann er variability (Fig3) for dMRI tract-wise F A measures. Reducti ons i n bet ween-sc anner variability fo llowing harm onisation we re re vealed but did not match the within -scanner baseline. ON-Harmony can also be used to assess pipeline /tool generalis ability across scanner s (implicit harmonisa tion). Fig4 shows generalisa bility of tractography for FSL-XTRAC T 16 . For each scanner , subject- average d tract maps were obtained and correlated against a UKB atlas, with moderate-high cor relation val ues across all scanners and genera lly consisten t trends across vendors/ phases, although with some exceptio ns (GE-A was a low gradient system with a single-shell protocol). Such comparisons showcase how ON-Harmony can be used to assess susceptibilit y o f tools/pip elines to between -scanne r eff ects. Conclus ion: W e have prese nted a comprehens ive harmo nisation resource (ON-Ha rmony) for multim odal neuroimagin g data, based on a travelling-head s p aradigm . O N-Harmony is o penly released, freely available 9 and can be used to assess harmonisati on eff icacy and to develo p new vendor agnostic tools/pip elines. The novel UK Biobank extension will enable direct linka ge of a represen tative se ts of scanners fro m all vendors with one of the lar gest population -level s tudies. Refer ences : [1] Pinto et al. Fron t. Ne urosci. 14 (2020). [2] Han et a l. Ne uroImag e 32:1 80 (2 006). [3] F riedman et al. H um. Brain Mapp. 29:95 8 (20 08). [4] Potvin et al. Neur oImage Cli n. 24:10194 3 (2019). [5] Che n et al. NeuroImag e Clin. 24:10 1943 (2019 ). [6] Layton et al. Mag n. Reson. Med . 77:1544 (201 7). [7] W ar rington et al. Sci. Data 12:609 (2025). [8] W arringto n et al. Im aging Neuros ci. (2023). [9] ON-Harm ony , https://o penneuro .org/datasets /ds00471 2/ versions /2.0.1 . [ 10] Mill er et al. Nat. Ne urosci. 19:1523 (2 016). [11] Esteb an et al. PLOS O NE 12: e018466 1 (2017 ). [12] Bastiani et al. NeuroIm age 184 :801 (2019). [ 13] Alfaro-Alma gro et al. N euroIm age 166:4 00 (2018 ). [14] For tin et al. N euroIma ge 167:10 4 (2018). [15] Forti n et al. Neu roImage 161:149 (2017). [16] W a rrington et al. Ne uroImag e 217: 116923 (2 020). 17 Introduction. In d iffusion magnetic r esonance imaging (dMRI), symmetric fiber o rientation distributions (FODs) ca n detect symmetric single an d crossing f ibers. However, in regions where fib ers are b ending, bran ching, or f anning, the FODs may appear asymmetric — often forming T -shaped, Y -shaped, or uneven cro ssing patterns. To address this lim itation, the use of asy mmetric FODs (A - FODs) has been proposed [1,2]. A-FODs hav e been show n to be aligned with the expected underly ing an atomy [1] and have also b een reported to impr ove the accuracy of fiber tractography modeling [3]. The d erivation of A -FODs is based o n incorporating local neighborhood information of each voxel [2]. A central assumption in modeling the intervoxel information is the fiber continuity principle, which posits that the radius of curvature of white matter fibers typically exceeds the dimensions o f a vox el. Consequen tly, it is assumed that a fiber en teri ng a voxel with a given orientation is more likely to exit alon g a similar orientation, reflecting local di rectio nal coherence. In [1], the general filtering-based formulation to model A- FODs from a weighted sum of symmetric FODs inside a neighborho od has been proposed. Let denote th e A-FOD at voxel p osition along directio n , an d let represen t the set of neig hboring voxels surrounding the central voxel . The set correspo nds to th e unit sphere directions ov er which the orien tation d istribution function is projected. The term d enotes the regularizatio n weight applied to th e origin al FOD at vox el along d irection , while W serves as a normalization factor . Furthermor e, the displacement vector from voxel to voxel can be expressed as the product of its magnitude by its unit direction . When the d istance b etween neig hboring v oxels is relativ ely lar ge, the assumption that fiber s pro pagate as straight trajector ies alon g directions U and -U across adjacen t voxels b ecomes invalid [4] ( Fig. 1a). To address this iss ue, the p roposed method aims to incorporate the curvature char acteristics of the under lying fiber architecture, thereb y generalizing the fiber con tinuity assumption. Methods . Differen t regularization weights have been formulated for the estimation of A -FODs [5 ], an d these can be incorporated into the general for mulation presented in Eq. (1) . In this study, a novel curvatur e-aware r egularization weig ht is introduced to better account fo r fiber curv ature d uring A -FOD estimation. To inco rporate curv ature information , the direction at neighbo ring voxels is rotated alon g the vector where the degree of rotation dep ends on the distance The rotated direction is computed usin g Rodrigues' Rotation Formula, and is the angu lar deviation introduced to align with the presumed f iber curvature. The parameter denotes the fiber 's radius of curvature, and th e rotation becomes sign ificant when , thus enabling the model to capture fib er trajectories . The novel regularizatio n weight is integ rated with other well-known weights in Eq. (4). is a Gaussian d istribution with stand ard deviation . The first weig hting function, , assign s weights to neighb oring v oxels based on their Euclidean distance from the vo xel u nder consideration . The function accounts for th e alignment between the currently processed directio n and direction . Similarly, the models the alignment between th e curren t directio n and the rotated direction d erived from Eq. (3). A visual interpretation of Eq. (4) is presen ted in Fig . 1a an d Fig. 1 b. By minimizing the MSE between the inpu t symmetr ic FODs an d the symmetric portion of th e estimated A-FODs, we find the b est parameter combination. Results. To d emonstrate the advan tages of our m ethod, we tested the meth od o n the HCP data set and DiSCo phanto m [6 ] that were simulated f or diff erent comp lex configuration s. The Constrained Sp herical Dec onvolution (CSD) meth od was used to estimate FODs per voxel. Fig. 1c illustrates the ground truth streamlines and A -FODs extracted f rom multiple regions o f the DiSCo phantom that exh ibit complex configuratio ns. Discussion. by excluding the center voxel from neighboring vo xels , the A- FODs is es timated solely based on its surrounding voxels, allowing for the estimation of complex subvoxel fiber configuration s. The proposed model both suppo rts an d generalizes the fib er continuity assumption to infer asymmetric orien tations. Notably, the resulting asy mmetries are compar able to those p roduced by o ptimization methods, while allo wing sharper f iber turns than conv enti onal FODs [2]. Incorporation of fiber curv ature in the mo deling promotes smoother fib er segments and en hancing connectivity . Conclusion. we gener alized the filtering-b ased methods by proposing a novel regularization weigh t for estimating A-FODs, integrating fiber curvature proper ties through a local information of surrounding voxels and directional alignments within a single formulatio n. The results demonstrate th at A-FODs ef fectively resolve subvoxel fiber configurations, includ ing bending , fanning , and asymmetric kissing. Inco rporating cu rvature information enables smoother fiber segments in co ntinuous space compared to conventional FODs . Future work will assess if the cu rvature -aware regular ization improves tractography in complex regions. References. 1. Poirier, C., & Descoteau x , M. (2024). NeuroImage, 287, 120516. 2. Wu, Y. et al. (2020). Medical i mage analysis, 59, 101543. 3. Bastiani, M.et al. (2017). Neuroima g e , 158 , 205-218. 4 . Kjer, H. M. et al. (20 25). Elife, 13, RP94917. 5. Karayumak, S. C . et al. (2018). M agnetic Res onance Imaging, 49, 145-158 6. Girard , G. et al. (2023). NeuroI mage, 277, 120231. Curvature pr operties on Estimating Asymmetric Fiber O rientation Dist ribution Mojtaba Taherkha ni 1,2 , Marco P i zzolato 2,3 , Morten M ¿rup 2 and Tim B. Dy rby 2,3 1 Department o f Information Engineering, Un iversity of Pisa, Pisa, Italy 2 Departmen t of Applied Mathematics an d Computer Science, Technical Un iversity of Denmark, Kgs. Lyngb y, Denmark 3 Danish Research Centr e for Magnetic Reson ance, Copenhagen Un iversity Hospital Am ager and Hvidovre, Cop enhagen, Denmark c b a A-FOD FOD A-FOD FOD 18 Quantifying the wh ite matter pathways supporting written w ord pr oduction using tractometry Romi Sagi 1 , J.S.H. T aylor 2 , Kyriaki Neop hyt ou 3,4 , Sivan Jossing er 1 ,5,6 , Brenda Rapp 3 , Kathleen Rastle 7 and Michal Ben-Sha char 1 1 The Gonda Multidisciplinary Brain Research Center , Bar-Ilan University , Ramat-Gan, Israel ; 2 Division of Psychology and Language Sciences, University College London, London, UK ; 3 Department of Cognitive Science, Johns Hopkins University , Baltimore, USA ; 4 Department of Neurology , Johns Hopkins Medicine, Baltimore, USA ; 5 W estern Centre for Brain and Mind, W estern University , London, Ontario, Canada; 6 Department of Computer Science, W estern University , London, Ontario, Canada; 7 Department of Psychology , Royal Holloway , Un iversity of London, UK Introduc ti on. Produci ng written la nguage is a fundamental aspec t of everyd ay c ommunicat ion, but its neurobiologic al bases re main understudied. fMRI s tudies have implicated a distributed network of cortical, subcort ical, and ce rebellar brain regions in spelling t asks 1,2 . Still, the st r uctural conne ctivity supporting these pro ce sses is less characterized. W e leveraged p robabilistic tractography m ethods and automated tract segmentation and quant i fication tool s, coupled with s ensitive behavioral assessme nt , to identify the whi t e matter pathway s that support spelling perf ormance in a l arge cohort o f neurotypical adul t s. Metho ds . Native English spe akers comp l eted a dif ficult spelling- to -dictation tas k and underwent MR I scanni ng (N = 73, mean age = 21 ± 3 years). Diffu si on-weigh t ed images were acquired on a 3T Siemens scanner using a single-shot EPI sequence (64 dif fusion-weighted volum es at b = 1000 s/m m ² and one reference volume at b = 0 s/mm ² , voxel size ≈ 2×2×2 mm³). Constrained spherical deconv olution (CSD ) m odeling and probab i listic tractogr aphy yielded whole-br ai n tractograms. Langu age-related dorsal, ventral and cerebellar pat hways were reconstructed automatically in each participant’ s native space, usin g a multip l e-region-of-interes t approach. Specifically , we util i zed the AFQ 3 package together w i th tools developed i n our lab 4,5,6 to seg ment bilaterally the th ree branches of t he superior l ongitudinal fasciculus (SLF I, II, III), as well as the arcuate fasciculus, i nferior l ongitudinal fasci culus (ILF), f r ontal aslan t tract (F A T), and cerebello- thalamo-cortical pathways ( CTC). Fractional anisotropy (F A) values were extract ed fr om mu l tiple nodes along each t r act, and associa t ions with spel ling performance were assessed whil e controlling for additional beh avioral fa ct ors. Results. Spelling accuracy varied widely across par ticipants (7 % – 97%) and was bimod ally distributed. T ractometry results reve al ed both dorsa l and ventral stre am associations with spel ling: High-performing spellers s howed a significa nt positiv e correlation between spelling accuracy and F A in the left ILF ( r s = .53, p < .0 5, FWE-corrected), implica t ing eff icient lexical-orthographi c spelling processes. In contrast, low-performing spelle rs s how ed a significant negative correla t ion between spe l ling accuracy and F A in the righ t SLF III (r s = –.4 7, p < .05, FWE- corrected), sugges t ing relia nce on phono logical, fronto-parieta l systems 4 . Additionally , F A in the left CTC tract was si gnificantly correlate d with spelling pe rformance across the full sa m ple (r s = .38, p < .05, FWE-correcte d) , highlighting th e cerebellum’ s contribution to high er -order co gni tive-linguistic processing via cerebello - cortical loops 7 . No signif icant associati ons were found b etween spelling performance and F A in the bilateral F A T , which may be releva nt for mo re peripheral-motor aspec ts of written word produ ction. Conclusion. Our findings d emonstrate that spelling is suppor t ed by a distributed set o f white mat ter pathways, inc l uding ven t ral occipitote m poral, dorsa l frontoparieta l , and cerebello-cortica l connections. Moreov er, h i gh- and low - performing spel lers appear to rely o n differe nt cognitive p rocesses, supported by distinct whi te matter pathways. H igh-perfor ming spellers may rely more heav ily on whole- word -form retrieval, whereas l ow -performing s pellers appear to depend on analy tic sound- to -letter mappin g . These res ults underscore the va lue of tracto metr y methods for eluci dating the highly co mplex neurocogn itive architec ture of written w or d production. 1 Planton et al. 2013 Cortex ; 2 Purcell et al. 201 1 Fro n t. psychol . ; 3 Y ea tman et al. 2012 PLoS ONE ; 4 Sagi et al. 2024 BSAF ; 5 Kronfeld-Duenias et al. 2016 BSAF ; 6 Jossinger et al. 2023 NoL ; 7 Sagi et al. 2025 , NoL. 19 Estimating microscopy-informed fibre orientations from dMRI data in the UK Biobank Silei Zhu a , Nicola K. Dins dale a,b , Saad Jb abdi a , Karla L . Miller * a , Amy F .D. How ard* a,c a Wellco me Cent re for Int egrative Neuroim aging, F MRIB C entre, Nu ffield D epartme nt of Cli nical Ne uroscienc es, Univ ersity of Oxford, UK b O xford M achine Learning in Neur oImagin g Lab (O MNI), D epartmen t of Com puter Sc ience, Un iversity of Oxfor d, UK c Departm ent of Bi oenginee ring, Imperia l College London , UK Introdu ction Th ere is an unmet ne ed for no n-inva sive meth ods to m ap comp lex neuro anatomy at the m eso-sc ale. Diffu sion MR I (dMR I) tractog raphy is effective but limited b y inaccu racies in fibre or ientation estimate s. We pr esent a d eep-lear ning mod el that re construc ts micros copy-in formed f ibre orie ntations from in v ivo huma n dMRI d ata, and i nvestiga te wheth er this tr actograp hy can b etter capt ure indiv idual br ain conne ctivity d ifference s compa red to co nvention al metho ds. Method s Data fo r model training : The netw ork was trained o n macaq ue data fr om BigM ac wi th in-viv o dMRI (b=1000 ms/mm 2 at 1mm) , postmo rtem dM RI (b=4 000 ms/m m 2 at 0.6mm ) and m icroscop y (polarise d light i maging, 4 μm/pix el) in a s ingle br ain. The n etwork was then fine- tuned an d applied to huma n data fr om the U K BioB ank (UK B) with p re-pro cessed single-sh ell dMR I (b=100 0 ms/m m 2 , 2mm, 5 0 direct ions), al ongside 2.4mm r sfMRI. Microsc opy-info rmed fi bre orie ntation d istribut ions (FO Ds) est imation : We deve loped a domain adaptatio n netwo rk with 3 compo nents: a f eature e xtractor, predicto r, and do main cla ssifier (F ig1a). Th e feature extracto r and pre dictor ge nerate predicte d FODs from dM RI, whil e the dom ain clas sifier ens ures inv ariance b etween postmor tem and in vivo d ata. The training i nvolved comparin g predic ted FOD s to “ground truth” h ybrid dM RI-micr oscopy F ODs us ing mean squared error. H ybrid FODs w ere creat ed by co mbining 2D micr oscopy w ith thro ugh-plan e dMRI orientati ons to ob tain 3D FODs th at are m aximally informe d by mic roscopy. The network was fine -tuned f or human data in two steps (Fig1b) during w hich bot h human a nd maca que data were inp ut to the network . First, it was tra ined on m acaque FODs w hile the discrimin ator aim ed to dif ferentiate species. Second, the discrimi nator wa s fixed, a nd the fe ature ext ractor lea rned spe cies-inv ariant fe atures. This two -stage ap proach i s crucial because “ground truth” F ODs are not avai lable for human d ata. Fina lly, the t rained ne twork w as applie d to UK B subje cts. Netw ork- derived FODs we re comp ared to co nstraine d spheri cal decon volution (CSD). Tractogr aphy wa s perform ed using MRtrix3 and tr act term ination m aps (TTM s) wer e generate d by map ping no rmalised streamli ne count s onto th e cortica l surface. Relating tract te rminati on mask s to rsf MRI da ta: We anal ysed TT Ms from both ne twork-de rived and CSD F ODs to d etermine which of these two “par cellation s” is in b etter agre ement w ith rsfM RI (Fig2 ). Two a nalyses evaluate d how w ell TTM s capture inter-in dividual v ariabilit y in rsfM RI. Focu sing on homotop ic conne ctions b etween th e left an d right v isual cor tex, we s eeded tractogra phy from the left visual c ortex and mapped streamli nes to th e right hemisph ere. The left visu al cortex mask wa s also us ed in rsf MRI dua l regress ion to identify each indi vidual’s visual n etwork, w hich wa s compa red to th e TTM in the right hem isphere . Results Our netw ork can successf ully reco nstruct b iologica lly plaus ible FOD s and tractogra phy from in vivo human d ata (Fig3 a). It pro duces no ticeable differen ces in tractogra phy acro ss subjec ts and co mpared to CSD (Fig3b). Figure 4 asks whe ther these dif ferences are mea ningful b y exami ning trac t-rsfMR I alignme nt in the visual cortex. C ompared to CSD , the netw ork TT M define s a smal ler, more localized region that excl udes the anticorre lated res ting-stat e region (blue). T his follo ws neuroan atomical expectat ions, as a nticorre lated net works ar e typical ly not connecte d by dir ect struct ural path ways. Conclus ion & F uture w ork We dem onstrate the effic acy of m icroscop y-inform ed FOD s estimat ed from convent ional in v ivo hum an MRI for mean ingful fib re track ing. Futu re work will evaluate whether the indiv idual dif ferences of TTM s are ass ociated w ith non -imaging phenoty pes. Fig 1: M icroscop y-infor med fib re orien tation ne twork (a) The network employs a doma in adapta tion arch itecture to achiev e invaria nce between postmor tem and in-vivo tissue. (b ) Fine-tu ning on i n-vivo h uman d ata establish es speci es invaria nce (ma caque vs . human ) Fig 3: M icroscop y- informe d FODs and tra ctograph y in UKB (a) Com parison o f network FODs w ith CSD FO Ds in U KB data, sho wing improve d, less no isy FODs n ear the g ray- white m atter boundar y. (b) Reconst ruction o f the corti cospinal tract rev eals individua l differenc es in trac t terminat ions and noticeab le differenc es betwe en network and CSD . Fig 2: W hite ma tter term ination and rsf MRI ne twork Brain re gions co nsist of d istinct fu nctional subregio ns. Whit e matter tract terminat ions, def ined by tr actograp hy, help delineate these bo undaries , though is prone to errors. rs fMRI ma y impro ve bound ary preci sion, as r egions w ith simil ar tract term inations show si milar rsf MRI act ivity. Fig 4: A lignmen t of white m atter tr act termina tion and rsfMRI Networ k To asses s alignm ent, tractogra phy was seeded from the left visu al cortex to generat e right hemisph ere whit e matter tract term ination maps. The righ t hemisp here’s rsfMRI network was identifie d by appl ying the left visua l cortex mask in dual reg ression. N etwork FODs s how bett er alignmen t with th e rsfMRI network than CSD (N =3). 20 A microscopy-trained model to predict super-resolution fibre orientations from diffusion MRI Silei Zhu a , Karla L . Miller a , Nicola K. Dins dale a,b , Saad Jb abdi a , Amy F .D. How ard a,c a Wellco me Cen tre for In tegrative Neuroi maging, FMRIB Centre, N uffield Departm ent of C linical N euroscie nces, U niversity of Oxfo rd, UK b Oxford M achine Learning in Neur oImagin g Lab (O MNI), D epartmen t of Com puter Sc ience, Un iversity of Oxfor d, UK c Departm ent of Bi oeng ineering, Imperial College London, UK Introdu ction: M icroscop y provid es fibre o rientation s at muc h higher resolution s than M RI. Diffusio n MRI ( dMRI) a nd micr oscopy in the sa me brain offer th e opport unity to tr ain a machine -learning model t o super- resolve f ibre orie ntation d istributio ns (FOD s). We d evelop a micros copy-inf ormed n etwork th at provid es super -resolv ed FODs from sin gle-shel l dMRI, doublin g the reso lution. N otably, through d omain a daptation , our ne twork ca n be appl ied to in-vivo M RI wh ere micro scopy i s unavai lable, incl uding in humans , and off ers the possibil ity of mo re precis e fibre tr acking in widesp read appl ications . Method s Trainin g data: W e used the BigM ac data set with in-vivo d MRI (b= 1 ms/ ! m 2 at 1mm) , in- vivo stru ctural M RI (0.5m m), pos tmortem dMRI (b =4 ms/ ! m 2 at 0.6m m), postm ortem structura l MRI (0 .3mm) a nd micro scopy d ata (pola rised ligh t imagin g, 4 μm/ pixel) fr om a single, w hole ma caque br ain. Hybrid FODs: A s BigM ac micro scopy i s 2D, we combin ed it wit h dMRI to recons truct 3D “hybrid” FODs a t twice th e dMRI resolutio n. Micro scopy p rovided orientatio ns withi n the microsc opy plane , whilst dMRI pr ovided t hrough-p lane inf ormation (drawn from a po sterior distribu tion of po ssible o rientatio ns). Thes e hybrid FODs w ere con sidered “ground truth” during t raining. Networ k: S uper-res olution was achieved by i) lever aging high r esolution (H R) m icroscop y (hybrid FODs ) dur ing tra ining and ii ) inpu tting dMRI alongsi de HR struc tural M RI f rom th e same sub ject. Ou r networ k has 3 c omponen ts: 1) “Fea ture-fus ion” mo dule: T his com bines H R struct ural MR I (twice dMRI r esolution ) with dire ctional in formatio n from d MRI (Fi g1A). Th e dMRI i s spatiall y up-sampl ed to the structura l resolution and the structura l MRI up-samp led to 45 channels using transpo sed convolu tions. The modalities are concatenat ed and put th rough a convolutional layer to crea te fused fe atures. F used fea tures are generat ed for bo th postm ortem a nd in-vivo MRI. 2) Main n etwork: The netw ork has a fe ature extr actor and p redictor t hat take a 3x 3x3 cube of fused fea tures and ou tput a 2x2x 2 cube of FO Ds at doubl e the dMRI re solution . During training, these FO Ds wer e compar ed to hyb rid FOD s at hig h resolu tion usin g the me an squa red error . 3) Domai n adaptati on framew ork: A dom ain classif ier was desig ned to ensure that the feature extractor out puts were dom ain-in variant to in- vivo or postm ortem MR I. This me ant we co uld bene fit from t raining o n postm ortem da ta while enabling in-vivo MRI us age. Validat ion: Net work FO Ds from unseen postmo rtem (1mm ) maca que MRI were co mpared to constr ained sp herical d econvolu tion (CS D) at low -resolut ion, and CSD FODs u p-sample d to HR using li near inter polation . The net work wa s also ap plied to U K Biob ank 6 in-vivo human M RI (2m m, b=10 00 s/mm 2 ). The n etwork w as “fine - tuned” u sing the d omain c lassifier to ensure the feat ure extra ctor’s la st layer w as comm on to bo th specie s. Results In postm ortem m acaque d MRI, ou r super- resolved FODs p erformed well on lower-r esolution data, es timating 0.5mm F ODs fro m 1mm dMRI fo llow mi croscopy anatomic al expec tations e ven in co mplex re gions lik e the oc cipital lo be (Fig 2). Appli ed to in- vivo hum an data from the UK BioB ank, the network success fully predicte d 1mm F ODs fro m 2mm dMRI (F ig 3). Th e netwo rk FODs could re solve m ore comp lex neur oanatom y in this small sub cortical structure . Conclus ion & F uture w ork We dem onstrate a method facilitat ing micr oscopy-i nformed super-re solved F OD reco nstructi on in dat asets wh ere micr oscopy is unava ilable. The trained n etwork is applicab le to con ventiona l MRI (s ingle-sh ell in-viv o diffusi on) facil itating w idesprea d applica tion. Fu ture work will inc lude com parison s to othe r super-r esolution methods , investig ate high er super -resolutio n factor s (3-fold ), and de monstrat e benefi ts for in- vivo fibr e tracking . Fig3: Su per- Resolve d FODs in In- Vivo Hu man. Single-s hell in- vivo dM RI (2 mm) and structura l imaging (1 mm) we re used to estima te microsc opy- informed FODs. Fig2: Su per-Re solved F ODs in Postmor tem Ma caque a t 1 mm . Postmor tem dMRI (1 mm) an d structu ral MRI (0.5 mm ) were us ed to enh ance FO Ds. Figure 1 : Micros copy-In formed Networ k. (a) Feat ure Fusi on: dMR I provid es low-r esolutio n orienta tion info rmation, while str uctural M RI supp lies high -resolu tion spat ial details . (b) Ma in Networ k: These fused fea tures are processe d by a do main- adaptatio n network to predic t micros copy-inf ormed fi bre orien tations. 21 Superficial white matter a ssociation with cognitive decline usi ng UKBiobank database (N= 13747 ) Nabil V indas 1,2 , Nicole Labra 1,3 , Vi ncent Frouin 1,2 ,Jean-François Mangin 1,2 . 1 NeuroSpin CEA Saclay , Gif-sur-Y vette, France. 2 Univeristé Paris-Saclay , Gif-sur-Y vette, France. 3 University College London, Lond o n, United Kingdom I – Introduction Aging of white matter (WM) leads to both structural and functional alterations at the synaptic level, which are vital for effective neuronal communication. Although changes in deep white matter (DWM) during aging are well characterized, superficial white matter (SWM) has been less studied due to its intricate location near the cortex and the small size of its fiber bundles [5]. However , recent improvements in neuroimaging have made it possible to examine SWM in greater detail [1]. In this study , we leveraged diff usion MRI (dMRI) and cognitive assessment data from 13,747 participants in the UK Biobank database. Using Partial Least Squares Path Modeling (PLS- PM), we explored the relationship between cognitive performance and SWM microstructure, analyzing 444 short- range bundles from the ESBA atlas and 35 long-range bundles from the LNAO-DWM12. II - Materials and Methods We analyzed data from 13,747 healthy UK Biobank participants (aged 45–82, 52% female). Linear and non-linear transforms from diffusion space to T1, as well as from T1 to MNI space, were computed with FSL ’s FLIRT tool and the ANT s toolbox. We used the multi-shell, multi-tissue constrained spherical deconvolution model [2] with anatomically constrained tractography [6] and a second-order integration over the fiber orientation distribution [9] to produce 10 million streamlines. Spherical-deconvolution Informed Filtering of T ractograms [7] was used to filter and reduce the tractography to 5 million streamlines. The result was registered to the MNI152 space using the transforms mentioned above, and it was segmented using GeoLab [10] coupled with the ESBA atlas (SWM atlas) [3]. The segmentation of DWM was done using BundleSeg [8]. Finally , five diffusion MRI measures (F A, MD, ICVF , ISOVF , and OD) were mapped to the segmented bundles using MRtrix. T o investigate links between SWM/DWM microstructure and cognitive performance, we applied PLS-PM, a multivariate technique capable of capturing complex interactions between observed and latent variables without assuming input data normalit y . While DWM bundles were modeled individually , SWM bundles were grouped based on the Desikan-Killiany atlas, depending on the cortical regions that their endpoints connected and whether they were intra- regional or inter-regional connections. For each diffusion metric, reflective latent variables were constructed for the grouped SWM bundles. In the path model, age was connected to all variables, including SWM latent constructs, DWM bundles, and the derived cognitive component. We also linked white matter measures (SWM constructs and DWM bundles) to the cognitive component to evaluate the indirect influence of age on cognition via WM microstructure. Statistical significance was assessed through bootstrapping (1,000 samples), using 95% bias-corrected confidence intervals; effects were considered significant if the interval excluded zero. All PLS-PM analyses were conducted in R v4.4.1 using the plspm package v0.5.1. III - Results In the PLS-PM analysis, the SWM blocks demonstrated good model quality , with communalities exceeding 0.5—indicating that a substantial portion of the variance within each block was captured by its corresponding latent variable—and unidimensionality , as evidenced by second eigenvalues below or near 1 and significantly smaller than the first. After isolating statistically significant paths, we found that SWM microstructure consistently played a more prominent mediating role in cognitive aging compared to DWM, across all diffusion metrics except for OD, which did not exhibit statistically significant results (T able 1). T able 1: DWM bundles (orange) and SWM latent factors (green) showing statistically significant association with the cognitive component. Abbreviations : LH: left hemisphere; RH: right hemisphere; Inter: inter-regional; Intra: intra-regional; Cu: cuneus; LO: lateral occipital; PoC: post-central; PrC: precentral; SF: superior frontal; CMF: caudal middle frontal; IP: i nferior parietal; IT : inferior temporal; PoCi: posterior ci ngulate; PrCu: precuneus; SP: superior parietal; ST : superior temporal; IL: inferior longitudinal fasciculus; POST A R: posterior arcuate fasciculus. F A MD ICVF ISOVF LH Cu inter - - -0.13 - LH LO inter - -0.14 0.11 - LH PoC inter -0.16 - 0.21 - LH PrC inter - - -0.18 -0.26 LH PrC intra - 0.11 - - LH SF intra 0.10 - - - RH CMF inter 0.13 - - - RH IP inter - 0.21 - - RH IT intra - 0.11 0.15 - RH LO intra - - -0.12 - RH PoCi inter - 0.14 - - RH PrCu inter - - - -0.11 RH SP inter - - - -0.15 RH ST inter - - -0. 15 - RH IL - -0.12 - - RH POST AR - - -0.1 - IV - Conclusion Our analysis of data from over 13,747 UK Biobank participants indicates that superficial white matter (SWM) has a more pronounced influence on cognitive aging than deep w hite matter (DWM). Building on previous findings by [4], which focused on fractional anisotropy (F A), we extended the investigation to include additional diffusion metrics—particularly NODDI-based measures that offer a more detailed and biologically informed characterization of white matter microstructure through multi-compartment modeling. Despite these advances, several limitations should be acknowledged. The use of mean values to summarize diffusion metrics across bundles may introduce bias, potentially oversimplifying within-bundle variability . Additionally , for computational efficiency , each streamline was resampled to 15 points—a resolution that may sufficiently capture short-range connections but could limit accuracy in characterizing longer tracts. Future work will aim to explore the genetic underpinnings of SWM by leveraging the FUMA platform to identify genomic regions associated with SWM bundles that show strong associations with cognitive performance. V - References [1] Guevara, M., et al., 2020. Superficial white matter: A review on the dMRI analysis methods and applications. NeuroImage 212, 1 16673. [2] Jeurissen, B., et al., 2014. Multi-tissue constrained spherical deconvolution for improved analysis of multi-shell diffusion MRI data. NeuroImage 103, 41 1 –426. [3] Labra-Avila, N., 2020. Inference of a U-fiber bundle atlas informed by the variability of the cortical folding pattern . Doctoral thesis. Bioengineering. Université Paris-Saclay . [4] Nazeri, A., et al., 2015. Superficial white matter as a novel substrate of age-related cognitive decline. Neurobiology of Aging 36(6), 2094–2106. [5] Schilling, K.G., et al., 2019. Limits to anatomical accuracy of diffu s ion tractography using modern approaches. NeuroImage 185, 1–1 1. [6] Smith, R.E., et al., 2012. Anatomically-constrained tractography: improved diffusion MRI st reamlines tractography through effe c tive use of anatomical information. NeuroImage 62(3), 19 24–1938. [7] Smith, R., et al., 2013. SIFT : Spherical-deconvolution informed filtering of tractograms. NeuroImage 67, 298–312. [8] St-Onge, E., et al., 2023. BundleSeg: A V ersatile, Reliable and Reproducible A pproach to W hite Matter Bun dle Segmentation. In Computational Diffusion MR I (CDMRI 2023) (pp. 47–57). Springer . [9] T ournier , J. -D., et al., 2010. Impro ved probabilistic streamlines tractography by 2nd order integration over fibre orientation distributions. Proceedings of the International Society for Magnetic Resonance in Medicine , 1670. [10] V indas, N., et al., 2023. GeoLab: Geometry-Based Tra ctography Parcellation of Superficial White Matter . IEEE 20th International Symposium on Biomedical Imaging (ISBI) , Cartagena, Colombia, 2023, pp. 1–5. 22 Mapping the Superior Longitudinal System: anatomical insights fr om BraDiPho Laura V avassori 1,2 , François Rheault 3 , Paolo A vesani 4 , Alessandro De Benedictis 5 , Francesco Corsini 1 , Luciano Annicchiarico 1 , Luca Zigiotto 1 , Umberto Rozzanigo 6 , Mattia Barbareschi 2,7 , Laurent Petit 8 and Silvio Sarubbo 1,2 . 1 Department of Neurosur gery , “S. Chiara” Hospital, APSS, T rento, Italy | 2 Department of Cellular , Computational and Integrative Biology (CIBIO), Center for Medical Sciences (CISMed), Center for Mind and Brain Sciences (CIMeC), University of T rento, T rento, Italy | 3 Sherbr ooke Connectivity Imaging Laboratory (SCIL), Université de Sherbrooke, Sherbr ooke, QC, Canada | 4 Neur oinformatics Laboratory (NiLab), Bruno Kessler Foundation (FBK), T rento, Italy | 5 Neur osurgery Unit, Bambino Gesù Childr en’ s Hospital, IRCCS, Rome, Italy | 6 Department of Radiology , “S. Chiara” Hospital, APSS, T r ento, Italy | 7 Department of Laboratory Medicine - Pathology Unit, “S. Chiara Hospital, APSS, T r ento, Italy | 8 Gr oupe d’Imagerie Neurofonctionnelle (GIN-IMN), University of Bor deaux, Bor deaux, France. Introduction. Charting the organization of white matter (WM) pathways is essential for understanding the functioning of the human brain 1 . Currently , there is no consensus about the anatomical extent, course and terminations of many WM bundles 2 . Indeed, descriptions of the cortical terminations of a bundle are generally bound to the specific aim of each study and rely on the assumption of prior anatomical definitions for bundle segmentation 3 . Concurrently , while tractography and ex-vivo WM dissection provide complementar y insights, their integration remains a longstanding challenge 4 . This study provides a comprehensive, anatomically enhanced characterization of the superior longitudinal system (SLS) by integrating in-vivo tractography with ex-vivo dissection within the same radiological space with the BraDiPho app roach ( https://bradipho.eu ) 5 . Methods. Constrained spherical deconvolution and particle-filtering tractography with anatomical priors 6 was computed for 39 healthy participants of the BIL&GIN database 7 . Using a data-driven cortex-to-cortex pairing approach leveraging gyral-sulcal anatomical landmarks, we reconstructed the dorsal associational connectivity of the frontal cortex, defined by a set of patterns of connectivity between ipsilateral gyri ( i.e., sub-SLS). Each sub-SLS was non-linearly registered to 10 photogrammetric models of ex-vivo Klingler WM dissection for a multimodal evaluation of its anatomical reliability 5 (Fig. 1). Results. W e identified 45 sub-SLS, of which (i) 22 were validated and refined through ex-vivo dissection, (ii) 17 were deemed anatomically plausible despite lacking ex-vivo confirmation, and (iii) 6 were classified as anatomically implausible. The anatomical description of plausible sub-SLS templates revealed fundamental organizational princ iples of the system: (i) a medio-lateral and dorso-ventral hierarchy , where dorsal regions connect dorsally and ventral regions ventrally , and (ii) a depth-dependent organization, with shorter , superficial fibers linking proximal areas and longer, deeper fibers connecting distal regions. Pearson’ s correlation confirmed a significant positive relationship between streamline length and distance from the cortex (r=0.689, p<0.001). Conclusions. This study provides a robust anatomical foundation for future population-based WM atlases using bundle-specific tractography 8 and emphasizes the need for a distributed and integrated understanding of brain connectivity beyond classical bundle definition. References. 1. Thiebaut de Schotten M, Forkel SJ. Science. 2022; 378:505 | 2. V avassori L, Sarubbo S, Petit L. Brain Structure and Function. 2021; 226:1363 | 3. Forkel SJ et al. Neurology . 2020; 94:e59. | 4. De Benedictis A et al. Journal of anatomy . 2014; 225:132 | 5. V avassori L et al. preprint https://doi.org/10.21203/rs.3.rs-6480729/v1 | 6. Theaud G et al. Neuroimage. 2020; 218:1 16889 | 7. Mazoyer B et al. Neuroimage. 2016; 124, 1225–1231 | 8. Rheault F et al. Neuroimage. 2019;186:382-98. 23 Sulcal morphol ogy reflect the o rganization of short U-sha pe associatio n fibers Arnaud Le Trote r, Olivier Coulon Institut de Neur oscience s de la T imone, A ix-Marse ille Univ , UMR C NRS 7289 , Marsei lle, Fran ce Introdu ction Short Association Fibers (SAF) in superficial white matter constitute a lar ge p ortion of the overall WM connectivity and have been associated to various p athologies. Despite this, SA F connec tivity is understud ied, mostly because in-vivo tractog raphy for SAF using diffusion MRI is notoriously difficult [1,2]. It has been h ypothesized from Klingler dissections [3] or MRI studies [4] that sulc al morphology is link ed to U-shape SAF con nectivity. In partic ular, som e sulcal mo rphological landm arks called three-w ay junctions [3] or wall pinch es (WP) [4] are thought to be as sociated to higher dens ities of U-sha pe fiber bundles. In this context, it has been shown [2] that the resolution of diffusion MRI is a determinant factor for SAF tractograp hy. In this work we use a very high-resolutio n datase t [5] to infer U-shape SAF connectivit y around two sulci and investigate its link with sulcal morpholo gy Method s The pipeline consisted of five main stages, as illustrated in Fig1, and was applied to the MGH single-su bject dataset [5], offering DWI data w ith a high s patial resolutio n of (0.76mm )³ acquired in 9 sessions and 18 volumes. The T1w v olume was register ed to the T2w volume, t hat in turn w as regist ered to the mean B0 vo lume computed from the 18 DWI vo lumes. Th e resulting warped T1w was resample d in the diffusion spac e. Cortic al surface extr action and seg mentation wer e performed using FreeSurfer 7.4 on the T1w volume warped on DWI (Fig1.A). ROIs were selected on the white matter surface, based on the Destrieux parcellation (aparc2009), target ing the central sulcus (CS: precen tral and postcentral gyri and central sulcus labels) and the superior frontal sulcus (SFS: supe rior and middle frontal gyri and sulcus). These ROIs were then projected into the diffusion volum e spac e and the resultin g binary mask s were morp hologica lly dilate d (kernel size: 5×5×5 voxels), and a bo unding box was defined ar ound the union of all dilated ROIs to crop the full dMRI dataset a ccordingly (F ig1.B). The cropped diffusion volumes were t hen proc essed using unrin ging and denoisin g filters (MRt rix3). Tractogr aphy was performed as follow (Fig1.C). For the short U-shaped fiber extraction , we estimated the response function using the Dhollander method and computed fiber orientation distributions (FODs) via multi-shell multi-tissue constrained spherica l deconvolutio n (MSMT-CSD ), con strained within the dilate d ROI volum e. For ea ch su lcus (S FS and CS), we generat ed 5000 streamlines from one gyrus to the other via the sulcus, in both directions using both the probabilist ic (iFOD2) and determin istic (SD_STREA M) algorithms , with common par ameter s: mini mum le ngth of 10 mm, s tep siz e of 0 .2 mm, maximum curvature angle of 30°, and unidirectional seeding. Streamlines were used to generat e fiber density maps at diffusion resolutio n using tckmap. These maps were then projecte d onto the white matter cortical surface into the cortical ribbon u sing mri _vol2sur f (trilinear interp olation of voxel 5 mm u nder the surface and ove r to 2 mm). Sulcal morphology was cha racterized on the white cortic al surface using two compleme ntary morp hologica l ma ps (Fig1.D): the DPF map (Depth Potential Function [6]), sensitive to sulcal depth variations, and the ASD map (Average Sample Distance [7]), enabling detection of WPs along the gyrus walls [7]. Sulcal basins were delineated by threshold ing the DPF (DPF > - 0.75). WPs within the basins were extra cted by thresho lding the ASD map (-1.5 < ASD < -0.1). To assess the relationship betwee n SAF and WP, we compared the distribution of fiber densities within WPs versus the rest of the sulcal basin (SB) for SFS a nd CS an d for both tracto graphy algorithm s. Statistical dif ference s were a ssessed using a Mann–W hitney U test. Results and Dis cussion Our an alysis reveale d a significa ntly h igher fiber d ensity benea th WP s compared to the rest of the sulc al basin, acr oss both CS and SFS, for both tractograp hy algorithms. Mann–Whitney tests revealed highly significant differences (p < 0.001) betwee n WPs and SB for both determinist ic and probabilistic approache s in SC and SFS (Fig1.E) . This finding highlights the fact that short U-shaped association fibe rs are more frequently loca ted beneath whi te matter protrusions such as WPs than elsewhe re in t he sulcus, suggesting a link between sulcal mo rphology an d the local organ ization of super ficial white matter connecti vity. [1] Reve ley et al . (2015) PNAS 10. 1073/pn as.1418 198112 [2] Shas tin et al. (2022) N euroIm age 10.1 016/j.ne uroimag e.2022. 119423 [3] Shin ohara et al. (202 0) Cereb ral Cort ex 10.109 3/cercor /bhaa08 0 [4] Bodin et al. (2 021) Ne uroimag e 10.101 6/j.neu roimage .2020.11 7513 [5] Wan g et al. ( 2021) Sc ientific D ata 10.1 038/s41 597-021 -00904-z [6] Bouc her et al . (2009) Med IA 10.1016 /j.media .2008.0 9.001 [7] Song et al. (2 022) Neu roImage 10.1016 /j.neur oimage. 2022.119 776 Gyrus Sulcus Gyrus A T1w T2w Freesurfer aparc2009 warped T1w DWI DPF Fiber density maps prob det Wall Pinches (WP) Sulcal Basins (SB) CS SFS mask Dilation Registration ROI Selection Bounding box Morphological maps ASD Tractog raphy Thresholding B C Fig1 se ed inc lude sto p ROI surface segmenta tion D Quantification E * * * * CS SFS Segmentation 24 Title: Do curren t autom ated tra ctograp hy met hods ho ld up in t umour a nd epile psy path ology? A compa rison of six meth ods wit h exper t manua l tractog raphy Steven Greens tein 3 , Sila Ge nc 1,3,4 , Franco is Rhea ult 5 , Maxim e Desco teaux 5 , Alison Wray 6 , Wirgin ia Maixn er 6 , and Jo seph Yu an-Mou Yang 1,2,4 1 Neuros cience A dvance d Clini cal Imag ing Ser vice (NA CIS), D epartm ent of N eurosur gery, Ro yal Chi ldren’s H ospita l, Melbo urne, A ustralia . 2 Neuros cience R esearc h, Murdoc h Children ’s Resea rch Insti tute, Mel bourne, Australia . 3 Develop menta l Imaging , Murdoc h Children ’s Resea rch Instit ute, Mel bourne, Australia . 4 Departm ent of Paediat rics, Univers ity of Melb ourne, Melbo urne, Austra lia. 5 Sherbro ok C onnecti vity I maging Labo ratory, Unive rsity of Sh erbrook e, Qu ebec, Canada . 6 Departm ent of Neuros urgery, R oyal Ch ildren’s Hospita l, Melbo urne, A ustralia . Introdu ction : Dif fusion MR I tractogr aphy is a val uable ima ging adjun ct for pre- surgica l planning in neurosu rgery 1 . Althoug h expert-b ased man ual tract ography is conside red the clinical sil ver-stan dard, its time- intensiv e n ature and requ irement for ne uroana tomical exp ertise limits its us e, e special ly in e mergen cy settings 2 . Automa ted tractog raphy meth ods are being deve loped to addre ss these challe nges 3 , but their perform ance rema ins uncerta in in cases with patho logy 4 . Large lesions can cause sig nificant an atomica l d istortion an d peri-les ional white m atter oedem a can introd uce additio nal techn ical compl exities. This stud y a ims to evalua te t he perform ance of six cu rrent state-o f-the-a rt a utomat ed tractogra phy methods again st expert-bas ed manual tractog raphy in a coh ort of p aediatric br ain tumour and epileps y surger y patien ts with c halleng ing lesi on-relat ed imag ing char acterist ics. Method s : C ohort: Four teen patient s wh o ha d br ain tumour or epilep sy s urgery at the Royal Child ren’s Hospit al w ere selected bas ed o n ha ving per i-lesion al o edema or d iffuse infiltrativ e tu mours on im aging and received expert- based manual tractog raphy for p re-surg ical planning (8 m ales, median age=11. 46 y ears [interqua rtile range, I QR 8.41 -13.62] , media n lesion volume =81.89 c m 3 [IQR 57 .87-131 .77]). MRI: Pre-sur gical MRI scans were cond ucted on clinical 3T Sieme ns sy stems with 40 or 8 0mT/m grad ients, acquir ing T 1-weighte d dat a (vo xel-size s=0.8-1 .0 mm ) an d multi-sh ell diffusion MR I (d MRI) data with multi -band accele rated EPI sequen ce ( 2.3 mm³ isotrop ic v oxels, TE/TR =77/350 0 ms,11 interl eaved b0s, b=10 00 s /mm² applied over 30 directi ons, and b=3 000 s/mm ² applied ove r 60 directio ns). dMRI dat a were pre-p rocessed with MRtrix3 5 , FSL 6 , ANTs 7 to correct for ima ging noise 8 , Gibbs ri nging ar tefacts 9 , motion and su sceptib ility disto rtion 10,11 , and bi as field inhomog eneity 12 . Manual Trac tograph y: Tra ctograp hy w as p erforme d us ing m ulti-tiss ue co nstrain ed sp herical deco nvolutio n 13 and iFOD -2 p robabili stic t racking algo rithm in M Rtrix3 5 . Trackin g RO Is w ere manua lly d elineate d b y a neur oanato my e xpert base d on kno wn anatom ical priors. We evalu ated the arcua te fa sciculu s (A F), c orticosp inal tract (CST), and op tic radiatio n ( OR) (n=84) bil aterally fo r a ll c ases due to their com mon implic ations in surg ical plann ing. Manua l t racts were co nverted to bin arised trac t masks an d acted as referenc es to evalua te autom ated trac tograph y outputs . Between 5,000-15 ,000 stre amlines were retai ned per tra ct, depen ding on the tract type . Automa ted Tracto graphy: We assesse d six automa ted metho ds: TractSe g 14 , BundleSe g 15 , Classifyb er 16 , White Matte r Analysis (WMA) 17 , DeepWM A 18 , and TRACU LA 19 . Each meth od was perfor med with defa ult setting s to ge nerate aut omated tra ct outputs for ea ch patient. For meth ods required the ge neration of a whol e-brai n tractog ram, on e million stream lines we re used . Statisti cs: As tract anat omy defini tions varie d b etween ma nual and aut omated m ethods, we fir st compute d Dice simila rity coeffic ients (DSC ) betw een manu al tract masks and ea ch au tomate d meth od’s t emplate -based tract R OIs 14-17 using scilpy (v1.10.1 ). Eac h auto mated method was t hen co mpared to t he ma nual tr acts by comput ing DSC, p ercenta ges of false -positiv e volume s (FP) for au tomate d-only se gments , and false -negativ e volume s (FN) for ma nual-o nly segm ents. FP an d FN voxel dista nces from the lesio n were plotted in histograms . Lesion- and non-le sion side DSC, FP and FN were compar ed using Wilcox on rank sum test, with statistical significa nce set at p<0. 05. Results : All auto mated m ethods s uccess fully rec onstruc ted trac ts on the non-lesion side, ap art from t he OR us ing Bund leSeg . O n the les ional sid e, recon structio n succes s var ied: T ractSeg (83. 3%), BundleS eg ( 71.4%), Clas sifyber (92.9 %), W MA (90.5% ), Dee pWMA (64.3 %), and T RACULA (78 .6%). Median Dice sim ilarity coefficie nts (DS C) betwe en man ual tract s and tem plate-b ased RO Is were lo w (0.20 –0.37), i ndicatin g signif icant dis crepan cies in trac t anatom y defin itions. Vi sual inspect ion c onfirme d su bstanti al va riation acro ss a utomat ed m ethods com pared to manual tr acts (Figure 1). All automa ted approach es showed low DSC (medi an 0.40, IQR 0.22–0. 49), high FP (28.3% , IQR 15.12–40.4 9), and high FN (44.9% , IQR 26.48–62.6 5). Lesion- side tracts had significa ntly lower DS C and higher FN than non-les ion tracts (p < 0.01), while F P w as only slightly h igher (p = 0.079). M ost FP and FN vox els were near les ions, sugges ting that p atholog y and peri-l esional oe dema ne gatively impact au tomate d tractog raphy (F igure 2) . Figure 1. Man ual and autom ated t ractogra phy ou tputs f or two cases, a) a rig ht sup erior parietal tu mour, and b) a left t empora l-pariet al t umour with marked pe ri-tumo ural oedema. The four auto mated trac tograph y outputs de monstra te high variab ility in tract app earance compar ed to m anual tr actogra phy resu lts, tha t were u sed for p re-surg ical pla nning. Figure 2. Fr equenc y plots for the number of vo xels withi n false-p ositive s (FP) and fals e- negativ es (FN ) regio ns of autom ated tr act ou tputs for les ion sid e trac ts, exp ressed as a functio n of distance from the lesio n. Gold lines indicate FP s results, an d green line s indicate F Ns results. Each sub plot shows results fr om a differe nt automated method. Only results fr om the lesio n side trac ts are show n. Binwid th was set to 0. 1mm. The plots showed most F P and F N are lo cated c lose to l esions. Conclu sion : D espite high tract completion rates, autom ated m ethods showed substan tial variability, especiall y on the lesion side, due to differing tract de finitions . False positive s and ne gatives often oc curred n ear lesi ons, refl ecting th e challe nge of m odellin g patholo gy-drive n distort ed white matter. T hese ina ccuracie s may in crease surgical risk, highligh ting the importa nce of standardis ed tract definitio ns and improved training of automa ted m odels using ap propriat e surg ical c ases. Our find ings u rge ca ution in relying on current automated tractogra phy for co mplex paediatr ic tumour and ep ilepsy surgeries . Refere nces : 1. E ssayed, W. I. et al . NeuroImage Clin. 1 5, 659–6 72 (201 7); 2. Ric hards, T . J. et al . Clin. Neurol. Neurosu rg. 210, 107001 ( 2021); 3 . Joshi, A . et al . F ront. Ne urosci. 18, (202 4); 4. G aryfalli dis, E. e t al. Ne uroimag e 170, 2 83–295 (2018); 5. Tour nier, J. D. et al. Neuroim age 202 , 116137 (2019); 6. Jenkin son, M. et al. FS L. 62, 78 2–790 (2 012); 7. Avants, B. B. et a l. Neuro image 5 4, 2033– 2044 (20 11); 8. V eraart, J. et al. N euroimag e 142, 3 94–406 (2016); 9 . Kellner , E. et al . Magne tic Reso nance in Medici ne vol. 76 1574– 1581 (20 16); 10. Anderss on, J. L. R. et al . Neuroim age 20, 8 70–888 (2003); 11. Ande rsson, J. L. R. et al . Neuro image 1 25, 1063 –1078 (2 016); 12 . Tustis on, N. J. e t al . N4 Itk. 29, 1310–13 20 (2011 ); 13. Je urissen, B. et al . Neuroim age 103 , 411–42 6 (2014) ; 14. Was serthal, J. et al . Neuroim age 183 , 239–25 3 (2018); 15. St-O nge, E. https:// doi.org/ 10.48550 /arXiv.23 08.10958 (2023 ); 16. Bert ò, G. et al. Neuroim age 224, (2021); 1 7. Zhang , F. et al . N euroimag e 179, 42 9–447 (2 018); 18. Zhang, F. et al. Medical Image An alysis (2 020); 19 . Yendik i A, Fron tiers in n euroinfo rmatics (2011) 25 MouseFlow , a pipeline for diffusion MRI processing and tractogram gener ation in mouse brain validated using Allen Brain Atlas Connectivity with m2m . Elise Cosenza 1 , Arnaud Boré 2,4 , Julien Fouilloux 1,3 , Joël Lefebvre 3,4 , Maxime Descoteaux 2,4 , Sylvain Miraux 4,5,6 , Laurent Petit 1,4 1 Groupe d’ Imagerie Neurofonctionnelle (GIN) IMN, UMR5293 CNRS, U. Bordeaux, France ; 2 Sherbrooke Connectivity Im aging Laboratory, U. Sherbrooke, QC, Canada ; 3 Université du Québec à Montréal, Montréal (QC), Canada ; 4 International Rese ar ch Pr oject OpT eam, CNRS Biologie, France – U. S herbrooke, Canada ; 5 Centre de Résonance Magnétique des Systèmes Biologique s (CRMSB), UM R5536 CNRS, U. Bordeaux, France ; 6 Plateforme d’ Imagerie Biomédicale (pIBIO), UAR3767 CNR S U. Bordeaux, France In t his work, we introduce MouseFlow , an open-source and standardi sed Nextflow-DSL2 pi peline spe cifically d e signed to address the c urrent heterogeneity in processing diffusion magnetic resonance imaging (dMRI) data in rodent studi es. While dMRI provides va luable i nsights in t o bra in network org ani sation and w hite matter s t ructure, th e absence of unified proc e ssing protocols for rodents, unl ike in human i maging, ha s led t o v a riabi li ty i n r e sults and limited reproducibility. Mous e Flow fill s this gap by offe ring a robust, automated workflow t hat includes essential preprocessing steps such as denoising, e ddy cu rre nt and bias correction, brain e x t raction, and the reconstructi on of both diffusion tensor imaging (DTI) and q -ball imaging. Importantly, i t incorporates the Allen Mouse Brain Atlas (AM BA) [1] to ena b le anatomically guided extraction of sp e cific diffusion me trics and t rac t ography bundles. Bui lt on the Next flow DSL2 frame work, the pipeline is hi ghly adapta ble t o different dataset t ypes, confi gurable via J SON , and opt imised for re producibility , t ransparency, and ease of use, making it a valuable tool for pre c linical imaging research. In addition to MouseFlow, we also present m2m [2], a com ple mentary suite of Python-based tools developed to extend t he analytical possibil ities offered by the AMBA. The AMBA provides a uniquely detailed, high -re solution m ap of axonal projections in the mouse brain de rived from viral t racer experime n ts , repre senting a powerful ground t ruth re source for studying struct ural c onnectivity . However, access to and anal ysis of AMBA conne ctivity m aps have traditionally be en confined to s t atic visualisations on th e Allen Institute website, wit hou t t he a bility t o i nteractively combine it w i th user -acquired dataset s . T o overcome this limitation, m 2m enables interoperability between Allen and user data spaces by leveraging the Allen Software Developmen t Kit (AllenSDK) for data im port and ANTsPyX for high -precision im age registration. Using this framework, we compu te a tr a nsformation m a trix to map AMBA-deri ved project ion density maps onto th e na t ive space of user dMRI da ta, fac i litating direct v isual and analytical compari son such as overlaying tractography wi th viral t racer dat a. Conversely, the inve rse transformation allows researchers to trace any g i ven white ma tter locati on in their own da ta back to its c orr esponding re g i on and experimental context wi thin the Alle n Mous e Brain Common Coordinate Framework . This bidirectional mapping supports rich data i nteraction, includi ng visualisation through p la tforms l ike M I-Brain [3], and opens new avenues for multim odal i n tegration of tract ography and t r acer-based connectivity data. Togethe r, MouseFlow a nd m2m offer a compr e hensive and interope rable too lki t that sign ifi cantly adv anc es rodent neuroima ging research. By enabling sta nd ardi sed preprocessing and reproducible analysis workflows, al ong with i nter a ctive and bidirectional ma pping between diffusion and tracer -b ased datasets , they open n ew opportunities for exploring structural c onnectivity . T his integration not only enhances tractogra phy int erpret ation but also supports it s validation a gainst tracer -derived ground t ruth (Figure), fostering deeper insights into white matter organisation in th e m ouse brain. References: [1] Wang et al (2020) Cell 181:936-953 e 20; [2] A bou-Hamdan et al (2023) SPIE, San F rancisco, United States, p 12365 [3 ] Rhe ault et al. (2016) ISMR M Diff usion study group workshop, Lisbon, 2016. 26 !"#$%& ! '()%*"+* , -*+(#.$, /*+0% 12+(3 , +) , #4 %, 5 *16.#%, -.31"16 $63, ! *.1#+7*.849, " (, : *+1.; 3, 5*%.&, < .$"=.2+( , .7."( 3#, >"*%1 #, ? +*21.$, @$% 1#*"1.$, 32A 6$.2+(, B.( 76.7%, C.88" (7,8%* )+*A%=,"( ,.,/.%=".#*"1, @8"$%839,D6*7%* 9,?.3% , "#$%&' !( ) *+,-# )!( *+. 1,3,5 /!012*!3 %+4 1,4,5 /!5#++ 1%!62%7*+8%9 1 /!0*9*'!5*9 :#+ 2 /!;*)9*!-#< 2*+ 2 /!=>>* !-*48 #+*28 ,;*)9$ 2,3 /!6!01> #+!?* 9@%< 2 /!A19.1+1* !-*17+ %9 6 1 !"#$%&'( ")'"* +,-.)'",* /0( )('.0* 12.3()3 * 4"$-('"* 5!+/1467* 8"9.$: 2"):* %;* !"#$%&#$3 "$< 7* =%<.0* />(0,$") ?&* @%&9(:.07* A"0B% #$)"7* +#&:$ .0(.C* 2 8"9.$:2 "):* %;* !"#$%0%3<7* =%<.0* />(0,$") ?&* @% &9(:.07* A "0B%#$) "7* +#&:$. 0(.C* 3 !"#$%&'( ")'"* ="&".$ '>7* A# $,%'>*/>(0,$")?&* ="&".$ '>* 1)&D:# :"7* A "0B%#$) "7* +#&:$. 0(.C* 4 8"-"0%92 "):.0* 12.3 ()37* A #$,%'> * />(0, $")?&* ="&".$'>*1)&D:#:"7* A "0B%#$)" 7* + #&:$.0(.C* 5 8"9.$:2 "):* %;*E ." ,(.:$('&7 * F )(-"$&(:< * %; * A "0B%#$) "7*A"0B%#$)"7*+#&:$.0(.C* 6 8"9.$:2 "):* %;*!"#$%&#$3"$<7* =%<.0* / >(0,$")?& * @ %&9(:.07* A"0B%# $)"7*+#&:$. 0(.C* '(#*+=612+ ( ! 644)9*:%!2#4*21$*B# +!#C!59#4*D $!* 9%*!*+8!1: $!4#++%4B +.!E' 1:%!>*F%9!:9*4:/!&* 9B4)2*9 21+ *+:! 1+C%91#9! C9#+:*2! 2#J% K 1 ! ?#E%@%9 /! :9*4:#.9*&'%:'# 8! )$% 8K 2 ! M'1$ ! $:)8&*9%$! :' %! *44) 9*4 *+)* 2! @%9$)$! *):#>*:%8! 6 H! :9*4:#.9*&')2*B#+! G OP=0I! L +81+.$ ! 1+! *! Q R,<%*9,#28! J# *&&1+. ! E1:'!$) J8)9*2!.91 8!%2%4: 9#8%$!C#9!%@*2)*B#+! #C!&2*+ +%8!$) 9.14*2!9%$%4B# +K! C%#4+= 3 ! -STU! V9%,$)9.14*2! WM! -ST! E*$!* 4X)19%8! 1+42) 81+.! WO! MQ,E%1. ':%8!G@#7%2,$1Y%$!Z![ K\>>I !*+8 !>) 2B,$'% 22!81 ])$1#+ !-S T!G8- STI! 8*:*!E1: '!> )2B,J* +8!* 44%2%9*:%8!= VT! G^KW!>>_!1$#:9#&14!@#7 %2$ /!M=`MSZaa`W R[[!>$/QQ!1+:%92%*@%8!J[$/!J! Z!Q[[[!$`>>b /!W[! 8 19%4B#+$ /!*+8! JZW[[ [!$`>>b/!c[!819%4B#+$IK!8-ST!8*:*! E%9%!&9%,&9#4%$$%8! E1:'!- S:917W 3 /!H0; 4 /!6dM $ 5 !:#!4#99%4:!C#9!1> *.1+.!+ #1$% 6 /!31JJ$! 91+.1+. !*9:%C*4:$ 7 /!>#B# +!*+8! $)$4%&B J121:#.%+%1 :< K 10 -*+)* 2! M 9*4:#.9*&'%8!)$1+.! >) 2B,B$$ )%!4 #+$:9*1+%8!$&'%914*2!8%4#+@#2)B#+ 11 ! *+ 8! 1He O,^!&9#J*J121$B4!*2.#91:'>! 1 +! - S:917W K! M 9*4f1+ .! SeT$! C#9! 6 H! E%9%! > *+)* 22 14*2! &91 #9$ 2,12 K! 6):#> *:%8! M 9*4:#.9*&' %8! )$ 1+.! M 9*4:0 %. 13 /! *! 8 %%&,2% *9+1+. ! >%:' #8! J*$%8!#+! 2%*9+ 1+.! & %*f!H e O! # C! :9*4:! J )+82% ! $%.> %+:*B#+K!5#:'! 6H! :9*4:$! E%9%! 9%4#+$:9)4:%8!)$1+.! W[[[ ! $:9%*>21+ %$! * +8! J# :'!:9 * 4:$! E% 9%! 4#+@%9:%8! :#!:'9%$'#28%8! :9*4:!8%+$1 :*.% $!*$!J1 +*91$%8 !:9*4:!>*$ f$K! OP=0U! P#9:14 *2! $:1>)2*: 1#+! E*$! &%9C#9 >%8! )$1+. ! * ! J 1&'*$14 ! 4 )99%+: ! $: 1>)2* :#9/! 8%21@%9 1+.! J1*9 ! $ :1>)2* :1#+! :#! *8N*4%+ :! %2%4:9#8 %! & *19$! *:! R[! ?Y! E 1:'! [KR! >$%4! &)2$%!8)9* :1#+/!R!$%4#+8$!:9*1+ $/!*+8!4)99%+:$!)&!:#!Q[!>6K!==3!E*$!4#+:1+)# )$2#+1:# 9%8!C#9!*C:%9!81$4'* 9.%$!*+8!$%1Y)9% $/!+#:1+.!:'%19!:'9%$ '#28/!81$:9 1J):1#+ /! *+8! *+)2*: 1#+,&# $1:1@%! $1:%$! E%9%! %2%4:9# 8%! 4 #+:*4: $! E' %9%! $ :1>)2* :1#+! *:! 2#E ! 4)9 9%+:$! GW! >6 I! 1+ 8)4%8 ! 9%& 9#8)41 J2%! % 7&9%$$ 1@%! 2*+.)* .%! 8 %C141:$ ! G*+ #>1*/!1>&*19%8!$%+:%+4%!9%&%:1:1#+I!E1:'! 9% :*1+%8!9%4%&:1@%!2*+.)*.%!GC#22#E1+. ! @%9J *2! 4 #>>* +8$IK!0:1>)2*:1# +,+%.* :1@%!$1:%$! E%9% ! %2% 4:9#8%! 4#+:*4 :$!E'%9 %!$:1>)2 *:1#+!*: !'1.'!4)99 %+:$!G\, Q[!>6I/!* J#@%!*C: %9!81$4' *9.%!:'9 %$'#28 /!$'#E% 8!+#!%7&9 %$$1@%!2* +.)*. %!8%C141: $K!M'%$% !$:1>)2* :1#+!9%$ )2:$!$%9@ %8! *$!:'%! .9#)+8 !:9):' !C#9!%@* 2)*:1+ .!:9*4:# .9*&' *F%9,E'1:%! >*F%9!1 +:%9C*4%!4#99%$&# +81+.! :#!: '%!$B> )2*B#+! &#$1 B@%!*+ 8!+ %.*B@%!%2%4: 9#8%!2# 4*B#+$! E%9%!2#4*:%8! #+! MQ, E%1.':%8! -ST! 4#,9%.1$:%9%8! E1:'! :'% ! 8-STK! =*4'! &# 1+:! 4#+$1$:$! #C! W! MQ ,E%1.':%8! -S ! @#7 %2! 4)J %$! G1K%K! ^K g! >>! 1+! 81> %+$1# +I/! *&&9#71>*B+ .! :'%! %2%4: 9#8%! 4#+:*4:! $1Y%K! M'%$%! +:$!E% 9%!)$%8!*$ !:'%!$B> )2*B#+!2 #4*B#+$!C#9!:' %!:9*4:#.9*&'%!#@%92* &$!J%:E%%+!$B> )2*B#+, &#$1B@%/ !$B>)2*B#+ ,+%.*B@%!$1:%$!*2#+. !:'%!.9%*F%9,E'1:%!>*F%9!1+:%9C*4%!*+8!:' %!>*+)* 2!#9!*):#>*:%8!6H ! :9*4:!> *$f$! E%9%!4#> &):%8K! M 9*4:! #@%92*&! E1 :'! $B>)2*B#+ ,&#$1B @%!$1 :%$!8 %L+%$! :9)%! &# $1B@%$! GMVI/ !E '12%! +#+,#@% 92*&! 8%L+%$ !C*2$%! +% .*B@%$!GHd IK! M 9*4:!#@%92 *&! E1:'! $B>)2 *B#+,+% .*B@%! $1:%$! 8%L+ %$! C*2$%! &#$1B@% $! G HVI/! *+8 ! + #+,#@%92*& ! 8 %L+%$! :9)% ! + %.*B@%$! G MdIK! A%! :'% +! 4* 24)2*:%8U! V#$1B@%! V9%814B @%! h *2)%! GV VhI! Z! MV `GM ViHVI j! d%.*B@%! V9%814B@%! h *2)% ! GdVhI! Z! Md`GM diHdI /! H * 2$%,&# $1B@%! 9*:%! GHVSI! Z! HV `GHVi MdIj! H*2$%,+%.*B@%! 9*:%! GHdSI! Z! Hd`GHdi MVI/! C9#>! J#:' ! 6H! :9*4:#.9*&'%:'#8$ K! E%36$#3 U! 0)9.14*2! 9%$%4B #+! 4*9 91%8! # ):! 1+ 42)81+ .! $B>) 2*B#+,+ %.*B@%! 1+C%91#9! C9#+:*2! 2 #J%! G "#$%! &$'()#*(% ! * +8! *+:%91 #9! "# $%! )$( #+,-*# $(% j! J 2*4f! 8#F%8! 21+ %/! H1. KQ6I/! E1:'! + #! &#$:,#&%9*B@%! %7&9%$$1@%! 2*+ .)*.%! 8%L4 1:$! #J$% 9@%8K! k $1+.! O P=0! *$! :' %! C)+4 B#+*2! 9%C % 9%+4%! C#9! 18%+BC <1+.! 6 H! &9#N%4B# +$! :#! 59#4*D $! * 9%*/! >*+) *2! 6H! :9*4:#.9*&'*:%8!6H!:9 *4 :#.9*&'"$1%%(?1!*#+,-#,1 @A"&%( 7?1! =&$#+, 1@! #+4! A+1, #7?1! =' *-1@! $1,(& +%! (+! )51! (+B1$(& $! B$&+)#*! *&'18! .5 1! '*#/C! 4& D14! *(+1! (+4 (/#)1%!) 51! %-$,(/# *!$ 1%1/7& +! 3#$,(+ 8! B: ! E&$$1% "&+4( +,! /&$7/#*! 1*1 /)$(/#*! %73-*#7 &+!%()1%!%5&<+!&+!9:!$1+41$ ;!<()5!/*&%1A- "%!&B!)51!*1F!(+B1$(&$!B$&+)#*!*&'1!&?1$*#(4!<()5!'&)5!3#+ -#*!#+4!#-)&3#)14 !#$/-#)1!B#%/(/-*-% !=GH@!)$#/)&,$#"568 ! ?+(1$6 3"+(, =7&%9:,.)18% 8! >*+)* 2! :9*4:#.9*&'#+$:9*:%8! $)&%91 #9! $&%41 L41:< /! E1:' ! *! Q[[l ! V Vh! *+8! [l ! HVS/! >* f1+.! 1:! '1 .'2 *9f*J2%! &9%41$ 1#+! C#9! 18%+BC< 1+.! 2* +.)*.% ,+%.*B@%! 4#9:%7K! P #+@%9$%2< /! . $# /)01, , J*$%8!*):#>*:%8! :9*4:#.9*&' )4'!2#E%9! V Vh! *+ 8! *! '1.'%9 ! HVS!$)..%$B+.! 9%8) 4%8! &9%41$1#+ ! 1+! 18 %+BC<1+ .! 2*+ .)*.%,+ %.*B@%! 4#9:%7K! 5# :'! > %:'#8$!$'#E%8! '1.' ! HdS $/! $) ..%$B+. ! 21>1:%8 ! $%+ $1B@1:< ! 1+!8%: %4B+.!:'%! C)22!% 7 :%+:! #C!OP=0! 2*+.) *.%,&#$1 B@%! 4#9:%7K! M'%$%! L+ 81+.$ !$) & : !# )9! &9*4B4%! #C! 4#>J 1+1+.! %7&%9:,J*$%8 !> *+)*2 !6 H!: 9*4:#.9*&'*&&1 +.! :#! .)18%! $*C%9! $)9.14*2! 9%$%4B# +$! +%*9! :' %! 2*+.)* .%,8#> 1+*+:!1+C%91#9!C9#+:*2!2#J %K!M'% !%2%@*:%8!HVS$!E 1:'! . $#/)01, ,J*$%8 !*):#>*:%8!> %:'#8!$ )..%$:$!: '%!+%%8 !:#!9%L+%!:'%!6 H!:9*4:!8%L+1B #+!)+8 %92<1+ .! 1:$!8%@%2# &>%+:K! E%)%*%(1%3&, FG, O)]*)/! ?K! %:! *2K! "#)9+*2! #C! d%) 9#$)9.%9< /! Q[mGWI/! gcQ ,gaQ! G^[[ \Ij! HG, 04'1221+ ./! nK3K! 1)! #*8! I1-$&(3 #,1 /! ^gW/! QQ\ R[^! G^[^Q IK! IG ! M #)9+1% 9 /! "KOK! 1)! #*8! I1-$&( 3#,1 ! ^[^/ ! QQc QWa! G^[Qm Ij! J G ! "%+ f1+$#+ /! - K! 1)! #*8 ! H028 ! c^/! a\^,am [! G^ [Q^Ij! KG ! 6@*+:$/! 5K! 5K! 1)! #* 8 ! I1 -$&(3# ,1 ! Rg/! ^[WW,^[ gg! G^[QQI j! LG ! h %9**9:/! "K! 1)! #*8 ! I1-$&( 3#,1! Qg ^/! Wmg,g[ c! G^[Qc Ij! MG ! n%22+%9 /! =K! 1)! #*8 ! J KJ /! ac/! QR ag,QR\ Q! G^[Qc Ij! NG ! 6+8%9$$#+ /! "K!;K !S K! 1)! #*8! I1-$& (3#,1 !^ [/! \a[,\\ \! G^[[WI j! O G ! 6+8%9$$#+ /!"K! ;K! SK! 1)! #* 8!I1-$&(3#,1 !Q^R/! Q[ cW,Q[ a\!G^[QcIj! FPG !M )$B$#+ /!dK! "K! 1)! #*8 !ILM)C8 !^m/! QWQ [,QW^[ !G^[QQIj ,FFG ! "% )91$$% +/!5K! 1)!#*8!I1-$&(3#, 1 !Q[W/! gQQ,g^ c!G^[QgIj! FHG ! ( * +./! "K ( K- K! 1)!#*8!N &-$+# *!&B!I1 -$&%-$ ,1$6O! P14(#)$(/%; !Q mGRI/!R m^,c[R !G^[Qa Ij! FIG !A*$$%9: '*2/!" 8!1) !#*8!I1 -$&M3# ,1 /!Q\ W/!Wm,^ RW!G^[Q \IK , 27 Explori ng the m acaque p recentr al gyral white matter usin g 11.7T dMRI a* Fanny Darr ault; a,b* Guillaume Dannho2; c Maëlig Chauvel; c Cyril P oupon; c Iv y Uszynski; a,d Christophe Destrieux; a,d Igor Lima Maldonado; a Fr édéric Anders son ! a !"#$%&' ($)*!+&!, -.'(!/!01 2345!/!0678$#8!9' 7$#!:!1&.' -;(< =>$7)'&( &!7.)>-' (!=-#)'$F.)& +!&L.7EE7O/27PQ G! I M! :! C>&#&< G! K M! RM! 4&;' &(&#)7)$-# !-Q! $#+$%$+.7E! Q-' &E$6F!6 .(=E &(! $#! ;'$67'< G! ^M! , M! :!] -#8G!_ M!C M! I#! $#)' 7=-')$=7E! 6$='-( )$6.E7)$-#! ().+'$()& #(&#G! cM ! 3M! :! 2-#N7G! 5MZ! A@VWB! X2;'$#8&' G! 9&'E$#G! D&$+&EF&' 8G! @YYAZM!+- $d?YM?YYUe ??AYAUBYfAM! TM! c-'+- #G! 3M! 5M! et al. ! I! (-67)-/=-8#$)$%&! 7=)$-#! #&)\- 'N! 7E)&'# 7)&(! \$)>! &g&=) -'! '&8$- #(! $#! 6-)-' ! =-')& SM! Nature ! 617 G!BA? VBAa!X@Y@B ZM! Figur e 1: T ractog raphy of the fou r cat egories of fiber s of the left pr ecentr al gyrus (a ssoc iation, stria tal, com miss u ral and projecti on), with th e i r dist ribution on the w h ite ma t ter/ gre y matte r interf ace and thei r rel ativ e am ount in per centage s 28 Micro- and macrostructur al fiber tract chang es during pediatric posterior fo ssa tumor sur gery . Authors !" #$%&"'()(")%**%+,"-. /01/"2,3$&, ")("2%345%36%&"-.1/"'%*78"9(":8;$&6"-.1/"<,, 3=%&":("> %?@$&"-A 1/"98@=%3"-# (1"B$% @C%&D@$4 "-./E1"F*5 %3=8"G%" >@7,"-0/H 1 * /" ),&&$%" # ("9$I&% &"-01 * . A(iliation s !".1"G% J,3=+%& ="8K"#%L$,=3$7"B%@38 MN&78 *86O /"#3$&7 %44" ??@+ :4$)" /+'(:)%# $).+'&3# ($)&$+6& 33%+# 49&$+<'AB? @+34$/ ($1 C+?0)3 +%22& 83+%3 3(3 39("#+&6+) "#$%& '($% #)*(+'0 13)&2&/) .%2+. 0%"/(3 +$( 2%#)* (+#&+ '$( &'($ %#)*(+: %#%+80)2 (+9)")9)5 )"/+#0 (+.&"6& 4":)"/+(D (.#+&6+-$ %)"+30) 6#+#0% #+$(34 2#3+6$&9 +.$% ")&#&91 C+?0)3+3 #4:1+)"* (3#)/% #(3+'$ (;+#&+ )"#$ %&'($ %#)* (+.0%"/ (3+)"+=> ??+9%. $&;+%": +9).$& 3#$4.#4$ (C+ + Method s E>;)9 %/(3+& 6+FG+'AB?+' %#)("#3+ <%* ($%/ (+%/(H+I CJ ± KC J+1(%$3 L+B)/C+M %+N+-@+8( $(+%.74 )$(:+43 )"/+%+F; ? (32%+)"# $%&' ($ %#)*( +E>!+3.% ""($+B+. &)23+T+0( %:+.2%9' +!+<:E >!@+]+:( .&"* &24#)&" +T! 3@+6 &$+=> ??+$ (.&" 3#$4 .#)&"+8( $(+#0(+: ("#%#(+ "4. 2(43+ T!3+8 ($(+3( 9);9%"4 %2+3(/9 ("#%#)&" 3+&6+#0(+#4 9&$+<`9%$ #+R$430L+R $ %)"2%- L+E4").0 L+\($9%" 1@+%":+#0( + .&$' 43+.%22 &34 9+ ??+%": +aB+*&249 (3+8($ (+"&$9 %2)5(:+# &+ 34'$ %#("#& $)%2+8 0)#(+9% ##($+*& 249( C+A% )$(:+[) 2.& _&"+3)/ "(:;$ %"U+#(3 #3+8($ (+43(:+ #&+.& 9'%$( +'$(;+#& +)"#$% &'($ %#)*(+: %#%C+ E).$ &3#$4. #4$% 2+9(# $).3+ )".24:(: +6$%. #)&"% 2+%")3 &#$&' 1+ ??+%":+aB + ??+)"+#( $93+&6+-& #0+* &249 (++:(. $(%3( :+- 1+dCWc +<'+X+GCGG K@C+e &9' %$)"/+ '$( ;+#&+)"#$ %&'($ %#)* (+:%#%L +#0(+%2&"/ +#$ %.#+%"%21 3)3+&6+B a+%": +E=+$ (9%)"( :+3#%-2(+ %2&"/+#0(+a B L+8) #0+9)")9% 2+*%$) %#)&"+ ??+8 ($(+.0% $ %.#($)5 (:+-1+0 )/0+f 4.#4%#) &"3+<:%# %+"&#+30& 8"@C+?0(+ =>??+3 0&8(: +/$(%# ($+ *%$) %-)2) #1+)"+E =+8)#0)" +#0(+. ($(-(2 2%$+3(/9 ("#+.&9' %$(:+# &+#0( +.&$#) .%2+3 (/9("# L+'%$#).4 2%$21+3(("+) "+#0( +.&"#$ %2%#($ %2+=> ??+ ??+30 &8(:+) ".$(%3 (:+*%$)%- )2)#1+)"+E= L+(3'(. )%2 21+)"+) #3+.( $(-(22% $+3(/9( "#+"(%$+#0( +$(3(. #)&"+.%*) #1 L+34// (3#)"/ +2&.%2)5 (:+ 9).$ &3#$4. #4$% 2+.0%"/( 3C+?0(+9 %.$&3 #$4.#4$ %2+:(.$ (%3(+8 %3+9&$ (+'$&"& 4".(:+)" +#0(+=> ??+#0%"+)" +#0(+aB L+34 //(3 #)"/+%"+(D (.#+&6+'AB? + 34$ /($1+&"+#0 (+=>?? C+?0(+$ (:4.#)&" 3+&-3($* (:+)"+-� +#$%.# 3L+)". 24:)"/+#0( +%"%#&9 ).%221+: )3#% "#+aB L+9%1+$ (f(.#+/2 &-%2 +(D(.#3+3 4.0+%3+ :(.$ (%3(:+) "#$%& '($% #)*(+`S >+&$+"&";2 )"(%$ +-$ %)"+30)6#C +?0)3+.&4 2:+$(3 42#+6$ &9+.($ (-$&3 ')"%2+f4): +(*%.4 %#)&"+%": +%2#($ (:+-$ %)"+ .&"3 )3#( ".1+:4(+# &+/$% *)#1+&"+#0 (+-$% )"+)"+ #0(+' $&"(+'& 3)#)&"C+T* ($% 22L+&4$+$ (342# 3+0)/02)/0 #+#0(+ '%$# 21+4"3&2* (:+.0%2 2("/(+&6+% .0)(*)"/+ $(2 )%-2( +)"#$ %&'( $ %#)*(+# $%.# &/$%' 01 L+(3'(. )%22 1+)"+#0(+.& "#(_#+& 6+%"+&'("+ 3U4 22L+(*(" +80("+43) "/+.& "3)3#("# +#$ %.#&/$ %'01 +'%$ %9(# ($3C+ ? %U ("+#&/( #0($ L+#0(+'$)9 %$ 1+(D( .#3+& 6+'(:)%# $).+'&3# ($)&$+6& 33%+3 4$/($1+8 ($(+&- 3($*(:+ 9%)"21+)" +9).$& 3#$4 .#4$ %2+$ %#0($ +#0%" + 9%.$ &3#$4 .#4$% 2+9(%34 $( 3L+8)#0+2 &.%2)5 (:+.0 %"/(3+)" +#0(+=> ??+"(%$+#0 (+$(3 (.#)& "+.% *)#1+%":+3 #%-)2)#1+) "+%"%#& 9). %221 +:)3# %"#+aB+#$ %.#3 C+ !9'$ &*)"/+# 0(+$ (2)%-)2)# 1+&6+)" #$%& '($ %#)* (+$ (.&" 3#$4 .#)&"3+8)2 2+$(74 )$( +#(.0 ").%2+%:* %".(3+# &+)9' $&*( +`S>+%": +:%# %+74%2)#1 C+ Literature !"[.\"]@8 "%=",*("0^ 0^"L8$!" .^(.^._ `I(&%@38$+ ,6%(0^0^(.._aE b"[0\"G$% L3$7D4%&" %=",*("0^ ^a"L8$c". ^(.^._ `I(&%@38$+, 6%(0^^a(^.(^EH "[A\"V$**8=" %=",*(" 0^0A"L8 $!".^(.^ ._`I(+% L$,(0^0A (.^0dba "[E\"G%4$ e,&"%=",*("0 ^^_"L8$!" .^(.^._ `I(&%@38$+ ,6%(0^^_(^.(^0. "[H\"G%4=3 $%@Q"%=", *("0^.^ "L8$!" 10.1016 /j.neuro image.2 010.06.0 10 [6] Zh ang et a l. 2018 d oi: 10.1 016/j.ne uroimag e.2018. 06.027 [7 ] Yeh et al. 2020 doi: 10.1 016/j.n euroima ge.2020 .117329 [7] Leeman s et al. 2 009 Expl oreDTI "" " " " Fig.1 S tudy set-u p. X.MC%$6D=%L"-X.C1" $+,6%4"8K" ,".E"O%,3"8 *L"6$3*"C $=D","E=D " ;%&=3$7*%"=@ +83"5%K83%"3%4%7=$8& "-F /" J3%8J%3,=$;%1",&L",K=%3 "4@36$7,*" 3%4%7=$8&"5@="5 %K83%"7*84@3%"8K"=D%" 4e@**"-V/"$&=3,8J%3, =$;%1("XD%"3%L ",338C" $&"F"$&L $7,=%4"=D%"=@+ 83"$&M4$= @("XD%" J,=$%&="$4"J 38&%"J84$=$8& %L"$&"=D% " GNWN"4@36$7,*"D %,LMK3,+%"-R1( "XD%" =C8"Wf"78 $*4",3%"=D%& "J*,7% L",&=%3$8 3" ,&L"J84=%3$ 83"8K"=D %"J,=$%&=4Y "D%,L"-G 1(" Fig. 2. Examples of tract reconstru ctions . R838&,*",& L"4,6$==,*";$ %C4"8K"g5 %3" 3%78&4=3@7=$8 &4"$&"," aMO%,3M8*L"58O"C$= D"," J$*87O= $7",4=387O=8+ ,("XD%"* %K="78* @+&"4D8C4" J,3="8K"=D %"L%&=,=%M3@ 538M=D ,*,+$7 "=3,7="-GWXX1" 83$6$&,=$& 6"$&"=D% "*%K="L% &=,=%"&@7*%@ 4",&L" =%3+$&,=$& 6"$&"=D%" 78&=3,*,=%3,*"D%+$4JD% 3% (" XD%"3$6D ="78*@+ &"4D8C4"=D% "*%K=", 37@,=%" K,47$7@*@4"-Ff 1("" Fig. 3. Along t ract analysis. "<%,& "L$h@4$; $=O"7D,& 6%4"-i" 0 . 005), compared to the trunk segments of the tract. Atlas registration is more prone to pro duce bundle segments outside of the white matter mask than BundleParc or T ractography ( p < 0 . 005). Visually , while no metho d provided ”degenerate” reconstructions due to the displacement of tissues caused by the tumour, tractography seems to provide ”fuller” bundles compared to BundleParc, which in return seems to pro duce ”neater” parcellations. Discussion and con clusion Ov erall, we rep ort a fair agreemen t betw een our newly prop osed metho d, BundleP arc, and well-established bundle delineation methods. Overall, BundleP arc was not more in disagreement with tractography or atlas registration than tractography is with atlas registration. While discrepancies were noted b etw een methods (i.e. most ANOV A tests rep orted statistically significant di ! erences between scores), no metho d exhibit catastrophic failures and every method was in fair (but not total) agreement. It should be noted that a large p ortion of the scores were obtained on bundles p ossibly far and unimpacted b y tumoral deformation. While these may act as ”control” cases, assessing the reconstruction similarity betw een met hods in ”normal” white matter fibres, future w ork should directly focus on clinica lly relev ant bundles, located for example in the same hemisphere as the tumor. All in all, this study demonstrates that machine learning-based tract segmentation metho ds for di ! usion MRI can achiev e robust repro ducibility , even in tec hnically challenging brain tumour cases. References [1] P . Neher et al. “Radiomic tractometry reveals tract-sp ecific imaging biomarkers in white matter” (2024). [2] P . Neher et al. “Hyp erplane-based tract parcellations for improved anatomical coherence in tractometry ”. 2024. [3] K. Kamagata et al. “Adv ancements in di ! usion MRI tractography for neurosurgery” (2024). [4] A. Th´ eberge et al. “Lab elSeg: automatic tract labelling without tractography”. 2025. [5] J. W asserthal e t al. “T ractSeg-F ast and accurate white matter tract segmen tation” (2018). [6] H. Aerts et al. “Mo deling brain dynamics in brain tumor patien ts using the virtual brain” (2018). [7] H. T akem ura et al. “Ensemble tractography” (2016). [8] E. St-Onge et al. “BundleSeg: A versatile, reliable an d repro ducible approach to white matter bundle segmentation”. 2023. [9] F. Rheault. Population a ver age atlas for R e c obund lesX (1.1) . 2021. 31 Linking Continuous and Interrupted Human Central Sulcus to the V ariability of the Superficial White Matter using a β-V ariational AutoEncoder C. Mendoza 1 , J. Chavas 1 , A. Dufournet 1 , J. Laval 1 , M. Guevara 1 , Z. Y . Sun 1 , A. Grigis 1 , P . Guevara 2 , D. Riviere 1 , J.-F . Mangin 1 1 Université Paris-Saclay , CEA, CNRS, BAOBAB, Neurospin, Gif-sur-Y vet te, France 2 Faculty of Engineering, Universidad de Concepción, Concepción, Chile Introduction Superficial White Matter (SWM) and cortical folding can be seen as two endophenotypes of brain development, reflecting a deep structural interdependence that shapes the architecture of the cerebral cortex. Previous works have studied the relationship between the SWM and sulcal anatomy [1–3]; however , their morphological and functional interplay remains poorly understood. Here, we show for the first time a relationship between changes in short association fibers, Central Sulcus (CS) morphology and brain function in the right hemisphere. We demonstrate this by focusing on the transition from a single- to a double-knob configuration, an anatomical variation previously associated with dif ferences in hand sensorimotor activation [4]. For this purpose, we leverage a β- V ariational AutoEncoder (β-V AE) to obtain meaningful representations of short-range cortical connectivity . Additionally , to illustrate rearrangements in short fiber bundle organization, we study the rare case of an interrupted CS, in which hand sensorimotor activation is mapped to a bridging gyrus connecting the precentral and postcentral regions [5]. Methods We analyzed 333 subjects from the HCP database [6], including seven subjects with an interrupted CS in the right hemisphere. First, we calculated the SWM tractography [7] based on MRtrix3 software [8]. Then, we segmented the fibers surrounding the right CS using gyral crown lines, derived from the white matter mesh with the ABLE software [9] (Fig. 1-A). Fiber connectivity profiles, based on vertex-wise endpoints density , were computed on the white mesh and projected onto the FreeSurfer registered sph ere (Fig. 1-B) [10]. Then, these profiles were transformed into a 2D angular grid and used to train a β- V AE with all the subje cts (Fig. 1-C). Ne xt, the β- V AE embeddings were used to compute a pairwise distance matrix, which served as input to the ISOMAP algorithm as in [4]. The β- V AE and ISOMAP parameters were selected based on a maximum correlation with a CS-shape-based embedding describing a transition between single to double knob configuration (r=-0.34, p=2.31e-05) [4]. T o analyze inter-subject dif ferences, moving averages of the connectivity profiles were computed along the ISOMAP axis. Regions of interest were defined based on dif ferences between the first and last averages (Fig. 1-D), and were subsequently used to segment dorsal and ventral fiber bundles (Fig. 1-E). Finally , to assess fiber reo rganization in subjects with an interrupted CS, we used a U-shapedness index, defined as the ratio of fiber length to the Euclidean distance between its endpoints. Lower values of this index, approaching 1, indicate straighter fiber trajectories. T o obtain a single value per bundle, we computed the average U-shapedness across fibers. Fig 1. Methodology to study short fiber bundles driving inter-subject dif ferences. In the ISOMAP axis: cyan (continuous CS), different colors (inter rupted CS). Results We found a negative correlation between the ISOMAP coordinates and the number of fibers in the dorsal bundle (r = -0.57, p = 1.53e-30) (Fig. 2-A). Since this bundle was located near the hand-knob, average fMRI left-hand motor maps are shown for subjects at both extremes of the ISOMAP axis, along with the corresponding average CS (Fig. 2-B). Notably , the group at the rightmost end of the ISOMAP axis exhibited a more upper positioned knob—typical of the doubl e-knob configuration—and a reduced global activation volume. A positive correlation between ISOMAP coordinates and the number of fibers in the ventral bundle was found (r = 0.45, p = 2.86e-18) (Fig. 2-C). Finally , the dorsal bundle mapped directly or near the interruption of the CS, with a high proportion of fibers having a more straight shape for most interruptions (p = 0.021, Mann-Whitney U), as shown from the left shift of the U-shapedness distribution and in the zoomed view of subject 138231 (Fig. 2-D). Fig 2 . (A) Results for the dorsal bundle. (B) Average CS and fMRI left-hand motor activation, along with an average streamline per subject representing the dorsal bundle. (C) Results for the ventral bundle. (D) Histogram of dorsal bundle averag e U-shapedness for continuous (light blue) and interrupted (orange) CS. Conclusions We demonstrate for the first time a link between changes in short fibers bundl es, CS morphology and extent of functional areas in the right hemisphere. Our findings align with a previous work showing reduced left-hand motor activation when the right CS transitions from a single- to a double-knob configuration [4], which may correlate with the lower number of fibers observed in the dorsal bundle. Conversely , the increased number of fibers in the ventral bundle may reflect the emergence of a second knob in the ventral portion of the CS, although this hypothesis requires further investigation. Subjects with an interrupted CS had straighter fiber trajectories in the dorsal bundle, which is interesting given prior findings that sensorimo tor fMRI contrast localizes in the bridging gyrus, suggesting that such interruptions may drive a reorganization of the underlying fiber architecture. While CS interruptions are rare (~1% prevalence [5]), they occur more frequently in variable regions such as the temporal lobe [3], showing the potential of our framework to disentangle the anatomo-functional relationship between SWM and cortical folding. Acknowledgements This work was funded by the National Agency for Research and Development (ANID) / Scholarship Program / DOCTORADO BECAS CHILE / 2024 - 72240205. HCP Data were provided by the Human Connectome Project, WUMinn Consortium (Principal Investigators: David V an Essen and Kamil Ugurbil; 1U54MH091657) funded by the 16 NIH Institutes and Centers that sup port the NIH Blueprint for Neuroscience Research; and by the McDonnell Cen ter for Systems Neuroscience at W ashington University. References [1] M. Guevara et al., “Disentangling the variability of the superficial white ma tter organization using regional-tractogram-based population stratification,” Neu roImage, vol. 255, p. 1 19197, Jul. 2022, doi: 10.1016/j.neuroimage.2022.1 19197. [2] A. Pron, C. Deruelle, and O. Coulon, “U-shape short-range extrinsic conn ectivity organisation around the human central sulcus,” Brain Struct Funct, v ol. 226, no. 1, pp. 179–193, Nov . 2020, doi: 10.1007/s00429-020-02177-5. [3] C. Bodin, A. Pron, M. Le Mao, J. Régis, P . Belin, and O. Coulon, “Plis de passage in the superior temporal sulcu s: Morphology and local connectivity ,” NeuroImage, vol. 225, p. 1 17513, Jan. 2021, doi: 10.1016/j.neuroimage.2020.1 17513. [4] Z. Y . Sun et al., “Linking morphological and functional variability in hand movement and silent reading,” Brain Struct Funct, vol. 221, no. 7, pp. 3361–3371, Sep. 2015, doi: 10.1007/s00429-015-1 106-8. [5] J.-F . Mangin et al., “‘Plis de passage’ Deserve a Role in Models of the Cortical Folding Process,” Brain T opogr, vol. 32, no. 6, pp. 1035–1048, Oct. 2019, doi: 10.1007/s10548-019-00734-8. [6] D. C. V an Essen et al., “The Human Connectome Project: A data acquisition perspective,” NeuroImage, vol. 62, no. 4, pp. 2222–2231, Oct. 2012, doi: 10.1016/j.neuroimage.2012.02.018. [7] D. Shastin et al., “Surface-based tracking for short association fibre trac tography ,” NeuroImage, vol. 260, p. 1 19423, Oct. 2022, doi: 10.1016/j.neuroimage.2022.1 19423. [8] J.-D. T ournier et al., “MRtrix3: A fast, flexible and open software framework for medical image processing and visualisation,” NeuroImage, vol. 202, p. 1 16137, Nov . 2019, doi: 10.1016/j.neuroimage.2019.1 16137. [9] A. Fernández-Pena et al., “ABLE: Automated Brain Lines Extraction Ba sed on Laplacian Surface Collapse,” Neuroinform, vol. 21, no. 1, pp. 145–162, Aug. 2022, doi: 10.1007/s12021-022-09601-7. [10] B. Fischl, “FreeSurfer ,” NeuroImage, vol. 62, no. 2, pp. 774–781, Aug. 2012, doi: 10.1016/j.neuroimage.2012.01.021. 32 !"#$%& ! '()*(* +%,-.% ,*,"/-0"1)*234*5+ 1#1.1$*(.6"%7%*158.* +(,"(81) * # +(.#19+(56:* .1; 5(+(<$%*#1* #610% *+ % .1)0#+-.#%,*-0")9*(* ; -$8= 06%$$*,"/-0"1) * 2 34*(.>-"0"81) * ?1+*#%;51+($*$1< %*%5"$% 50:*0-+9%+:*5 $())")9 *(),*0- +9".($*";( 9%=9-",() .%@* "#$%&' !( ) *+,-# )!( *+. 1,2,4 /!"0*+!1 '%+ 3 /!2)34!56' 0770+. 5 /!870$#+ !93 *: 6 /!903.0+0* !-*0;+ %3 6 1 !"#$%&'( ")'"* +,-.)'",* /0()( '.0* 12.3()3* 4"$- ('"* 5!+/1467* 8 "9.$:2" ):* % ;* !"#$%&#$3"$ < 7* =%<.0* / >(0,$")? &* @%&9(:.07* A"0B%#$) "7* +#&:$.0(.C 2 !"#$%&'( ")'"* ="&".$'>7* A#$,%'> * />(0,$") ?&* ="&". $'>* 1)&D:#:"7* A"0B% #$)"7* +#&:$.0(. C* 3 8"-"0%92 "):.0* 12. 3()37* A#$, %'>* />(0,$" )?&* ="&".$'>* 1)&D:#:"7* A"0B %#$)"7* +#&:$.0 (.C* 4 8"9.$:2 "):* % ;* E.",(. :$('&7* F)(-"$&( :<* %;* A"0B %#$)"7* A "0B%#$) "7* +#&:$.0(. C* 5 8"9.$:2 "):* %;* =.,( %0%3<* .) ,* =.,(%0% 3('.0* 4'(") '"&7* G . ),"$B(0 :* F)(-"$& (:<* A",('.0 * /"):"$ 7* ! .&>-(00"7* H!7* F )(:",* 4:.:"&C* 6 8"9.$:2 "):*%;*!"# $%&#$3" $< 7*=%<.0*/> (0,$")?&*@ %&9(:.07*A" 0B%#$)" 7*+#&:$.0(.C * 4)#+1,-.81 )* <0=)$ 0#+!-> ?!@A-> ?B!43*64#.3*&':!0$!*!C*7) *D7%!4## 7!E#3!&3%,$)3.06*7!& 7*++0+ ./!'% 7&0+.!4# !*C#0A!$)3.06*7!F '04%!G*H%3!43*64!0 +I)30%$ J 1,2 !84!#)3!'#$& 04*7/!%;&%34, .)0A%A !G*+) *7!>K?,D *$%A!43*64#.3*&':!)$0 +.!G)7 L,$'% 77!A-> ?!'*$!D %%+!0+$43 )G%+4*7!0+ !C0$)*70 $0+.!4' %!#&L6 !3*A0*L#+$!@K >B!E#3!4%G&# 3*7!7#D%!%& 07%&$:!$)3.%3: /! $)&&# 3L+.!D #4'!&3%,$ )3.06*7!&7*+ +0+.!* +A!0+43*#&%3*LC%!.)0 A*+6% !4#!&3%$%3 C%!C0$)*7 !E)+6L# +J 3 !M#F%C%3 /!G )7L,$ '%77!*6 N)0$0L# +!&#$ %$!*!D* 330%3!4#!F 0A%$& 3%*A! *A#&L# +!A)% !4#!$6*++% 3!'*3AF*3%!70G 04*L#+$!*+A !3%$43064%A!670+ 06*7!$6*+! LG%!*4!G *+:!6%+43%$J!O '0$!$4)A: !0+C%$L.*4%$!F'%4'%3!3%A) 6%A!A- >?!&3#4#6#7$ /!$)6'!* $! '*7C%A!* 6N)0$0L #+!LG %!#3!$0 +.7%,$' %77!$*G &70+. !*4!7#F!#3 !'0.'!D ,C*7)%$/!6*+!& 3#A)6%!K >!43*64#.3*&':!#E!6#G& *3*D7%!N)* 704:!4#!4' #$%!3%6#+$43) 64%A!)$0+ .!*!G) 7L, $'%77!& 3#4#6#7/!E#3!$)3.06*7!)$ %J! 2%#61, 0* P*L%+4$Q->?R!->?! A*4*! E3#G! SC% ! 6'07A 3%+! F04' ! A3)., 3%$0$4*+4! E#6*7! %&07%& $:! F'#! ) +A%3F% +4! 4%G&# 3*7! 7#D%! %&07%&$:! 3%$% 6LC%! $) 3.%3:! *4! 4' %! >#:*7! 1'07A 3%+T $! '# $&04*7! F%3%! 0+67)A %AJ! 877! ) +A%3F% +4! K>! 43*64#.3*&':! E#3!& 3%,$)3.06*7! &7* ++0+. !* +A! 0+43*,#&% 3*LC%!0G *.%! .)0A* +6%! *$$0 $L+.! $)3.06*7! %;%6)L#+J ! O 3*64#.3*&':!F* $! D*$%A ! #+! ) $0+.! UO! G )7L,$' %77! A ->?! *6N)03%A! )$0+.! G)7L,D *+A! VP?! @W JU! G GX! 0 $#43#&06! C#; %7$ /! OV QO>YZZ QU[\\! G$/]]! 0+4%37%*C%A! D\ $/! D Y]\\\! $QGG^ /! U\ ! A03%6L #+$/! *+A! DYU\\\ !$QGG ^/!_\!A 03%6L#+$B /!&7)$! *!3%C%3$%,&'*$%! D\!&*03 J! O 8!Y ZJ[!G0 +)4%$J!O' 0$!#30. 0+*7!A*4*$%4 !0$!3%E%33%A!4#!*$! ,23 4*0.6%; %*A !@ #30.0+* 7,W,`\B J! a#)3!%;&%30G %+4*7!A-> ?!$6'%G %$R!F0 4'!3%A)6% A!&3#4#6#7$!F%3%!A %30C%A!E3#G! $6'%G% !8R!! ,234*0 .6%;% *B !@'* 7C%A,W,b[ BR![!D\ $/!DY] \\\!$QG G^/!] [!A03%6L# +$/!*+A !DYU\ \\!$QG G^/!U\ !A03%6L#+ $/!O 8 !Y!UJZ[ !G0+)4%$ ! ,234*0 .6%;% *' !@'0. ',D,_\ BR![!D\ $/!DYU \\\!$QG G^/!_ \!A03%6L# +$/!O 8!Y![! G0+)4%$J !! ,234*0 .6%;% *C* @'0 .',D,b [BR![!D\ $/!DYU \\\!$Q GG^/!b [!A03%6L# +$/!O 8!Y!UJ Z[!G0+ )4%$J! ,234*0 .6%;% *D !@7#F,D,U \BR![!D \$/!DY] \\\!$Q GG^/!U \!A03%6L# +$/!O 8!Y!WJ [!G0+) 4%$J!! 877! A->?! A*4*! F%3%! &3%,&3#6% $$%A! F04'! ->4 30;U 4 /! a5c 5 /! 8 dO $ 6 ! 4#! 6#33%64! E#3! 0G *.0+. ! + #0$% 7 /! e 0DD$! 30+.0+ .! *34%E*64$ 8 /! G #L#+ ! * +A! $)$6%&L D0704:! A0$4#3L#+ 9,10 /! * +A! D0*$!S% 7A!0+' #G#.%+ %04: 11 J! O 3*64#.3*&':R! K&L 6! 3*A0*L #+! 43*64#.3*&':! E3#G! 4'%! #&%3*L+.! '%G0$& '%3%! F* $! & %3E#3G%A! )$0+. ! 4' %! 0 aK<,W! &3#D*D070 $L6! * 7.#304'G ! 0+ ! - >430;U J 4 ! aK< $! F% 3%! %$LG*4%A! ) $0+.! G )7L,$ '%77! G )7L,L $$)%! 15< 12 ! E#3! $6'% G%$! 8 ! *+A ! f/! *+A ! $0+.7 %,$'%7 7! U,L$ $)%! 1 5< 13 ! E#3! $6'% G%$! 1 /! K ?$! A%S+ %A! #+ ! 4'%! #30.0+* 7! A*4*! F%3%! 70+%*37 :! 43*+$E#3G%A! 4#! %*6'! 3%A)6%A ! A-> ?! $&*6% ! E#3! 6#+$0$4%+4! 43*6g0+.J! 8 77! #4'% 3! 43*64#.3*&':! &*3*G%4%3$! F%3%! ' %7A! 6#+ $4*+4J! a#3! %*6 '! %;&%30G%+4*7!A ->?!$6 '%G%/ !K>!43*64#.3*&':!F*$!3%&%*4%A!] \!LG% $J!877!43*64!G* $g$!F%3%!70+% *37:!43*+$E#3G%A!D *6g!4#!4' %!#30.0+ *7!0G* .0+.!$& *6%!E#3!6#G& *30$#+J ! 8+*7:$0$ R!O 3*64$!E3#G!4'%!#30.0+ *7!W,$'%7 7!$6'%G% !@8B/!)$%A!0+!$) 3.06*7!&7*++0 +./!$%3 C%A!*$!4'%!3%E%3%+6%J!<06%!50G 07*304:!@< 5B!$6#3%$!F%3%!6*76)7*4%A!4#!*$$%$ $!$&*L*7! #C%37*&! D %4F%%+! 3%E%3%+6%! K> ! 43*64$! *+ A! 4'#$ %! .%+%3*4%A! E3#G! % *6'! 3%A) 6%A! $6 '%G%! @fh?!$6' %G%!* 63#$$!*77! &*L%+4$/!* +A!$' #F$!%;*G&7%!K >!43*64#.3*&':!E#3!#+%! &*L%+4J!!8 63#$$!*77! SC%!6*$%$ /!4'%! G%A0*+ ! <5! $6#3%$! 6#G& *30+.! 4'%! E)7 7! &3#4#6#7! @56'%G% ! 8B! 4#! 4'%! 3%A) 6%A! & 3#4#6#7$! F%3%R! 8! C$! f! Y ! \Jk]! l?m>! \ Jk[h\J` \n/! 8! C$! 1! Y ! \JkW ! l\Jk_ h\J`\n /! 8! C$ ! ?!$6' %G%$!:0%7A %A!K>!43*64#.3*&':!G#$4!6#G&*3*D7%!4#!4'%!E)77!4F#,$'%77!&3#4#6#7/!#)4& %3E#3G0+.!D#4 '!4'%!'*7C%A!4F#,$'% 77!*+A!7#F! D,C*7)%! $6'% G%$J! M0 .'%3! A03%6 L#+*7! $6 '%G%! @ 0J%J! _\! o! b [! A03%6L#+ $B! &%3E#3G$ ! D%H%3! E#3! '0.'! D,C*7)% ! A*4*J! O'%$%! S +A0+. $! #=%3! &3%70G0+* 3:! 0+$0. '4$! E#3!A %$0.+0 +.! LG%,%p 60%+4! A- >?! &3#4#6#7$ ! 4'*4! G* 0+4*0+! K>! 43*64#.3*&':!N)* 704:! E#3! 4%G& #3*7! 7#D%! %&07%&$:! $)3.%3:! &7*++0+. J! a)34' %3! $4)A0% $! F0 4'! 7*3.%3! $) 3.06*7! 6#'#3 4$! *3%! +%%A% A!4#!C*70A*4%!4'%$%!S+A 0+.$J!54) A0%$!*3%!*7$# !+%%A%A !4#!*$$%$$!F'%4 '%3!#D$%3 C%A!A0=%3%+6%$!0+ !<5!$6#3%$!43*+$7*4%!0+4#!A0=%3%+6%$!0+!43*64#.3*&':!)L704:!E#3! $)3.06*7!A% 60$0#+, G*g0+. /!*+A !%C*7)*4%!&%3E#3G*+ 6%!*63#$$! #4'%3!6 70+06*77:! 3%7%C*+4!43*64$J! 3%?%+%).%0&*E F !V$ $*:%A/!9 J! ?J! et al. ! Neu roImag e Cl in J!] [/!_ [`,_ZW !@W \]ZBq! GF ! ( *+. /!"J ( J-J! et al. ! Physics in Med icine & Biolog y /!_ _@][B/! ][O> \]! @W\W]B J! HF ! ( *+. /! "J ( J- J! et al. ! Fron3ers in N euros cience /! ]U/!] W[b! @W\]`B J! IF ! O #)3+ 0%3 /! "JJ! et al. Neuroima ge !W\/!kZ\,kk k!@W\\UBq ! EOF !8+A%3$$#+/!"J!cJ!>J! et al. Neuroim age !]W[ /!]\_U,]\Z k!@W\]_Bq ! EEF !O ) $L$#+/!dJ!"J! et al. N4Itk. !W`/!]U]\ ,]UW\!@W\ ]]Bq! EGF !"%) 30$$%+ /!fJ! et al . Neuro image !]\U/!b ]],bW_ !@W\]b Bq! EHF !< '#77*+ A%3 /!O J ! et al. IS MRM d iffusio n MR I worksh op ![!@[B /!@W\]_ BJ! 33 Combining trac t ography and intracrania l EEG to defin e t he struc t ural epileptic net w ork Arash Sarshogh i 1,2 , Alexis Robin 8 , Denahin Toffa 1 , Guido Guber man 7 , Emna Guiben e 1,2 , Arman Sarshoghi 4 , Albert Guillemette 4 , Maxime Desco teaux 3 , Fran•ois Rheault 3 , Elie Bou Assi 2 , Dang K. Ng uyen 2,5 , Guillaume Th eaud 1 , Sami Obaid 1,2,6 1 Neuroscience Research Axis, University of Montreal Hospital Rese arch Center (CRCHUM), Montreal, Quebec, Canada, 2 Department of Neuroscience, University of Montreal, Montreal, Quebec, Canada, 3 Department of Informatics, Sherbrooke University, Sherbrooke, Quebec, Canada, 4 Department of Medicine, University of Montreal, Montreal, Quebec, Canada, 5 Department of Neurology, University of Montreal Hospital Center (CHUM), Montreal, Quebec, Canada 6 Division of Neurosurgery, Department of Surgery, Univer sity of Montreal Hospital Center (CHUM), Montreal, Quebec, Canada 7 Department of Neurology and Neurosurgery, Faculty of Medicine, McGill University, Montreal, Quebec, Ca nada, 8 Neurology Department, CHU Grenoble Alpes, INSERM, U1216, Grenoble Institut Neurosciences, Grenoble, France Introduction One-third of ep ileptic patients are resistant to medication , with surgery as a p otential solution 1,2 . Howev er, 25 – 35% of o perated p atients co ntinue to experien ce d isabling seizures 3 , showin g th e need for better surgical targeting . A network- based perspec tive has improved our understanding of seizure generation, yet the role of wh ite matter (WM) connection s in these networks remains under explored. While intracranial EEG (icEEG) lo calizes cortical nod es, it omits WM pathway s 4 . Here, we integrate diffusion MRI tractography with icEEG to visualize and quantify the WM edges of ep ileptic networks. Methods High-resolu tion T1 and diffusion MRI scans were acquired f rom 20 patients having undergone an icEEG and fr om 49 healthy controls (HC). A co mprehensive structural co nnectivity pipeline (Tractoflow 5 , Surfac e-Enhanced Tractography 6 , and Co nnectoflow 7 ) gen erated trac tograms while correcting for the gyral b ias, parce llated the cortex into 246 Brainnetome atlas regions 8 , and computed connectivity strength (CS) u sing streamline counts and COMMIT weights (a m icrostructure- informed CS metr ic). Expert epileptologists classified icEEG contacts of patients into seizure onset (SOZ), propag ation (SPZ), irritative (IZ), or non-in volved zones (NIZ). Each parcel was ass ig ned to the same zone as the contact withi n it. Trac ts connecting parce ls were then gro uped into intrazona l ( SOZ ↔SOZ…IZ↔ IZ) and interzonal (SOZ ↔SPZ… IZ↔ NIZ) n etworks. CS of analogous networks in HCs wer e also computed . Across - group, within -network and within -group, across -network differences were assessed u sing FDR -corrected nonparametric tests. Results Across-grou p FDR-co rrected comparison s revealed that patients ex hibited increased streamline counts in I Z ↔ NIZ and decreased COMMI T weights in NIZ ↔ NIZ. Across- network FDR-cor rected comparisons revealed high er streamline cou nts in SOZ ↔ SOZ co mpared t o SOZ ↔ SPZ, SOZ ↔ NIZ, SPZ ↔ IZ, S PZ ↔ NI Z, and IZ ↔ NIZ. Although COMMIT weights showed overall netwo rk differences, no comp arisons remained sign ificant after FDR. Conclusions These finding s underscore the potential o f diffusion MRI tractography to complem ent icEEG by delin eating the WM architecture of epileptic networks. Combining icEEG -derived zone def initions with trac tography metrics may refine surgical targets an d improve s eizure outcomes. 1. Epilepsy . (n.d.). World Health Organiza tion. Retrieved December 3, 2024, from https://www.who. int/news-room/fact -sheets/det ail/epilepsy 2.Mesraoua, B., Brigo, F., Lattanzi, S., Abou-Khalil, B., Hail, H. A., & Asadi -Pooya, A. A. (2023). Drug-resistant epilepsy: Definition, pa thophysiology, and management. Jour nal of the Neurological Sciences , 452 . https://doi.org/10.1016/j. jns.2023.120766 3.TŽllez-Zenteno, J . F., Dhar, R., & Wiebe, S. (2005). Long-term s eizure outcomes following epilepsy s urgery: A sys tematic review and meta -analysis. Brain , 128 (5), 1188 – 1198. https://doi.org/10.1093/brai n/awh449 4.Chaudhary, U. J., Centeno, M ., Carmichael, D. W., Diehl, B., Walker, M. C., Duncan, J . S., & Lemieux, L. (2021). M apping Ep ileptic Networks Using Simultaneous Intrac ranial EEG-fMRI. Frontiers in Neurology , 12 . https://doi.org/10.3389/fneu r.2021.693504 5.Theaud, G., Houde, J. -C., BorŽ, A., Rheault, F., Morency, F., & De scoteaux, M. (2020). Trac toFlow: A robust, efficient and reproducib le diffusion MRI pipeline leveraging Nextflow & Sin gularity. NeuroImage , 218 , 116889. https://doi.org/10.1016/j. neuroimage.2020.116889 6.St-Onge, E., Da ducci, A., Girard, G., & Descoteaux, M . (2018). Surface -enhanced t ractography (SET). NeuroImage , 169 , 524 – 539. https://doi.org/10.1016/j. neuroimage.2017. 12.036 7.Rheault, Fran•ois & Houde, Je an-Christophe & Sidhu, Jasmeen & Oba id, Sami & Guberman, Guido & Daducci, Alessandro & Des coteaux, Maxime. (2021). Connectoflow: A c utting-edge Nextflo w pipeline for structural c onnectomics 8.Fan, L., Li, H., Zhuo, J., Zhang, Y. , Wang, J., Chen, L., Yang, Z., Chu, C., Xie, S., Laird, A. R. , Fox, P. T., Eickhoff, S . B ., Yu, C., & Jiang, T. (2016). The Human Brainnetome Atlas: A N ew Brain Atlas Based on Conne ctional Architecture. C erebral Cortex (New York, N.Y.: 1991) , 26 (8), 3508 – 3526. https://doi.org/10.1093/ce rcor/bhw157 34 Harmonizing F ree W a ter Metrics in Aging: A Comparative Study of Single-Shell a nd Multi-Shell Di ! usion MRI Stanislas Thoumyre 1,2 , Arnaud Bor´ e 1 , Laurent Petit 2,3 , and F ran¸ cois Rheault 1,3 1 Sherbroo ke Connectivit y Imaging Lab (SCIL), Universit ´ e de Sherbro oke, Canada 2 Group e d’Imagerie Neurofonctionnelle (GIN), Institut des Maladi es Neuro d´ eg ´ en ´ eratives-UMR 5293, CNRS, CEA Univ. Bordeaux, F rance 3 IRP OpT eam, CNR S Biologie, F rance - Universit ´ e de Sh erbrooke, Canada In tro duction Di ! usion-weigh ted MRI (dMRI) ev aluates brain microstructure, but traditional models such as di ! usion tensor (DTI) and kurtosis imaging lack specifici t y [1]. Bioph ysical mo dels, such as the free w ater (FW) mo del, isolate extracellular w ater di ! usion from tissue signals, providing corrected di ! usion metrics and estimating the free water fraction (FWF), a mark er for inflammation or tissue loss [2]. Multi-shell (MS) acquisitions enhance FW mo deling but single-shell (SS) proto cols remain common clinically due to shorter scan times. Although FW estimation from SS data is not optimal, it is high ly correlated with MS data and can serv e as an acceptable and trustw orthy proxy [3]. This study compares FW metrics from SS and MS acquisitions within the same sub jects globally and in white matter bundles, aiming to v alidate SS FW est imates, particularly for aging research using ADNI-3 data. This study also aims to assess whether harmonization of FW metrics betw een MS and SS acquisitions from the same sub jects is feasible to impro ve longitudinal multi-protocol follow-up. Metho ds W e included 26 cognitively normal participants (mean age: 75.15 ± 7.2 years, 4 men, 22 women) from the ADNI-3 co hort [4], scanned approximately tw o years apart. dMRI used SS (b=1000 s/mm ² , 48 directions) initially , and MS (b=500, 1000, 2000 s/mm ² , 112 directions) later, b oth at 2 mm ³ isotropic resolution. Structural MRI included T1-weigh ted (1 mm ³ resolution) and FLAI R sequences. White matter lesions were segmented using SHIV A-WMH [5]; tractograph y and FW metr ics were generated using T ractoFlow [6], BundleSeg [7], and freewater flo w [8] pip elines. FW metric were extracted from ”safe tissue” masks, which ex cluded lesions and ero ded regions, ensuring analysis within intact regions, free from partial volume e ! ects. Each sub ject were normalized to ensure their median w ere standardized. T o assess agreement b etw een SS and MS acquisitions, FWF estimates were compared using Pearson correlations across tissue types, and mixed-e ! ects linear regression across white matter bundles. Additionally , to harmonize SS and MS data, the freewater flow pipeline was rerun on the MS dataset using only the b → 1200 s / mm 2 shell (DTI shell), enabling generation of FW metrics comparable to those f rom SS acquisitions. Results FWF v alues showed strong correlations b etw een SS and MS acquisitions across brain tissue types: cerebrospinal fluid (CSF, r = 0 . 815), grey matter (GM, r = 0 . 820), and white matter (WM, r = 0 . 819), all with p -v alue < 0 . 005 (fig.1a). A mixed-e ! ects linear regre ssion p erformed across seven white matter bundl es (AF, F A T, IF OF, MdLF, OR ML, SCP , and SLF) rev ealed a significant fixed e ! ect ( p -v alue < 0 . 001, co e ” cient = 0.625), indicating a strong but sub-propor tional relationship b etw een FW v alues from SS and MS data (fig.1b). Random v ar iance across bundles was minimal (Grou p V ar = 0.001), suggesting the relationship is consistent across regions. Finally , harmonization of free-w ater corrected metrics (F A-t and MD-t) using only the DTI she ll ( b → 120 0 s / mm 2 ) from MS data improv ed in ter-pr otocol agreement but did not fu lly eliminate residual di ! ere nces (fig.1c). Figure 1: Comparison of F ree W ater (FW) metrics b etw een single-shell (SS) and m ulti-shell (MS) di ! usion MRI acquisitions . (a) Correlation of FWF v alues across cerebrospin al fluid (CSF), grey matter ( GM), and white matter (WM) betw een SS a nd MS acquisitions. Each dot represents a sub ject (n = 26); l ines show the correlation p er tissue wi th 95% confidence interv als. (b) Mixed-e ! ects linear regression of m ean FWF v alues across seven white matter bundles: AF (Arcuat e F asciculus), F A T (F rontal Aslant T ract), IF OF (Inferior F ronto-Occipital F asciculus), MdLF (Middle Longitudinal F asciculus), OR ML (Optic Radiation Mey er’s Loop), SCP (Sup erior Cerebellar Peduncle), and SLF (Sup erior Longitudinal F asciculus). The fixed e ! ect is highly significant (p < 0 . 001, co e ” cient = 0.625). Random v ariance across bundles is low (Group V ar = 0.001). (c) Harmonization of free-w ater corrected metrics (F A-t and M D-t) b etw een SS and MS acquisitions, across right (R) and left (L ) white matter bundles. W e use DTI shells fro m MS (Multi-Shell filtered) to harmonize v a lues with those from single-shell data. Conclusions FWF estimates from SS and MS acquisitions show strong correla tions across tissues and bundles, supporting the use of SS data as a reliable pro xy in the ADNI-3 dataset. Regression analyses confirmed stable tract-wise relationships, and partial harmonizatio n using the DTI shell improv ed inter-protocol agreement.Although this approach is sp ecific to ADNI-3, applying the metho dology to other datasets and acquisition proto cols w ould be v aluable for v erifying its broader e ! ectiveness. A key limitation of this study is the tw o-year gap b etw een SS and MS scans, which may introduce aging-related changes; nonetheless, the re sults remain significant, highlighting the robustness of these findings. References: [1] Descote aux M. (2015). High Angular Resolution Di ! usion Imaging (HARDI). Wiley Encyclop e dia of Ele ctric al and Ele c tr onics Engine ering ; [2] Bergamino M., W alsh R.R., Stokes A.M. (2021). F ree- water di ! usion tensor imaging improves the accuracy and sensitivity of white matter analysis in Alzheimer’s disease. Scientific Rep orts ; [3] Golub M., Neto Henriques R., Gouveia Nunes R. (2021). F ree-water DTI est imates from single b-v alue data migh t seem plausible but m ust be in terpreted with care. Magnetic Resonanc e in Medicine ; [4] W einer M.W. et al. (2017). The Alzheimer’s Disease Neuroimaging Initiative 3. Alzheimer’s Dement ; [5] Tsuchida A. et al. (2024). E arly detection of white matter h yp erintensities using SHIV A-WMH. Hum an Br ain Mapping ; [6] Theaud G. et al. (2020). T ractoFlow. Neur oImage ; [7] St-Onge E., Schilling K.G., Rheault F. BundleSeg: A versatile, reliable and reprod ucible approach to white matter bundl e segmentation; [8] freewater flow: h ttps://github.com/scilus/freewater flow 35 Title : Mapping the struc tural connectome of temporal lobe epilepsy variants to i mprove sur gical out comes Authors : Emna Guibene 1,2 , Émile Lemoine 1,2, 5 , Maxime Descoteaux 3 , François Rheault 4 , Arash Sarshoghi 1,2 , Dang K. Nguyen 1,2,5 , Guillaume Theaud 1 , Sami Obaid 1,2,6 1 University of Montreal Hospital Center Research Center (CRCHUM), Montreal, Quebec, Canada ² Department of Neurosciences, Faculty of Medicine, University of Montreal, Quebec, Canada ³ Sherbrooke Connectivity Imaging Lab (SCIL), University of She rbrooke, Sherbrooke, Quebec, Canada ⁴ Medical Imaging and Neuroimaging (MINi) Lab, University of S herbrooke, Sherbrooke, Quebec, Canada ⁵ Department of Neurology , University of Montreal Hospital Cente r (CHUM), Montreal, Quebec, Canada ⁶ Department of Surgery , Faculty of Medicine, University of Montreal, Quebec, Canada. T emporal lobe epile psy (TLE) is the most common type of foca l epilepsy . Unfortunately , one-third of patients are drug-r esistant. While temporal lobe (TL) surgery is an option for these refractory cases, ~30% of patients continue to e xpe rience seizures postoperatively 1 , possibly due to epileptogenic networks extending beyond the TL, encompassing the contralateral TL (bitemporal epilepsy - BTE) or extratemporal regions (t emporal plus epilepsy - TPE) 2 . Diffusion MR I tractography offe rs a non -invasive method to map epileptic networks, providing structural insights to differe nti ate TLE from BTE and TPE, thus improving surgica l candidate selection 3 . W e included 27 p atients with TLE, 12 with BTE, 15 with TPE and 49 healthy controls (HC). All underwent high-resolution T1- and diffusion-weighted MRI sequences. Images were processed using T ractoFlow 4 , Surface-Enhanced-T ractography 5 , and C onnectoflow 6 to generate COMM IT -weighted connectivity matrices quantifying microstructural conne ctivity stre ngth 7 . Ma trices from patients with left-sided TLE/TPE were side - flipped. Betwe en-group comparisons were performed using FDR -corrected two -sample t-tests. Graph- theoretical analyses (GT A) were also conducted, assessing nodal strength, betweenness c entrality , clu stering coef ficient and local ef ficiency 8 . Comparisons revealed significant conn ectivity differences betwe en all patient groups and HC, with BTE and TPE demonstrating more extensive alterations t han TLE. BTE showed a more diffuse pattern of increased connectivity strength than TLE, including strong connections in the left T L. Compared to TLE, TPE patients revealed one increased ipsilateral connection between the medial amygdala and the rostral thalamus. GT A showed increased netwo rk metrics in BTE and TPE compared to TLE. B TE exhibited pronounced network alterations in the left TL and bil ateral li mbic regions, whereas TPE sh owed more widespread changes in bilateral subcortical-limbic regions and associatio n cortices. These findings highlight more widespread alterations in BTE and TP E compared to TLE. W e highlight potential structural signatures of TLE, BTE, and TPE, enabling non -invasive differentiation of these variants to improve sur gical candidate selection and postoperative outcomes. Reference s 1. Harrou d A , Bouthillier A , Weil AG , Nguyen DK. T empor al lobe epilepsy sur gery failur es: A review . Epilepsy Res T reat. 2012;2012:201651. doi:10.1155/20 1 2/201651 2. Bernhardt B C, Bonilh a L, Gros s DW. Network analysis for a network dis order: The emer ging role of gr ap h theory in the study of epilepsy . Epileps y Behav . 2015;50:162– 70. doi:10.101 6 /j. yebeh.2015.06.0 0 5 3. Obaid S, Rheault F , Edde M, Guberman GI, St-Onge E, Sidhu J, et al. Structur al connectivity altera tions in operculo-insular epilep sy . Br ain Sci. 2021;11(8):1041. d oi:10.339 0/brainsci110 81041 4. Theaud G , Houde JC, Boré A , Rheault F , Morency F , Descoteaux M. Tr actoFlow: A robust, eicient and reproducible diusion MR I pipeline lever aging Nexto w and Sing ularity . Neuroimag e . 2020;218:116889. doi :10 .1016/j.neu roimage. 2020.116889 5. St -Onge E , Daducci A, Gir ard G , Descoteaux M. Surfac e - enhanced tr actogr aphy (SET). Neur oimage. 2018;169:524– 39. doi:10.1016/j.neu roimage .2017.12. 03 6 6. Rheault F , Houde JC , Sidhu J , Obaid S, Guberman G, Daducci A , et al. Connectoow : A cutting- edge Nexto w pipeline for structur al connectomic s. ISMRM & SMR T Annual Meeti ng & Exhibition; 2021. Available fr om: https:// archive .ismrm. org/2021/430 1 .html 7. Daducci A, Dal P alù A, Lemkaddem A , Thiran JP . COMMIT : Conv e x optimization modeling for micros tructure informed tractogr aphy . IEEE T rans Med Imaging. 2015;34 ( 1):246–57. d oi:10 .1109/TMI.201 4.2352414 8. Rubinov M, Sporns O. Complex network measure s of b r ain conn ectivity: Uses and interpretatio ns. Neuroimage . 2010;52(3):1059 – 69. doi:10.1016/j.neu roimage .2009.10. 00 3 36 Implicit Neural T ractography: Mapping White Matter in Con tinuous Space Rube n Vink 1,* , T om Hendriks 1,* , Bram Kraaijeveld 1 , Anna Vilanov a 1 , and Maxime Chamberland 1 1 Dep artment of Computer Scienc e & Mathematics, Eindhoven Universit y of T echnolo gy, Eindhoven, The Netherlands * Authors contribute d e qual ly In t ro duction T ractography represen ts a contin uous pro blem by nature [3], while di ! usion MRI provides discrete measurements at the vo xel level. Typically , linear interpolation of the FODs is used, as (probabilistic) tractography requires many FODs at arbitrary co ordinates. This can often result in inaccuracies (e.g., create artificial peak s), such as in regions where the underlying fibres hav e high curv ature [2, 4]. Implicit Neural Representations (INRs) hav e b een shown to provide an accurate noise -robust mapping of con tin uous co ordinates to FODs [2] and show great promise in downstream tasks such as tractography . This study ev aluates tractograph y results using FODs sampled from a con tinuous INR. Metho ds W e first fit an INR on the DWI signal of tw o datasets; 1) the syn thetic T ractometer dataset [1] and 2) the CDMRI 2018 challenge dataset [5]. The T ractometer dataset provides a quantitativ e comparison to other tractography metho ds, whereas the CDMRI 2018 dataset is used for in-viv o qualitative visual insp ection. W e p erform whole-brain tracking using an in-house probabilistic metho d [8] that uses the fi tted INRs to sample the FODs during the tracking pro cess. W e compare the result with a ‘baseline’ metho d that uses Constrained Spherical Deconv olution (CSD) [7] and samples the FODs with linear interpolation. The only di ! erence b etw een b oth metho ds is how the F ODs are generated (i.e., INR vs. linear interpolation), with all other tractography parameters kept fixed. Figure 1: Continuous probabilistic trac king of the ISMRM 2015 c hallenge dataset. Figure 2: T ractometer scores for the INR (blue) and CSD (red) approaches with resp ect to noisy and ground truth datasets. Results Figures 1 and 2 show results on the T ractometer dataset [6]. Notably , the INR method achieves 20 VB, 37.4% VS, 72.7% OL, 68.8% OR, and 58.5% F1 for the noisy dataset and 21 VB, 53% VS, 69.2% OL, 46.5% OR, and 62.7% F1 when fit on the ground truth data. Figure 3 shows a sagittal view of our tracking on the CDMR I 2018 challenge dataset [5]. One can observe a general smo other tracking and b etter cov erage of the gy ri when using INR- based tracking (right) compared to CSD based tracking (left). In Fig ure 4 we see a more clearly defined separation of the cereb ellar lobes, without spurious fibers ending in the cereb ellar sulcus. Finally , in the close-up of the complex optic nerve region, INR tractograph y provides a denser optic chiasm when compared to traditional trac king. Discussion & Conclusion First, our findings on the synthetic T r actometer dataset indicate that using the INR for tracking achiev es scores similar to the b est p erformers, whereas linear interpolation of FODs with the same tractography con figuration doe s not reach such lev els. The qualitativ e analysis of the CMRI 2018 dataset shows smoother and more ev enly distributed streamlines ac hieved by simply changing the FOD sampling from a discrete interpolation method to a con t in uous representation. All in all, this shows early merit in using contin uous representations in fib er tracking, but further comparisons with ground truth datasets and clinical quality scans are necessary . This framework also opens up aven ues to incorp orate contin uous microstructural information during t rac king (i.e., microstructure-informed tractography). Finally , the INR can also provide fast tracking, since the mo del can b e inferred directly using the GP U thus removing the load of sampling large FOD v olume s from static memory . Figure 3: Saggital slice. Left: CSD based trac king. Right: INR based track- ing. Figure 4: Left: CSD based tracking. Right: INR based tracking. T op: Lateral view of the cerb ellum. Bottom: Inferior view of the optical nerve. References [1] M.-A. Cˆ ot ´ e et al. T ractometer: T ow ards v alidation of tractography pip elines. Me dic al Image Analysis , 2013. [2] T. Hendriks et al. Implicit neural representation of multi-shell constrained spherical dec on volution for contin uous mo deling of di ! usion mri. Imaging Neur oscienc e , 2025. [3] B. Jeurissen et al. Di ! usion mri fiber tractography of the brain. NMR in Biome dicine , 2019. [4] T. H. N. Le and K. Luu. Medical image computing and computer assisted in terven ti on miccai 2020. In International Confer ence on Me dic al Image Computing and Computer-Assiste d Intervention , 2020. [5] L. Ning et al. Cross-scanner and cross-proto col m ulti-shell di ! usion mri data harmonization: Algorithms and results. Neur oimage , 2020. [6] E. Renauld et al. V alidate your white matter tractography algorithms with a reappraised ismrm 2015 tractography challenge scoring sy stem. Scientific R ep orts , 2023. [7] J.-D. T ournier et al. Robust determination of the fibre orientation distribution in di ! usion mri: Non-negativity constrained super-resolved spherical deconv olution. Neur oImage , 2007. [8] R. Vink et al. Multi-dimensional parameter space ex ploration for streamline-sp ecific tractography . In International Workshop on Computational Di ! usion MRI , 2024. Ackno wlegements The authors ackno wl edge funding from the Dutch Research Council (NWO) grant num bers OCENW .M.22.352 and KICH1.ST03.21.004. 37 Unveiling the functional specializati on of human circuits w ith naturalistic stimuli Ovando-Tel lez M. 1,2 , Foulon C. 1,2 , Nozais V. 1 , Pacella V. 1,3 , Thiebaut de Schotten M. 1,2 1 Brai n Co nnectivity and Behaviour Laboratory, Paris, Franc e 2 G roupe d ’im aginer ie fonctionelle ( GIN), Institut des maladies Neurodegeneratives (I MN) – UMR 5293, CNRS, Bordeaux, F r ance 3 IUSS Cognitive Neuroscience (ICON) Center, Scuo l a Universitaria Superiore IUSS, Pavia, Italy Introduction : White m atter has long been studied for its structural or ganization, yet i ts functi onal properties re mai n poorly unde rstood. L everaging the funct ionnectome fr amework 1 , which maps functional MRI (fMRI) data onto white m atter pathways using anatomical priors, we aimed to identify functional subdivisions of wh i te m atter fibers. We hypothesized that naturalistic vi deo watching could reveal distinct patterns of invol vement of the white matter 2 , enabling a novel parcellation dri ven by function. Methods : We analyzed 7T fMRI data from 110 Hum an Connectome Pr oje c t participants during vi deo watching. Functional signals wer e p rojec ted onto white matter using anatomi cal p r iors f or association, commi ssural , and projection fi bers 3 . Group-l evel temporal variation maps were generated via one -sample t-tests, followed by UMAP and HDBscan for unsupervi sed clu stering . Parcels were validated us i ng a separate 20-subject dataset, and f unctional hom ogeneity was c o m pared to nu ll model s. We used m achine learning to explor e cognitive terms by al igning them with se mantic vi deo content 4 and validated the associations using two external datasets. Results : We identified 36 association and 40 commissural fib r e clusters with distinct functional profiles (Figure 1 - top); projection fi bres lacked clear functional org ani zatio n in our dataset. Results were proje cted onto the b r ain (Fig ure 1 - bottom), r evealing parcels with high functional homogeneity (Z > 3.5) and reproducibl e acti vation patterns across datasets. E xternal val idation c onfirmed consistent associations with cognitive domains. Parcel- specific video frames are avai l able at http://cognipact.bcblab.com Conc lusi o n : We present the first functionally driven parcellation of ass ociation and commissural whi te matter using naturalistic fMRI. These r eproducible, sema ntically meaningful circuits suggest that white matter supports functi onally spec i fic roles 5 , expanding our u nderstanding of brain o rganiz at i on beyond the cortex and providing a novel functionally relevant pa r cellation of the white matter to our community. References: 1 N ozais, V. et al., (2021) Functionnectome as a framework to analyse the contribution of brain circui ts to fMRI. CommsBio 2 Hasson, U. et al. (2004) Intersubject synchronization of cortical activity during nat ur al vision. Science 3 Cata ni, M., & De Schotten, M. T (20 12) Atlas of human brain connections. Oxford University Press 4 Pacella V., et al. ( 2 024) The morphospace of the brain -cogniti on organization. NatComm 5 Thiebaut de Schotten, M., & Forkel, S . J. ( 2022) The emergent properties of the connected brain. Scienc e Figure 1 . Top: UMAP plots show voxel distribution across groups; right panel c olors indicate HDBscan- identified clusters . Bottom: Bra in parcellation wi th white matter tracts s howing color-c oded parcels. SLFs : Su perior longitudinal fa scicu li, IL F : Inferior longitudinal fas ciculus, PSL : Posterior segment o f arcuate fasciculus , IFO F : Inferior fronto-occipital fasciculus 38 Local Spherical Deconvolution (LSD) for Tractography of High-Resol ut ion Diffusion MRI of Chimpanzee Brains A. Anwander 1 , M. Paquette 1 , Y. Becker 1 , F. Wermter 2 , C. Bock 2 , EBC Consortium, R. Wittig 3 , C. Crockford 3 , A. D. Friederici 1 , and C. Eichner 1 1 Department of Neuropsychology, Max Planck Institute for Human Co gnitive and Brain Sciences, Leipzig, Germany 2 Alfred Wegener Institute, Helmholtz Centre for Polar and Marine Research, Bremerhaven, Germany 3 Institut des Sciences Cognitives Marc Jeannerod, Lyon, France; Introduction: Human abilities such as cognitive skills and lan guage use a network o f interconnected cortical regions [1]. However, the ev olutionary d evelopment of t his structure remains unc lear. Co mparing t he brai ns o f no n-human primates w ith their cognitive abilities provides indirect insight into possible evolutionary pathways [2]. Advances in diffusion MR I (dMRI) enable t he microstructure of white matter ( WM) to be imaged and WM fiber tracts to be reconstructed. Post-mortem MRI in preclinical sys tems enables data ac quisition at a very high resolution and excellent quality [3, 4]. This study provides a high-resolution atlas of c himpanzee brain WM pat hways using advanced dMRI techniques on a chimpanzee brain . The data c ollection was conducted in t he 'Evolution o f Brain Conne ctivity P roject' s tudying brains and behavior of wild and captive primates [5]. Methods: We acquired high-reso lution dMRI data of a 47-year-old female chi m panzee u s ing a 9.4T Bruker Biospec 94/30 MRI sys tem with a Gmax=300 mT/m gradient system and a 154 mm coil [6]. T he brain was positioned in a left-right orientation to optimize coil sensi tivity. The data was acquired using a segmented 3D echo-planar imaging (EPI) s pin-echo s equence with two refocusing pulses to minimize the effects of B1+ inhomogeneity. The s can had a reso lution of 500 µm and us ed 55 diffusion di rections with b = 5 ,000 s/mm² (32 segments). Dummy sca ns (13 hours) were per formed t o maintain a steady temperature. T hree inters persed b = 0 images were used for field drift correction. Total acquisition time: ~90 h. The preprocessing included debias ing, denoising, Gibbs ringing correction, field drift co rrection, eddy current co rrection, and intensity normalization. We de veloped a new local spherical deconvolution method (LS D) t o estimate the fO DF [6]. Br iefly, this me t hod compu tes an optimized s harpening deconvolution transformation [7] by selecting the best underlying sharpening rat io from a s eries of predefined ratios ranging from 1.1 to 6. These ratios encode the diffusivity ratio between the main and secondary axes of the deconvolution kernel. We used the AIC to select the optimal deconvolution ratio for each voxel. This r esulted in a robust fODF estimation and eliminated false positive peak directions. The fODF was used to compute whole-brain deterministic streamline tractography using MRtrix, followed by interactive fascicle segmentation (Fig. 1). Results and Discussion: The high-re solution dMRI data revealed anatomical d etails previously seen only in histologic data, but hidden i n earlier MRI scans [6]. Key structures s uch as the pontine trac t, corticos pinal tra ct and lemnis ci in the brainstem, as well as the finely branched cerebellar foliate, were clearly visible. In the s triatum, Edinger's comb and internal c apsule fi bers intersecting with s triatal cell bridges were well defined. T he r olled dentate gyrus of the hip pocampus was also clearly reso lved. Thi s level of detail surpass es current human in-vivo dMRI and previous chimpanzee MR studies [8] with higher reso lution, improved microstructural c ontrast, and more accurate fiber tract recons tructions (Fig. 1). As a result, fine details o f the fiber tracts, including the precise location of the endpoints, were revealed. Resource: https://openscience.cbs.mpdl.mpg.de/ebc Conclusion: This ultra-high-resolution dataset allows detailed s tudies of brain organization in great apes. In p articular, the high quality data al lowed r evealing unknown anatomical details of t he equivalent of the language n etwork in a larg e group of chimpanzees [ 9 ]. This enables now cross-species comparisons of the brain connectivity which are critical for tracing brain evolution. References: 1. Skeide, M. A. & Fr iederici, A. D. The ontogeny of the cortica l language n et work. Nat. Rev . Neuro sci. (2016). doi: 1 0.1038/nr n.2016.23 2. Balezeau, F . et al. Primate auditory prototype in the evolution o f the arcuate fa s cic ulus. Nat. Neurosc i. (2020). doi: 10.1038/s41593 -020-0623- 9 3. Liu, C. et al . A resource for the detailed 3D mapping of w hite matter pathway s in the marmoset brain. Nat. Neurosc i. (2020). doi : 10.1038/s41593-019 -0575-0 4. Calabrese, E. et al. A diffusion tensor MRI atlas of the postmortem rhe sus macaque brain. Neuroi mage (2015). do i: 10.1016/ j.neuroimage.2015.05.072 5. Fr iederici, A.D. et al. Brain structure and function: A m ultidisciplinary pipeli ne to study hominoid brain evolution. Front Int Neur osci (2024) doi : 10.3389/fnint.20 23.1299087 6. Eichner , C., et al. Detailed mapping of th e complex fiber struct ure and white matter pathw ays of the chimpanzee brain. Nat. Method s (2024). doi: 1 0.1038/s41592-024 -02270-1 7. Descoteaux, M., e t al. Regularized, fast, and robus t analyt ical Q-ball ima ging. Magn. Reson. Med. 5 8, 497–510 (20 07). doi: 10.1002/mr m.21277 8. Bryant, K. L, et al. A comprehensive atlas of white matt e r tracts in the chim panzee. PLoS Biol. 18 , e3000971 (2020 ). doi: 10.1371/ journal.pbio .3000971 9. Becker , Y . , et al. Long arcuate fascicle in wild and capti ve chimpanzees as a pote ntial structural precursor of the language network. Nat Commun 16 , 4 485 (2025). doi: 10.1038/s41467- 025-59254-8 Figure 1: H igh-resolution MRI d ata quality. T op: Wh ole-brain color-coded FA reconstruction of t he a cquired hig h-resoluti on (500 µ m isotropic) post mo rtem chimpanzee dMRI dataset. Middle: Zoome d re gions for the brainstem, cerebellum, basal ganglia, and h ippocampus. B ottom: Tractographic reconstruction of fronto- parietal association tracts. Figure adapted from [6]. 39 Robus t pipeli ne to bring automated tr actogr aphy int o neurosurgical pr a cce R. Bakk er 1,3 , M.M.G.H. van de Ve e r d o n k 1,2 , H.B. Brouwers 1 , G. J.M. Ruen 1 1 Department of Neur osu rgery , Elisabet h-T weesteden Hospital Tilburg, The Netherlands 2 Department of Ra diology & Nuclear M e dici ne, Eras m us MC Cancer I nstitute, Erasmu s Uni versity Medical Center , Ro tter dam, the Netherla nds 3 Department of Mathematics and Com puter Science, T echnical University , Eindhoven, the Nether lands I NTRODUCTIO N In 2023 w e released a p ipeline for fully automated tractogr ap hy in br ain tumor paents [1 ] . It rec on structs seven w h ite maer tracts, each of which pla y s an essenal role in sensorimotor or cognive funcons. Th e pipeline i s run in parallel to a clin ically approved workow (Medtronic Stealth TM T ract ography) in w h ich the same set of tr acts i s computed b y manual selecon of seed - and target regions. In comparison, we nd the automated results more consisten t, less prone to h uman error , and cost - saving . W e th eref ore aim to bring the pipeline into clinical pracce an d are ru nning a v ali daon study with data from glioma paents in ve hospitals [2 ]. The focus of the project is 1) t o make th e pipeline r obu st t o the presence of large tumors; 2) to mak e it compable w i th a va riety of Diu sion MRI (DWI) protocols ; 3) to mak e it modul ar to enabl e rapid prototyping of tr actography algorithms ; 4 ) to create a set of validaon tools for quick ass essment of the seven tracts; and 5) to integr ate the track s into the neuronavig aonal sys tem u sed in the operang r oom. M ETHODS The core of the pipeline consists of a) Constrained Sp herical Deconvoluon (C SD)-bas ed preprocessing of the diusion data, b) coregi straon of the anatomical scans , c) cor cal and subcorcal p arcellaon of th e brain to generate seed- an d target region s for tractography , d) prob abilisc tractograph y, where a) an d d) rely mainly on MRtrix3 and FSL soware [3,4] . Our main eort goes into making the co-registra on and bra in parcellaon work robustly in the presence of large tumors . The parcellaon w orkhorse h as b ecome th e deep learning based SLANT segmentaon algorithm [5] , which chops the brain into a 3x3 grid of overlapp ing cubes and merges th e 27 submo dels by a vong strategy that results in a 133- ar ea parcellaon . Thi s distributed appro ach performs remarkably well in th e presence of large tumors , with out having to rst s egment the tumor itself. T wo s tu mbling blocks hinder the use o f pipeline result s in clinical pr acce: 1) soware to be inst all ed on a hospital’ s intr an et must meet very strict requirements that research to ol s such a s MRtrix3 do not meet , an d 2) to use the track s during a tumor-re s econ procedure the neuronavigaonal sys tem must load and display them. For the rst issue we turn to fully web-based soluon s that do not require soware to be installed . For th e second issue we are in touch with device vendor s . Medtronic for example uses th e T rackvis . trk f or mat to store tracks generated on i ts Stealth TM Staon , but cannot yet impor t these les from external sources. R ESULTS Validaon of the pipeline w ith data from ve h ospitals revealed se veral issues with the ini al release [1]: (a) Non - isotropic T1 data may caus e issues w ith the r esampling of seed r egions in DWI space . (b) The Brai n Extracon Tool of FSL does not always con verge if the T1 covers large parts of the bra in stem. (c) So me DWI proto cols ha ve a h igh level of suscepbility-induced d istoron that can cause the T1- to -DWI re gistraon to fail. These prob lems can mo stly be solved by us ing the feature- rich ‘ qsi - prep ’ [6 ] DWI pr eprocessing pipe line which we are currentl y tesng. W e also had cases where the SLAN T parcellaon method placed small, isolat ed patches of brain areas inside t umor zones . The above gure illustrates this for the AF-tract, which runs inside a tumor d ue to a wrongly assigned pi ece (marked by red cros s) of 'triangular part of inferior fronta l gyrus’ . A cleanup rou ne now removes these patches i f they are small an d w ell separated from the core pa rt of the brain area. T o a id in the clinical validaon we r e leased pilot versions of th ree we b-based app s: 1. bve c -viewer ( rbakk er . github.io/bvec-viewer ) shows the dis tr ib uon of gradient dire cons on a sphere. 2. medtronic-tr a cts-extractor ( rbakk er .github.io/medtronic-tracts-ex t ract o r ) reads tr a cks from a Medtronic export le. 3. tck -viewer ( rbakk er .github.io/tck- viewer ) display s .t ck or .trk tr acks in a .o bj mesh glass brain. C ONCL USION We ta ke an automated tractography pipeline furth er toward s cl inical pracce by in creasing it s ro bustness against dierent diusion scan protocols and presence of large tumors, implemen t web-based evaluaon tools, and make the outp ut ready for in geson by neuronavigaonal systems . 1. Meesters S, Lander s M, Ruen G, Flora c k L. “Subject -Specic Automac R econst r ucon of Whi te Maer T racts” Journal of Digital I maging. 2023. 2. van de V eerdonk M , Bakker R, Lander s M , et al. “A proof - of -concept mulce nter study: an autom ated, paent -specic tractogr aphy pipeline fo r subcorcal tract vi sualizaon i n pa ents with glioma” ELGGN meeng Bern, April 3- 5 2025 . 3. T our nier J-D, S mith RE, Ra elt D, et al. “MRt r ix3: A fas t, ex ible and open soware fram ework for medical image pro cessing and visualisaon.” NeuroI m age, 202 (2019), pp. 116 – 37. 4. Jenkinson M, Beckma nn CF , Behrens TE, W oolrich MW , Smith SM. “ FSL ” . NeuroIma ge 62:782- 90, 2012 . 5. Huo Y , Xu Z, Xiong Y , et al. "3D whole bra in segmenta on using spaally lo c alized atlas network les" Neu roImage 194:105 - 119, 2019. 6. Cieslak M, Cook P A, He X, et al. “QSIPrep: an integrave pla orm for preprocess i ng and re construcng diusion MRI dat a” Nat Methods 18 (775 – 778), 2021 . Supported by gr ant “Bringing Tr actography into Dai ly Neurosur gical Pracce ” no. KICH1.ST03.21.004 o f the research pro g ram K ey Enabling T echn ologies for Minimally Inv a sive Intervenons in Healthcare , which is (partly) nanced the Dut c h Research Cou ncil (NWO). 40 nf-pediatric: A robust and age-adaptable end-to-end connectomics pipeline for pediatric diffusion MRI Antho ny Gagnon 1,2 , Arnaud Bo ré 2 , Alex V alcourt C aron 2 , Man on Edde 2 , Stan islas T houmyre 2,3 , Fran çois Rheau lt 2 , Mar ie A. Brune t 1 , Lari ssa T akser 1 , Maxim e Descote aux 2 1 Dépa rteme nt de pédia trie, Unive rsité de Sh erbro oke, Q c, Canada . 2 Sher brook e Con nectivity I maging La boratory , Univ ersité de Sherbr ooke, Qc, Canad a. 3 Grou pe d’image rie Neurof onctionnell e (GIN), U MR 5293, Université de Bordea ux, France . Intr oduction. New longitudinal pediatric initiatives , such as ABC D 1 and HBCD 2 , aim to study the impact of various factors on early brain maturation/dev elopment by leveragin g more than 10,000 multisite diffusion MRI acquisitions. These initiatives require scalable and re producible pi pelines, such as T ractoFlow 3 or QSIPre p 4 , for processing dM RI data. H owever , most dMRI proces sing pipeline s are based on strong priors established in adul ts and, therefor e, are often inadequate for pediatric/infa nt data. The few pipelines develop ed for that purpose 5 rely on outdated technologies, making their scalabilit y to larg e cohorts difficult . Pediatric/inf ant data require specific approac hes to account for the rap id neuroph ysiolog ical change s in the developing brain 6 . Conventio nal methods for registratio n, tissue segment ation, and even brain extrac tion are unstable at these ages and require altern ative approaches. T o handle such large datas ets, pipeline ec osystem s such as Nextflo w , rece ntly deeme d th e optimal solution for neuroi maging pip elines 7 , of fer ea sy d eployment on any computi ng environ ment. Therefo re, we propose nf-pediatric, a robust , modular , and age-adapt able end- to-end connectomics pipeline for dif fusion MRI written in Nextf low , specifi cally de signed for indiv iduals aged 0 to 18 years. Method s. The nf-pedi atric pipeline is built upon the nf-neuro 8 , a community hosting a col lection of tho roughly tested, containeri zed, and reproduc ible Nextflow m odules covering a myriad of tools from state-of-t he-art neuroim aging libraries. nf-pedia tric follows a modular architectu re, grouped into three profiles that enable users to select specific parts of the pipeline based on their needs (Figur e 1). By leveragi ng the BIDS conven tions, nf- pediatri c ex tracts participants ’ age at scan and group s them in speci fic processi ng sequences (e.g. , < 6 mon ths, between 6-18 months, between 18-30 months , o r > 30 m onths for the tra cking profile). Groups below 30 months are age-mat ched to their closest infant templat e to extract tissue maps, while older participa nts under go native tissue segmentatio n. The derivativ es adhere to the BIDS- Derivati ves specifications to ensure compatibili ty with other processin g to ols. Quality control (QC) reports are generat ed using MultiQC 9 , a soph isticated QC reporting to ol, which produ ces per-su bject and acros s-subjec t QC reports. Results. The major strength of nf-pediatr ic is its ability to automaticall y ad apt based on t he subject’ s age, particula rly in multiple key proc essing steps: (1) age-adap table brain extractio n using tailored mach ine learning model s, (2) age-adaptable movin g and target images for multimo dal registration maximizin g similar ima ge contrast and intensities, (3) age-adaptab le tissue segm entation methods , leveragin g T emplateF low 10 to fetch age-matc hed templates followed by template registratio n in subject-space , (4) a combina tion of both local and particle filter tracking using either deterministic or probabilistic methods , enabling a larger range of downstream analyses, (5) age-adap table cortical surface reconstr uction and segment ation with pediatri c atlases, and (6) integrated QC report, showcas ing screensh ots of key processi ng steps for visual assessment on the subject-level, but quantitati ve plots for assessment of outliers on the population-le vel. The final output contains essentia l files (metric maps, tractogram s, processed volumes , etc.) in BIDS format, as well as statis tic-ready connectivit y matrices. T o date, nf-ped iatric has been tested on approxim ately 10,000 subjects, ranging in age from a few weeks to 17 years (Figure 2). The end -to-end design, s panning from ra w data to connec tivity matrices, within a single p ipeline e nables significa ntly faster processing times compared to traditiona l approaches, which often require manual data manipulatio n and the use of multiple pipe lines to a chieve the same results. Those key advantages make nf-pediatric a s trong candidate for processing large pediatric datasets . Conclus ions. nf-pediat ric provides, for the first time, an end-to-end connectomics pipelin e with age-tail ored processes that adapt to each subject’ s age, allowing users to perform state-of-t he-art diffusio n MRI processing on infant/pediatr ic data. Due to its reliance on nf-neuro , nf-pe diatric integrates a strong testing infrastructur e and strict programm ing guidelines, ensuring its maintainabil ity and improva bility over time. T o broaden the scope of nf-ped iatric , new profiles will be added to sup port the automatic extr action of ma jor white m atter bu ndles usi ng infan t-tailo red bun dle atla ses. References. 1. C asey , B. J . et al. Deve lopmental C ognitive Ne uroscience 32 , 43–54 (2018). 2. V olkow , N. D. et al. De velopmental Cognitive N euroscience 69 , 1014 23 (2024). 3. Theaud, G. et al. NeuroImage 218 , 116889 (2020). 4. Ci eslak, M. et al. Nat Me thods 18 , 77 5–778 (20 21). 5. Bast iani, M. et al. NeuroImage 185 , 75 0–763 (201 9). 6. Mos tapha, M. & Styner, M. Magnetic Resonance Imaging 64 , 171–189 (2019). 7. K arakuzu, A. et al. Magn Res on Mater P hy (2025) d oi:10.1007/s 10334-02 5-01245-3. 8. V a lcourt Caro n, A. e t al. in Proceedings of th e ISMRM W orksho p on 40 Y ears of Di ffusion (2 025). 9. Ew els, P ., Magn usson, M., L undin, S. & Käller, M. Bioinforma tics 32 , 30 47–3048 (2 016). 10. C iric, R. et al. Na t Methods 19 , 1568–1 571 (2022). Figure 2. nf-pe diatric pipe line sche ma. Figure 1. Outpu ts from nf-p ediatric. Left to rig ht: Tissue probability map s, F A map s, and filtered tractogram with cortica l parcellation. a. 1 mo nth . b. 16 m onths. c. 10 year s. 41 Tractography in the Developing Knee Joint a t Microscopic R esolution Nian Wang 1,2 1 Adva nced Imagi ng Res earch Cen t er , UT Southwe s ter n Medica l Cen ter , Dallas, T exas, USA 2 Dep ar tment of Biom edical Eng ineering, U T Sou t hwest ern Medi cal Cen t er , Dallas, T e xas, U SA Introdu ction: The knee joint relies on a variety of ligaments, muscles, tendons, bones, and cartilage to maintain flexibili ty, stability, and strength, and it is the largest and one of the most comple x joints in the human body. The knee joint is susceptible to many types of injuries, includi ng fractures, sprains, tears, and dislocation s. Diffusion ‐ based tr actography has been w idely used in i dentifyi ng anat omical connections in human and an imal brains. Howeve r, applicatio n of DTI to map the comple x collagen fiber structures in the knee joint is still rare, probably because of limited spatial resolutio n, relatively low FA values, and relatively low signal‐to‐noise (SNR). Recently, we have develope d high-reso lution DTI method to probe the 3D collagen fiber architectures in the knee joint, its applicat ion to the develo ping knee joint has not been ex plored. Method s: Animal experiments were carried out in complianc e with the local Institutiona l Animal Care and Use Commit tee. The rats were sacrific ed at 4, 8, 12, 16, and 25 weeks and the knee joints were harvested for MRI scans. Scans were performed using a 3 D Ste jskal-Tanner diffusion-weig hted spin-echo pulse sequenc e at 9.4 T with paramet ers as follows : matrix size = 400x256x25 6, FOV = 18x11.52x1 1.52 mm 3 , TE = 9.1 ms, TR = 100 ms, 31 unique diffusion directions with a b value of 100 0 s/mm 2 and 4 non-dif fusion-w eighted (b0) measurements. All the diffusio n-weigh ted images (DWIs) were registe red to the baseline images (b0) to correct for eddy currents. The DTI and GQI models were u sed to c haracter ize the collagen fiber di rections in different con nective tissues o f knee joints. Results: Figure 1 shows the representativ e b0 images of developin g rat knee joints at 45 µm isotropic resolution. The growth plate and cartilage become thinner with develop ment. It is interesting to note that laminar appearance is evident in the growth pl ate and articular cart ilage (red arrows) at we ek 4 but gradually disap pears at later ages (wee k 8 and week 16, dat a not shown). To explore the ori gin of lamina r appearan ce, we calcul ated the ODF s and found the distinct collag en fiber orientati ons of the growth plate during knee develop ment (Figure 2). The tractogra phy further demons trated that the collagen fiber architect ure is rephased during the developmen t. Compared to the basic DTI model, GQI can resolve more complicated collagen fiber architecture at the superfic ial zone of the growth plate (Figure 3). Beside s the growth plate, distinct Collagen fiber orientat ions of articular cartilage during knee develop ment we re resolved by O DFs (Figure 4) . Discussi on and Conclus ion: This study demonstr ates that both FA and MD values are sensitive biomarkers for knee develop ment. High-resolution dMRI can nonde structively character ize the complex collagen fiber orientations and architecture s of the knee joint. The diffusion tractograp hy further helps to visualize the ultrastructu re and quantify the integrity of the fibrilla r collagen network. This capacity can provide unique insight into animal studies of devel opmental and d egenera tive joint diseas e. Acknow ledgements: Th is work was su pported by NIH/NIN DS NS125020. Figur e 3. Comp ared to DTI, GQI resolves more complica ted fiber archi tectur e at the su perfic ial zone of the growt h plat e. Figur e 1. The b0 imag es of developi ng rat knee joints at 45 µm isotropi c resolution . The growth plate and cartil age b ecome thin ner with d evelopmen t. Figur e 2. Distinc t Collagen fiber orientat ions of the growt h plate det ected by O DFs. Figur e 4. Distin ct Collagen fiber orientation s of articular cartil age d uring knee developm ent resolv ed by ODFs. 42 Tract morphing : A novel 3D m esh–based voxel-wis e framew ork f or m ultim odal white matter tr act analys is Saludar C 1 , Tayebi M 1,2 , Kwon E 1,2 , McGeown J 2,3,4 , Nepe-Apa tu T 2 , Condron P 2,3 , Schierding W 2,5 , Potter L 2 , Mātai mTBI Rese arch Group 2 , Scadeng M 2,3 , Wang A 1,2,3 , Fernan dez J 1,2 , Holdsw orth S 2,3 , Shim V 1,2 1.Auckland Bioenginee ring Institu te, Universi ty of Auckl and, Auckla nd, New Ze aland 2.Mātai Me dical Resear ch Institute, Gisborne, N ew Zealan d 3.Faculty o f Medical an d Health S ciences & Centre for B rain Resea rch, Univers ity of Auck land, Auckl and, New Ze aland 4.TBI Netw ork, Auck land Univer sity of Tech nology, Au ckland, New Zealand 5. Vision R esearch Fou ndation, Un iversity of Auckland, A uckland, N ew Zealand INTRO DUCTI ON: Dif fusion M RI (dM RI) is a widely used q uantitativ e techniq ue that generates a rich a rray of microstru ctural m etrics ( 1), but this abu ndance o f values from m ultiple imaging sequences creates a complex , h igh-dim ensional an alysis challenge. By cou pling dMRI with tractography we ca n m ap voxel-wise tissue properti es inside a single whit e-matter bundle, but comm on pipelines still compress this detail. Whole -tract averag ing reduces everything to one mea n number, trac t profiling keeps only a few samples along the centrel ine, and TBSS strips each 3-D tract down to a skeleton. These shortcuts simplify statistic s at the cost of valuable informat ion. To preserve that detail, we introduce tract morph ing, which projects the full voxel-w ise dMRI metrics onto a subject-sp ecific 3-D mesh that follows the tract’s geometry and fib re ori entations , retai ning f ar mo re of the ori ginal d ata fo r dow nstream analy sis ( 2). Pr incipal componen t analy sis (P CA) was then used to characte rise p atterns and variat ion o f dif fusion metrics alo ng th e W M tra ct, re ducing the multi- dimensio nal d ata i nto a low er-dimen sional set of p rincipal components that capture the gre atest variation in t he o riginal data. We app lied this m ethod to ass ess t he e ffects of he ad ac celeratio n ev ents (HAE) exposure or a diag nosis of mild tra umatic b rain injur y (mTB I) in coll ision-spo rt athlete s relative to non- collision -sport at hlete con trols. METHO D: Thirty-th ree male high-sch ool collision- sport athlete s (HA E g roup) were scanne d on a 3.0 T (G E Si gna P remier) with T1- MPRAG E (0 .5 m m iso tropic) and multi- shell diffusion MRI (b=0,10 00,2000, 3000 s/mm²; 2 m m is otropic) at early, mid, and p ost-seaso n. T wenty matched no n-contac t-sport controls und erwent a si ngle scan. Ten c ollision- sport athle tes with in- season mT BI were im aged at app roximat ely 1 week (T imepoi nt A), 3 week s (B), and 8 w eeks (C) po st-injury. D iffusion data were preproc essed in FSL, and DTI/DK I me trics were extracte d us ing M Rtrix3 and Pyde signer. Fibre orie ntation distri butions were esti mated via multi-she ll, multi-tis sue c onstraine d sph erical deconvolution in MRtrix 3, an d bila teral corticospinal tracts (CST) wer e auto maticall y seg mented with Tr actSeg. A subjec t-specific CST mesh was c reated by morphing a t etrahedr al te mplate (gener ated from a singl e C ST mask v ia Te tGen in F EBIO) to each su bject’s CST segment ation using free-form de formatio n (3 ). N earest-n eighbou r m apping in Python assigned voxel-wi se d iffusion metrics (FA , M D, AD, R D, KFA, M KT, MK, AK, R K) to mes h nodes. Permu tation testin g wit h in dependen t-sample t-tes ts ide ntified mesh elem ents showing sign ificant group diffe rences (contr ols v s. H AE; controls vs. mTBI ). Finally, PCA red uced the signific ant-eleme nt metric s into pr incipal c omponen ts, and P C1–PC 2 plots v isualised clusteri ng acros s groups and tim epoints. RESUL T: Perm utation te sting reve aled bilat eral CST regions w ith signif icant diff erences b etween co ntrols an d the HA E group f rom early -sea son to po st-seaso n, characte rized by a n inc reasing numb er of sign ificant elemen ts co ncentrat ed al ong t he C ST s pine. In th e co ntrols v s. m TBI c omparis on, a regi on-speci fic tr end w as observed in the C ST: from Timep oint A to C, signi ficant el ements in creased along the spine b ut decrea sed in th e crown. Principa l com ponent analys is (PC 1 an d PC 2) re vealed disting uishable cluste rs fo r bo th co ntrol vs. H AE a nd co ntrol vs. m TBI compari sons. Clusteri ng of the PCA data enable d discrimi nation betw een group s, w ith the follo wing contr ibutions fro m DTI and DK I m etrics: For con trol vs. HAE [L eft CST: 46.8 7% (DTI), 53 .13% (DKI); Right CST: 43.54 % (D TI), 5 6.46% (DKI) ] and for control vs. MTBI [Left CST: 50.79 % (D TI), 4 9.21% (DKI) ; Righ t CS T: 37 .82% (DTI), 62.18% (DK I)]. Notably , w hile the HA E clusters o verlappe d across tim epoints , th e mTBI clus ters at Time points A, B, an d C showed pa rtial separatio n, sugges ting tempo ral divergen ce in the underly ing diffu sion prof iles. DISCU SSION AND CO NCLU SION: Our tract morphin g f ramewor k p reserves the full voxe l-wise dMRI metr ics within a subject-sp ecific 3D mesh of the CST, captu ring microst ructural deta il th at convent ional pipeline s discard. By linking each mesh n ode to its n earest dMRI v oxel, we maintain spati al fidelity across nine diffusi on parameter s a nd visualise localised altera tions v ia perm utation testing and PCA c lustering . When appli ed to collision -sport athletes, this method detecte d both cumu lative H AE-indu ced su b- concuss ive change s over a season and dynamic pos t-mTBI va riations in di stinct CST regions, high lighting its sensitivit y. While we de monstrat ed PCA for dimensi onality reducti on an d vis ualisation , our frame work readily accomm odates advanc ed m achine-le arning techniq ues - clust ering algorithm s, su pport-ve ctor machine s, or de ep-learn ing clas sifiers - to refi ne subgr oup ide ntificatio n and p rognostic model ling. M ore imp ortantly, the ap proach’s real st rength li es in its flexibilit y; multiple quantit ative modaliti es - such as finite-element–d erived strain, hemodynami c measures from functio nal MRI, axonal diame ter estimates, myel in water fraction or vario us tis sue p roperties - can be projected onto the same m orph model. Integrating these diverse imaging and non -imaging para meters yields a compreh ensive f eature s et that g reatly e nhances group diff erentiatio n, supp orts mo re robus t cluster ing, and opens the door t o predic tive ana lytics th at consi der all relevant tissue an d biome chanical metrics at once. This ex tensible pipelin e offer s a po werful pl atform fo r multim odal d ata fus ion alo ng anat omically accura te tract geome tries. B y unitin g micr ostructur al, biomech anical, functional , and m olecula r inform ation i n a sin gle fram ework, it facilita tes the way for precise monito ring of brain health, in dividual ised ris k stratifica tion, and real-tim e predic tion of di sease pro gression or treatm ent resp onse acr oss a wid e range of neuro logical di sorders . Figure 1. Schematic diagram of the methodology, analysis, and results fro m the generation of the subject-specific model from M RI tractograp hy to tract morphing, elem ent-wise perm utation t-testin g, identification of significantly d ifferent elements between group s compared, and plotting of prin cipal components 1 and 2 from PCA to vi sualise clustering. Collision sport athle tes (HAE group) REFERENCES 1. Alexander AL, Hurley SA, Samso nov AA, Adluru N, Hos seinbor A P, Mossa hebi P, et al. Characterizati on of Cerebral White Ma tter Properties Using Quantitative Magnetic Resonance Ima ging Stains. Bra in Connect. 2011 D ec;1(6):423–46. 2. Tayebi M, Kwon E, Maller J, McGeown J, S cadeng M, Qiao M , et al. Integration of diffusion tensor imaging paramete rs with mesh morphing fo r in-depth analysis o f brain white matter fibre trac ts. Brain Commun . 2024;6(2):fca e027. 3. Fernandez JW, Mithraratn e P, Thrupp SF, Tawhai MH, Hu nter PJ. Anatomi cally based geom etric modelling of the musculo-skele tal system and o ther organs. Bio mech Model Mechanobiol. 2 004 Mar 1;2(3) :139–55. 43 Tittle - T ract -Specific DKI Rev eals Early White Mat ter Microstructur e Altera tions in Alzheimer ’ s Disease Authors - Santiago Mezz ano 1,2 , Reece P Roberts 1,2 , Flavio Dell A ’ qua 3 , Ian J Kirk 1,2 , T racy R Melzer 4,5,6 , Campbell J Le Heron 5,6, Kiri L Brick ell 2,7 , John C Dalrymple Alfor d 4,5,6 , Tim J Anderson 6, Nick J Cutfield 8 , L ynette J Tippet t 1,2 Catherine A Mor gan 1,2 and the NZ-DPR C 1 School of Psy chology, Univ ersity of Auckland, Auckland, New Zealand. 2 Centre f or Brain Research, Univer sity of Auckland, Auckland, New Zealand. 3 Institute of Psy chiatry , Psychology , and Neuroscience, Kings College London. 4 T e Kura Mahi ā -Hirikapo | School of Psy chology , Speech and Hearing , University of Cant erbury , New Zealand. 5 New Zealand Br ain Research Institute, Christchur ch, NewZealand. 6 Department of Medicine, University of Otag o, Christ church, New Zealand. 7 School of Medicine, Universit y of Auckland, Auckland, New Zealand. 8 Department of Medicine, University of Ot ago, Dunedin, New Zealand. People with Subjective Cognitive Decline (SCD) and amnestic Mild Cognitive Impairment (aMCI) are at increasing risk of developing Alzheimer ’ s Disease (AD) dementia. Identifying neurobiologic al changes that underpin this pr ogression is critical f or early diagnosis and interven tion. The parahippocampal cingulum within the Pape z circuit conne cts the poster ior cingulate c ortex to the hippoca mpus, and has been shown to under go early changes in dementia using MRI[5][4]. Methods W e analyz ed diffusion MRI data from the NZ-Demen tia Preven tion Resear ch Clinic (DPRC) cohort, which included health y controls (n = 35), SCD (n = 57), MCI (n = 103), and AD participants (n = 26). Diffusion tensor and kurtosis parame ters were estimat ed using DESIGNER2[6]. and F A, MD, Mean Kurtosis (MK), and Radial Kurtosis (RK) were computed. Whole-br ain tractogr ams were then gener ated using a spherical decon volution algorithm in StarT rack [1], providing additional Hindrance Modulated Orient ational Anisotropy (HMOA) metrics. MegaT rack [3] was used to align all individual tractogr ams to a standard space, allowing a single manual dissection of the parahippocampal cingulum(see left panel in figure), then warped back to each subject ’ s native space (see middle panel), where micr ostructural metrics w ere extr acted for each individual. Results A two-wa y ANCOV A (Group x Hemisphere) contr olling for age and se x revealed significan t group diff erences in MD , MK, RK, and HMOA (all FDR-corrected p < 0.001). F A was not significant after correction (F = 2.35, p = 0.071) but showed a downwar d trend tow ards MCI and AD. No hemispheric differ ences were observed across metrics. Post -hoc pairwise ANCOV A showed significant incr eases in MD and decreases in HMOA in MCI and AD. Notably , MK and RK were significan tly higher in the SCD group compare d to Contr ols (MK: FDR p = 0.0008; RK: FDR p = 0.0001) but then re duced in the MCI and AD group s (right panel figure). Conclusion Our findings support the emerging view that DKI metrics are sensitive to early WM changes in preclinical AD[7]. Eleva ted MK and RK values that we find in SCD may reflect neur oinflammatory processes such as microgliosis and cy tokine release, consis tent with increased diffusion res triction[7]. Later -stage pathology such as myelin break down, ax onal loss and apoptosis [9] may be detected by DTI metrics (increased MD , reduced F A, and HMOA ). In summary , our findings suggest fitting DKI in the ROI based tr actograph y of the parahippoc ampal cingulum might be a sensitive biomarker f or neural changes in SCD. The underlying mechanism may be neuroinflamma tory responses that pr ecede WM degeneration measur ed by DTI metrics. 44 T ittle- Mapping Reward Processing Circuits- Cortico-Striatal White Matter T racts and their Associations to Psychopathological Traits Authors- Santiago Mezzano 1 , T obias Fernandez Borkel 1 , V eronica Orbecchi 1 , Manu Raghavan , Ahmad Beyh, Flavio Dell'acqua Acqua 1 , Affiliations: 1 Institute of Psychiatry , Psychology , and Neuroscience, King's College London Introduction Dysfunction in reward-related brain circuits, particularly involving the orbitofrontal cortex (OFC) and its projections to the nucleus accumbens (NAcc), have been implicated in various psychopathologies, including depression, anxiety , and attention-deficit/hyperactivity disorder (ADHD) ( Kujawa, 2019). The OFC is structurally , and functionally divided into the medial OFC (mOFC) and lateral OFC (lOFC), with the mOFC primarily involved in processing rewards and the lOFC associated with non-reward or punishment sensitivity (Rolls, 2019). These divisions influence goal-directed behavior and emotional regulation through their White Matter (WM) connectivity with the NAcc (Haber , 2012). Despite extensive functional imaging evidence, the structural underpinnings of these pathways remains unexplored. This study investigates the structural associations of lOFC-NAcc and mOFC-NAcc tracts to psychopathological scores, using dif fusion MRI data from healthy subjects from the Human Connectome Project (HCP) (V an Essen, 2013). Methods T ractography for 166 participants form the HCP was processed with a spherical deconvolution algorithm using Startrack (Dell’Acqua, 2010). MegaT rack, a novel tractography segmentation tool (Dell’Acqua, 2025) enabled ef ficient and unbiased tract segmentation by aligning tractograms into a common standard space for a single manual dissection. This dissection was then mapped back to native space, allowing for precise dif fusion and tractography metrics extraction for each subject. V irtual dissection identified four bilateral pathways connecting the lOFC and mOFC to the NAcc, with ROIs derived from the DKT atlas (Desikan, 2006) Microstructural metrics extracted were fractional anisotropy (F A), hindered modulus of anisotropy (HMOA) (Dell’Acqua 2013), and tract volume. An mOFC/lOFC ratio was computed. Psychopathological traits were measured using HCP Achenbach Adult Self-Report DSM-oriented scores (Achenbach, 2003). Correlation analyses and multiple linear regression, adjusted for age and gender , evaluated associations between tract metrics and psychopathological scores. Results and Discussion The F A of lOFC-NAcc pathways positively correlated with total psychopathological traits, while mOFC-NAcc F A showed a negative correlation. A lOFC/mOFC ratio emerged as a stronger predictor of psychopathology than individual tracts. Multiple linear regression analyses and random split-half testing further supported the significant association of the OFC ratio with psychopathological traits. T o gain greater specificity into psychopathological traits, we analyzed their DSM derived subtypes and found that the F A ratio was significantly associated with depression, somatic problems, avoidant personality traits, and ADHD, with all associations surviving FDR correction (Figure 1). Additionally , other analyses revealed specific links between the lOFC/mOFC ratio and inattention traits in ADHD (R = 0.226, p = 0.0036), but not hyperactivity . Conclusion This study provides some promising evidence of structural distinctions between lOFC-NAcc and mOFC-NAcc pathways in relation to psychopathology . Particularly , findings align with the non-reward attractor theory of depression, and could suggest that the lOFC/mOFC ratio serves as a sensitive marker of reward and punishment dysfunction. The observed lateralization ef fects underscore the need to consider hemispheric dif ferences in reward processing networks. Future investigations should validate these findings in clinical populations and explore their utility for psychiatric translation. References 1. Achenbach & Rescorla, ASEBA Manual, 2003 2. Cheng et al., Brain, 2016;139(12):3296–3309 3. Dell’Acqua et al., Neuroimage, 2010;49(2):1446–1458 4. Dell’Acqua et al, biorxiv 2025;7:24 5. Desikan et al., Neuroimage, 2006;31(3):968–980 6. Haber , J Chem Neuroanat, 2012;42(4):221–230 7. Kujawa et al., J Child Adolesc Psychopharmacol, 2019;29(5):378–385 8. Rolls, The Orbitofrontal Cortex, OUP , 2019 9. Rolls & Deco, Neuroimage, 2017;159:388–400 10. V an Essen et al., Neuroimage, 2013;62(4):2222–2231 45 High-r esolution diffusion MRI an d tractograp hy in the in-vivo & ex-vivo non-human primate brain at 10.5T Moha med Kotb Selim 1 , Shau n W arri ngton 1 , Ben jamin C. T endl er 2 , W enchua n W u 2 , Stee n Moeller 3 , Ham za Farooq 3 , Pram od Pishar ady 3 , Edwa rd J. Auerb ach 3 , Greg or Adriany 3 , Fran co Pestilli 4 , Sara h Hei lbronner 3,5 , Essa Y acoub 3 , Kam il Ugurbil 3 , Chri stophe Len glet 3 , Karl a Mille r 2 , Saad Jbabdi 2 , Jan Zimm ermann 3,6 , Stam atios N. S otiropoulo s 1 1 Sir Pete r Mansfi eld Imag ing Cent r e , School of Medic ine, Uni versity o f Notting ham, UK . 2 Oxford Centre for Integrat ive Neuroimaging, Univers ity of Ox ford, UK. 3 Centre for Magne tic Reso nance Re search, University of Minn esota, M N, USA . 4 Departm ent of Ps ychology & Neu r oscience , Univer sity of T exas at Aust in, TX, USA . 5 Baylor C ollege o f Medicin e, TX, U SA. 6 Departm ent of N euroscience, Unive rsity of M innesot a, MN, USA. Intr oduction: A key challenge in diffu sion MRI (dMRI) tractog raphy stems from ambiguities in resolving white matter (WM) microsc opic fibre patterns from macroscale data of limited spatial resolution. One approach to push resolution is to take advanta ge of the greater baseline signal a vailable when scanning a t ultra-hi gh field 1 . Howeve r, u ltra-hig h field M RI has its own set of challenges 2 , for instance a shorte r T2 and increa sed suscep tibility-in duced distortions. In this work, we present high resolutio n dMRI dat a for the non-h uman primate (mac aque) bra in obtaine d using a 10.5T whole-body human MRI scanner . W e propose in-vivo and ex-viv o acquisition protocols for pushing resolutio n towards the mesoscale, along with a pipeline from image reconstructio n to data quality assessme nt and biophysical modelling. This enables tractography reconstructio ns at ultra- high field, which we demons trate here. The presente d developmen ts are part of the Centre for Mescosc ale Connectom ics ( https://m esoscale- connect ivity .or g/ ), a large -scale program me that perform s whole-brain tracing, microscop y and MRI for the same human and macaque brains, with the aim to map axons directly to dMRI signals and tractogr aphy . Method s: W e developed dMRI protocols for the in- vivo and ex-vivo macaque brain using a Siemens MAGNE TOM 10.5T human scanner (CMRR, Universi ty of Minnesota ), fitted with SC72D gradien ts (70 mT/m) and a custom-built 32-ch annel receive coil. In-vivo acquisitions from an anesthetized macaque used a PGSE-E PI sequence at an isotropic resolution of 0.75mm (TE=66ms, TR=7.35 s, GRAPP A=3, 75% partia l Fourier) with b=100 0, 2000 s/mm 2 , 54 volumes per shell and 4 repeats for each of the two phase encodin g directio ns AP/P A, scan time ≅ 2hrs). Ex-vivo data were acquired using a dif fusion-weight ed steady-state free pre cession (D W - SSFP) protocol 3,4 (TE=16m s, TR=21ms, flip angle=14 o , single-lin e readout) with an is otropic s patial re solution of 0.4mm, 2 q-val ues (150 & 225 cm -1 equivalent 5 to b=3,040 & 5,430 s/mm 2 ) and 121 volumes (scan time ≅ 28hrs) . Data were reconstru cted of fline using a SENSE 1 coil combination 6 and complex-domai n denoising (NORD IC 7 ). In-vivo EPI data were motion and distortion correcte d following standa rd practic es 8 . Non-lin ear registrat ion was performed to standard NMT macaque space 9 . Fiber orientation s were estimated (up to 3 per voxel) using SE (for in-vivo) and SSFP (for ex-vivo) models of paramet ric spherical deconvo lution, follow ed by landm ark-based tract ography (XTRACT) 10 . Results: Fig1 display s preproc essed data (shell-wise average s and DTI-V 1 RGB-colour coded maps), with uniform signa l and high diffusion contrast. The achie ved spatial resolutions (0.75 mm in-vivo, 0.4 mm ex-vivo) are am ongst the hi ghest r eported to d ate for the macaqu e brain from a human whole-bod y scanner with a convent ional gradient insert. Fig2 displays crossing-fibre estimat es in the centrum semi ovale, re vealing sensitivi ty to detect 2-way and 3-way crossings both in-vivo and ex- vivo. Tra ctography performance for a number of major WM bundles is demonstrate d in Fig3, revealing good corres pondence between in-vivo and ex-viv o data, but also thinner projections arising from the higher -resolution ex-vivo data. Finally , we explored whole-brain probabi listic tractogra phy using the ex-vivo data, reconstructing a tract density image (TDI). Fig4 shows the spatial distribution of streamlines, RGB colour -coded by principal fibre orientation and binned into 0.2mm voxels. Details such as crossing s in the centrum semiovale and fanning towards the cortical gyr i can be observe d, showc asing data qu ality . Conclus ion: W e have presented approaches for pushing the resolution of dMRI at 10.5T for the in-vivo and ex-vivo macaque brain. W e anticipate that th ese d evelopm ents w ill pa ve the way for human in-vivo and ex-vivo dMRI scanning at ult ra-high field. The dat a will be publicly releas ed and accomp anied b y PS-OC T microsc opy and axonal tr acing of the sam e brains. Refer ences : [1] Gr ier et a l. (2 022). Ne uroImage . [ 2 ] Nilsso n ( 2023). Adva nces in Magnet ic R esonanc e T echnolo gy . [3] Mc Nab & Miller (201 0). NM R Biomed . [4] T endle r et al. (202 4). BIC-I SMRM . [5] Miller et al. (201 2). NeuroImage . [6] Sotiropoulo s et al. (2013 ). Magn Reson Me d . [7] Moe ller et al. (2021). N euroImage . [8] A nderss on & So tiropoulo s (2016). NeuroImage . [9] Seidlitz et al. (20 18). Neu r o Image . [10] W arring ton et a l. (2020) . NeuroImage . 46 SBI Me ets Tra ctograp hy: A n ew approach fo r Bayesian infe rence in diffusion MRI models J.P. Man zano-Patrón 1* , Manue l Gloecker 2* , Cornel ius Schr öder 2 , Jakob H . Macke 2,3* , Stamat ios N. S otiropoulos 1* 1 Sir Pete r Mansf ield Ima ging Centre, Sc hool of Medicin e, University of Notting ham, U K. 2 MPI for Intellige nt Systems, Universi ty of Tübingen, G ermany. 3 Hertie In stitute for AI in Brain He alth, Tübingen, G ermany. * Equal C ontribut ion INTRO DUCTI ON: Simulat ion-Bas ed Inference (SBI) has emerged as a powerful framewor k fo r B ayesian inferenc e. Neural networks are trained on in-silic o simulatio ns from a forward model, and subseque ntly applied to unseen data for rapidly estimating posterior distribut ions of the model parameters given the data (amortis ed infere nce, see Fig.1) [1]. W e recently presente d how SBI ca n be u sed for parametric spherical deconvo lution from diffusion MRI (dMRI), for mappin g uncert ainty of fibre orien tation estimates and perform ing probab ilistic tractography [2]. Howev er, inherent challenges remain: i) trained networks can be tied to the acqu isition scheme and/or noise level/fea tures used for training, ii) choosing the right model (including e.g. model complexity , number o f modes, noise model, priors) can typically rely on heuristic s/deterministic model selection [2,3]. Here, we propose a new transfor mer -based simu lation-based model infer ence (SBMI ) arch itecture [4,5 ] that addresses these two challenges, by allow ing a) concurrent model select ion and paramete r inference over multiple model classes in a single framework, and b) flexible adaption to different acquisitio n schemes , priors, noise level and mode l configur ations at infe rence time (i.e. post-t raining) . We show results in the context of Bayesian inference for a multi-com partment model and probabilisti c tractograph y, but the presented principle s apply to any dMRI m icrostructure m odel. METH ODS: We trained SBI networ ks on synthetic data using the mult i-shell Bal l&Sticks [6] as a forward mod el and acquisition schemes matched in length to the UK- Biobank dMRI protocol (105 volumes), as in [2], but with varying b-v alues (up to b=4000 s/mm 2 ) and gradient directio ns. We subsequen tly compared three approaches (Fig. 1) in their ability to resolve fibre crossings and the respecti ve o rientation u ncertainty: random-walk MCMC, our previous SBI archite cture [2] trained jointly on models with N=1,2,3 stick compartments, and the propose d SBMI_tr ansformer, which was based on the simform er architec ture [5]. Evalu ations were first perform ed using UK Biobank-like data from [7 ]. For SBMI_t ransform er, model po sterior pro babilities w ere inferred jointly with parameter posteriors, preser ving uncerta inty across all plausible models. We assessed mean parameter estimates, uncertainty , and tractograph y by propaga ting posteri or orientati on samples to build spatial distribu tions of white matter (WM) pathway s [8]. We fi nally tested the ability of SBMI_transf ormer in adapting to different acquisiti on schemes, by applying the network trained on UKB -like data to HCP-like data (i.e. consider ably different b-vals, b-vecs and length of data compare d to the trainin g set). RESUL TS: Compared t o MCM C, both S BI approaches provide high agreemen t on mean estimates with MCMC (Fig.2A) , demonstra ting the feasibility of these frameworks. However, SBMI_ transformer improve s over previous SBI by achievin g bette r estimation for the thir d orient ations a nd their uncertainty, sharper contrast between WM and non-WM (Fig.2A), and greater coherence in the crossing fibres areas ( Fig. 2B ). These improve ments a re directly translated into a great er corre lation with MCMC in the reconstr ucted tractography (Fig.2C) compared to SBI (0.92 vs 0.85 respectivel y). Importantl y, we can use the same trai ned network for HCP-lik e data (Fig.3) sh owcasing the capability of SBMI_ transformer to amort ise now among any acquisit ion sche me, eve n when the num ber of vo lumes and q-sp ace sampling di ffer sub stantiall y from those at training . CONCL USION: We introduced a transformer-bas ed SBI architecture for Bayesian inference in diffusion MRI, that can inherent ly handle model selection, as well as paramet er estimation and can generalis e to unseen data from differen t-to-train ing acquisit ion schemes on inference time. Demons trated on the Ball& Sticks model and probabil istic tractograp hy, the principles are appl icable f or estim ation an d uncert ainty ma pping to any d MRI microstruc ture or orientat ion mod el. Referenc es : [1] Cranmer, PNAS, 2020 [2] Manzano-Patr ón, Med. Imag. Analysis, 2025 [3] Karimi, Imag Neuro, 2024 [4] Schröde r, ICML , 2024 [5] Gl oeckler, ICML, 2024 [6] Jbabdi, MRM, 2012 [7] Manzano-Patr ón, Imag Neuro, 2024 [8] Warring ton, Neu roImage , 2020 47 A Deep Diffusion Model Appr oach for Diffusion MRI White Matter Fiber T ractography Y ijie Li1, W ei Zhang1, Xi Zhu1, Y e W u2, Y ogesh Rathi3, Lauren J O’Donnell3, Fan Zhang1 1 University of Electronic Science and T echnology of China, Chengdu, China 2 Nanjing University of Science and T echnology , Nanjing, China 3 Harvard Medical School, Boston, USA Introduction Complex fiber geometries like crossings, bottlenecks, and partial volume effects challenge white matter tractography . T raditional model-based approaches are computationally demanding and sensitive to noise. At the same time, most deep learning methods rely on fiber orientation distributions (FODs) approximations or discrete direction sampling, limiting their accuracy and continuity in streamline prediction[1, 2]. Method Dataset : W e use dMRI data from the HCP-Y A[3], with 8 subjects for training and 2 for validation. T ractSeg provides reference tractography[4], yielding ~100k streamlines per subject. Evaluation is conducted on the ISMRM 2015 challenge dataset using T ractometer connectivity metrics[5, 6], with qualitative results shown for one randomly selected HCP subject. Method : The pipeline normalizes diffusion MRI volumes using the b0 image and projects them into spherical harmonics (SH) (up to ). From each voxel, a SH patch is extracted and processed by dual 3D CNNs to produce two embeddings: a temporal encoding and a spatial context vector . The temporal embeddings are input to stacked RNN layers to model long-range dependencies and generate context vectors . A 1D CNN-based U-Net diffusion model, tailored for sequential streamline data, then predicts the next direction via the conditional distribution . Fig.1. The overview of our method and results. Results Fig. 1b shows that our method achieves the highest valid connection rate and lowest invalid and missing connections, demonstrating strong accuracy and robustness. With over 60% overlap with ground truth bundles, it ensures broad anatomical coverage. Fig. 1c illustrates accurately reconstructed tracts from the HCP test set. Conclusion W e propose a diffusion model-based tractography framework that enhances the estimation of fiber orientations. The method exhibits robust and consistent performance across both phantom and in vivo datasets, demonstrating its generalization capability . Reference 1. Poulin P , Jörgens D, Jodoin P-M, Descoteaux M. T ractography and machine learning: Current state and open challenges. Magn Reson Imaging. 2019;64:37–48. 2. Karimi D, W arfield SK. Diffusion MRI with machine learning. Imaging Neuroscience. 2024. https://doi.org/10.1 162/imag_a_00353. 3. Elam JS, Glasser MF , Harms MP , Sotiropoulos SN, Andersson JLR, Burgess GC, et al. The Human Connectome Projec t: A retrospective. Neuroimage. 2021;244:1 18543. 4. W asserthal J, Neher P , Maier-Hein KH. T ractSeg - Fast and accurate white matter tract segmentation. Neuroimage. 2018;183:239–53. 5. Themefisher . T ractometer . T ractometer . n.d. https://tractometer .org/. Accessed November 4, 2024. 6. Maier -Hein KH, Neher PF , Houde J-C, Côté M-A, Garyfallidis E, Zhong J, et al. The challenge of mapping the human connectome based on diffusion tra ctography . Nat Commun. 2017;8:1349. 48 Deconstructin g DTI-ALPS: Clarifying the biological i nterpretation in aging and cerebral smal l vessel diseas es Ami Ts uchida 1,2 , Stanli slas Thoumyr e 1,3 , Quen tin D’Acremo nt 1,2 , Laure nt Petit 1,4 , Marc Joliot 1,4 , Steph anie Debette 2,5 1. Groupe d’Im ager ie Ne urofonctio nnelle (GI N), IMN, U MR5293 , U B ordea ux, Franc e ; 2. Bor deaux Po pulati on Health (BPH), U121 9, U Bord eaux, Fran ce, 3. Sh erbrooke Conn ectivity Im aging Lab (SCIL), U Sherbroo ke, Cana da ; 4. IR P OpTea m, C NRS Biolo gie, F rance – U Sherbroo ke, Cana da ; 5. Ins titut du C ervea u (ICM) P aris, Fran ce Introdu ction: The gly mphatic pathway helps maintain brain health by clear ing metabolic w aste, and its fa ilure ha s been l inked to age-r elated conditio ns, including cerebra l small vessel disease (cSVD) 1 . Recen tly, a simple m etric termed d iffusion tensor imaging (DTI) analysis along the pe rivascul ar spac es (ALPS) ha s emerg ed as a prom ising no n -invasive marker of gly mphati c function , with reductio n obse rved in cSVD and oth er age-re lated neurolog ical conditions 2 . Althou gh it has been used e xtensiv ely as a me asure of glymp hatic clearanc e capac ity, its biologic al spec ificity remains debate d 3 . In par ticular, variabili ty in cr ossing fibers a cross s ubjects and c SVD-rela ted microstruc tural changes may confound ALPS measu rements. For inst ance, cSVD- related fluid a ccumula tion can reduce the in dex without a ltering the per ivascular d iffusivity the in dex is d esigned to measure. Here w e propo se a refined A LPS index (r-AL PS) that (1) mi nimizes the impact of crossin g fibers and (2) incorporates f ree wat er correcti on (fwc ) to bett er isola te periv ascular diffusiv ity from extrace llular fluid accu mulation. Method s: We compu ted bot h standard (st d) and r -ALPS in a cohort of el derly vo lunteers aged >65 yea rs (N=73, mea n age 7 3.8 yrs), wh o either had m inimal ( CTL, n =29, Fa zekas 0/1) or e xtensive cSVD (cSVD, n=44, F azeka’s 2/3). A ll subjects unde rwent an MRI sessio n that in cluded T1w, F LAIR, and mu lti-shell DWI (b- values = 300, 1000, and 2000 s/mm 2 , 100 di rection s, 1.75 mm isotropi c resolu tion) acquisitio ns. DWI data were p reprocessed w ith TractFlow 4 , followe d by a standa rd DTI fitting u sing sh ells <1500 sec/mm 2 and fw c-DTI f itting us ing all shells. Figure 1 summ arizes the std- (top) an d r- (bottom) A LPS extractio n. White matter hyperin tensities (WMH ) were segme nted from T1w and FLAIR u sing SHIVA-WMH 5 . Results : The group co mparis on of std - and r-ALPS indices as wel l as free water fraction (FWF) in r-AL PS ROIs were analyzed with line ar models, ad justing for age and sex. As shown in Figur e 2, the std-ALPS was nominally lower in cSVD compared to CTL, bu t only significa nt on t he righ t side (p = 0.02), whic h also showed significant eff ects of age (p = 0.00 6). The r-ALPS showed a simil ar patte rn, with a signif icant group effe ct only on the ri ght side (p = 0.02), but no long er with any age effects (p > 0.05). F WF was consi stently elevated in cSVD relati ve to CT L (all p < 0.01) , and with robu st age e ffects (p =0.005 for the right side). In a separate ana lysis, FWF, bu t not AL PS indic es, showed a h ighly significan t assoc iation w ith WM H volum e (p<0.0001, not sho wn). Conclu sion: The FW F in ALP S regions indic ates that age -related ALPS reduct ion is confoun ded by FWF in crease with a ge, likely as a secondary effect o f WMH. Howe ver, the signifi cant gr oup dif ference on the right h emisphere re mained after f ree water correcti on. Futu re work is need ed to validate t he robu stness of the cSVD- related reduct ion of t he r-ALPS index in a larger sample and exp lore the spatial specific ity of the radial diffusivity asym metry found in side the ALPS regions . Referen ces: 1. Ang PS, Zha ng D M, A zizi S-A, N orton de M atos SA, Bror son J R. The gl ymph atic syste m and cer ebral sma ll vessel d isease. J Stro ke Cereb rovasc D is 202 4. 2. Tao ka T, Ito R, Na kamichi R , Nakane T, Kawai H, Nagan awa S. D iffusion T ensor Ima ge Analys is ALong the P erivascula r Space ( DTI- ALPS ): Revisit ing th e Meaning and Sign ificance of the Metho d. Magn Reson M ed Sci 20 24. 3. Rin gstad G. Glym phatic ima ging: a cr itical look at the DTI-ALP S index. Neur oradiology 2024. 4.T heaud G , Hou de J-C, B oré A , Rheault F, Mo rency F, Desc oteaux M. TractoFlo w: A robu st, eff icient and repro ducible d iffusio n MRI pip eline lever aging Nex tflow & Sin gularity. Neuroim age 202 0. 5. Tsuc hida A, Boutin aud P , Verrecc hia V, Tz ourio C, Debet te S, Jolio t M. Earl y detectio n of white matter h yperi ntensities usin g SHIVA -WMH detec tor. Hum Brain Map p 2023. 49 Supervised Learning for T ractogram Alignment Gabriele Amorosino 1,3 ,Mattias P . Heinrich 2 , Paolo Avesani 3 1. The University of T exas at Austin, Austin, TX, 2. University of Luebeck, Luebeck, Germany , 3. Fondazione Bruno Kessler , T rento, Italy INTRODUCTION: Precise tractogram alignment is essential for inter-subject comparison of white matter (WM) structures and clinical neuroimaging. T raditional methods based on volumetric registration often fail to capture WM fiber geometry . We propose DGT A, a deep learning-based approach that aligns tractograms directly using fiber information. METHODS: DGT A represents tractograms as point clouds and uses a graph convolutional network (GCN) with loopy belief propagation (LBP) to learn displacement fields between fibers 1 . Three graph encoding strategies were evaluated: (i) pts (k-nearest neighbors), (ii) poly (fiber polylines), and (iii) trk (neighboring fibers). The poly strategy yielded the best results. We used the T ractoInferno dataset 2 (20 subjects, 29 bundles), splitting it into 16 training and 4 testing subjects. Each tractogram was subsampled to 1000 fibers. Pseudo-ground truth displacements were computed from bundle skeletons. The model was trained for 70 epochs with a learning rate decay from 0.01 to 0.001. Experiments included 5-fold cross-validation, ensuring robust generalization. Comparisons were made with ANT s SyN 3 using RMSE, Hausdorff distanc e (HD), and the Linear Assignment Problem Distance (LAPD) metrics. RESUL TS: DGT A outperformed ANT s SyN across all alignment metrics, especially in dense fiber regions. The poly encoding preserved fiber geometry more ef fectively than other strategies. DGT A reduced Bundle Minimum Distance (BMD) 4 relative to ACPC alignment and showed improved fiber-level alignment in bundles with complex geometry . LAPD analysis confirmed a major sensitivity to fiber-density rather than volumetric bundle convolution. CONCLUSION: DGT A of fers a fiber-informed, learning-based alternative to voxel-based alignment. Its ability to align dense and geometrically intricate regions more accurately makes it valuable for connectomics and clinical research. Figure 1: DGT A Architecture. The schema illustrates the components of the reference learning model based on point cloud registration. By contrast, are reported the extensions of the architecture to exploit the relatio nal information encoded in the edges of the polylines, the digital repre sentation of white matter fibers. Figure 2: Empirical results. Left: Mean square error for (A) Loopy Belief Propagation models (pts-poly , pts-trk, pts-pts) and (B) Feature Extraction models (poly-poly , poly-trk, trk-trk) using pts-poly LBP . Right: Comparison of DGT A and ANT s in terms of (C) Bundle Minimum Distance (BMD) and (D) fiber correspondence distance (LAPD), computed with Hausdorff distance. Results averaged over all bundles across 12 test pairs. 4 Garyfallidis, E., et al., (2012). QuickBundles, a Method for T ractography Simplification. 3 Avants, B. B., et al. (201 1). A Reproducible Evaluation of ANT s Similarity Metric Performance in Brain Image Registration 2 Poulin, P ., et al. (2022). T ractoInferno - A large-scale, open-source, multi-site database for machine learning dMRI tractography 1 Hansen, L., & Heinrich, M. (2021). Deep learning based geometric registration f or medical images 50 DeepDisco: A De ep Learning Framework fo r Rapid Brain C onnectivity Esti mation Anna Matsulev its 1,2 , Thomas Tourd ias 3,4 , Michel Thieb aut de Schotten 1,2 1 Groupe d'Imagerie Neurofonctionn elle, Institut des Maladies Neurod égénératives 5293, Centre National de la Recherche Scientif ique (CNRS), University of Bordeaux, 33076 Bordeaux, France 2 Brain Connectivity and Behaviour L aboratory, Sorbonne Universities , 75006 Paris, France 3 Centre Hospitalier Universitaire (CHU) de Bordeaux, Neuroimager ie Diagnostique et Thérapeutique , 33076 Bordeaux, France 4 University Bordeaux, National Inst itute of Health and Medical Resea rch (INSERM), Neurocentre Mage ndie, U1215, 33076 Bordeaux, France Introduction: Network-based models of the brain have become central to understanding cognition, function, and disease 1,2 . Structural connectomes and D isconnection patterns offer valuable insights into behavioral mechanisms and disease biomarkers, yet practical barriers, particularly the reliance on resource-intensive tractography, limit their integration into large-scale or clinical pipelines 3–5 . This limitation is especial ly salient as the field mov es toward large le sion datase ts and AI-driven modeling frame works that demand accessible an d modular tools 6 . Methods: Here, we introduce D eepDisco, a deep learning tool that rapidly estimates disconnection maps from binary lesion or region masks, bypassing traditional tractography while preserving anatomical fidelity . D eepDisco predicts four connectivity outputs: association, commissural, projection, and whole- brain disconnections (Figure 1). It is powered by a 3D U-Net trained on 5,332 lesion-disconnectome pairs serving as ‘ground truth’ generated with the BCBT oolkit 7,8 . The model is optimized with a hybrid loss function (MSE + MAE) and supports real-time use, producing voxel-wise disconnection probability maps in under one second per lesion. Results: Designed for scalability and ease of integration, DeepDisco offers a scriptable interface and a user-friendly GUI for batch processing, making it compatible with AI pipelines and large datasets. Empirical benchmarking against tractography-derived disconnectomes demonstrates high spatial correspondence and robustness across lesion types. When applied to post-stroke behavioral data, DeepDisco significantly improves long-term symptom prediction compared to atlas-based or unimodal models (Figure 2) 9 . Conclusion: In sum, DeepDisco provides a fast, accessible, and accurate solution to the longstanding bottleneck of disconnection mapping. Its open-source, cross-platform design enables wide adoption in both research and clinical contexts, supporting real-time applications, hypothesis testing, and population- level modeling. Fi gu r e 1. The D eepDisco outputs that can be generated from the binary lesion or region input, marked in red (1). Panel (2) show s th e out put from the ‘as sociation fib re’ model, pan el (3) shows the output fr om the projection fibre model, and panel ( 4) show s the output from the commissur al fibre mod el. While the input is binar y, the output represents a pr obability of disc onnections, w ith dar ker color s (red- black) repres enting a low prob ability and lighte r colors (yellow-w hite) representin g a high prob ability for a voxel to be d isconnected Fi gu r e 2 . The boxplot shows all the R 2 for the predic4on s for stroke survivors (dataset 3, N = 119) ac ross N = 86 n europsychological scores for the f ramework using deep-discon nectomes compared to the framework using disconnectomes obtained by BCBT o olkit. The boxes represent the quar4les, the whiskers indicate the distribu4on, and th e outliers ar e mark ed as dots. In side the b ox es , the medi an is visua lized by the solid line. The P -value o btained from a paired t -test (2-tails): * P < 0.01 shows a sig nificant difference ( t (85) = −1.66 3, P = 0.009 ). References 1. Thiebaut de Schot ten, M. & Forkel, S. J. The emergent properties of the connected brain. Science 378 , 505–510 (202 2). 2. Axer, M. & Amunts, K. Scale m atters: The nested human connectome. Science 3 78 , 500–504 (2022). 3. Fox, M. D. Ma pping symptoms to brain netwo rks with the human connectome. N. Engl. J. Med. 379 , 2237–2245 (2018). 4. T alozzi, L. et al. Latent disconnectome predictio n of long-term cognitive-behavio ural symptoms in stroke. Brain 146 , 1963–1978 (2023). 5. Bonkhoff, A. K. et al. Generative lesion pattern decomposition of cognitive impairme nt after stroke. Brain Commun. 3 , fcab110 (2021). 6. Myszczynska, M . A. et al. Applications of machine learning to diagnosis and trea tment of neurodegenerative diseases. N at. Rev . Neurol. 16 , 440–456 (2020). 7. Ronneberger, O., Fischer , P . & Brox, T . U-Net: Convolutional Network s for Biomedical Image Segmentation. in Medical Image Computing and Computer-Assisted Interven tion – MICCAI 2015 (eds. Navab, N ., Hornegger, J., W ells, W . M. & Fra ngi, A. F .) vo l. 9351 234–241 (Springer International Pub lishing, Cham, 2015). 8. Foulon, C. et al. Advanced lesion symptom mapping analyses and implementation as BCBtoolkit. Gigascience 7 , giy0 04 (2018). 9. Matsulevits, A. et al. Deep learning disconnectomes to accelerate and improve long- term predictions for post-stroke s ymptoms. Brain Commun. 6 , fcae3 38 (2024). 51 White matter bundle segmentation with deformation features in glioma patients Chiara Riccardi 1,2 , Luca Zigiotto 1 , Silvio Sarubbo 1 , Paolo Avesani 1,2 1 University of T rento, Centre for Mind/Brain Sciences (CIMeC), corso Bettini, 31, Rovereto, 38068, Italy 2 Fondazione Bruno Kessler , Neuroinformatics Laboratory (NILab), V ia Sommarive 18, T rento, 38123, Italy INTRODUCTION : Automated methods for white matter bundles virtual dissection are designed and validated on healthy individuals. The tacit assumption is to estimate the canonical spatial distribution of the connectivity structures. In the clinical context, where white matter bundles deviate from the norm, this assumption is no more compliant with the premises. Our contribution aims to propose a method that by design is conceived for clinical context. METHODS : We trained a supervised geometric deep learning algorithm to perform the classification task, predicting if each streamline belongs or not to a specific bundle. Importantly , the model's input was not tractography expressed in spatial coordinates: each point P of a tractogram is encoded by 3 scalars, referred to as “deformation features”, that provide information about the possible tumor-displacement t o the white matter fibers. The deformation features are defined as: (i) the minimum distance of P from the skeleton 2 that is a representative streamline of the target bundle of the segmentation; (ii) the ratio between the tumor radius and the distance of P from the tumor ’s center of mass; (iii) the absolute dif ference between the curvature of streamline in P and on the curvature of tumor surface. T aken together , deformation features are informative about the probability of the anatomy being modified by the tumor growth for each point of streamlines in the tractogram located in the area close to the lesion. RESUL TS : The preliminary results prove that our proposed method is effective in segmenting bundles when tumors is deforming the canonical anatomy , especially for major displacements. The empirical analysis is carried out using a dataset of tractograms with several hundreds of healthy individuals and the related major bundle annotations, a clinical dataset with several hundreds of tumor masks, and a simulator to generate plausible deformations combining the two datasets. In addition, we replicate the analysis with a state of the art method RecoBundlesX 3 , as reported in T able 1. T able 1: The average and standard deviation of dice similarity coefficient, estimating coherence between tractography automatic segmentations with ground truth of proposed model and state of the art method RecobundleX, for 5 major bundles. CONCLUSIONS : We proposed a novel method for white matter bundles dissection in glioma patients. For the first time a computational learning model is conceived by design for the clinical context, where the canonical pathways of fibers deviate from the pattern of healthy individuals REFERENCES : 1. Zhang, F ., et al., (2018). An anatomically curated fiber clustering white matter atlas for consistent tract parcellation across the lifespan. 2. Amorosino G, et al., (2023). How Does White Matter Registration Af fect Tractography Alignmen t? 3. Garyfallidis, E., et al., (2018). Recognition of white matter bundles using loc al and global streamline-based registration and clustering inferior fronto-occipital fasciculus arcuate fasciculus frontal aslant tract Inferior longitudinal fasciculus pyramidal tract Deformation Features 0.84 ±0.08 0.72 ±0.07 0.82 ±0.07 0.76 ±0.05 0.87 ±0.07 RecoBundlesX 0.56 ±0.33 0.61 ±0.25 0.57 ±0.28 0.54 ±0.23 0.83 ±0.16 52 Identifying the Microstructural Neur obiological Signature of Brain Lesions and Disconnected Tissue Using the UK Biobank Anna Matsulevits 1,2 , Oliver Parent 3 , Thomas T ourdias 4,5 , Michel Thiebaut de Schotten 1,2 , Mallar Chakravarty 6 1 Groupe d'Imagerie Neurofonctio nnelle, Institut des Maladies Neurodé génératives 5293, Centre National de la Recherche Scientifique (CN RS), University of Bordeaux, 330 76 Bordeaux, France 2 Brain Connectivity and Behaviour Laboratory, Sorbonne Universities , 75006 Paris, France 3 Cerebral Imaging Centre, Douglas Mental Health UniversityInstitute , Verdun, Canada 4Centre Hospitalier Universitair e (CHU) de Bordeaux, Neuroimageri e Diagnostique et Thérapeutique, 33076 Bordeaux, France 5 University Bordeaux, National Ins titute of Health and Medical Researc h (INSERM), Neurocentre Mage ndie, U1215, 33076 Bordeaux, F rance 6 Department of Biological and Biom edical Engineering,McGill Universit y, Montreal, Canada Introduction: Understanding the microstructural consequences of brain lesions is critical for deciphering the mechanisms underlying neurological dysfunction and advancing therapeutic interventions. In this work, we investigated the microstructural and connectivity-based signatures of brain lesions across neurodegenerative pathologies using data from the UK Biobank. Methods: W e implemented a comprehensive and multimodal approach to characterize both the local and remote impact of brain lesions on tissue microstructure and connectivity. Our pipeline began with the selection of participants diagnosed with neurodegenerative diseases alongside matched healthy controls. From diffusion- and susceptibility-weighted imaging data, we derived biologically informative microstructural maps sensitive to fiber density , free water content, myelin integrity , and iron deposition (Figure 1). T o contextualize these measures and enhance interpretability , we constructed voxel-wise normative models in the healthy cohort using Bayesian linear regression, adjusting for key covariates such as age and sex (Figure 2). Based on these models, we generated individual-level z-score maps, enabling the quantification of microstructural abnormality relative to normative expectations. For participants with pathology , we extracted lesion maps and applied a deep-disconnectome model to estimate personalized disconnectivity profiles, probabilistic maps reflecting white matter disconnection induced by focal damage 1 . These disconnectome maps were then spatially correlated with the z-scored microstructural abnormalities to reveal regionally specific patterns of remote degeneration. T o explore disease-specific microstructural p henotypes, we will apply Uniform Manifold Approximation and Projection (UMAP) to the z-scored microstructural profiles 2 . This dimensionality reduction technique allows the construction of a morphospace where pathology-specific clusters can emerge, supporting the concept of microstructural “fingerprints” that differentiate diseases based on tissue properties and disconnection profiles. At the time of submission, data preprocessing and pipeline development are complete, and full-scale analyses are actively underway . Results: Results will be available by the time of the conference, and are expected to yield insights into how structural brain injury alters tissue properties both locally and across distributed networks. Conclusion: These findings have the potential to bridge the gap between connectomic disruption and microstructural pathology , offering new avenue s for biomarker discovery and personalized interventions. Fi gu r e 1. The microstructural markers use d to construct microstructural signatures of brain lesions . MD = Mean Diffu sivity, FA = Fract ional A nisotropy, ICVF = Intr a-Cellular Vo lume Fract ion, ISOVF = Isotropic Vo lume Fract ion, OD = O rientation D ispersion, QS M = Quant itative Susce ptibility Ma pping. Fi gu r e 2 . Vi sualization of the voxel -wise, tissue specifi c no rmative model ob tained with the Baye sian linear regress ion (Micro ~ bs(age,3 ) + sex ) and its output. Age and sex were used as covariates. GM = gray matter, NAWM = normal appearing white matter, FA = Fractional Anisotropy, MD = mean diffusivity. References 1. Matsule vits, A . et al. Deep lea rning di sconnec tomes to accelera te and im prove lo ng-term p rediction s for pos t-stroke sympto ms. Brai n Comm un. 6 , fca e338 (2 024). 2. McInne s, L., He aly , J. & M elville, J. UMAP : Uniform Manifo ld Ap proxima tion and P rojection for Dim ension R eduction . Preprin t a t https://d oi.org/10.48 550/arXi v .1802.0 3426 (20 20). 53 Diffusion MRI tractography to reduce risks of postoperative neurological deficits: A systematic review and meta-analysis ! Guid o I. Gub erm an, M D, PhD 1 , Gu illau me T hea ud, PhD 2 , Fra n•o is Rh eau lt, P hD 3 , Jos eph Y.-M . Y ang, PhD 4-6 , Max ime Des cotea ux, PhD 3 , Sil vio S arub bo, MD , Ph D 7,8 , Sam i O baid , MD , P hD, FRC SC 2,9 1. Departmen t of Neu rology and Neu rosurge ry, Facul ty of Me dicine, McGill U niversity , Montre al, Queb ec, Cana da 2. Neuroscie nce Rese arch Ax is, Univ ersity of Montre al Hosp ital Rese arch Cen ter (CRC HUM), Montreal, Q uebec, C anada 3. Computer Science Departm ent, Uni versitŽ d e Sherbr ooke, Sh erbrooke , Quebe c, Canad a 4. Departmen t of Neu rosurge ry, Neur oscienc e Advan ced Clin ical Imag ing Ser vice, The R oyal Ch ildrenÕs Hospital , Melbo urne, Au stralia 5. Neuroscie nce Rese arch, Mu rdoch Ch ildrenÕs Research Institute , Melbou rne, Aust ralia 6. Departmen t of Ped iatrics, T he Univ ersity of Melbou rne, Me lbourne , Austral ia 7. Center for Medical Science s, Depar tment of Cellula r, Compu tational and Inte grative B iology C enter fo r Mind a nd Brain S ciences, Univers ity of Tr ento, Tre nto, Ital y 8. Departmen t of Neu rosurge ry, ÒS. C hiaraÓ U niversit y-Hospita l, Aziend a Provi nciale pe ri Serviz i Sanitar i, Trento , Italy 9. Departmen t of Neu roscien ce, Univ ersity of Montre al, Mont real, Qu ebec, Ca nada Despite informing on the location of functionally relevant white matter tracts, diffusion MRI tractography is not routinely used to guide neurosurgical procedures. The potential of tractography to help avoid postoperative neurological deficits is not yet fully established. ! The objective of our study was to assess whether surgeries that incorporated tractography, either alone or in conjunction with other modalities, are associated with a lower risk of long-term postoperative neurological deficits in patients undergoing resective/ablative intracranial procedures. ! We performed a systematic review with meta-analysis, searching through EMBASE and PubMed databases for all p eer-reviewed articles published in English up until December 2024. Studies were included if they reported on intracranial resective or ablative surgeries, if they compared tractography-assisted against non-tractography-assisted approaches, and if they assessed new postoperative neurological deficits. No restrictions were placed on the age of p atients. Studies were assessed for inclusion by two independent reviewers and disagreements were settled by a third. Data extraction was performed accordi ng to PRISMA guidelines, quality of studies was evaluated using the GRADE Framework, and risk of bias was assessed through a modified version of the Newcastle-Ottawa Quality Assessment Scale for cohort studies. Data were pooled using a random- effects model w ith a Mantel-Haenszel method for estimating risk ratios. The primary outcome consisted in any neurological deficits present at last follow-up ( ≥ 3 months). ! Out of 5315 studies initially identified, eight w ere included after all stages of revi ew, all of which consisted of resective surgeries. A meta-analysis of 629 patients revealed a 55% risk reduction of postoperative neurological deficits when incorporating tractography in the neurosurgical workflow. This benefit was still observed when assessing studies where tractography was exclusively used preoperatively. Further, the incorporation of tractography into intraoperative neuronavigation systems w as associated with lower proportions of postoperative neurological deficits, compared to exclusively preoperative tractography. When considering the effect of additional brain mapping adjuncts, although a non-significant risk reduction was observed when excluding studies that incorporated other imaging modalities, results did show significant reductions in risk of postoperative neurological deficits after excluding studies that incorporated direct electrical stimulation. Finally, our results were also consistent after removal of the study with the largest weight, showing robustness to sample perturbations. ! The addition of tractography is associated with a reduced risk of postoperative neurological deficits in intracranial resective surgeries. Tractography can complement gold standard brain mapping methods such as direct electrical stimulation during awake surgeries or serve as a helpful alternative when electrical stimulation is contraindicated. ! 54 Title: Surface-based T ractography uncovers ‘What’ and ‘Where’ Pathways in Prefrontal Cortex Authors: Marco Bedini 1 , Emanuele Olivetti 2,3 , Paolo A vesani 2,3 & Daniel Baldauf 2 Affiliations: 1. Institut de Neurosciences de la T imone (INT), Aix-Marseille University , Marseille, France; 2. Center for Mind/Brain Sciences (CIMeC), University of T rento, T rento, Italy; 3. NeuroInformatics Laboratory (NILab), Bruno Kessler Foundation (FBK), T rento, Italy Introduction: The frontal eye field (FEF) and the inferior frontal junction (IFJ) are prefrontal regions that mediate top-down control. Accumulating evidence suggests a functional division of labor , with the FEF supporting spatial and the IFJ non-spatial processing¹. W e hypothesized that this dissociation is rooted in distinct structural connectivity profiles². Methods: W e localized the FEF and IFJ in standard space using an activation likelihood estimation (ALE) meta-analysis of fMRI studies that robustly engaged these regions³. Using 3T diffusion MRI data from the Human Connectome Project 4 , we performed surface-based probabilistic tractography 5 on 56 unrelated subjects. For each subject, we seeded tractography from meta-analytically defined FEF and IFJ peaks and traced ipsilateral connections to dorsal and ventral visual stream regions, delineated on the native white matter surface ⁶ and parcellated using the multimodal Glasser atlas ⁷ . Results: The FEF showed higher structural connectivity likelihood with dorsal visual stream regions, particularly in the left hemisphere. Conversely , the IFJ demonstrated higher connectivity likelihood with ventral stream regions bilaterally . These patterns remained robust after controlling for Euclidean seed-to-target distance. Conclusions: Our findings reveal distinct connectivity fingerprints for the FEF and IFJ, supporting their proposed specialization in spatial versus non-spatial processing. The results provide anatomical evidence that the dual-stream visual architecture extends into the lateral prefrontal cortex 9 . Figure 1. Panel A: Processing pipeline implemented with the FSL package ⁵ . Panel B: Summary of results. Asterisks indicate contrasts that remained significant after c ontrolling for seed-to-tar get distance. _________________________________________________________________________ 1. Bedini, M., & Baldauf, D. (2021). Structure, function and connectivity fingerprints of the frontal eye field versus the inferior frontal junction: A comprehensive comparison. Eur opean Journal of Neuroscience , 54 (4), 5462-5506 2. Passingham, R. E., Stephan, K. E., & Kötter, R. (2002). T he anatomical basis of functional localization in the cortex. Nature Revi ews Neuroscience, 3 (8), 606–616 3. Bedini, M., et al. (2023). Accurate localization and coactivation profiles of the frontal eye field and inferior frontal junction: an ALE and MACM fMRI meta-analysis. Brain Structur e and Function , 228 (3), 997–1017 4. Sotiropoulos, S. N., et al. (2013). Advances in diffusion MRI acquisition and processing in the Human Connectome Project. Neur oimage , 80 , 125-143 5. Jenkinson, M., et al. (2012). FSL. Neuroimage , 62 (2), 782-790 6. Coalson, T . S., V an Essen, D. C., & Glasser , M. F . (2018). The impact of traditional neuroimaging methods on the spatial localization of cortical areas. PNAS, 1 15 (27), E6356–E6365 7. Glasser , M. F ., et al. (2016). A multi-modal parcellation of human cerebral cortex. Natur e, 536 (7615), 171–178 8. Thiebaut de Schotten, M., et al. (2011). A lateralized brain network for visuospatial attention. Natur e Neuroscience, 14 (10), 1245-1247 9. Goldman-Rakic, P . S. (1996). The prefrontal landscape: Implications of functional architecture for understanding human mentation and the central executive. Phil. T rans. R. Soc. B: Biological Sciences, 351 (1346), 1445–1453 55 GPU tractography: What can w e learn from half a trillion streamlines? Y anis Aesc hlimann 1 , Sam uel Deslauriers-Gauthier 1 , and Romain V eltz 1 1 Univ ersi t ´ e Cˆ ote d’Azur, Inria, F rance In tro duction: Probabilistic fiber tractography is a sto chastic pro cess whose outcomes can b e used t o estimate the probability of connection betw een t wo brain regions. The most commonly used estimator for the probabilit y of connection b etw een regions i and j is giv en b y c ( n ) ij /n , where n represents the total num b er of seeds and c ( n ) ij denotes the num b er of streamlines connecting the tw o regions. D espite its widespr ead use, the v ariance of this estimator is often ov erlo oked. In this study , we leveraged a GPU-accelerated implemen tation of probabilistic tractography to generate a connectivity matrix from 500,000,000,000 streamlines. Using t his large-scale dataset, w e computed rigorous b ounds on the confidence interv al of the connection probab ilit y estimator. Metho ds: When a streamline coun t connectivity matrix is normalized by the num b er of seeds, the entry in row i and column j can b e interpreted as the probabilit y of connecting regions i and j when generating a single st reamline randomly . Eac h entry therefore follo ws a bin omial distributi on with parameters n and p ij → [0 , 1] which corresp onds to the true (unkno wn) probabilit y of connection of the tr acto gr aphy pr o c ess (distinct from the strength of brain connectivity [1]). Th e quantit y ˆ p ( n ) ij = c ( n ) ij /n i s an unbiased estimator of p ij whose v ariance is ˆ ω 2 = ˆ p ( n ) ij ! 1 ↑ ˆ p ( n ) ij " /n . Using the Clopp er–Pearson metho d, the 95% confidence interv al for the parameter p ij is computed. Probabilistic fib er tractography (step size 0 . 25 mm, maximum angle 30 → ) was p erformed on fib er orientation distribution fu nction computed from the di ! usion MRI data from sub ject 100206 of the Human Connectome Pro ject. Our GPU accelerated implementation al lo wed us to generat e a connectivit y matrix from the Schaefer atlas [3] (400 regions) using n = 0 . 5 ↓ 10 12 streamlines and computed extremely precise b ounds on the connection probability p ij . F or comparison, we also generated a connectivity matrix fr om the typically recommended n = 2 ↓ 10 7 streamlines. Results: Figure 1 illustrates the ratio of the size of the confidence in te rv al o v er the estimated probability and the histogram of the connection probabilities. F or n = 2 ↓ 10 7 , 33% of the v alues are ab ov e 1 (red region in the histogram), meaning t hat the uncertaint y is at least as large as the estimate. This v alue drops to 1% (red and blue regions in the histogram) for n = 0 . 5 ↓ 10 12 . The in tra-hemispheric median ratios are 0.72 and 0.02 for n = 2 ↓ 10 7 and n = 0 . 5 ↓ 10 12 , resp ectively . It highlights the high uncertaint y of the estimated connectivity for n = 2 ↓ 10 7 . In the histogram, th e probabilities are in agreemen t only when the confidence in terv al is small compared to the estimated probabilit y (in the red region). Conclusion: GPU acceleration of tractography allo ws the generation of a large num b er of streamlines in a reasonable time. Our results show that many connectivity matrix entries are inaccurate with the current recommendation of 2 ↓ 10 7 streamlines. Our conclusion di ! er from previous ones [2] b ecause we focus on the accuracy of individuals probability of connection, rather than the global pro cess of tractography . Our Python implementation is op en-source and publicly av ailable ( https://gitlab.inria.fr/cronos/software/tractography ). Ac knowledgmen t: W e are grateful for the infrastructure of Slices RI (https://www.slices-ri.eu/) used in this study . Figure 1: Ratio of t he size of the confidence interv al ov er the estimated probability ˆ p ( n ) ij for n = 2 ↓ 10 7 and n = 0 . 5 ↓ 10 12 streamlines. The histogram of the probabili ties for 1/2 trillion and 20 million streamlines. The probabilities are reliable in the red regions for b oth estimates and only for n = 0 . 5 ↓ 10 12 in the blue region. References [1] F ernando Calamante. “The Seven Deadl y Sins of Measuring Brain Structural Connectivity Using Di ! usion MRI Streamlines Fibre-T racking”. In: Diagnostics ( 2019). [2] Daniel C. Moy er, Paul Thompson, and Greg V er Steeg. “Measures of T ractography Con vergence”. In: Computa- tional Di ! usion MR I . 2019. [3] Alexander Schaefer et al. “Lo cal-Global Parcellation of the Human Cerebral Cortex from Intrinsic F unctional Connectivity MRI”. In: Cer ebr al Cortex 28 (2018). 56 A principle d mathematical study of the limit of fib er tra ctograph y Sam uel Deslauriers-Gauthier 1 and Romain V eltz 1 1 Univ ersi t ´ e Cˆ ote d’Azur, Inria, F rance In tro duction: Fib er tract ograph y algorithms started as a numerical scheme to recov er the t ra jectory of a streamline, parameterized b y its arc length. These algorithms solved a w ell sp ecified ordinary di ! erential equation whose param- eters were specified by di ! usion tensor imaging (DTI) [2]. The limitation of DTI were quic kly recognized and the n um erical sc heme was up dated to make use of the more complex lo cal information pro vided b y the fib er orientation distribution function (fODF). This allow ed researc hers to o vercome the limitations of DTI and explore the complex arc h itecture of the white matter. How ever, this left fib er tractography algorithms in lim b o with r egards to the math- ematic al pr oblem they n umerical solve. As a direct consequence, man y parameters of tractogr aph y algorithms ( step size, maxim um angl e, num b er of seeds) ar e chosen arbitrarily with , at best, a qualitative description of their e ! ect. In this w ork, w e derive new tractography algorithms as the n umerical appro ximation to t he solution of an ordinary di ! erential equation (deterministic) or sto chastic di ! eren tial equation (probabilistic). This principled approac h not only unifies deterministic and probabilistic tractography but also ov ercomes many n umerical limitations of current algorithms and op ens the door to a deeper mathematical understandi ng of tractograph y . W e b elieve we ha ve identified the fundamental equation of tractography . Metho ds: Determin istic fiber tractography is typically implemented as a t wo step pro cess given by x i +1 = x i + u i ” t and u i +1 = g ( x i +1 , u i ) where ” t is the step size, g is derived from the fODF, x i → R 3 and u i → S 2 are the lo cat ion and direction of a parti cle at ste p i , resp ectiv ely . W e refer to this pro cess as the T ractography Marko v Chain (TMC). In the limit ” t ↑ 0, the x up date equation is di ! erential ˙ x = u while the u up date i s algebraic u = g ( x , u ) b ecause it do e s not dep end on ” t . W e prop ose t o mov e aw ay from this di ! erential–algebraic system of equations to a classic ordinary di ! eren tial equation (ODE) formulation. F or the prob abilistic fib er tractography , the direction up date is instead u i +1 ↓ g ( x i +1 , u i ). The limit ” t ↑ 0 is not very well-posed as the direction up date dominates the x up date. Results: F or the determinist ic case, we are able to sho w that streamlines emerge naturally as the solution of th e ODE d x t = u t dt and d u t = ↔ u log f ( x t , u t ) dt where f is the fODF. F or the probabilistic case, the streamlines are the tra jectories of particles satisfying d x t = u t dt and d u t = ω ↔ u log f ( x t , u t ) dt + ↗ ω dB S 2 t where dB S 2 t is the spherical Bro wn ian motion and ω is related to the in verse maximal curv atur e. Giv en their similar form, these tw o equations can b e combined into d x t = u t dt d u t = (1 + ω ) ↔ u log f ( x t , u t ) dt + ↗ ω dB S 2 t . (1) with ω = 0 corresponding to determin istic tractography and ω > 0 to probabilistic tractograph y . It is interesting to note that the solution of the ab ov e equation finds lo cal maxima of f which b eautifully corresp onds to previously used deterministic heuristic. Due to space limitation s, we do not provide the pro of here, but it is based on the infinitesimal generator [1] of a time re-scal ing of the TMC and underline s the fundamental hypotheses underpinning the existence of a limit when ” t ↑ 0. The pro cess solution of Eq. (1) solves the iss ues related to the parameter dep endency of the TMC. W e also studied the limit of the ab o ve proces s when ω ↑ 0 and discov ered the links b etw een the di ! erent forms of the tractography pro cess (determini stic, probabilistic, etc). An Euler scheme solving this system of equation is x i +1 = x i + u i ” t u i +1 = Exp u i ! (1 + ω ) ↔ u log f ( x i +1 , u i ) ” t + " ω ” tB R 2 i # where Exp is the exp on en ti al map on the sphere and B R 2 i is normally distributed. In previous probabilistic algorithms, reducing ” t has the e ! ect of amplifying noise whereas in the abov e numerical sc heme conv erges to the solution of Eq. (1) as desired. Conclusion: In this work, we ha ve identified what we bel iev e to b e the fundamental equation of tractography , time will tell if w e are correct . Our formulation is principled, numerically stable, can be studi ed mathematically , and op ens the do or to many radical new approac hes for tr actograph y . One example is to solve the F okker–Planc k e quation asso ciated to Eq. (1), obtaining the exact streamline density that would b e obtained with an infin ite num b er of seeds. Our implementation is op en-source and publicly a v ailable ( gitlab.inria.fr/cronos/software/tractography ) . References [1] Nobuyuki Ikeda and Shinzo W atanab e. Sto chasti c di ! er ential e quations and di ! usion pr o c esses . Elsevier, 2014. [2] Ben Jeurissen et al. “Di ! usion MRI fib er tract ograph y of the brain”. In: NMR in B iome dicine (2019). 57 Unbiase d tractogram d ensity optimisa tion for robust estimati on of white mat ter connectivity differences Philip P ruckner 1 , Remik a Mito 1,2 , David V aughan 1,2,3 , Kurt Sc hilling 4 , Victori a Morgan 4 , Dario E nglot 4 , Robert Smith 1,2 1 The Un iversity of Melb ourne, A ustralia; 2 The Flo rey Inst itute, Au stralia; 3 Austin H ealth, Australia ; 4 Vanderb ilt University, United S tates Introdu ction. The prospect of quantitatively mapping longitudin al connectivity changes through diffusion magnetic resonance imaging (dMRI) holds sign ificant promise for early diagnosis, disease monitoring, and pers onalized tre atments. Stre amline tractogra phy is however subjec t to considerable methodologi cal variance 1 , making it difficult to reliably detec t subtle biological effects. To address this problem, we here propose an unbiased tractogram density optimisatio n framewor k that dramatical ly reduces reconstru ction variance b y harnessing shar ed information b etween timepoi nts. Method s. The human brain establishe s its long-rang e projections predomin ately prenatally 2 , so any subsequent developme ntal or patholog ical process can be postulated to operate within an overall fixed white matter scaffold. Leveraging this anatomical constrai nt, we here propose a n ovel analysis framework wherein the u nderlying streamline trajectories for a given subject are shared across timepoi nts, with only the densities ascribed to those streamlines determi ned based on session- specific imag e data. We here presen t two approa ches for such unbia sed optimisation of tractogr am densitie s, both based on the widely adopted SIFT2 framewor k 3 . The first, symmet ric unbiase d optimisation, derives a session -average weighted tractogram which is then separately refined to fit session specific fibre densities. The second, differen tial unbiased optimisation provides a distinct methodol ogical implementatio n specifically tailored to longi tudinal analysis: instead of estimati ng streamline densities per session, it directly optimise s a session-average weighte d tractogram to fit fibre density differences between sessions. Figure 1 illustrates an exempla r output of differential optimisati on—a differentially weighted tractogram derived from a synthe tic kissi ng bundl es phantom wit h simula ted fibre loss in one bun dle. We demonstrate the benefits of unb iased tractogram optimis ation to investiga te longitudinal connectivi ty chang es within a compl ex synthetic dMRI phantom, as well as in two in vivo datasets with a clear biological expectation of an effect. Synthetic dMRI data with a signal-to- noise ratio of 20 were derived from a modified DiSCo 3 phantom 4 , simulating a central lesion that causes a loss of fibres in a wide range of bundles. In vivo datasets comprised the Human Conne ctome Project’s Scan-Res can 5 (n=44) and a temporal lobe epilep sy surgery dataset (n=52), with expecta tions of no connectivity changes and pronounced connect ivity decreases close to the resection 6 respe ctively. Results were benchmarked against cross-secti onal reconstru ction with and without SIFT2 optimisation. All connect ivity estimates were quantified as Fibre Bundle Capacity 7 , a measure of interregi onal information bandwid th. Results. In synthetic phantoms, unbiased r econstru ction resulted in significantly lower errors in longitudina l connect ivity change q uantifica tion compa red to cross- sectiona l tractogram reconstru ction (p<0. 001, see Fig. A) . In human scan-resca n data, cross-section al reconstr uction resulted in impl ausible incr eases and decre ases; in contrast, unbiase d connectivi ty quantifica tion s howed no r elevant connect ivity chang es (see Fig. B). Similar resu lts were found in longitudi nal analysis of surgical data, with unbiase d reconstruc tion showing a more plausible pattern of effects, which were mainly restri cted to the hemisp here ipsilater al to resection ( see Fig. C) . Conclus ion . Unbiased tractogram optimis ation drastically reduces methodolog ical imprecision s of estimating longitudinal connect ivity changes, enablin g robust quantifica tion of white matter connectivity differences. This novel unbiase d tractogram optimisa tion frame work will especially benefit clinical studies, where inference s must be drawn from small cohorts or individ ual cases. Robust estimation of brain connecti vity changes within an unbiased framew ork opens exciting developmen t avenues for precisio n medicin e applications of quantitative streamlin e tractog raphy, bringing advanced diffusion imaging one step closer to clinical applica tion. Referen ces 1. Smith, R. E., To urnier, J.-D., Cala mante, F. & Con nelly, A. The effe cts of SIFT on t he reproducibilit y and biological accuracy of the s tructural connec tome. Neuroimage 1 04 , 253–265 (2015) . 2. Dubois, J. et al. The early developm ent of brain white matter: a review o f imaging studies in fetuses, newbor ns and infants. Neuroscien ce 276 , 48–71 (20 14). 3. Smith, R. E., To urnier, J.-D., Cala mante, F. & Con nelly, A. SIFT2: Enabling dense q uantitative asses sment of brain w hite matter conne ctivity using stre amlines tractography. Ne uroimage 119 , 3 38–351 (2015). 4. Rafael-Patino, J . et al. The diffusio n-simulated co nnectivity (DiSC o) dataset. Data B rief 38 , 107429 (2021). 5. Van Essen, D. C . et al. The WU- Minn Human Co nnectome Projec t: an overview. Ne uroimage 80 , 62– 79 (2013). 6. McDonald, C. R . et al. Changes in fiber tract int egrity and visua l fields after ant erior temporal lo bectomy. Neurology 75 , 1631–1638 (201 0). 7. Smith, R. E. et a l. Quantitative str eamlines tractogr aphy: methods a nd inter-subject n ormalisation. Aper ture Neuro 1–25 (2022) doi:10.522 94/apertureneuro. 2022.2.neod9565. F i b r e C o u n t + - 1 Pipel ine 4 sing le un bias ed differen tial SIF T2 Pipel ine 3 sing le un bias ed symmet ric SIFT 2 Pipel ine 2 sessi on-sp ecif ic SIFT2 Pipel ine 1 sessi on-sp ecif ic N/A tract ogram (s) opti misat ion( s) Label % FBC Er ror Simu lated Effec t: a cen tral lesi on affect ing a wi de r ange of b undl es FBC C hang e TLE s urger y: i psil atera l ↓ WM densi ty ex pect ed Scan- Resca n: no WM ch ange expe cted + - C I C I C I R L R R L L FBC = Fib re Bu ndle Capa city, L = left , R = ri ght, I = ipsi latera l, C = contr alate ral C I R L R 2A 2B 2C 58 Intraoperative fast fibre tract segmentation in paediatric tumour patients Dana Kanel 1 , Fiona Young 1 , Kiran K. Seunari ne 1 , Nikhita Nandi 1 , Annemarie Kni ll 1,3 , Enrico De Vit a 1,3 , Kshitij Mankad 4 , Chris A. Clark 1 , Kristian Aquili na 2 , Jonathan D. Cl ayden 1 1 Develop mental Imaging and Bio physics Section, UCL G OS Insti tute of C hild Health, Lon don WC1N 1EH 2 Departm ent of Neurosurg ery, Great Ormo nd Street Hospit al for Children, L ondon WC1N 3 JH 3 MRI Phy sics Group, Rad iology, Great O rmond Street H ospital f or Child ren, London W C1N 3JH 4 Departm ent of Neurorad iology, Great O rmond Street H ospital for Child ren, London W C1N 3JH Introduction: Segmenting whi te matter (WM) tracts is clinical ly useful for intra operative surgical planning an d navigation, as w ell as for relat ing post-operativ e outcomes wi th underlying str uctural connectivi ty. Streaml ine tractography is the current standard for reconstructin g WM tracts, although it is limited by relatively len gthy data processing and l ack of expertise in clinical setting s [1]. Tractfinder [2,3] is a n alternative m ethod to tracto graphy that requires minim al processing time and ex pertise. It uses a tract-specific orien tation atlas, created using tracto graphy, and tumour defo rmation modelling to enable fast fibre tract r econstruction in tumour patients. The current wo rk extends the use of Tractfinder by applying it to the reconstructio n of infrate ntorial tracts. Methods: Intra operative dif fusion and T1-wei ghted MR image s were collected f rom an initia l set of 3 paediatric tumour patien ts. After minimal processin g, Tractfinde r was used to segment one cerebellar an d four cortical WM tracts, bilaterall y. Outputs wer e evaluated aga inst probabilistic tractograph y and Tractseg (a semi-automate d method) using bundle adj acency—a vol ume-based metr ic describing ave rage distance of disagreement be tween bundles [4]. Results: Tractfi nder successfully segmented W M tracts, including those i n regions with large displacement. Outpu ts were well-align ed with tractogra phy, with bun dle adjacency <2mm for all c omparisons, which is similar to or below typical inter-pro tocol variability [4]. Tractseg outputs had the same or higher bundle ad jacency values as compared with Tractograph y, particularly in regions wit h large displacem ent. Figure 1 shows better per formance of Tr actfinder on reconstructing a cerebellar p athway. Conclusion : Tr actfinder works e ffectively with i ntraoperative diff usion data from paediatric tumou r patients, providing a quick and accessible alternative to tractography. Implications o f fast segmen tation of cere bellar tracts include the p rediction of m utism in pediatric tumour patients [5]. References: [1 ] Toescu et al ., 2021; 10.1080/0 2688697.2020.1 849542; [2] Yo ung et al ., 202 2; 10.1007/s1154 8-022- 02617-z; [3] Yo ung et al ., 2024 ; 10.1002/hbm.2 6578; [4] Schilling et al ., 2021 ; 10.1016/j.neuroimage.2021.11 8502; [5] Avula et al. , 2015; 10.1093/ neuonc/nou299 . Funding: Th is work was fun ded by Children with Cancer U K (grant numbe r 23-353). All re search a t Great Ormond Street Hospital NHS Foundatio n Trust a nd UCL Great O rmond Street Institute of Child Health is made possi ble by t he NIHR Great Ormond Street H ospital Biomed ical Res earch Centre. Th e views expresse d are those of the author(s) and no t necessa rily those o f the NHS , the NIHR or t he Department of Healt h. Figure 1. T1-weight ed iMRI of paediatric tumour pa tient with automated Superior Cerebellar Peduncle s egmentatio ns Segmenta tions crea ted using Tractfind er (red) & Tractseg (blu e). Figure indicates incorrect trajectory of Tractseg segmenta tion, inco rporating erroneously i dentified fibres alon g the dorsa l tegmentu m (red arrow). 59 Integrating normative and patient models of tr actography for accurate prognosis in human glioblastoma Joan Falc ó-Roget 1,* , G ianpaolo Antonio Basile 2,† , Anna Janus 1,3,† , Sara Lillo 4,5 , Le tterio Salvatore P oliti 6,7 , Jan K. Argasinski 1,8 , Alberto Cacciola 6,7,* 1 Computational Neuroscience Group, Sano Centre for Computational Medicine, Kraków, Poland. 2 Brain Mapping Lab, Department of Biomedical, Dental Sciences and Morphological and Functional Imaging, U niversi ty of Messina, Messina, It aly. 3 Departmen t of Neurophysiolog y and Chronobiology, Institute of Zoology and Biomedical Research, Faculty of Biology, Jagiellonian University, Krakow, Poland. 4 Radiation Oncology Unit, Clinical D epartment, National Center for Oncological Hadrontherapy (CNAO), 27100, P avia, Italy. 5 Department of Internal Me dicine and Medical Therapy, University of Pavia, 27100 P avia, Italy. 6 Department of Biomedical Sciences, Humanitas University, Via Rita Levi Montalcini 4, Pieve Emanuele , 200 72 Milan , Italy. 7 IRCCS Humanit as Research Hospital, Via Alessandr o Manzoni 56, Rozzano, 20089 Milan, Italy. 8 Faculty of Physics, Astronomy and Applied Computer Scie nce, Jagiellonian University, Krakow, Poland. † Equal contribution: Gianpaolo Antonio Basil e, Anna Janus Introduction : Since the advent of tractography, there has been great interest in its potential to improve brain tumor management [ 1-3]. Among the most aggress ive and f atal are human glioblastoma s (GBMs), with median survival rarely exceeding 1.5 years. R ecent evidence reveals gliomas as active agents that establish synapses, promoting tumor growth [ 4]. Th i s underscores the urgent need to map white matter-glioma interactions to predict tumor spreading and p rognosi s . Methods : To mitigate the confounding effects of tumor-induced brain distortions [5,6], we leveraged normative tractography models derived from large healthy cohorts [7]. GBMs were embedded into these normative connectomes to identify the white matter scaffold structura l ly connected with each tumor [ 8]. We introduced a Lesion-Tract Density Index (L-TDI), based on average tract density, to quantify tumor-wh ite matter i nvolvement. This index w as used to stratify and predic t outcomes in two independent patient cohorts (N=367 and N=4 96), based on the distribut i on of L-TDI value s. Results : In both cohorts, overall survival rates (p<0.01, log -rank test) and ti mes (p<0.01, Mann- Whitney U- test) significantly differed between hig h and low L-TDI groups across multi ple st ratificati on thresholds. Cox pro portional haz ard models confirm ed the prognostic value of L-TDI when co mb ined with clinical covariates, including age, methylation, extent of surgery, and cognitive performance. A logistic model based on the L-TDI predict ed 12-month mortality with balanced accuracies of 0.68 and 0.65, and areas under th e curve of 0.74 and 0.73 when training and testing in the two independent cohorts. Conclusions : Normativ e tractography-derive d bi omarkers offer fa st , r obust, reproduc ible, an d clinically meaningful i nsights that can enhance existing clinical workflows. While L-TDI offers a cost- effective and scalable stra tegy for predicting patients’ prognosis and, potentially, for surgical and therapeutic plann ing, direct validation against patient-specific HARDI data remains es sential to establish its precision, de sp ite the highe r acquisiti on costs . [1] Zhang, H., et al. Neurosurgery (2013). [ 2] Abhinav, K., et al. Neuro-Onco logy (2015). [3] Almairac, F., et al. Journal of Neurosurgery (2024). [4] Venkataramani , V., et al. Neuro-Oncology (2020). [5] Yeh, FC., et al. NeuroImage (2021). [6] Falcó-Roget, J., Cacciola, A ., et al. Communications Biology (2024). [7] Salvalaggio, A., et al . JAMA Neurology (2023). [8] Falcó-Roget, J., Basile, G. A., Janus, A., ..., and Cacciola, A. medRxiv (2025). 60 Improving tractography reconstruction with asymmetric FOD tractography: preliminary evidence on the cortico-spinal tract Richard Stones and Flavio Dell’Acqua, King’s College London Introduction: T ractography has become a crucial tool in neuroscience and neurosurgery for visualising the 3D structure of white matter pathways. The majority of spherical deconvolution (SD) approaches generate symmetric fibre orientation distributions (sFODs) to resolve crossing fibre configurations [1,2]. However , SD frameworks can be extended to reconstruct asymmetric FODs (aFODs) which can also represent more complex bending, branching and fanning fibre configurations [3,4,5]. Here we demonstrate the ef fect of aFODs on the anatomical representation of the cortico-spinal tract (CST) using whole brain deterministic tractography . The CST is particularly relevant because it is often challenging to reconstruct using standard deterministic algorithms which typically fail to capture the full extent of the bending and fanning of axon fibres into the lateral regions of the pre-central gyrus. Methods: We compare tractography generated from two types of FOD shown in Figure 1: symmetric FODs generated using damped Richardson-Lucy SD [2], and asymmetric FODs generated using damped Richardson-Lucy SD including a graph-based regularisation term introduced in [5]. The same tractography algorithm is applied in both cases. We use a deterministic version of the tracking algorithm described in [3], where instead of probabilistically selecting the next stepping direction, we select the direction of maximum FOD amplitude within the current cone of propagation. We generated whole brain tractograms of each type for 10 HCP subjects [6] downsampled to 2.5mm resolution. Downsampling was performed to enable direct comparison with high resolution data, which will be used as reference in future analyses. The right CST was then dissected using MegaT rack [7]. A probability map was calculated for each FOD type showing the probability of finding the CST at each voxel across the 10 subject sample. Results: Figure 2 shows the 3D probability maps for sFOD (blue) and aFOD (orange) tractography dissections of the CST . With aFOD tractography the lateral projections are more uniformly distributed across the pre-central gyrus and have higher probability compared to the sFOD version. In Figure 3 we show a comparison of CST dissections for two individual subjects. The individual dissections further demonstrate the more complete reconstruction of the CST when using aFODs, with missing anatomical features in the sFOD dissections. Overall, we find that the reconstructed CST dissections increase in volume by an average of 13.8% across the 10 subjects when using aFODs. Conclusion: These results indicate that tractography using asymmetric FODs may enable more accurate anatomical representations of white matter pathways. While more testing is required, we think this is likely due to the ability of aFODs to represent more complex bending and fanning fibre configurations than sFODs, as well as to the smoothing present in the aFOD field introduced by the SD regularization term. Further work is ongoing to investigate the advantages of aFOD tractography on other white matter pathways, as well as fine tuning modelling and tracking parameters. References : [1] T ournier et al. NeuroImage (2007). [2] Dell'Acqua et al. NeuroImage (2010). [3] Bastiani et al. NeuroImage (2017). [4] Poirier and Descoteaux. NeuroImage (2024). [5] Stones and Dell’Acqua . ISMRM DSG (2025). [6] V an Essen et al. NeuroImage (2013). [7] Dell’Acqua et al . Bioarxiv 656534v1 (2025). 61 T ractography on Implicit Neural Representations of Dif fusion MRI Sanna Persson 1 , Fabian Leander Sinzinger 1 , Rodrigo Moreno 1 1 Department of Biomedical Engineering and Health Systems, KTH Royal Institute of T echnology , Huddinge, Sweden I . I N T R O D U C T I O N From a practical perspecti ve, the acquisition of diffusion-weighted images is often constrained by scan time, resulting in a sparsely and non-uniformly sampled Q -space. T o address the limitations of sparsely and non-uniformly sampled Q -space, which hinder accurate modelling and affect downstream tractography , we propose repre- senting the raw DWI signal using implicit neur al r epresentations (INRs). Since INR-based D WI reconstructions only approximate the measured signal, it is important to assess their ef fect on practical use cases. In this work, we focus on streamline tractography derived from the reconstructed data. I I . M E T H O D S A. Input encoding In pre vious work on INRs, appropriate input encodings have been shown to improve learning (e.g., [1]). Following con vention, we encode the spatial and b-v alue coordinates ( x, y , z , b ) via Gaussian random features. For the Q -space coordinates p = ( ω , ε ) → S 2 , we propose to encode them with real spherical harmonic basis functions up to degree ϑ max at the respective position p . W e use even degrees only ( ϑ = 0 , 2 , . . . ), enforcing antipodal symmetry . Fig. 1. a) The DWI signal is transformed into the spherical harmonics domain. b) Indi- vidual shells in spherical harmonics form are affine-transformed and nonlinearly warped to MNI152 space with deformations obtained from ANTS [2]. c) Spherical harmonics coefficients are averaged across 50 subjects. d) A DWI template is reconstructed by sampling the spherical harmonics representation. B. Implicit Neural Repr esentations W e implement three dif ferent INR architectures and e valuate their performance on learning the representation of the full dif fusion table. The base model consists of a three-layer perceptron with leaky ReLU activ ations. W e further implement the SIREN [3] and WIRE [4] architectures for improv ed high-frequency representations. C. Dataset W e evaluate tractography generation from our INR-generated D WI surrogates on a multishell D WI template. The template was con- structed from 50 HCP subjects by first applying a nonlinear trans- formation from subject space to MNI152, follo wed by av eraging the separate shells in spherical harmonics coef ficient form (cf. Figure 1). Fig. 2. Coronal slice showing derived streamlines from: (a) ground truth, (b) R E L U , (c) S I R E N , and (d) W I R E INR architectures. I I I . R E S U LTS T o inv estigate the v alidity of the proposed INR methods, we com- pare tractograms deriv ed from the INR DWI with the tractogram obtained directly from the group template using SD STREAM from MRtrix3[5]. Preliminary results are reported quantitativ ely in T able I and qualitativ ely in Figure 2. The W I R E architecture generates the closest tractogram to the original one. T ABLE I A V E R A G E G L O BA L S T R E A M L I N E M E T R I C S P E R I N R M O D E L Model ω (mm) s (mm) ε ϑ (rad) w z c e Original 52.1 36.8 1.52 0.0161 → 0.0043 29.8 1.20 R E L U 51.1 40.0 1.30 0.0153 → 0.0040 34.0 1.14 S I R E N 48.4 38.3 1.29 0.0133 → 0.0025 32.9 1.13 W I R E 51.1 37.9 1.42 0.0136 → 0.0014 31.6 1.17 Symbol legend ω : streamline length, s : span (endpoint distance), ε : tortuosity , ϑ : mean curv ature, w z : winding (z-axis), c : compactness ( s 2 / ω ), e : elongation ( ω / bbox diameter). I V . C O N C L U S I O N W e explored the use of INRs for super resolution in the spatial and Q -space domains. Preliminary results show promise for Q -space interpolation from sparse data and for downstream applications such as tractography . One limitation of our current ev aluation is that we deriv e tractograms by applying streamline tractography to a discretely sampled D WI representation. For future work, we aim to le verage the continuous pointwise signal representation offered by the learned INRs directly within the tractography process. A C K N OW L E D G M E N T S W e thank the National Academic Infrastructure for Supercomputing in Sweden (NAISS) for the use of Alvis. The project is partially funded by the Swedish Research Council through grant 2022-03389, Digital Futures and MedT echLabs. R E F E R E N C E S [1] M. T ancik et al. , “Fourier Features Let Networks Learn High Frequency Functions in Low Dimensional Domains, ” Jun. 2020, [2] M. F . Glasser et al. , “The minimal preprocessing pipelines for the Human Connec- tome Project, ” Neur oImage , vol. 80, pp. 105–124, Oct. 2013. [3] V . Sitzmann et al. , “Implicit neural representations with periodic activ ation func- tions, ” in Pr oceedings of the 34th International Confer ence on Neural Information Pr ocessing Systems , ser. NIPS ’20. Red Hook, NY , USA: Curran Associates Inc., Dec. 2020, pp. 7462–7473. [4] V . Saragadam et al. , “WIRE: W avelet Implicit Neural Representations, ” in 2023 IEEE/CVF Conference on Computer V ision and P attern Recognition (CVPR) , Jun. 2023, pp. 18 507–18 516, iSSN: 2575-7075. [5] J.-D. T ournier et al. , “MRtrix3: A fast, flexible and open software framework for medical image processing and visualisation, ” Neur oImage , vol. 202, p. 116137, Nov . 2019. 62 63 Title: Predicting Facial Nerve Condition and Functional Outcome in Cerebellopontine Angle Tumours Using MRI-Ba sed Models Authors: Alberto Arrigoni 1 , Andrea Ma ngili 1 , Serena Capelli 1 , Giulio Pezzetti 2 , Barbara Fri geni 2 , Rachele Bivon a 2 , Giovan ni Danesi 2 , Anna Caroli 1 , Simonett a Gerevini 2 Affiliations: 1 Istitu to di Ricerche Farmacologiche Mario Ne gri IRCCS, Italy ; 2 ASST Papa G iovanni XXIII, I taly Introduction . Cerebellopontine angle (CPA) tumors are typically benign but can exert a mas s effect on adjacent structures, including the facial nerve (FN). Surgical resection is often indi cated. However, the surgery carries a risk of iatrogenic ner ve injury, potentially resulting in transient or permanent facial palsy [1]. This study investigates anatomical and diffusion -weighted MRI (DW-MRI) 's role in pre-surgical planning, first focusing on accurate reconstruction of the FN. Morphological biomarkers and microstructural features from DW-MRI are extracted using radiomic analysis and diffusion tensor imaging (DTI). These imaging-derived biomarkers are integrated with clinical variables to train machine learning mode ls to predict the facial nerve’s condition before surgery, the postoperative functional outcomes, and long-term follow-up status. Methods. Forty-seven patients with CPA who underwent surgery and pre-operative MRI examination were included in the study. The MRI acquisition protocol included a DW-MRI AP single-s hell scan (b-values: 0 and 1500; 50 directions; voxel s i ze: 2x2x2 mm;), a b0 PA, a post-contrast volumetric T1-w scan and a volumetric T2-w scan. An in -house MRI processing pipeline was developed in Python (v3.7.10) using the following tools: MRtrix3Tissue (v5.2.9) and FSL (v6.0.5). The pip eline included correction of noise, artifacts, and distortions in the input scans; lesion segmentation on the T1 -weighted image; SS3T-CSD and probabilistic tractography via the iFOD2 algorithm by manually placing reconstruct ion seeds in anatomical references. Results. The pipeline successfully reconstructed the facial nerve in all patients, demonstrat in g the role of DW -MRI and tractography for CPA resection pre-surgical planning. The facial nerve exhibited significant microstructural alterations on the tumor-affected side, including increased fractional anisotropy (FA) and decrea s ed mean diffusivity (MD) compared to the contralateral healthy side. Conventional prognostic indicators — including the blink reflex and Koos grading — showed positive correlations with diffusion metrics and lesion volume. Compound Muscle Action Potential (CMAP) correlated inversely with diffusion values and FN tract length. Postoperative and 1 -year House-Brackmann (HB) grades of facial nerve function were significantly associated with lesion volume, FN length, and CMAP values. Machine learning models trained on all extracted features to predict nerve adherence to the tumor (FN integrity) and HB outcomes achieved accuracies exceedin g 0.90, highlighting the potential of integrated radiomic-clinical approaches for prognostication. Conclusion. This study supports the utility of diffusion tractography in CPA resection pre-surgical planning and underscores the prognostic value of both morphological and diffusion-based MRI biomarkers. When combined with clinical and neurophysiological data, these features can improve the pred iction of facial nerve integrity, immediate postoperative functio n , and long-term outcomes following CPA tumor resection. References . 1) Bennett, M. & Haynes, D. S. Surgical approaches and complications in the removal of vestibular schwann omas. Otolaryngol. Clin. North Am. 40, 589 – 609, ix – x (2007). https://doi.org/10.1016/j.otc.2007.03.007 64 Assessment of Differ ent T ractography Methods for Superficial White Matter Reconstruction Xi Zhu 1 , Xiaofan W ang 1 , Y uqian Chen 2 , Lauren J O’Do nnell 2 , Fan Zhang 1 1 University of Electronic Science and T echnology of China, Chengdu, China 2 Brigham and W omen’ s Hospital, Harvard Medical School, Boston, USA Introduction The superficial white matter (SWM) contains short association fibers connecting nearby cortical regions [1]. These fibers are essential in neurodevelopment, aging, and various neuropsychiatric disorders [2] . In this study , we evaluate the performance of different tractography methods in the task of SWM fiber reconstruction. W e adopt a filtering strategy proposed by A ydogan et.al. [3] to extract SWM fibers from whole brain tractography . W e compare four distinct tractography methods: iFOD2 [4] , surface-seeding-based iFOD2, PTT algorithm [5] and UKF [6] . Method W e used MRI data from 10 HCP-Y A [7] subjects for evaluation. Specifically , we create a grey–white matter interface as a seeding mask. For surface-based iFOD2, seed points were taken from the white matter surface (WSM) mesh. Finally , masks from the white–grey matter were used to constrain tractography . W e employed three quantitative metrics to assess performance of different tractography methods: 1) Streamline Length; 2) Coverage: Percentage of WSM vertices considered “closest” to at lea st one end of one streamline; 3) Coverage bias [3]: Proportion of “covered” WSM vertices residing in gyri, corrected by proportion of all WSM vertices residing in gyri. T able 1. T ractogram differences between different methods iFOD2 Surface-based iFOD2 UKF PTT Mean Length (mm) 23.35 23.20 25.47 22.99 Coverage (%) 81.89 83.25 68.09 85.87 Coverage bias 1.01 1 1.022 0.960 1.016 Fig.1. Results of different methods Results The UKF tends to produce longer streamlines, while the PTT algorithm shows higher coverage at the same streamline count. Higher coverage bias indicates more streamlines terminating in gyral regions, consistent with U-fiber characteristics. Figure 1a shows how coverage increases with streamline count, and Figure 1b maps fiber density on the white matter surface. Conclusion It is evident that the performance of dif ferent tractography methods in SWM reconstruction varies substantially . References 1. Oishi K, Huang H, Y oshioka T , Y ing SH, Zee DS, Zilles K, et al. Superficially located white matter structures commonly seen in the human and the macaque brain with dif fusion tensor imaging. Brain Connect. 2011;1:37–47. 2. Nazeri A, Chakravarty MM, Raj ji TK, Felsky D, Rotenberg DJ, Mason M, e t al. Superficial white matter as a novel substrate of age-related cognitive decline. Neurobiol Aging. 2015;36:2094–106. 3. Shastin D, Genc S, Parker GD, Kolle r K, T ax CMW , Evans J, et al. Surface-based tracking for short association fibre tractography . Neuroimage. 2022;260:1 19423. 4. T ournier J, Calamante F , Connelly A. Improved probabilistic streamlines tractography by 2 nd order integration over fibre orientation distributions. 2009;1670. 5. A ydogan DB, Shi Y . Parallel transport tractography . IEEE Trans Med Imaging. 2021;40:635–47. 6. Malcolm JG, Shenton ME, Rath i Y . Filtered multitensor tractography . IEEE Trans Med Imaging. 2010;29:1664–75. 7. V an Essen DC, Smith SM, Barch DM, Behrens TEJ, Y acoub E, Ugurbil K, et al. The WU-Minn Human Connectome Project: an overview . Neuroimage. 2013;80:62–79. 65 Structural connectivity-based individual parcellations using v arious tractography algorithms C. Langlet 1 , D. Rivière 1 , B. Herlin 1 , I. Uszynski 1 , C. Poupon 1 , J.-F . Mangin 1 1 Université Paris-Saclay , CEA, CNRS, Neurospin, Baobab, Saclay , France Introduction Mapping the human brain has been a long-standing goal of the neuroscience community as cerebral maps provide a spatial referential to conjointly study brain structure and function. One crucial application is the study of the connectome that needs parcellations to define structural pathways and functional interactions between regions of the brain. Such parcellations usually stem from atlases projected onto individuals via a cortical folding-based alignment, however this method fails to represent the anatomical peculiarities of individuals (Mangin, 2019). In this work, we generated individual parcellations using a data-driven algorithm based on the structural connectivity obtained from two tractography algorithms: FSL and MRtrix. Methods We first computed FSL and MRtrix tractography data from the Human Connectome Project dataset to create complete connectivity matrices for all individuals. Using a group of 200 individuals and the Constellation software (Lefranc, 2016), we then generated average subdivisions of the Desikan atlas based on connectivity profiles at different resolution levels. These group subdivisions were then projected onto each individual of the dataset using their individual connectivity profiles. T o create our final parcellations, we selected an adequate number of subdivisions based on cortical thickness and diffusion-based cortical microstructure f eatures processed with Freesurfer (Glasser , 2013) and Ginkgo (Herlin, 2024) softwares. Results We obtained group and individual parcellations for FSL and MRt rix tractography algorithms. At the whole brain level, our criterion - based on structural data - interestingly selected almost the same number of regions (399 for FSL and 400 for MRtrix). Additionally , for both FSL and MRtrix parcellations, individual parcels present a higher structural connectivity homogeneity than group parcels projected via a Freesurfer alignment. Figure: Group parcellations based on FSL (top) and MRtrix (bottom) tractographies Conclusions This work paves the way towards the study of the human connectome by proposing coherent parcellations between individuals based on tractography data. Comparison of parcellations obtained with different tractography algorithms may deepen our understanding of the information encoded by each software and help us describe the human connectome more accurately . References Glasser M. (2013). The minimal preprocessing pipelines for the Human Connecto me Project. Neuroimage, 80. Herlin, B. (2024). Sex ‑ related variability of white matter tracts in the whole HCP cohort. Brain Structu re and Function, 229. Lefranc, S. and Roca, P . (2016). Groupwise connectivity-based parcellation of the whole human cortical su rface using watershed-driven dimension reduction. Medical Image Analysis, 30. Mangin, J.-F . (2019). “Plis de passage” Deserve a role in models of the cortical folding process. Brain T opography , 32. 66 Using L arge Lang uage Models to I nform T ractogr ap hy !"#$%&'()* +,-%&).$%/ 0'%-1).,2-# ,2-)341)!--2)5 6$&%74&1)!$/47)!87" +22+1)92- ,4+):;)!+4<2-74&;))32=> 4')?-'#,#"#41)@-,A4 &',#B):%++4C4)D% -7%-1)@ E) Intro duction !"#$"%&'$()*+ ,*%$'%-.* %*/#0-*'1*%2'+ %"$3-*%$4%(.#-*% 52--*"%62-.(270 %.20%8* *'%0311*0043))7%30*+ %-$%1$'0-"2#'%-"21-$,"26.7%4$"%83'+)* % "*1$'0-"31-#$ '9%)*2+ #',%-$%#56 "$:*+%2113"217 1 ;%<$(*:*" 9 %#-%#0%1.2 ))*',#',%-$ %012)*%-.#0%2 66"$21.%-$%1 $''*1-$ 5#10;%=2",*%)2' ,32,*%5$+ *)0%>==? 0@%6"$:#+*%2% "$3-*%-$%07'-.*0#0*%) 2",*%25$3'-0%$ 4%-*/-32)%#'4$"52-# $'%#'-$%A32 '-#-2-#:*%$3-63-09%2' +%+*5$ '0-"2-*%6"$5#0#',%"*03)-0%#'%' *3"$01#*'1*%-2 0&0%+3*%-$%-. *#"% */-*'0#:*%-"2#'#',%$' %-.*%01#*' -#B1%)#-*"2-3"* 2 ;%<*"*9%(*%+*:*)$6%2'+ %*:2)32-*%2%6#6 *)#'*%3 0#',%==? 0%-$%6"$:#+*%A 32'-#-2-#:*%6"# $"0%4$"%1$''*1 -$5#10%2' +% +*5$'0- "2- *%.$(%-.#0 %266"$21.%12 '%8*%30*+ %-$%0366)*5 *'-%5 #1"$0-"31-3"*C820*+% -"21-$,"26.7%B)-*"#',%266 "$21.*09%87%"*-2#'#',%1 $''*1-#$ '0%(.$0*% 6"*0*'1*%#0%036 6$"-*+%87%-. *%'*3"$2' 2-$57%)#-*"2-3"* ;% Method s %D .*%#'63-%-$% $3"%6#6*) #'*%#0%2%) #0-%$4%8"2#'%"*,#$'0%4 "$5%2%62"1*))2-#$' ;%E$"%*21.%"*,#$ '%62#" 9%(*%A3* "7%-. *%*/#0-*'1*%$4 %2%(.#-*%5 2--*"%83'+) *% 1$''*1 -#',%-.* 5;%D.*%$3- 63-0%2"*%02:*+%-$%F0$ '%B)*09%4"$5%(. #1.%-.*% 1$''*1 -$5*%6"#$ "0%12'%8*%"*-"# *:*+%>E#,;%G@; %H*%1$'0#+*"*+%-($% 62"1*))2-#$'09%I*0#&2' C J#))#2'7%2'+%- .*%<35 2'%K$'' *1-$5*% !"$F*1-L 0%53)-#C 5$+2)%62 "1*))2-#$'%>E#,;%G@;%E$"% P6*'QR% 5$+*)0 %>,6-CS$ %2'+%,6 -SC-3"8$ @9%(*%"*-"#*:*+% 2%5$+*) %1$'B+* '1*%01$"*%4"$5% -.*%)$,C6 "$80%:2"#28)* %200#,'*+%-$% -.*%T$$) *2'%$3-63-;% Retrieval-Au gmente d Gene ration (RAG) %(20%30*+%-$ %#'-*,"2-*%*/-*"'2)%&'$()* +,*%0$3"1*0%#'-$ %-.*%6"$56 -;%R'#-#2)%*/6*" #5*'-0%0. $(*+%-.2-%-.* %==?%(20 % )21&#', %&'$()*+,* %28$3-%"*,#$'0 %#'%-.*%< K!C??! 9%0$%(*%30*+ %-.*%0366 )*5*'-2 "7%#' 4$"52-#$'%"*)2-#' ,%-$%-.*%62 "1*))2-#$'%20%2 %&'$()*+,*% 0$3"1* 3 ;%D.*%UN C 62,*%+$135 *'-%(20% 06)#-%#'-$% 0*52'-#1 %1.3'&0;%H*%30*+%T? VM%&*7($"+%0*2 "1.%-$%B'+%-. "**%"*)*:2'-%-*/-%1 .3'&0%"*)2-#',% -$%*21.% "*,#$'9%(.#1 .%(*"*% 03552"# 0*+%87%-.*%= =?%2'+% #'1)3+*+% #'%-.*%6 "$56-;% Combin ing LLM -d erived pri ors with M icrostructure I nformed Filtering: D" 21 -$,"26.7%B)-*"#',%2 #50%-$%"*5$:*%42)0*%6 $0#-#:*%0-"*25)#'* 09%83-%-.#0%12'% "*03)-% #'%-.*%)$00%$4 %-"3*%6$0#- #:*0; 5 %H*%6"$6$0*%-.2-%==? C+* "#:*+%6"#$ "0%12'%.*)6 %-$%0*)*1-%' *3"$2'2-$5#12))7%6 )230#8 )*%1$''* 1-#$'0% -$%"*-2#'%+3"#' ,%B)-*"#', ;%H*% 6*"4$"5*+ %2'2-$5#12))7% 1$'0-"2#'*+%-"21-$,"26.7%(#-.%? W-"#/X 6 %$'%M%1$'B +*'1*Y N;M9%5#' #52)%6"$5 6-9%,6-S C-3"8$@;% H*%*:2)32-*%-.#0%2 66"$21.% 87%1$562" #',%-.*%2 113"217%$4%2%'*- ($"&%+#O30 #$'%5$+ *)%>ZI? @ 8 %4$"%5$+*))#' ,%Q)[.* #5*" L 0%62-.$)$, 7%06"*2 +%21"$00%-."**%8#'2" 7%1$ ''*1-$5 *0\%3'B)-*"*+9% KP??RD VCB)-*"*+9%2' +%==?]K P??RDV CB)-*"*+;%D.*% -2",*-%+2-2%4$"%-.*%5 $+*)%#0 %2'%2:*"2,*%-23C!^D%_` aW%526 %4"$5%GMM% 257)$#+C %2'+%-23C 6$0#-#:*% 62"-#1#62' -0%4"$5%-.* %QIZR%0-3 +7 9%20%+*01" #8*+%#' 9 ;%P3"%.76 $-.*0#0%# 0%-.2-%2%5 $"*%2113"2-*%1$''*1-$ 5*%(#))%6"$:#+*% 2%8*--*"%5 $+*)%B- %-$%-.*%-23 C!^D%+2-2;%H*% 6*"4$"5%2% '3))%1$562 "#0$'%4$"%*2 1.%1$'' *1-$5*% 87%"*6*2-#',%-.* %6"$1*00%GNNN%- #5*0%(#-. %-.*%025* %'358* "%$4%"2'+$5)7%1 .$0*'%1$' '*1-#$' 0%"*-2#'*+%2 4-*"% KP??RD V%B)-*"#', ;% Res ults Benchm arking perform ance: P6 *'QRL 0%, 6-SC-3" 8$%5$+* )%6*"4$"5* +%8*0-%21"$00%2))%6"$56 -%-76*0;%D.* %5$0-%2113"2-*%(20%-. *%3'1*"-2 #'-7%:2"#2' -%$4%-.* %KPD% 6"$56-%>bG c@9%2)-.$3 ,.%0#5# )2"%6*"4$"5 2'1*%( 20%2--2#'*+ %(#-.%-.* %5#'#5 2)%6"$56-;% Q'%2++ #-#$'2)%0-28 #)#-7%2'2 )70#0%(#-. %-*'%"*6*2-0%$4% -.*%5#' #52)%6"$56 -% (#-.%,6- SC-3"8$% 0.$(*+%1$' 0#0-*'-%"*06$'0*0 %4$"%US%$3-%$4 %GNN%"*,#$'%62 #"09%(#-.%2'%21 13"217%$4%N;Ub ± N;NX%>"2',*\%N;U VCN;bV@; %D.*%==? 0%.2+%)$(*" %1$'B+* '1*% 01$"*0%4$"%2'0(*"0%-.2-%1 $'-"2+#1-*+%-.*% -"21-$,"26.7%2-)20%>#'+*6 *'+*'- %-C-*0-9%5#'#5 2)%6"$56-\% -db;X9%6 dG;X/GN - 18 9%KPD%6"$56-\%-dM ;G9%6dS;b /GN - 17 @;%% RAG: %E$"%-.*%5 *2' ± 0-+% 21"$00%4$3"%"*6*2-0@;%E$"%-.*%5 #'#52) %6"$56-9%21 13"217%0)#,.-)7%+* 1"*20*+%(#-.% -.*%2++#- #$'2)%1$ '-*/-%>4"$5% N;eX ± N ;NS%-$%N;e N ± N;NV @9%+3*%-$% 2'%#'1"*20*% #'%42)0*%6$0#-#:*0;% LLM-Au gmented filtering: "*-2#'#',%1$ ''*1-#$ '0%0*)*1-* +%87%-.*%= =?%+3"#' ,%B)-*"#', %#56"$:*+%-.*%B- %$4%-.*%62-. $)$, 7%5$+*)% 4$"%S%$4%-.* %M%038F*1 -09% 1$562"*+%-$% B)-*"#',%( #-.%KP?? RDV%2)$' *%>5*2 ' ± 0-+%#56 "$:*5*'-%#'%" 2 %d%VN% ± V Sc@;%D. #0%#56"$:*5*'- %(20%0#,' #B12'-%1 $562"*+%-$%2% '3))C+#0- "#83-#$'%( .*"*% -.*%025*% '358*" %$4%"2'+$5)7%1 .$0*'%1$' '*1-#$' 0%(*"*%"*-2#'*+%24 -*"%B)-*"#' ,%>6fN;N G@9%#'+#12-# ',%-.2-%-.* %==?C +*"#:*+ %6"#$"0%6"*0*" :*%:2)#+%1$ ''*1-#$ '0% -.2-%($3)+%$- .*"( #0*%8*%"*5$:*+;% Disc ussion & Conclusi ons ==?0%12'%6"$:#+*%2 113"2-*%#'4$"52-#$'%28$3 -%0-"31-3"2)%1$'' *1-#:#-7% 8*-(**'%,"*7%5 2--*"%"*,#$'09%6"$:#+#' ,% 1$56)* 5*'-2" 7%#'4$"5 2-#$'%-$%-"21-$,"26.7 ;%Q%1$58 #'2-#$'%$ 4%2%5#'#5 2)%6"$56- %(#-.%-.* %,6-CSC-3 "8$%5$+ *)%6"$:#+*0%2%,$ $+%82)2' 1*%8*-(* *'%2113"217%2'+ % -$&*'%*O#1#*' 17 9 %(.#)*%$ -.*"%5$ "*%+*-2#)*+% 6"$56-0%12'% 8*%30*+% -$%6"$8*%-.* %5$+*)0L%#'-*"'2)%"*20$'#', ;%H*%0.$(%-.2-%-. *%5$+*)0 %(*"*%5$"*%3'1* "-2#'%#'% -.*#"%#'1 $""*1-%2'0(*"09%(.#1 .%6"$:#+*0%2%"$3-*%4$"%3' 1*"-2#'- 7%A32'-#B 12-#$'%#'%+$(' 0-"*25%-20&0;%H*%.2:*%2)0$ %+*5$'0- "2- *+%.$(%*/-*"' 2)%&'$()*+ ,*%12'% 8*%30*+%-$% #56"$:*%2113"217%#'%0#-32- #$'0%(.* "*%-.*%==? L 0 %#'-*"'2) %&'$()*+,* %#0%)21& #',9%2)-. $3,.%-.#0 %#0%+*6* '+*'-%$ '%-.*%6"$5 6-#',%0-"2-*,7 ;%P3"%B )-*"#',% 266"$21.%0. $(*+%6"$5#0#' ,%"*03)-09%(#-.%-.*%"*-*' -#$'%$4%"*)2-#:*) 7%4*(%1$''* 1-#$'0%) *2+#',%-$ %2%0#,' #B12'-%#5 6"$:*5*'-%#'%-. *%2113"217%$4%2% 62-.$)$, 7% 06"*2+#',% 5$+*)%>E#,3 "*%V@;%E3-3"*%($"&%( #))%*/-*'+%-.#0 %-$%5$"*%038F* 1-0%2'+% -*0-%(#-.%+#O *"#',%)* :*)0%$4%"*,3)2 "#02-#$'%#'%-. *%KP?? RDV%B)-*"#' ,;% References: T able 1. Evaluation accuracy across mo dels and prompts, calculated as agreement with a gold-sta ndard tractography atlas across 100 r eg ion pairs from t he Desikan-Killiany atlas. Results in bold show the best performing m odel for each prompt, and green ind icates the best performing prompt for a give n model. M ean ± std across four repeats. Figure 2. Example results from LLM-a ugmented filtering. Connectio ns retained u sing th e LLM- priors are shown i n pink on the r ight-hand plot. Model fit with th e NDM is shown below: r = Pearson ’ s correlation betwee n tau-PET an d model p rediction, SSE = sum of squared e rrors. !"# $ %&'((')*+#,"#-"# et al. #./ 0')#%1))2%3'1)4#52/'625#7/18#5'9:4'1)#;<=#3/0%31*/ 0>&?#%0)#@2#&'*&(?#0)0318'%0((?#0%%:/ 032#A#'7#B2#C)1B#B&2/ 2#B&'32#80332/#>03&B0?4#430/3+#B&2/2#3&2?#2)5+#0)5#B&2/ 2#3&2?#51)D3# *1"# Br ain Struct. Funct. # 225 +#EFGHAEIJE#KEJEJL"# E"# M:1+#N"# et al. #M0/*2#(0)*:0*2#8152(4#4:/>04 4#&:80)#2O>2/34#')#>/25'%3')*#)2:/14%'2)%2#/24 :(34"# Nat. Hum. Beha v. # 9 +#FJPAF!P#KEJEPL"# F"# -(0442/ +#;"#Q "# et al. #R#8:(3'S8150(#>0/%2((03'1)#17#&:80)#%2/2@/ 0(#%1/32O"# Nature # 536 +#!H! A !HG#KEJ!TL"# I"# U&0)*+#Q "# et al. #R)#0)0318'%0((?#%:/ 0325#V@2/#%(:432/')*#B&'32#80 332/#03(04#71/#%1)4'432)3#B&'32#80332/#3/0%3#> 0/%2((03'1)#0%/1 44#3&2#('724>0)"# NeuroImage # 179 +#IEWAIIH#KEJ!GL"# P"# $0/ B0/ +#X "# et al. #Y60(:03'1)#17#3/0%31*/ 08#V(32/')*#823&154#:4')*#&:80)S('C2#%1))2%3182#>&0)3184"# Neur oImage # 281 +#!EJFHT#KEJEFL"# T"# $8'3&+#<"#Y"+ et al "#R)0318'%0((?S%1)43/0')25#3/0%31*/ 0>&?Z#=8>/1625#5'9:4'1)#;<=#43/208(')2 4#3/0%31*/ 0>&?#3&/1:*Ĥ%3'62#:42#17#0)0318'%0(#')7 1/803'1)"# NeuroImage # 62 +#!WEIA !WFG#KEJ!EL"# H"# $ %&'06'+#$"# et al. #R#)2B#823&15#71/#0%%:/ 032#')#6'61#80>>')*#17#&:80)#@/0')#%1))2%3'1)4#:4')*#8'%/ 143/:%3:/0(#0)5#0)0318'%0(#')71/80 3'1)"# Sci. Adv . # 6 +#20@0GEIP#KEJEJL"# G"# <0[+#R "+#,:%2?24C'+#R"#\#] 2')2/ +#;"#] "#R#^23B1/C#_'9:4'1)#;152(#17#_'42042#`/1*/24 4'1)#')#_282)3'0"# Neuron # 73 +#!EJIA !E!P#KEJ!EL"# W"# X&18>41)+#Y"# et al. #_281)43/03'1)#17#0)#1>2)S41:/ %2#311(@1O#71/#)23B1/C#4>/205')*#8152(4Z#/2*'1)0(#08 ?(1'5#@:/52)#>/18132 4#30:#>/15:%3'1)#')#R(a&2'82/D 4#5'42042"# Alzheimers Dement. # 20 +#KEJEIL"# chain-of-thought pr ompt reasoning prompt minimal prompt model uncertainty standard uncertainty standa rd uncertainty standar d 0.75 ± 0.01 0.66 ± 0.02 0.85 ± 0.03 0.80 ± 0.07 0.79 ± 0.03 0.76 ± 0.06 claude3.5 -sonnet 0.50 ± 0.00 0.56 ± 0.01 0.84 ± 0.01 0.57 ± 0.01 0.83 ± 0.01 0.82 ± 0.01 llama3 -8b 0.74 ± 0.04 0.68 ± 0.02 0.80 ± 0.02 0.65 ± 0.02 0.85 ± 0.02 0.78 ± 0.00 gpt -4o 0.91 ± 0.02 0.89 ± 0.02 0.83 ± 0.02 0.8 2 ± 0.01 0.85 ± 0.04 0.89 ± 0.01 gpt -4-turbo F,C"&4 ) G;)D4H# ())! -)%A4&A,4=)%H )%"&)0, 04+,-4)H%&)C4-4&2#,-C)6 %--46#%/4)0 &, %&')H&%/)#$4)DDI;)J, C$#()K A4&A, 4=)%H)#$ 4)#$&44)7,L 4&4-#)0&%/0#,-C)2 00 &%26$4'() /,-,/2+ 1)&42'%-,-C1)2- 7)6$2,-M %HM #$%"C$#)N:K.O;).$4)2 77,#,%-2+ )0 $& 2 '4') 4-6%"& 2C, -C) #$4)D DI')#%)4<0&4'')"-64,-# B)2 &4)'$%=-), -)C&4B ; USER: "Based on your knowledge of white matter anatomy, is th ere a white matter bundle tha t connects these regions with in a hemisphere: {region1}, {region2}? Return your answer as True or False o nly. If you don't know, write 'Fals e'. Do not include any other text.Ó ASSIST ANT: True/False minimal USER : "Based on your knowledge of white matter anatomy, is t here a white matter bundle th at connects these regions with in a hemisphere: {region1}, {regio n2}? Briefly describe your rea soning (less than 100 words). If you don't know, say 'don't know'. " ASSIST ANT: {REASONING} USER: ÒGive your answer to the previous question as a boolea n (True or False). If you don 't know, write 'FalseÕ .Ó ASSIST ANT: True/False reasoning USER: ÓBriefly think about thes e two brain regions: {region1 }, {region2}. Specifically, th ink about their white matter connections to other brain regions and which fibre bundles terminate at t hese regions. Summarise your knowledge in less than 50 wor ds" ASSIST ANT: {BACKGROUND} USER: "Based on your knowledge of white matter anatomy, is t here a white matter bundle tha t connects these regions with in a hemisphere: {region1}, {regio n2}? Briefly describe your rea soning (less than 100 words). If you don't know, say 'don't know'. " ASSIST ANT: {REASONING} USER: ÒGive your answer to the previous question as a boolea n (True or False). If you don 't know, write 'FalseÕ .Ó ASSIST ANT: True/False chain-of-thought grey matter parcellation List of region names: [Thalamus, SuperiorFrontal, AccumbensArea, É] For each pair of regions in the lis t: Are {region1} and {region2} connected by a white matter bundle? (Use the following context: {context}) Save output to json {connection: True, reasoning: ÒÉÓ confidence: 0.7} Read jsons Extra context for LLM Optional RAG mo dule Prompt external knowledge source similarity score Extract rel evant passages [The connections between É, thalamus É, , É] connectome prior LLM 67 T o w ar d s W ho l e- B ra i n T r ac t og r ap h y o f t he M o us e f ro m S er ia l O pt i ca l C oh e re n c e T om og r a ph y Ch ar le s P oi ri er 1 , F ra ns Ir go li ts c h 2 , J oël Le fe b vr e 3 , M ax im e De sc ot ea ux 1 1 Un iv er si té de Sh er br ook e, QC, CA. 2 P ol yt ec hn iq ue M on tr éa l, QC , C A. 3 Un iv er si té du Qu ébe c à Mo n tr éa l, QC , C A. C on te xt . Op ti ca l c o he re nc e to mo gr ap h y ( OC T) is a n i ma gi ng moda li t y re ly in g on th e i n tr in si c c on tr as t o f a sa mp le . Wh en ap pl ied to br ai n t is su es , th e O CT co n tr as t is pr im ar i l y dr iv en b y t he m y e li n re fl ec ti vi t y [ 1] . As th e O CT si gn al is ac qu ir ed at m ul ti pl e d ep th s si m ul ta ne ou sl y , O CT is s ui t a b l e fo r se ri al bl o c kf ac e hi st ol og y [ 2] (S BH ), wh ic h co ns is ts of i ma gi ng th e s ur fa ce o f a s amp le bef or e t hi nl y sl ic in g t he to p l a y er o ut , r ev ea li n g a n ew su rf ac e i ma g e d in tu rn . Du e t o i ts hi gh re so lu ti on , o n t he or de r of mi cr on s, an d i ts 3D na tu re , se ri al OC T ( S- OC T) o ff er s p ro mi se fo r s t ud y i ng lo ng -r a n ge wh it e m at te r ( WM ) c on ne ct io ns at th e m ic ro sc op ic s ca le . Fi br e t ra ct og ra p h y ha s al re ad y bee n a pp li ed to pol ar iz at io n- se ns it iv e O CT ac qu i s i t i o n s [8 , 9] , wh er e o ri en ta ti on in fo rm at io n i s re ad il y a v a i l a b l e , bu t no t to OC T a lo ne . Ho w ev er , w or k i ng di re c t ly on th e O CT r ef le ct iv it y s ig na l h as it s a dv an ta ge s: th e i ma g in g s et up i s s im pl er , l es s e xpen si v e an d th e r a w da ta is l es s n oi sy . A d is ad v an ta ge of O CT , ho w ev er, is i ts o ri en ta t i o n de pen de nc e – wh il e in -p la ne (l at er al) WM f ib re s c om e o ut as b ri gh te r th an g re y m at te r ( GM ) , o ut -o f- pl an e (a xi al ) f ib re s ac tu al ly ap pea r d ar k er t ha n G M [1 ]. In t hi s w or k, w e pr es en t t he f ir st r es ul t s of fi br e o ri en ta ti on de ns it y ( F OD ) e st im at io n a nd ful ly -3 D p ro ba bi li st ic f ib re tr ac to gr ap h y o f t he mo us e br ai n f ro m S -O CT ac qui si ti on s. M et hod s. Da ta ac qu is it i o n an d re co ns t r uc ti on . T he fu ll y- au to ma te d S- OC T sy ste m an d th e da ta us ed in th is w ork ha v e bee n de sc ri b e d in a p re vi ous pa p e r [4 ]. Th e s ys te m h as a n a xi a l re so lu ti on o f ap pr o xi ma te ly 3 .5 µ m a nd la te ra l re so lu ti on o f a r o u n d 3 µ m, th us re su lt in g i n ne ar ly -i so tr op ic m i c ro -s ca le r es ol ut io n f or t he w ho le m ous e b ra in . A d is se ct ed m ou se b ra i n i s f ir st mo un te d o n to a m ot or iz ed s ta ge , w it h t he do rs al si de of th e br ai n fa ci ng to w ar ds th e mi cr os co p e obje ct iv e. T he n, v ol um et ri c ti le s ( co v er in g a r eg io n o f 75 0 → 75 0 → 12 00 µ m 3 ) ar e ac qu ir ed se qu en ti al ly b y tr an sl at in g th e mo to ri ze d s ta ge u n ti l th e en ti re bl oc kf ac e is im ag ed . Wh en do ne , a sl ic e of 20 0 µ m th ic kn es s is re mo v ed fr om th e sa mp le b y me an s of a vi br at om e. T he n, t he s am pl e is mo v ed up b y 20 0 µ m a nd t he ne wly re v ea le d bl oc kf ac e is im ag ed . T o ob ta in a 3D re c o n - st ru ct io n o f th e wh ol e br ai n, th e ti le s f or e a c h de pt h ar e fi rs t s t i t c he d to ge th er in to a 20 0 µ m- th ic k v ol um e, an d t he se v ol um es ar e th en st ac k ed on to p of ea c h ot he rs , a s i n [3 ] . T o re du ce m em or y re qu ir em en ts , t he 3D v ol um e i s do wn sa mp le d to 10 µ m is ot ro pi c re so lu tio n. F OD e st im a- t io n an d t ra ct og ra ph y . Hi st ol og ic al F O D ar e es ti ma te d us in g th e me th od fr om [6 ]. Fi r st , th e i ma g e gr ad i en t is es ti ma t ed usi ng de ri v a ti v e of Ga us si an fi lt er s w it h st an da r d de vi a t i o n (s td ) of 20 µ m. Th en , th e p ri nc ip a l di re c t io n of ea c h v o xe l i s es ti ma te d us in g st ru ct ur e te ns or an al ys is wi th a Ga us si an wi nd o w wi th st d o f 50 µ m. F in al ly , v o xe ls ar e gr ou ped i n to bi gg er , 6 0 → 60 → 60 µ m 3 v o xe ls in si de wh ic h a hi st og ra m o f or ie n- ta ti on s (1 00 bi ns ) is bu il t fr om th e pr i n ci pa l di re ct io ns . Th e re su lt is fin al ly pr o je cte d on to a sp he ri ca l ha rm on ic s ba si s wi th m ax i m um or de r 8. Pr ob ab il is ti c tr ac t o gr a p h y is p e r f o r m ed us in g a st ep si ze of 30 µ m an d m a xi m u m an gl e of 20 → . S ee di ng is do ne fr om ma n ua ll y- dra w n re gi on s o f in t er es t (R OI ) ta rg et in g th e c or ti co sp ina l tr ac t (C ST ) an d th e a n te ri or c om m i s su re s (A C) . Th e en ti re b ra in ma sk is us ed as th e t ra c ki ng m a s k . St re am li ne of l eng th lo w er th an 0. 5 mm ar e r ej ec te d . Th e re su lt in g t ra ct og ra ms ar e fu rt he r fi lt e r e d us in g th e se ed i n g R OI as i nc lu s io n R OI [5 ]. R es ul ts an d d is cu s si on . T he re co ns tr uc te d S -O C T v ol um e ( 10 µ m r es ol ut io n) i s s ho wn in F ig ur e 1a . Th e a xi al v ie w s ho ws t he i n- pl an e ac qu is it io n. D e s p it e t he v ar ia ti on s i n i n te ns it ie s be t w ee n t he s t it c h e d 2 00 µ m- th ic k v ol um es , w e r epor t a good a li gn me n t be t w ee n c on se cut iv e sl ic es . F i g u r e 1 b sh o ws t h e F OD f ie ld s e st im at ed i ns id e t w o R OI s. T he c ho ic e f or 6 0 3 µ m 3 v o xe l s w as d et er mi ne d em pi ri ca ll y , as ou r ex per im en ts su gg es t t ha t a sm a l l er wi nd o w r es ul ts in s pu ri ous fi br e o ri en ta ti on s w hi le a b ig ge r w in do w r es ul ts i n a n i nc re as e i n pa rt ia l v o l u m e ef fe ct s. A s s ee n f or the bl ue R OI , t he e st im a t ed F OD f ol lo w t he t ra je ct or ie s o f t he un de rl yi n g WM fa sc ic le s. Th e s ag it ta l v ie w fo r th e s am e r eg io n s ho ws co he re n t v er ti ca l F OD i n r eg io ns o f th e C ST ap pea ri n g da rk (o ut -o f- pl a n e fi br es ). T he c ha ng es in in te ns it ie s bet w ee n c on se cu ti v e s li ce s i n tr odu c e a bi as to w ar ds i n- pl an e o ri en ta ti on s, r es ul ti ng i n a lo t o f F OD bei n g a li gn ed w it h t he ax ia l p la ne . T o m it ig at e t hi s p ro bl em , w e n ee d t o im pr o v e o ur 3 D S -O CT re co ns tr uc ti on b y im pl em en ti ng mo re ad v an ce d m et hods fo r c om pen sa ti ng th e si gn al at te n ua ti on an d f or bl en di ng co ns ec ut iv e s li ce s, su c h a s su gg es te d i n [ 3] . As se en i n t he b lu e R OI , t he F OD e st ima te d al on g th e c or pu s c al lo su m ( CC ) a re o ri en te d a lo ng th e a n ter io r- pos te ri or a x i s ra th er t ha n t he ex pec te d v en tr al -d or sa l a xi s. W hi le th is co u ld be a c on se qu en ce o f t he i n- pl an e o ri en ta ti on bi as , i t co ul d be t ha t t he w ea k s ig na l i n t hi s r eg io n d oes n ot al lo w fo r c or re ct ly de l i n ea ti ng th e W M f as ci cl es . T hi s i s n ot a pr o b le m f or t he IC f ib re s, a s t he c on tr as t w it h t he su rr ou nd in g G M r esu lt s h a v e w el l d ef in ed bo rd er s. 0 1 (a.) (c.) (d.) (b.) Axial Coronal Sagittal Fi gu re 1: (a .) R e c on st ru ct e d 3D vo lum e at 10 µ m is ot r op ic r eso lu ti on (s c al e b a r i s 40 0 µ m) . ( b. ) Es ti ma te d F OD ( 60 µ m) ov er lay e d o n t he 1 0 µ m vo lu me . ( c.- d. ) St r e am lin es fo r t he A C a nd C ST, r es p e ct iv el y. Fi gu re 1b an d Fi gu re 1c sh o w t ra ct o g ra ph y re su lt s fo r t he A C an d CST , re spe ct iv el y . Bo th re co ns tr u ct io ns ar e w el l a li gn ed w it h t he u nd er ly ing an at om y . M or eo v er , th e CS T fi br es ar e su cc es sf ul ly tr ac k ed ou t- of- pl an e. Ho w ev er , n o s tr ea ml in e a ct ua ll y re ac he s t he m ot or c or te x . Look in g a t th e F OD , w e se e t ha t no se co nd ar y d ir ec ti on s a re e st im at ed al on g t he CC , h en ce b loc ki ng t he s tr ea ml in es fr om c ro ss in g it . T o s ol v e t hi s, w e ma y n ee d t o d ev el op a n ew me th od f or e st im at in g F OD , t ak in g i n to ac co un t t he o ri en ta ti on d epe nd e n c e o f t he OC T si gn al . W or ki ng cl os er to t h e ac qu is it io n re so lu ti on of 3 µ m co u l d al s o he lp , as mo re st ru ct ur es ar e vi si bl e at hi gh er re so lu ti on s. A s of no w, th er e ar e al so no co ns tr ai n ts fo rc in g th e t ra ct og ra p h y to re ma in i n s i de WM , as th e wh ol e b ra in ma sk is us ed as a t ra c ki ng m as k. Th e i nc lu si on of a na to mi ca l p ri or s [ 7] fr om br ai n ti ss ue se gm en ta ti on w ou ld be im por ta n t t o co ns tr ai n s tr ea ml in es to th e W M an d c ap tu re th e t ru e l oca ti on o f W M f as ci cl es . C on cl us io n I n t hi s w or k, w e s ho w ed th e fi rs t re su lt s o f F OD es ti ma - ti on an d f u l ly -3 D p ro ba bi li st ic fi br e t ra ct og ra ph y o f t he mo us e b ra in fr om S- OC T a cq ui si t i o n s. D es pi te ma n y c ha ll en ge s, th i s w or k i s a fi rs t st ep t o w ar ds st at e- of -t he -a rt tr ac to gr ap h y o f m ic r os co p y S -O CT da ta . F ut ur e w or ks wi l l foc us o n i mp ro vi n g th e 3 D r ec on st ru ct io n m et h od, es ti ma ti ng F OD a t r es ol ut io n l o w er th an 6 0 µ m a nd in cl u d i n g a n at om ic al pr io rs t o c on st ra in t he t ra c t o gr ap h y to th e W M. R ef er en ce s [1 ] C . Le ah y e t a l. I n: B io m. Op t. E xp r es s (2 01 3) . [2 ] J . L ef eb vr e e t a l. I n: P ho to ni cs (2 01 9) . [3 ] J . L efe b vr e e t al . I n: N eu r op ho to ni cs (2 01 7) . [ 4] J. Le fe b vr e et al . I n: Ne ur . I ma g. a nd S e ns . S PI E, 2 02 4. [ 5] F. Rh ea ul t e t a l. I n: I SM RM D SG . 2 01 6. [ 6] K. Sc hi lli ng et al . I n: Ne ur o Ima ge (2 01 6) . [ 7] R . E . S mit h e t a l. In : Neu r oI ma ge (2 01 2) . [ 8] H. W ang et a l. In : J. of B io m. O pt. ( 201 5) . [ 9] G. Y a o et a l. In : Ex p. B io l. an d Me d. (2 02 0). 68 Probing the cl i nical va lue of tract o graph y reconstructi o n for glioma surge ry Ludovico Coletta 1,2 , Luca Zigio t to 3,4,5 , Paolo Av esani 1,2 , Silvio Sarubbo 3,4 1 Neuroinformatics Laboratory (NiLab), Brun o Kessler Foundation (FBK), Trento, Italy | 2 Center for Mind/Brain Science s – CIMeC, University of Trento, Rovereto, Italy | 3 Department of Neurosurgery, “S. C hiara” Hospital, Azienda Provinciale p er i Servizi S anitari, Trento, Italy | 4 Center for Cellular, Computational and Integrative Biology, Center fo r Medical Sciences, University of Trento, Trento, Italy | 5 Dep artment of Psycho logy, “S. Chiara” Hospital, Azienda Provinciale per i Servizi Sa n itari, Trento, Italy Introduction. Maximizing the extent of r esection while at the same time optimizing functional preservation is the key goal of modern neurosurger y 1,2 . Recent evidence suggests that the disruption of the white matt er scaffold of the human brain – as derived from tractography and non-invasive magnetic resonance imaging (MRI) data – is a robust predictor of lower surviva l rates and more pro nounced functional damages in glio ma patients 2.3 . Therefore, the iden t ification an d consequent physical preservation of specific portions of the white matter subtending a common function – so called white matter bundles – is of crucial importance. Within this context, the choice of tracking strategy used for mappin g white matter bundles is critical. Especia l ly in clinical populations, t he reconstruction method can return radically different overviews into t he intrinsic architecture of the brain , fundamentally shaping the subsequent downstream surgery planning. Here, we probed the specificity and sensitivity of determin i stic and probabilistic tr actog raphy in capturing dysconnection- induced impairments as we all as th eir capacity i n establishing a relationship between res ection distance and funct i onal preserv ation in glioma pat ients. Methods. We investigated a cohort of 72 glioma patients (mean age= 53.1, st d=14.1, 47 men, 57 high grade gliomas, 34 awake sur geries). Diffusion weighted MRI data for white matte bundles segmentation was obtained before surgery. After pr eprocessing 1 , d eterministic and p robabilistic tr acki ng 1 w er e p erformed on the MRI acquisition b ef ore surgery to extract five bundles of interest: the inferior longitudinal fasciculus (IFL), t he frontal aslant tract (FAT), t he i nferior fronto-occipital fasciculus (IFOF), arcuate fasciculus (AF), and th e superior longitudinal fasciculus (SLF). For each bundle and ea ch track ing algorithm separately, we init ially contrasted the su bset of pat ients whose bundle wa s left intact with the patients with partial bundle resection during surgery. The stratification was pe rformed based on overlap/n o overlap between a volumetric repre sentation of the b undle and the resection ca vities obtained w ithin 48h after surgery 1 . For AF, FAT, and SLF we tested whether patients with an intact bundle (either in t he right or left hemispher e) showed better p honemic fluency scores t han p atients with partial r esections pre surgery, 1 week and one m onth after surge ry vi a Mann-Whitney U tes t f or independent samples. Using t he sam e non-pa r ametric test, for AF, FAT, and SLF we tested whether patients with an intact bundle (left hemisphere only) showed better semantic fluency scores than patients with partial resections pre surgery, 1 week and one month af ter surgery. Moreover, for the subset of patients whose bundle was left intact, we tried to assess whether the minimal Euclidean distance between the resection cavity and the bundles was related to functional recovery/worsen i ng via a correlational analysis. Similarly, for the subset of patients with partial bundle resection, we tried to assess whe t her the volume of resection was r elated was r elated to functional recovery/worsen ing. Results. Across bundles an d for both dete rmi nistic and probabilistic tractography, an over lap between r es ection ca vities and the bundles was consi stently as sociated with a wo rse functional ou tcome one mon th after su r gery. O f n ote, this was the case when considering both r i ght and l eft hem i sphere lesi ons for phonem i c fluency, as well as left l esion s only wit h respect to semantic impairments. We found that minimal Euclidean distance between t he resection cavity and the bundles was moderately related to the degree of functional recovery (the further away, the better). Intriguingly, a qualitative inspection of the results revealed the possibility of defining a safe-minimum distance zone that avoids surgery-induced functional impair ment. Discussion. Although preliminary, our analysis suggests that both determinis t ic and probabilistic tractography ar e sensitive enough to be effectively used intraoperatively. By i ncreasing sample size and algorithmically define a safe threshold that avoids/mini m izes the risk for functional impairmen t , w e aim to corroborate this important set of findings. References. 1 Zigiotto et al . ( 2025). Neurosurgery . In pres s | 2 Duffau (2024). Brain and Sp ine |3 Coletta et al. (2024). Brain | 4 Salvalaggio et al ( 2023). Jama Neurology 69 y ai R B;: 5P’ m o V’: q’—P c o )j’ v; c o f’ xt (—P: c o V’ 5: c o g’’ 4t -:;sg— c o -:P’; g:: c o O— gt -:—P: c o w— x’ ü m 6gV 6:—Po 6:—Po 4P: w:P:’;o c 46g 6: H’o g—Po v:’o ü 6: H’ 6o 6o v:’ n O’ ’: ’: P: — ——’ – a’1:’ ’: a:tYt ’ ’;:’1o P ’ –:; aOU1 ;:–— j:Y ’ ’ ;—’ – Y—’ :: P:: ’:amoc1t N–– : ’YY aN4p1 ’ s’: gqp :P; P’ ;: ’’: YP P: ’: —: PYP :’: —P ’ –’—’ ’ aUB1o P—P —P’’—:: ’’ ’—P:—:aü1t x:—–—’o N4p ’ ’: P: :: – ’: — ’P’ —: —’:; j a’1:’ ’:o YY ——’ ’; :Y: ;:’:; –’ ’ –:; —: :’ ——’ –;Y ’; ::aus21t H::o P: :’P j::: OU ’: ’; —P’Y: P P: — ’— aF41 ’; — ’;’ aFq1 j;: ::;t p P ;o : :Y’:; P:P: UB – P: F4 ’; Fq —:’: P ::’: OU ’: ’; :’: OU :: ’: P ’ ’;:’t n n 4P: gqp —’ – mi ’: P ’ ’;:’ :: :;t 4P: ;’’: —:; – 4ms:YP:; a: : RtLRtLRtL ü —1 ’; ;–– —’ a: : ccc ü —1 P’ —:; – : : —:;Y j.Rz c ’; üc : —:;Y j.mRRRz c t B;;’o ——’ :—; :Y P: ’ ’— a;:—’ —’:1 ’; ’–: P: Y: :: ’’’j: a’ –: ;’ ’: ’; ’; ’j ü P ’:1t n B ’: :: —’:; :s:’:o mu ’: :: ’ —’:; s:’:t 3—Ps’’ ’YY —:— ’ : ’ —:— – ’–’— ’; :;; —: :: :–:; Y 3:N4paL1t 4P: ;–– gqp ;’’ :: :Y::; —:;Y 4ms:YP:; —’t Uj: :’ ;j :: :’:; Y P: —’:; P:—’ ;:— ’YP a:: –— ’ j’:; P: ’YP1 – gqaiob1t n 4P: Us8Ps4’—Y’P amR1 ’ :; ;: :—— jP:P:— Fq ’; F4 j;:t -;:s :—–— :—— ’ —P: Y P: UFNc ’YPt I’ — – P: : – :: :’ P: — —P’ ’ :–:; j ’ :’;Y P c :’ – :::—: :’YY ::’—P ’; —:—:; ’’ a:tYto ;: s;—:; ;:–’1t 2 n g:’ UB ’ —:; : :’: ’; P: :;’ – P: :’: UB ’: ’ ’Y:; ’ P: j;: UB – :– ’; YP F4 ’; Fq :’’:t V’ ’ :–:; – P: :’:: j’:; ’ P: :s ’; :’: ’Y:t H’;–– ;’—: :: —:; j::: P: : – :: :’:; j U84o P—P ::::; P: ::—:; —’ —’: – ’j:—:o ’; P: : – :: j’:; ’–: ’’ —:— ;: :’: P: :: – ;:–’ —’:; j P: t 4P: :Y ;’—: –P: :–::; ’ P: ;:–’ ;:Y::t 4P: ;:–’ ;:Y:: ’ P: —:’:; P: Y’;: ’ P: ::’: ’Y:t ):’ :Y: ’; : —:’ —:––—: :: :; ’’: P: :’P j::: Y’;: ’; P: UB —P’Y: – P: Fq ’; F4 j;: j::: :s ’; s:’: ’Y:t n O Y’;: P:; Y: :Y’: ’—’ P P: ;:Y:: – ;:–’ – P: :– :: a . sRtü2o .Rtm1 —’:; P: YP :: a . sRtcio .Rtc1t4P: UB – P: F4 j;: ’ P P’: PYP: —:’ P s:’: ’; –s Y’;: —’:; P: Fq j;: a4’j: m1t ayi ayi ayi ayi ayi ayi Fq RtR Rtuü Rtum Rtub Rtuü Rtub F4 Rtu Rtü RtLR Rt2L RtLc Rtm Fq Rtuü Rt2c Rt2 Rt2 F4 RtLL RtLi RtLb Rtim A w w -’:; ’;:; q c —:o :’ :Y: ::’:; —: —j’ – P: j;: j: :– – ::’ – P: Y’;: —P’Y:t U –s :– Y’;: ’ j;: a’;:; q c . Rtmmo q c . RtuL1J –s YP :– ’; YP F4 j;: a’;:; q c . Rtco q c . Rtü21J s:’: :– Y’;: :– ’; YP Fq j;: a’;:; q c . Rtmbo q c . Rtü1J s:’: YP Y’;: :– ’; YP F4 j;: a’;:; q c . sRtRco q c . Rtmi1t B P: ’: :o :’ ’—’ ’ j::; j::: —P’Y: j;: UB j::: :s ’; s:’: —’ ’; —P’Y: – Y’;:o j’:; : —:’ —:––—: a4’j: c1t a yi a yi a yi a yi Fq Rtü RtRu Rtüc Rtcu F4 Rtmu Rtuü Rtü2 Rt2R v r w n 8: :Y’:; —:’ – P: F4 ’; Fq j;: UB :’: P ’ Y’;: j:–: ’; ’–: Y—’ :’: ’: P ’ ’;:’t 4P: : P:; Y::’ PYP: ’—’ j::: Y’;: ’; P: UB :’: – P: F4 j;:t 4P: F4 j;: :: ’ P j: —: ’ – :’Y Y’;: —’: a:—: – P: :– :: ’ s:’: ’Y:1t x—P j:’ ’ :; j P: j::; —:’ j::: :s :’: UB ;––::—: ’; Y’;: —P’Y:o P—P ——;: P Y: —: – P: :– ;:o YY:Y P: ::; – P’: ’’ – P: j;:t F:’o P: : YY: P’ UB ’ Y j’: – :’Y Y—’ —: – ’;:’ ’:t mt FY’ xo w—P BNo x xo : ’tf V w:—t cRmuJ cma1GLüs LuRt ct VP 3(o w—P f8t 2 t cRR2J SI Gxcüxcit üt 4 xBo 8P:::s(YP Vo f: xfo : ’t t cRR2J Rl ac1GubiRt ut B po B 7o (— (o : ’t 2 t cRmmJ E6R au1Giümiuct t D’ NBo v’––sV’P 3o H 3-o : ’t :;t cRmuJ 2ac221Gc22’mLüsc22’mLüt 2t )’ 7o v’– Fo )Yj:Y go : ’t t cRmLG Ex9 aü1G2bLbt Lt )::’ Bo f:: -o xj: fo f: N(t t cRRbJ üüLt it 4: fNo V’’’: Uo V: Bt t cRRLJ üGmubLc bt 4: fNo xP qo q’––: No : ’t t cRmbJ cRcGmm2müL mRt q’;’ Bo x’: xo x—PY (o : ’t t cRccJ cuGmmbRcb 70 A compreh ensive, high- resolution 7T atla s of structural br ain connectivity in humans Hélène Lajous 1 , Y asser Alemán-Góm ez 1 , Ileana Jelescu 1 , Patric Hagmann 1 1 Department of Radiology , Lausanne University Hospital and University of Lausanne, Lausanne, Switzerland Introduction. Ultra-high-field diffusion magnetic resonance imag ing (dMRI) enables un prec edented spatial resol ution for probing the fine-scale architecture of human brain struc tural c onnectivity . Tractography derived from dMRI is a powerful meth od to ass ociate biolog ically meaningfu l microstruc tural propert ies and c onduction d elays with specific cortico-cortical pathways and fiber -tract segments – thereby deepen ing our understanding of the anatomical fou ndations of cognition and behavi or . Population-b ased brain atlases can e nhance the interpretab ility of tractography results and support robust group -level inferences in structura l connectomics. However , techn ical challenges an d stron g sus ceptibility arti facts at 7T have restricted t he av ailability o f l arge -scale dif fusion datasets required to build such structural c onnectivity atlases so far . In this work, we introduce a p ipeline th at integra tes advanced tractogr aphy techniques with r obust and an atomically -inf ormed streamline pruning strategies, applied to the 7T Human Conn ectome Project 1 (HCP) data. Ou r goal i s t o generat e a high-resolution, neuroanatomically - grounded atlas of structura l brain conn ectivity . Methods. Data. This study inc luded 142 subjects (90 fem ales, mean age: 29.8 +/- 3.19 years) from the 7T HCP dataset 2 . Tractography . We implemented an an atomically- constrained tractography 3 pipeline for deter ministic whole-b rain fiber tracking at 7T using MRtrix3 4 . T rac king parameters included a minimum and maximum streamline length of 15 mm and 150 mm, respectively , a step size of 0.5 mm, and a maximum curvature angle of 45° between ste ps . T en million s treamlines wer e seeded fr om the cort ical gray -white matter in terface, subcortic al structures, deep gray mat ter nuc lei, and the brain stem. A n exp ert neu roradiologist qualitatively ass essed the fiber orientation distribution functions compute d via mu lti-shell, mu lti-tis sue constrained spher ical deconvo lution 5 , with part icular attention to r egions of com plex fiber crossings. T o lev erage the high spatial resolution of 7T imaging (1.05 mm isotropic for the 7T HCP data, being an i nc rease of 40% in volume compared to yet remarkable high - quality HCP data at 3T), we incorporate d an open-s ource framework 6 that c ombines multiple fine -scale parcellatio ns of t he human brain substruc tures. Streamline filtering. The res ulting tractograms were initially filtered using S pherical -dec onvolution Informed Filtering o f T r actograms, v ersion 2 7 (SIFT2 , MRtrix3) with a filtering threshol d of 0.5. Anat omically - informed pruning followe d, exclud ing implausible connectio ns such as streamlines linki ng the thalamus to contra lateral hemispheres. We impleme nted an innovative pro babilis tic approach for det ermining the behavior of white m atter fiber bundles in subcortical str uctures s uch as the deep gray nuclei, the bra in ste m, and the cerebellum. According to expert’s rec ommendation , we assu med that the prob ability P k f or a streaml ine to c ross any subcortic al struct ure k follows a monoexponential dec ay law: 𝑃 = exp(− ∗ 𝑃 , 4 ) , where: is the length of the stream line within th e r egion of interest , and 𝑃 , is the mean partial volume of gray matt er in o btained using FMRI B’s Automated Segme ntation T ool 8 (F AST ). Connectivity anal ysis. We computed individual struc tural connecto mes, sc aling the con nection strengt hs by the volume of the corresp onding brain regio ns. Results. Although most parcellat ion algorithms have b een trained on 3T d atasets, Chimer a 6 prov ided precise, f ine-scale brain p arcellation of 7T data. Moreov er , the f iber orientatio n distrib ution functions were evaluated accurat e, especially in regions where the main fiber bundles intersect, such as the corpus callosum, the corticos pinal tract and the superior longitudinal fascicu lus in the centru m semiovale, but a lso bend, for instance in the temp oral lobe, n ear the unci nate f asciculus. Finally , we showe d th at anato mically -inform ed fiber pruning is cruc ial to hand le dense connectomes a t 7T without compro mising biologically -meani ngful connecti ons. Conclusion. In t his work, w e present our metho dology to bu ild the f irst comprehe nsive, fine -scale atlas of the c omplex organization of supra- a nd infratentorial whit e matt er in the hu man brain at 7T . Future steps will consist in exploring how anato mically -informed fiber pru ning can enhance the rel iability of tractograp hy- based mapp ing of structural connectivity in the young adult. References : 1 The WU-Minn Huma n Connectome Project: An overview . V an Essen et al., NeuroImage (2013) 2 High resolution whole brain diffusion imaging at 7T for the Human Conne ctome Project. Vu et al ., NeuroImage (2015) 3 A natomi c ally-constrained tractography: Improved diffusion MRI streamlines t ractogr aphy through effective use of anatomical information. Smith et al., NeuroImage (2012 ) 4 MRtrix3: A fast, flexible and open software framework for medical image proces s ing and visualisation. T ournier et al., NeuroImage (2019) 5 Mult i- ti ssue constrained spherical deconvolution for improved analysis of multi -shell diffusion MRI data. Jeurissen et al., NeuroImage (2014) 6 Ale mán- Gómez, https://github. c om/conn ectomicslab/ c himera 7 SIFT2: Enabling dense quantitative assessment of brain white matter connectivity using streamlines tractog raphy . Smith et al., NeuroImage (2015) 8 Segmentation of brain MR images throu gh a hidden markov random field model and the e xpect ation-maxim ization algorithm. Zhan g et al., IEE E T ransactions on Medical Imag ing (2001) 71 4 2 3 1 Impro ved Riemannian FOD aver a ging for ber bundle priors incorpora tion in FOD-ba sed tr actography algorithms G. Vil l e 1 , E. Car uyer , 1* J. C oloigner 1* 1 Univ Rennes , Inria, CNR S, Inserm, IRI SA UMR 6074, Empe nn ERL Rennes , U - 1228, Fr ance *These auth o rs co n tributed equally t o this w ork. INTRODU CTION Guiding tra ctograph y algorith ms with prior infor mation from anatomy or microstructur e can a llow f or bett er cov erage of w hite ma tter bundles with str eamlines , with out incr easing the nu mber of false positives (impro ved sensitivity-spe cicity r atio). In [1], these p riors ar e estimated fr om templa tes of streaml ines and tak e the form of trac k o rientat ion distribut ions (TOD) [2], which once incorpor ated voxel wise in to ber orientation distribut ions (FOD), help tractogr aphy algorithms to reco n struct the ber b undles. In a similar approach [ 3 ], T OD a re mixed with diusion orientation distribu tion functions ( ODF) thanks to a weighted ave ra g ing follow ing a Riemannian fra mework [4]. The voxel-speci c weight s allow to adapt the importance give n to priors to the ber congur ation and to th e condence in the ODF esti mate. Foll owing this work, we pr oposed an impro ved way to perform a veragin g betwee n model and priors , which is als o gener alized t o FOD . METHODS The approach in [3] can be divided in three steps, that we also follo wed in our work: i) building f or each bu ndle of inter est an anatomical atlas from pr e-segmented streamlines, ii) es timating the TO D -based prior s fro m this atlas of streamlin es and iii) incorporat ing t he T OD in to the ODF of the s tudied subje ct, once r egistered in the l atter’ s space , by u sing the Riemannia n wei ghted avera ging fra m ewor k mentio ned above . The latter starts by computin g the sq uare root of the input distribut ions and has been devised for functions whose s quare inte g ra tes to 1 o ver the sphere [4]. While the avera ging implementat ion fr om [3] only work ed for ODF (diusion- based) , we extended it to include F OD (ber -based). This requir ed an ad aptation, as (square root s of) FOD don ’t (squar ely) integra te to 1 over the spher e, contr ary to diusio n ODF . Thus, we normalized the square roots of FOD to make them squar ely integr ate to 1 , by multipl ying each of the spherical harmonic s (S H ) coeicient s used to repr esent them by a constant fact or . After av er aging, we multiplied the output ’ s SH coeicients by the inver se of this fac tor , to bring the dist ribution back to it s initial density . Furthermor e, we chose to use spherica l designs [5] to compute a (point, val ue) repr esentati on of the FOD, useful to get their squar e root o r t heir s quare afte r hand, ins tead of a simple grid s ampling as it w as done before . Sp herical designs allow error -free replacement of int egr als by su ms ; they are hence use ful t o nd the repres entation by coe icients of the FOD afte r c omputing the squar e root or the squa re . Finally , another contributi on was to constr ain the computat ions with in a white matter ( WM ) mask, to avoid falsely modifying gray matte r (GM) and cer ebrospina l uid (CSF) distrib utions. We tried our framew ork with 105 hig h resolut ion hea lth y s ubjects from the Human C onnecto me P roject (HCP) 2 . They have a tract ogram pre-s egmented into ber bundles , that we used as gro und-truth. 10 0 subje cts were us ed to build TOD-ba sed priors for 6 bundles of in ter est. The 5 rema in ing subjects were used for testing. We rst estimated FOD using MSMT - CSD [ 6]; that allowe d us to create a WM mask from GM and CSF partial volume map s. We then incorpor ated the bundle prior s in to the FOD images thank s to our improv ed av eraging framew ork. Afterwar d, we perf ormed tr actograph y wi th t he i FOD2 algorithm [7], using as input both the classi cal FOD and the output of the aver aging, that we call as in [1] enhanced FOD (E-FO D). We genera ted 1 million streamli n es in these tw o experime nts for equal comparison. The tr actogr ams were then ltered with bundle extr emities mas ks fr om T ractSeg [8] to k eep only the s treamlines of interest for the b un dle of study . Final ly , we perf o rmed a clustering with one cluste r using Quickb undles [9], to remov e every stre amline further than a bundle-specic threshold from the o btained centroid. That allow ed us to remove so me false positiv es. We compared this output to gro und -t ruth usi n g a wei ghted-Dice coeicie nt and the ov erl ap sc o re (w hich is th e proportion of th e gro und -truth mask cover ed by str eamline s). RESUL TS Fig. 1 shows that we managed to gener alize the Rieman n ian aver aging framew ork to FOD , by preservi n g the input distribution s’ density while enhancing the bundle of study . I ndeed, in t h e E- FOD i m age , the cin g ulum (CG) is m ore rec ognizable a n d co ver s a grea ter surf ace. The validity of the enha ncing ca n be check ed at the voxel scale wit h Fig. 2 : the gr een peak, corr esponding to C G, is mor e voluminou s after priors incorpor ation, while the second peak is re duce d . Fig. 3 and 4 show that with ou r priors incorpora tion, tractogr aphy m anag es to better reconstruct the bundle s, m os tly at the bun dles’ extr emities which become much better covere d, even with a sa me input numbe r of streaml ines . For t he right p art of t he cortico spinal tract (CST right), t he a verage overlap between the 5 subject s used f or testing rise s fro m 0.813 without pr iors to 0.947 wit h prior s. For the right part of the s uperior longitudina l fas cicle I (SLF_I rig h t), it rises fr om 0.691 to 0.877. Ho wever , the aver age weighted -Dice score only go es fro m 0 .648 t o 0.651 for CST ri ght and from 0.6 1 5 to 0.66 2 for SLF_I right. It wa sn ’t possible to s h ow all the results by lack of space , but we t ried to di splay the mos t repr esentativ e one s. DISCUSSION AND CONC LUSION Thanks t o priors incorpor ation, we ma naged to get a bett er overlap a nd spa tial resol ution at the bundle s cale with the same number of stre amline s, as did in [1 ] and [3], but using a weighted aver aging fra mewor k gener alized to FOD an d technically improv ed (constr ained by a WM mask and using spherical desig n s for sampling) . Howev er , m ost of the time , the weighted -Dice score increase s very little or not at all. Fig. 3 g ives us an explanat ion: incorpor ating the priors leads to estimate stre amlines that wer e not prese nt in the gro und -trut h , like in the fanning part of CST right. Th ey are hence acco unted for f alse positiv es and lower the we ig hted-D ice score . Con vers ely , the overlap sharply in creas es since it is not penal ized b y false positives. Bu t the wei ghted -Dice may not be the most relevant metric, since it bases its comput ations on density maps, namely images showing the proporti on of streamline s pa ssin g throug h each voxel. And streaml ine density is know n to have its own biase s in tr actograph y . Our future plans includ e using Recobundle s [10] to segme nt the output tr actogra ms of our method into bundles instea d of masks from T ractSeg, and t o add a strea mline-bas ed evaluation sc ore. We also ai m at ev aluating our fr amewor k on clini cal data and s ubject s with ne urolo g ical dis orders . REFERENCES : [1] Rheault et al., Neur o image 186:382-398 (2019). [2] Dhollander et al., Neuroi mage 94:312-336 (2014). [3] Durantel et al., PLoS One, 20 (3), e0304449 (2025) . [ 4] Goh et al., Neur oimage 56: 1181 - 1201 (2011). [5] Dels arte et al., Ge om Dedicat a 6:363- 388 (1977) . [6] Jeuriss en et al ., Neuroi mage 103:41 1- 426 (2014) . [7] T ournier et al., Proc . Intl. Soc. Mag. Reson. Med. 18:1670 (2010). [8] Wa ssert hal et al., Neuroimage 183:23 9 -253 (2018). [9] Garyfallidis et al., Fr on tiers in Neuro science, 6, 17 5 (2 012). [10] Ga r yfallidis et al., Neur oimage 170: 283 - 295 (2 018) . 2 https:// www .humanconnect ome .or g/ 1 FOD image esti m ated with M SMT - CSD (left) and o utput E-FO D image after av er aging with a cingulu m TOD image u sing our fra mework (right) (Only a part of the i mage is sh ow n) . 2 Zoom o n the voxel in the middle of the white square in Fig. 1 : the FOD (l eft) is aver aged w ith t h e T OD (middle) to get the E-FOD (right). 3 CS T right estimat ed from a tract ography using clas s ical FOD ( left) and E -FOD , namely guided by priors (middle), and asso ciated gro und -truth (right) . 4 SLF_I right estimated fr om a tra ctograph y based on FOD (l eft) and E-FOD (right). 72 Multimodal Interactive White Matter Bundles V irtual Dissection Garyfallidis E 1 , Gor M 1 , Koudoro S 1 , Abouagour M 1 , V avassori L 2 , Coletta L 2,3 , Rheault F 5 , Petit L 4 , Sarubbo S 2 , Avesani P 2,3 1 Indiana University , Bloomington, IN, 2 University of T rento, T rento, Italy , 3 Fondazione Bruno Kessler , T rento, Italy , 4 GIN-IMN, Bordeaux, France, 5 University of Sherbrooke, Sherbrooke, QC INTRODUCTION: Virtual dissection of white matter bundles through tractography has become an essential tool in both modern neuroscience and clinical practice. Despite the emerging impact of automated methods, manual interactive identification of white matter pathways plays a key role in the investigation of less known bundles and in the clinical practice where fiber pathways deviate from canon ical patterns. Nevertheless manual virtual dissection suffers from two main drawbacks. First, the selection of relevant fibers is performed by manually sketching ROI on volumetric images, with voxel-based selection having relevant implications for th e dif ferentiation between plausible and implausible fibers. Second, the MR images do not easily support the identification of anatomical landmarks in the white m atter . METHODS: W e propose a novel approach to white matter virtual dissection that combines two key innovative elements: (i) manual selection of streamlines driven by connectivity patterns 1 rather than volumetric waypoints, and (ii) multimodal imaging supporting the seamless integration of in-vivo and ex-vivo structural connectivity data 2 represented as polylines and textured meshes, respectively . From a technological standpoint , the implementation of these features is carried out using the Free Unified Rendering in pYthon (FURY) 3 . This framework is supporting WebGPU, a new powerful and cross-platform API that provides a modern and efficient way to utilize the GPU for rendering and computational tasks, building on top of native APIs like V ulkan, Metal, and DirectX. RESUL TS: The manual virtual dissection driven by fiber connectivity patterns rather than ROIs has proven to achieve a more accurate characterization of white matter bundles according to the irregularity measure 4 , especially in a clinical context where the canonical patterns of connectivity may deviate from healthy ones. In addition, the integration of textured mesh of white matter within the virtual dissection process provides further support to anatomical plausibility assessment. CONCLUSION: The multimodal integration of white matter imaging of the human brain opens a new scenario for the manual identification of less known anatomical connectivity structures. Both perspectives, namely in-vivo and ex-vivo, can mutually contribute to a more accurate characterization of the bundles. Our advanced scientific visualization framework ensures a scalable and ef ficient across-platform for a wide user adoption. Figure 1: The multimodal integration for manual interactive bundle tractography dissection: (A) the digital representation of fibers as polylines as reconstructed by tractography , (B) the volumetric MR images and their DWI derivatives such as F A, (3) the mesh of white matter surface exposed after Klingler dissection and photogrammetric acquisition followed by 3D reconstruction. 4 Sarubbo S, et al. (2024). Changing the Paradigm for T ractography Segmentation in Neurosurgery 3 Garyfallidis E., et al., (2021). FUR Y : Advanced Scientific Visualization 2 V avassori L., et al., (2025). Brain Dissection Photogrammetry for Studying Human White Matter Connections 1 Porro Munoz D, et al. (2015). T ractome, a visual data mining tool for brain connectivity analysis 73 f H U L U H L U U H : A : L U L L A U U L FU U L A L SL L wU :U o LH U a U E L d EL n L c F L 2)HW p D ))Dx C0p Cv e 0p L C0L , p 6 CpCL v 26 p , ( TD )) , p M 2 pD ))Dx I bt )P D vh — f w 2 ) H W D b xH w z 4xz Pg H t w b z s D T t b w ( D ) w N— H f f t— ( D p é) H D b A % x T H w tf p D ) ) D x Ib t ) PD ew D d v o x c D ev w Mt w D fHGD hD TbD x x H%) M M s t GGD P wx %G wg D T%T —ft wH % ) t é D h (% bD w gt ) z D t bx %fh 1 gHx TbD W t fD )P D Hx P %)P D b)H) é t x M M s Hx )% w % )fz t ) H)hDT D )hD )w bHx - Gt P w%b G%b (% bw t fHw z y—w t fx % t (%hHGH t yf D bH x - Gt P w %b G%b hD (D)w Ht 1 gD Tt w g%Tg zx H%f%é z %G M Ms Hx (—f w HGt P w %bH t f H )W% fWH )é H) Gft((t w %bz hD é D)Dbt w HWD t)h Wtx P —f t b (DP g t )H x (x 1 g Hx P %(T fD]H w z —) hDb x P%bDx w gD )DDh G%b t hDDTDb —) hDb x w t )h H) é %G w g D —) hDb fzH ) é yH %f %é HPt f Tb %P Dx x Dx pDP D)w t hWt)PDx H) hH GG— x H %) H(t é H)é t )h wbt P w % é bt T gz gt W D fD h w% wgD hD W D f%T (D )w % G t )% W D f Gbt (D [ % b-wbt P w%( D wb zG % b (% bD T bD P Hx D t x x D x x (D )w % G [ gHwD ( t w wD b 36 (HP b% x wb — P w — bD C ) y b H D G w g D x D t f % ) é wb t P w t T T b % t P g D x é D ) D b t w D t T b % G H f D G % b D t P g G H y D b y — ) h f D ( t T T H ) é ( H P b % x w b — P w — b t f ( D w b H P x % ) w% t P D ) wb t f x w b D t ( f H ) D L wt w H x w H P t f t) tf zxH x %G w g Dx D y — ) hf D T b %G H f Dx Pt) T b %W H hD t ( %b D x TD PH G H P t) h f %Ptf H B Dh H ) WDxw H étw H %) w g t) f %% -H ) é tw t b DéH %) %G H ) w Db Dx w % b w b tPw tWD b téDh ( Dtx— b Dx 3D gzT % wgD x HB D w gt w t w bt P w yt x D h t T T b% t P g P % —fh z HD fh )% W D f y H% (t b-D bx G% b M M s R —Hfh H)é %) wgD [ %b- % G A h % — H) D w t f [ D TD bG % b( D h t ) t h W t )P D h (HP b%x wb —P w —btf P % (Tt bw (D )w (%hDf 6 e 6 t f % )é GHyDb y—) hfDx w% hDbH W D (%bD H)w D bTb DwtyfD t )h x D)x Hw HWD (D w bH P x %G [ gH w D (t w w D b H)w D é bH w z t )h H) Gft ((t w H%) wgt w P % — f h ) % w y D % y wt H ) D h [ H wg t P ft x x HP t f s 1 C ( % h D f 3 D ) % wt y f z t TT fH D h % — b G b t ( D [ % b- % ) w[ % ( D wb H P x G b D D [ t wD b I 3 t )h G bt P wH % ) t f t )H x % wb% T z I v y D w[ D D ) MMs t )h P%)w b %f é b %—T x fmDrvoN 3D —x Dh w gD v 6F 0,1 ht w t ytx D P %(Tb H x H) é Tt w HD) w x [Hw g ftw D f H GD hDTb Dx x H %) GD(tf Dx t é D z D t bx t )h gDt fw gz P %)wb % fx G D (t fDx t é D z D t bx bDP b—Hw D h G b%( wgD I b D ) P g % f h t é D T x z P gHt wbz P D )wD bx % G p D )) D x t )h 1 % — bx I b t )P D s HG G — x H % ) 6 p C TbDTb%P D x x H)é G% ff % [ D h w gD Tb%w % P % f D x wtyfHx gDh yz A h%—H) D w t f H)Pf—hH) é hD )%Hx H) é NH y y x b H ) éH ) é P% b b DPw H % ) ( %w H %) t) h Dh h z P— b b D) w P%b b D Pw H % ) t) h y H tx G H D f h P% b b DP w H %) 1 [DH ég w Dh H (téDx [Db D — x Dh G%b t) t w %( H P tf b DGDb D) PD t) h b DéH x w b tw H %) 7b HD ) w tw H %) h H x w b H y— w H% ) G—) P w H%)x 7 sI x [ D bD D x w H(t w D h —x H )é wg D 6 —fw H L gDff 6—fw H 1 Hx x —D e % )x wb t H) Dh L TgDb HP t f sDP %)W%f —w H%) 6 L 6 1 e L s t fé%bH w g( H(Tf D (D)w Dh H) 6 pw bH ] 1 btP w %é btTgz [ t x TDbG%b(Dh —x H) é wg D HI7 s t fé %bHw g( [ Hw g t wtbéD w )—(yDb %G (Hf fH % ) x w bDt (fH )Dx x D D hDh Gb%( wg D [ g% fD ybt H) (t x - I Hy D b y —)hfD D fD( D )w x [ DbD D ] w bt P w D h G %b D t P g W % ] D fx G% ff%[ H)é tT Tb %tPg t) h w g D 6p1b H ] H ( T f D( D) w tw H %) 6tH ) hH b DPw H %) T Dt- x [Db D w g D) h Db H WD h Gb %( w g D GH]D fx v (—fw H P %(Tt bw (D)w (%hDf 6 e 6 [ t x t fx % TDbG%b(Dh H)Pf—hH )é %)D H x % w b%THP P% (T tb w ( D) w b DT b DxD) w H ) é G b DD [t w Db % ) D H x % b Dxw b H Pw D h P%( T tb w ( D ) w t) h %) D w % w g b DD t) H x %w b %T H P P%( Ttb w ( D) w x P%b b DxT% ) h H ) é w % hH x w H ) Pw GH y Db T% T — f tw H %) x 1 g H x ) — (y Db P% b b DxT %) h x w % h Dw DPw D h T Dt- hH b DPw H %) x % G DtPg 7 sI Ib %( w g H x ( %h Df [D h Db H W Dh x DW D b tf ( D w b H Px G %b D tPg W % ]Df H ) Pf — h H ) é G b DD [tw Db G b tPw H %) I 3 H x % bD x w bHP wD h [ t wDb G bt P wH% ) Cp 3 Gbt P wH%) t f t ) Hx % wb%T z I v ( D t ) h HG G —x HWHwz 6 s t ] Ht f h HG G —x HW Hwz v s t )h bt h Ht f h HG G —x HWHwz p s G % b Dt P g t )Hx %wb% T HP P% (T tb w ( D) w 3g H w D ( tw w Db w b tPw x [D b D xDé (D ) w Dh — x H ) é R— ) hf DLDé t) D) g t) PDh WD b x H % ) % G w g D p DP% R— ) h f Dx t f é% b H w g ( [H w g t G H ]D h xDtb Pg b th H — x %G ( ( 3D TDb G%b (Dh w g D x Dé(D) w t w H%) %) DtP g x — yo DP w x w btP w %é b t ( —x H) é t [gH w D (tw w Db y— ) hfD tw f t x hDb HWDh G b%( w g D P %g%b w %G t ) ) %w t w Dh A— (t) e %) )DPw %(D 4 b%oDP w A e 4 ht w t 1 gHx w D (Tft w D [ t x P % )x w b—P w D h w gb%—é g t ) HwDbt wHWD bD é Hx w bt wH%) T b%P D x x w gt w t fHé )D h H)hHWHh —t f Ae 4 x —y oDP w ht w t w% t P % ((% ) w D (Tft wD —x H)é t hHG GD % ( %bTgHP t TT b%t P g t h t T w H)é wg D ( D w g% h T b%T% x D h yz G% b hHGG—x H% ) wD)x %b H(t é D x 1 gD bD x —fw H)é t wftx P % )w t H)x y—)hfD ( % hD fx D t P g P% (T b H x H ) é x w b Dt (f H ) Dx G b % ( tf f tw f tx x — y o DPw x b Dé H x w Db Dh w % t xw t) h tb hH BDh xT tPD I% b P%( T f Dw D ( Dw g %h % f % éH Ptf h Dw tH f x b Dé tb hH ) é tw f tx Pb Dtw H % ) T f Dt x D b DG Db w% x D P wH% ) % G 3 D h D W D f% T D h t wbt P w% ( D wbz t T T b % t P g wg t w x D fD P wx wg D t )H x % wb% T H P P % ( T t bw( D )w ( % x w t fH é )D h [ H wg wg D f% P t f x wb D t (f H ) D h H b D P wH% ) t w D t P g T%H)w bt w gDb wg t ) t WD bté H)é t ff P %(Tt b w(D)w x t x Tb%T% x D h H) 1 gHx TbDx D bWD x (HP b %x wb —P w—b t f x TD P HGH P Hw z H) P % (TfD] [ gHw D (t w w D b bDé H%)x 6 HP b%x wb —P w— bt f (Dw bHP x Gb % ( w gD x D fDP w D h P % (Tt bw (D )w [ D bD x t (TfDh t w Dk—HhH x wt)w T%H) wx t f%)é D t P g y—) hfD w % P bDt w D Tb %GHf D x G%b x wtw Hx w HP t f P %(Tt bH x % ) t x Hff —x w btw D h H) IH é 3D TDb G%b (Dh t w [% x t(T fD w w Dx w G% b w gD Iv t) h w gD I3 y Dw [DD) Mss Ttw HD )w t)h P %) w b %f éb %— Tx [H w g téD éD) hD b t)h x H w D %G 6pC tP k— H x H w H %) tx P% Wtb H tw D x P%b b DPw H ) é G %b (— f w H Tf D P% ( Tt b H x %) x dmN xh D N i w o oeN c xN N e v w v( %) é w g D xDé ( D) w D h y — ) h f Dx xH ] h D( % ) xw b tw Dh xH é) H G H Pt) w éb %— T hH GG Db D) P Dx t x H f f —x w b tw Dh H ) IHé— b D 1 g D f tw D f HG D h DTb Dx x H %) MMs éb% —T D]g Hy Hw Dh Df DWt w Dh Gb DD [tw Db I 3 Gb t P w H%) x H ) w gD f DGw t) w Db H %b w g tf t(H P b th H tw H %) v1 p f DG w Gb %) w % T %) w H ) D w b tPw I41 w g H b h xD é ( D ) w % G w g D P% b T — x Pt f f % x— ( ee t) h b H ég w w g tf t( % T b D ( % w % b wbt P w 1 4 p , 6 P % ( T t bD h w% gD t fwg z P % )wb % fx 1 g D I 3 ( D wb H P k—t)w HGHDx wg D b D ftw HWD GbtP w H%) %G GbDDfz hHGG— x H) é [t w D b H) w gD D]w b t P Df f— f t b x TtP D x DbW H )é t x t Tb %]z G%b P g b%) HP f %[ éb t hD )D —b% H)G ft (( t wH%) [ gHP g Tft z x t THW %wt f b % fD H) wgD )D —b% T t w g% é D )D x Hx % G W t bH% —x )D —b% f% é HP t f t )h T x zP gHt wbHP h Hx % bhD bx H)P f—hH)é M M s e % )x Hx wD)w [ Hw g T bD W H% —x bD x D t bP g [ D % y x D bWD h tf w Db tw H %) x H ) G b %) w %f H (y H P PH b P — H w x H (T f H P tw Dh H ) M Ms T tw g %T g z x H %f %éz v h h H w H % ) t f G H ) h H ) é x x — P g t x h D P b D t x D H ) I 3 % G w g D b H é g w T % x wD b H % b Tt bHDw % % P P HTHw t f w bt P w 4 74 1 t )h bHégw H)GDbH %b P DbDyD ff t b TDh—)P fD C e 4 Pt ) fH -Df z yD t w w bH y— w Dh w % %— b (— fw H P %(T tbw (D) w (%h DfH ) é tT Tb %tPg [g H Pg D( Tf %z x (% b D b Dtf H x w H P P%( T tb w (D ) w D x w H ( tw H %) x wgb % — é g G H ] D f y t x D h h D bH W t wH % ) I — b wg D b( % b D T t wH D )wx h D ( % )x wb t wD h xH é ) H G H Pt ) w f z H ) Pb D txD h G b t Pw H % ) tf t ) H x% w b % T z I v H ) w g D é D ) — % G w g D P% b T — x Ptf f %x— ( [g H f D D ]g H y H w H ) é h DPb DtxDh Iv H ) w g D b H ég w H ) G Db H %b PDb Dy Df f tb T Dh — ) Pf D G H ) hH ) éx w g tw h H W Db éD G b %( T b DW H %— x x w — hH D x 1g H x h H x Pb DT t) Pz H ) b Dx— f w x (t z yD D ]Tft H) D h yz % —b x DfDP w H%) (D P gt )H x ( G%b HhD)w HGzH) é w gD t ) Hx %w b%THP P %(Tt bw (D )w (%x w P %ff H)Dt b [ Hw g Dt P g wb t P w oe N c xN N e v w i wo c v wc hxN evw 1g D h H G G Db D ) PD H ) w g D ) D— b % H ) G f t( ( tw H % ) P% ( T % ) D ) w W tf — D y Dw [D D ) M M s t ) h A e H ) w g D v1p t) h 1 4p , 6 P% ) G H b ( x T b D W H % — x b D x— f w x b D T % b w H ) é t) txx% PH t w H % ) yDw[DD ) w gDx D w bt P w x t )h x D b—( H)Gf t ((t wH % ) H) (t o %b hD TbDx x HWD hHx %bhDb 6 %bD% WD b w g%x D TbDGb%)w t f P %bw HP % x w bHtwtf f%%Tx t b D -)%[ ) w % yD H)W%fWDh H) é % t f %b HD) w Dh yDg t WH%b (DhH tw H) é (%w %b yDg t WH%b x —Pg t x Tf t )) H )é fDtb) H )é t )h (%w %b D]DP — w H%) 7— b G— w —b D Tf t ) x H) P f— hD D]Tf %b H) é )D[ tTTb %t P gDx G%b Tb %o DP w H) é (H P b%x w b— P w — btf ( Dw b HPx tf%) é GH yDb y —) hf Dx [gH P g thh bDx x P t x Dx [gDb D P D)w b t f f H) D b D h— P w H %) Hx )% w t TT b% TbHt w D x —P g t x t w GHy D b y —)h fD D ] w bD (HwHDx [ Hwg wg D t H( % G ( % bD T bD P Hx D fz H)W D x w Hé t wH) é t fwDbD h bD é H%)x H) Tt wHD)w T % T— ft wH%)x v h hHwH%)t ffz [ D Tft ) w% H ) W D x wH é t wD P % bb D f t wH % ) x y D w[ D D ) wg D x D x wb — P w—b t f G H) h H) é x t )h G — ) P wH% )t f h t wt x — P g t x t P wHé b t Tg z w% y D wwD b — ) h D bx wt )h wgD — ) h D bfz H )é ( D P g t )H x ( x % G t Tt wgz t) h f tw D f H GD h DT b Dx x H %) dmp mdm wc m N e gt (yD bft )h 6 D w t f 0 D —b%C(t é D e gt )hH% R m D w t f L P H pD T A h% —H) p p% z S e sD x (Hhw 1 p% yD bw N e % f%Hé )D b S L P H pD T L ( Hw g p , 1 % —b)HDb S s e tft (t )w D I e % ))Dffz v 0 D —b%C(t é D L w 7 )é D , L P gHff H)é E N p gD t —fw I h % H t b5 HW S t -%y 3 4 D w D b 0 E ft—x 6 A h %H B D )%h % N —H(% )h v 6 D—)HD b S 1 gHbH % ) S 4 e %(T—wDb 8 Hx H% ) t )h C(t é D 2)hD bx w t )hH)é s—bt )wDf 1 N Hbt bh N e t b—zD b , e % ((% [ HP - 7 e %f%Hé )D b S 4 M 7 L 7 0, D 1 % —b)HDb S s e t ft (t )wD I e % ))Dffz v 4 b%P D D hH)é x % G w gD H)w D b)t wH%)t f x %P HD wz G % b ( t é )DwHP bDx %)t )P D H) ( D hHP H)D 8 % f l 0 a A 5 0 A E 0 E 0 E, E A 0 <0 h 1 h A< AE A 5 E E A AA 5 0 A 0 5,0 , < 0 l 0 d A E 0 AA <5500E 0 500 A0 5AE l C ,00 0 E ,0 A< A 0 A0 AE 0 A 0 AE d : AE 0E E 5E A 0 0< 0< e r AE 5 0 A E A E A 0< ?+(@6&;9%A,' , 1 /(B 3.(C"#69. 2 /(D3'$4;$'(B 3 4; 3 / ! ;,-%,4 ( E 6,96F! ,A3'. 4 /(G H, !; $%,H 4 / 2 .+;$, 63( <3HI$ 5 /(<"+9(= 3-.*: 6 /(0$-9 %3'(@66,3J 7 /(G%,&(K $#L,', *36$" 8 † /(D3&95 ;(M "$'F2 3"(M $' I 9 † /(G69N$'#9%(OP (Q9,6 10 † ( Affilia@o ns: 1. Faculty of Med icine, Un iversité de Montréal, Montreal, Quebec, C anada 2. Neu rosurger y Divisi on, Depa rtment of Su rgery, Montreal Child ren’ s Hospital, M ontréal, Q uébec, C anada 3. Dep artment of Pediatric Ne urosurge ry , Th e Pediatric B rain Center , Dan a Childr en’ s Ho spital, T el-Aviv Medical Ce nter , T el-Aviv Univers ity , T el-Aviv , Israel 4. Pediat ric Epilepsy Unit , T el Aviv Medical Center , T el Aviv Universit y 5. Dep artment of Pediatric Ne urosurge ry , !"#$ %"&'()*+,%+ '(-./ (0%*+1 "2'$1, ' 3(4%&5%+.(67+-#.% ()"%8#- $#9%/(:%.5%+ 3(;<#< 3(6 7+-#.% ( 6. Epilepsy In sOtute of New Je rsey , Jers ey City , New Jersey, United States 7. Divi sion of N eurosur gery , Universi ty of Alb erta, Edmonton, Albe rta, Canada 8. Divi sion of N eurolog y , Dep artment of Pediatrics, Sa inte-JusOne Uni versity H ospital Centre, Montréal, Québec, Canada 9. Neu roscience A dvanced Clinical Im aging Service (NACIS), Depa rtment of Neurosu rgery , The Royal Ch ildren’ s Hospital, Melbou rne, Austral ia 10. D ivision o f Neuro surgery, Department of Surgery, Sainte-JusOne Hospital C entre, Montré al, Québ ec, Cana da *Equal Contrib uOon, R ( :1=&%. #1+(-* 521+&2 #" Introduc@o n: ! "%I,*$6( ,'49%H9'S3'( T3%( #%"IF %9&,&4$'4( 95, 695&.( $* ;,9H9&( &9,:"%9( T%99# 3-( ,'( $5 5%3N,-$496.( U VW( 3T( 49-5 3%$6( 63A 9( 9 5,695&.( X=<@Y( *$&9&( $ '#( $%3"'#( Z[F\VW (3T(9N4%$49-53%$6(63A9(9 5,695&. P 1 (]'($#"6 4&/(,-5%3H9#(&9 ,:"%9(3"4*3-9& (,'(=<@(; $H9(A99'(6,'+9#(43(%9&9*S3 '&(4;$4(5%9*,& 96.(4$%I94(4;9(-9 &,$6(49-5 3%$6(63A9( &4%"*4"%9&/( $'#^3%( #,&*3'' 9*S'I ( 4;9 ( 49-53 %$6( 3"_6 3>( > ;,49( -$J9% ( 4%$*4&P 2.3 ( K3>9H9% /( 59 #,$4%,*( 95,695&.( #,`9%&( -$%+9#6.( T %3-( $# "64( 9 5,695&. /( >,4 ;( $( ;,I;9 %( ,'*,#9' *9( 3 T( *3%S *$6( - $6T3%-$S3'& ( $'# ( 9N4%$49-53%$6( T3*,/( -$+,'I ( 5%9#,* 43%&( 3T( &"%I,*$6( &" **9&&( 69&&( >9 66( #9? '9#P( a3%-$SH9( #,&*3''9 *43-9( ,&( $( #,`"&,3' ( 2B ]( 4%$*43I%$5;.(A$&9#(49*;',b" 9(4;$4(9&S-$49&(4;9(6,+96.(>;,49(-$J9%(#,&*3''9 *S3'& (*$"&9#(A.($(A%$,'(69&,3'(3%(&"%I,*$6(%9&9*S3 '(A.(-$55,' I(,4(3'43($(535"6$S3' F A$&9#( 4%$*43I%$5;.($46$&(#9%,H9# (T%3-(;9$ 64;.(,'#,H, #"$6&P 4 ( =;,&( &4" #.( $,-& ( 43 ( ,-5%3H 9( "'#9% &4$'# ,'I( 3T( &"% I,*$6( 3" 4*3-9( 5 %9#,*43 %&( ,'( 59# ,$4%,*( #% "IF%9&,&4$ '4( 95,695 &.( $'#( 43 ( ,# 9'4,T. ( > ;,49( -$ 449%( 5$4; >$.&( >; 3&9( #,&%"5 4,3'(-$.(,'T6"9 '*9(53&435 9%$4,H 9(&9,:"%9(%9*"%% 9'*9("&,' I($('3%-$4,H9(#,&*3 ''9*43 -9($55%3$ *;P(=;9(T,'#,' I&(>,66(,'T3%-(5%9F &"%I,*$ 6(56$'','I ($'#(&"553%4( -3%9($ **"%$49 (5%3I' 3&4,*(- 3#96,' I(,'(*; ,6#%9'P ( Metho ds: = ;,&( -"64,*9' 49%( , '49%'$ 4,3'$6 ( %94%3 &59*4 ,H9( & 4"#.( ,'*6"#9 &( 59# ,$4%,* ( 5$4,9' 4&( > ;3( " '#9%> 9'4( T%3'4$6/( 49-53% $6/( 3% ( ,'&" 6$%( 63A9( 95 ,695&. ( &"%I 9%.P( )%9F( $'#(53&4 359%$4 ,H9(=cF>9 ,I;49# (2B(,-$I9&($%9 ("&9#(43(-$'" $66.(#96,' 9$49(%9&9 *4,3'(*$H ,4,9&("&,' I(]=8F!aG )P 5 (=;9&9(69&,3 '(-$&+&($%9(4;9 '('3'F6, '9$%6.(%9I ,&49%9# ( 43($'($I9F&59 *,T,*(&4$'# $%#(A%$,'(49- 56$49(,'(23'4 %9$6(a9"%3 63I,*$ 6(]'&4,4"4,3 '(X2a]Y(&5$* 9("&,'I(G#H$' *9#(a3%- $6,:$4,3 '(=336&(XGa= &Y 6 /(9'$A6,'I ($**"%$49(*%3& &F &"AL9* 4( *3-5$ %,&3'P ( (=3( ,#9'4,T .(%9I,3'&($&&3*,$49#(>,4;(&9,:"%9(3"4*3-9& /( 9$*;(69&,3'(-$&+( , &(>9,I;49#(A.( 53 &4359% $4,H9(&9,:"%9(&4$4"&(43( I9 '9%$4 9( $(5%3A$A,6,&4,* ( :F&*3%9 (-$5( ,#9'4,T .,'I(%9 I,3'&($ &&3*,$ 49#(>, 4;(A944 9%(&9,: "%9(*3 '4%36P( ]'(5$%$6 696/('3%- $4,H9 (#,&*3'' 9*43- 9($'$6.& ,&(>$&(5 9%T3%- 9#("&,' I(;,I;F b"$6,4. (59#,$4% ,*(#,TT" &,3'(2B ](#$4$(T%3 -(4;9(K "-$'(0 3''9*4 3-9()%3 L9*4d C9H963 5-9'4 ( XK0)FC ( Z PV( %969$&9e( >?@A ( BC DBEBEF GBEHCI CJ YP 7 ( G ( I% 3"5F$H 9%$I9# ( # ,TT"&,3 'F>9,I ;49#( 49-56 $49( >$&( *%9$49#( "&,' I( G a=&/( $'#( $( '3%-$4,H 9( & 4%"*4" %$6( *3''9*4 3-9( >$&( I9'9%$4 9#( H,$( 5% 3A$A,6 ,&4,*( 4%$*43I% $5;.( >,4;( *3'&4%$ ,'9#( &5;9%, *$6( #9*3'H3 6"4,3'( X0!CY ( ,' ( 2B 4%,NfP 8 ( g3 %( 9 $*;( 5$4,9'4 /( 4; 9( 6 9&,3'( -$&+( >$&( 5%3L9* 49#( 3'43( 4;9('3 %-$4,H 9(*3'' 9*43- 9(43(9& 4,-$49 (6,+96.( >;,49( -$449% (#,&*3' '9*4,3 '&P( g,'$66. /(6,'9$%(%9I%9&&, 3'(-3#96&(>9%9 ("&9#(43($&&9&&($&&3*,$4 ,3'&(A94>9 9'(&59*,T,* (>;,49(-$449%(4%$*4(#,&*3 ''9*4 ,3'&($'#(&9,:"%9(3"4*3- 9&/(5%3H,# ,'I(,'&,I;4(,'43( &4%"*4" %$6(5$ 4;>$.& (4;$4(- $.(,'T 6"9'*9 (&"%I,* $6(&"** 9&&P( Result s: Q9($%9( *"%%9' 46.($*b",%,'I (,-$I,'I($'#(*6,',*$6(#$4$(T%3-(&,N(*9'49%& ($*%3&&(4;%99(*3'4,'9'4 &($'#(&9I-9'4,'I (5%9F($'#(53&4359%$4 ,H9(2B]&P(h"4*3- 9(#$4$( $%9(9N59* 49#(A9T3% 9(h*43A9% (ZVZ[P(g,I"%9 (c(&"--$%,& 9&(4;9(5%35 3&9#(,-$ I,'I(5%3*9 &&,'I(5,5 96,'9/("&, 'I($(*$&9(9N$- 569P(=;9(*$& 9(,&($'(iF.9$%F36# (A3.(>,4;(#%"I F %9&,&4$ '4(95,6 95&.(%9 T9%%$A 69(43($( %,I;4(T %3'4$6( 536.-, *%3I.%, $(>;3 ("'#9% >9'4($ '($'49 %,3%(T%3 '4$6(63 A9*43 -.P(K9( ;$#(&9 ,:"%9(%9 *"%%9' *9(f(.9 $%&(T366 3>,'I (&"%I9% .P( ( K#,*+%( BD()*L L-+' (1M(52% ("+1"1 &%/(.1 +L-N< %(/#&81. .%851L%(" +18%&&# .,(-./ (-.-$' &#&("#" %$#.%(#. (52#&(&5* /'( Conclu sion: ( !9,: "%9( 3"4* 3-9( 5%9# ,*4,3' (%9 -$,'&( $( *%,4 ,*$6( .94( *;$ 669'I,' I(I 3$6( ,'( *;,6# %9'( "'#9 %I3,'I (69 &,3'9* 43-.( T3%( T3 *$6( #%"IF%9& ,&4$'4( 95, 695&./( $&( &4$ '#$%# ( *6,',*$ 6( H$% ,$A69& ( 3T49 '( T$ 66( &; 3%4P( =;,&( & 4"#.( >,66( #9-3'& 4%$49( 4;9( 5 349'4,$ 6( 3T ( $( '3%-$4 ,H9( # ,&*3' '9*43- 9( $ 55%3$* ;( 43 ( ,#9 '4,T.( 5$4,9'4 &( $4( %,&+( 3T( 53 &4359%$ 4,H9( &9,:"%9 ( %9*"%%9 '*9P( j.( 69 H9%$I, 'I( 5"A6 ,*6.( $H$,6 $A69/( ;,I ;Fb"$6 ,4.( 4%$*43 I%$5; .( #$4$&9 4&/( 4;,&( -9 4;3#( 3T T9%&( $( 5%$* 4,*$6( $64 9%'$4,H 9( 43( $*b" ,%,'I( ;,I ;F%9&3 6"4,3' ( #,TT"&, 3'(2B ](#"%,' I(5%9&" %I,*$6 (>3%+" 5F$'($ 55%3$* ;(4;$4( ,&(3T49 '(49*;' ,*$66.($ '#(63I ,&4,*$66 .(,'T9$ &,A69( 3%(*;$6 69'I,' I(,'(%3 "4,'9(5 9#,$4%, *(95,69 5&.(*$ %9P( Refere nces 1. ( = 1 669:Fk9'49'3( Dg /( 94( $6 D( :* ++( O+%-5( ?"N1. &( 0%* +1$ P( ZV Vi( D" 6ecVX\Y lZ[fFmP ( ( 2. O$63H,*( 2 /( 94( $ 6P( PQRQ( 0%*+1$ P( Z Vcm( D"'( cenU XUYlUmV FnVVP( 3. ( O69,*; I9%%*;4( @/( 94 ( $6P( 0%*+1$ 1,' P( ZVZ Z(D $'( ccemiX ZYl9c\ cF9c[cP( @% %$4"-(,'l ( 0% *+1$1, ' P( ZVZf( D$' (fc ecVVX[ YlZU[P ( 4. ( =;, 9A$"4( #9 (!* ;3J9'( 2/( 94( $6P( 0-5* +%( 81LL* .#8-N1. & /(Z VZVe( ccXc Y/( [Vm\P( 5. ( M"&;+ 9H ,*;() G/(94( $ 6P( 0 %*+1#L -,% P(ZVVUe( fcXfYl(cccUFZiP( 6. ( GH$'4&( jj/(94( $6P( @.&#,25( P P(ZVVme(ZXfU[YlcFf[P(nP( !3- 9%H, 669( $"74/ ,4.&B /$* "7) 1 & 1 Dep artment of Neuro surg ery , King’ s Colle ge Hosp ital NHS Fo undatio n T rust, Lon don, Unit ed King dom 2 Dep artment of Neuroi maging, Ins titute o f P sych iatry , P sy chology an d Ne uro science , King’ s Col lege Lo ndon, Lon don, Unit ed Kingd om Intro duction. In "& $/4/7C & ,C6%;& D/& $/E.$ C/%& C#/& ",, .4)" C).7& .F& C#/& )7C/$#/<),E #/$)4& E$.E.$C).7 ,& .F& C#/& >$ .7C"(&',("7C &G $"4 C&2.(6< /,&D)C#& C#/&%/ 2/(.E.( (.D)7*& C#/,/& $/,6 (C,& D /& 7. D& /OC /7%/%& C#/& "7"(;,),& C.& "7.C#/$& $/("C /%& C$ "4CP& C#/& >$.7C .+IC$)"C"( +C$"4 C& K>IGL& E.$C).7& 4.77/4C )7*&C .&C# /&IJ '& Q /&/OE(.$ /%&)C,&$ .(/&)7&C#/&4()7 )4"(&.6C4 .$ .7C.+IC$)"C"(& C$ "4C&K>I GL& .F&H.C #& #/<),E#/$ /,&D ",&2)$C6 "((;& %),,/4C /%&6, )7*& G $"4= B),-& D)C#&3 \[,& (.4"C/%& .7& C#/& IJ'& "7%& 4"6%" C/& 764(/)N 3 & J/"7& 2.(6IG& %"C"& D/$ /& "7"(;,/ %& F.$& ",, .4)"C).7 ,&D)C#&F 674C).7"(&.6 C4.IG& )%/7C)_"H(/& .7& H.C#& #/<),E#/$ /,& E$/. E/$" C)2/(; -&K7VZ&# "%&7.&C$ "4C&$/4.7 ,C$64 C/%&.7&C#/&C6< .6$&,)%/ -&"7%&7VW&#" %&7.&4(/"$&C $"4C&)% /7C)_"H(/& .7&/)C#/$&#/<),E #/$/ N& &' ,&/OE/4C /%-&C#/& $/4. 7,C$64C/%&>I G ,& .7&C#/&C6<.6$&,)%/&D/$ /&,)*7)_4"7C(;&,<"( (/$& )7& 2.(6IG& .7& C#/& C6<.6$& ,)%/& #"%& #)*#/$& '?S& KIG & 2"(6/ ,& /OC$ "4C/%& "7%& E"C#.(.* )4"(& F/" C6$/,& .F& C#/& C6<.6$& KQ]\& *$"% /& "7%& [?]& <6C" C).7& ,C"C 6,L& .$& C#/& .7,/C & .F& IJ'& , ;7%$.IG & )7& C#/& 4.7C/ OC& .F& %)M6, /& *().<",& )72 "%)7*& C#/& IJ'& "7%& )%/7C)F;& <)4$ .,C$64C6$ "(& "(C/$ "C).7, & 4"6,/ %& H;& C#/& C6<. 6$ N& ^.& ",, .4)"C).7 ,& .F& E$/.E/$ "C)2 /& >IG& F/"C6$ /,& D)C# & 4()7)4"( & .6 C4.6$C#/$& ,C6%)/, &D)C#& "&("$ */$& 4.#.$C& .$&D) C#&E., C.E/$ "C)2/& C$ "4C.*$ "E#;& "7"(;,),& "$/& 46$$ /7C(;&.7& *.)7*&C.&F6((;&4.7_$<&C#/&("4=&.F& 4.7C$)H 6C).7&.F& C#/&>IG&C.&C#/&4()7)4"(&.6C4. 0 .5, with a mean DICE of 0. 61. Conclusions. Together, PhyberSIM and the cortical parcellatio n simulator offer a compr ehensive, con trolled validation frame work for fiber clustering and tracto graphy-based cortical parcellations alg orithms. These tools enable reproducib le experiments with k nown ground tr uth, provid ing valuable r esources for the dM RI tr actograp hy c ommunity. Fur ther imp rove ments, such a s adde d noise and flexibility on bundle c omplexity and configuratio n are planned fo r future wo rk. Referen ces 1. Basser, P. J., et al. (2000 ). Magn. Reson. Med., 44, 625–632. 2. Poo, E. et al. (2024) . Front. Neurosci., 18:1396518. 3. Poo, E. et al. (2025) . Submitted to Comp. in Biol. and Med. 4. Guevara, P. et al. (2012). NeuroImage, 61(4), 1083–1099. 5. Garyfallidis et al. (2012). Frontiers in Neuroscience 6, 175. 6. Vázquez et al. (2020). NeuroI mage, 220, 117070. 7. Vergara et. a l. (20 21 ) . IEEE E MBC 20 21 . Fig. 1: Schematic of a simulated bundle generated with PhyberSIM (tubular spline model) [2] . Fig. 3: QB and FFClust results for simulated tractography datasets with 100 bundles (I) and 500 bundles (II) for a distance of 10 mm. Fig. 4: Example of a simulated b undle generated from two cortical parcels. A) The simulated bundle. B) The simulated bundle (green) connecting a pair of parcels (blue) on th e cortical mesh.spline curves. Fig. 2: Schematic of the gen erator of a random cortical parcellation with its connections for tractography - based cortical parcellation validation [3]. Acknoledgments to ANID-Basal AFB240002 and FB210017 86 Principal Comp onen t Analysis of Di ! usion MRI and Magnetization T ransfer Metri cs Reveals Distinct Lesion Microstructure in Multiple Sclerosis E. Hernandez-Gut ierrez 1 , R. Coronado-Leija 3 , M. Edde 1 , M. Descoteaux 1 , 3 , M. Dumont 2 , JC. Houde 2 , M. Barako vic 5 , S. Magon 5 , A. Ramirez-Manzanares 4 1 Sherbro oke Connectivity Imaging Lab (SCIL), Departmen t of Computer Science, University of Sherbro oke, Sherbro oke, QC, Canad a; 2 Imek a Solutions I nc., Sherbro oke, QC, Canada; 3 Bernard and Irene Schw artz Center for Biomedical Imaging, Department of Radiology , New Y ork Universit y School of Medicine (NYU), New Y ork, NY, United States; 4 Centro de Investigaci´ on en Matem´ aticas A.C. (CI MA T), Department of Computer Science , Guana juato, GTO, Mexico; 5 Pharma Research and Early Developmen t, Neuroscience and Rare Diseases Ro che Innov ation Cen ter Basel, F. Ho ! mann-La Ro che Ltd., Basel, Switzerland INTR ODUCTION: Multiple sclerosis (MS) lesions exhibit heterogeneous microstructural changes that are not fully captured by individual imaging metrics. Adv anced d i ! usion MRI (dMRI) and quantitativ e magnetization transfer (MT) imaging provide complementary information on tissue integrit y and dem yelination [1]. How ever, the high dimensionalit y of these data complicates lesion characterization [2]. Visualizing data from MS lesion studies presents significant challenges due to the inherently multidimensional nature of the data. MS research typically inv olves large patien t cohorts, with multiple scans conducted per patient. Each scan reveals s ev eral lesions, each c haracter ized by multiple metrics. The complexity further increases when considering specific WM tracts, adding an additional dimension through the su bdivision of tracts into multiple sections. W e applied principal comp onent analysis (PCA) to reduce dimensionality and iden tify di ! erences in lesioned tissue across a cohort of MS patients. METHODS: Twen ty MS patients and tw ent y-six healthy controls (HC) underwen t five longitudinal MRI sessions each, including multi-shell dMRI, MT and T2-weigh ted fluid-attenuated inv ersion recovery (FLAIR) [3]. Each patient scan was pre-processed with T r actoflow [4], which included constrained spherical deconvolution (CSD) [5] and particle filtering tractography [6] to generate a tractogram. T ractograms were automatically segmented into ma jo r bundles using RecoBundlesX ( github.com/scilus/rbx_flow ). The multi-tensor model [7], with up to 3 tensors p er vo xel, was fitted to pre-pro cessed images using the M RDS framework [8] to obtain multi-tensor fixel-based metrics (fixel-AD, fixel-RD, fixel-MD, fixel-F A), including isotropic v olume fraction (ISOVF). The n umber of tensors per vo xel was determined using track orientation densit y imaging [9]. As fixel-based metrics provide multiple v alues p er voxel (one for each tensor), w e generated, for each segmented bundle, a metric map in which only the metric v alue from the tensor most closely aligned with the lo cal bundle direction w as assigned to the vo xel. The ihmt flow ( github.com/scilus/ihmt_flow ) w as emplo yed to extract MTsat and MTR metrics registered to di ! usion space. Lesions were segmented from T2-FLAIR images by Neur oX ( neurorx. com ) and lab eled individually with the Scilpy to ols ( github.com/scilus/scilpy ). F or each lesion in each session of each patien t, w e extracted the median v alue of each metric, resulting in a lesion-by-metric matrix (N lesions × 4 metrics: fixel-AD, fixel-RD, ISO VF, M Tsat), where N is the total count of lesions across the whole cohort. F or fixel-based metrics, computed p er-bundle metric maps w ere used to extract the median v alue for each lesion. Finally , PCA was p erformed to reduce the data to three principal components (PCs), follo wed by k-means clustering (k=3) to id entify lesion subgroups. RESUL TS: The first three PCs explained 87.9% of the v ariance. F eature loadings indicated that PC1 was primarily d riven by MTsat (0.63) and negatively by fixel-RD (-0.54), while PC2 w as dominated by fixel-A D (0.72). K-means clustering rev ealed three lesion groups; a cluster con taining degenerated tensor metrics was excluded. Figure 1 illustrates the spatial distribution and microstructural characteristics of the identified lesion clusters. Both clusters ex hibited the classic pattern of demy elination with increased fixel-RD and I SO VF, and reduced MTsat [1] compared with HC. Ho wever, lesions in cluster 2 demonstrated significantly highe r MTsat (3.07 ± 0.44; p = 0.23e-5) and lo wer ISOVF compared to cluster 1 (0.21 ± 0.05; p = 0.42e-4). Multi-tensor fixel-based metrics rev ealed that Cluster 1 and 2 lesions maintained higher fixel-AD (1.49 ± 0.2 ms /µ m 2 ; p = 1.34e-2) compared to HC. CONCLUSION: PCA of com bined di ! usion and MTsat metrics e ! ectiv ely distinguishes microstructural clusters in MS lesion, supp orted recent applications of unsupervised machine lea rning in MS [2]. The approach has limitations to di ! erentiate b etw een inflammation subtypes or betw een demy elination and inflammation. Unexp ected higher fixel-AD v alues in Cluster s 1 and 2 compared with HC maybe due to contamination of the fixel- based me trics by isotropi c contribution, as reported before [10]. Overall results suggest that, even among lesions with broadly comparable profiles, subtle but statistically significant microstructural di ! erences ex ist, p otentially reflecting v arying degrees of demyelination and tissue damage. Figure 1: Spatial distribution and microstructural characterization of MS lesion clusters identified through PCA analysis. (left) Axial, coronal, and sagittal views of a single patien t showing lesions colored according to cluster assignment (Cluster 1: cy an; Cluster 2: discarded; Cluster 3: blue) in four ma jor bundles (CC, CST, ILF, IFOF). Lesi ons are o verlaid on per-bundle fixel-F A map. (ri ght) Histograms comparing the distribution of key metrics between clusters: fixel-AD (axial di ! usivit y ), fixel-RD (radial di ! usivity), isotropic volume fraction (ISOVF), and MTsat. Clu ster 2 (cyan) exhibits higher MTsat v alues and lo wer fixe l-RD compared to Cluster 1 (blue), indicating better preserved my eline. Clusters 1 and 2 demonstrates characteristic pattern of demy elination compared with healthy con tr ols (HC: green). All metric distributions show statistically significant di ! erences b etw een clusters (p < 0.001). References: [1] M. Filippi et al. (2000) [2] E. Mart ´ ınez-Heras et al. (2020) [3] M. P . W attjes et al. (2015) [4] G. Theaud et al. (2020) [5] J.-D. T ournier et al. (2007) [6] G. Girard et al. (2014) [7] D. S. T uch et al. (2002) [8] R. Coronado-Leija et al. (2017) [9] E. Hernandez-Guti errez et al. (2023) [10] E. Hernandez-Gutierrez et al. (2024) 87 Hybridization Strategies for Robust B rain T ractography Jes ´ us Mart ´ ınez-Miranda, → , 1 Gabriel Girard, 2 and Alonso Ram ´ ırez-Manzan ares. 1 1 Dep artment of Computer Scienc e, Centr o de Investigaci´ on en Matem´ aticas A.C., Guanajuato, M´ exic o. 2 Dep artment of Computer Scienc e, Universit´ e de Sherbr ooke, Sherbr o oke, Canada. → jesus.martinez@cimat.mx In tro duction. T ract ograph y is a technique to estimate connectivit y path wa ys b etw een brain regions using di ! usion-weigh ted magnetic resonance imaging. Despit e adv ances in tractograph y , existing met ho ds contin ue to face challenges in reliably reconstructing di ! erent bundles in t he brain [1]. Metho ds. As in many problem-solving scenarios, the hybridization from the best metho ds allows us to dev elop a nov el approac h that takes adv antage of their most robust characteristics. Parallel T ransp ort T r actograph y (PTT) [2] is a streamline propagation approach kno wn for pro ducing geometrically smo oth curves through its framework with a lo cal spatial supp ort. P art icle Filtering T ractography (PFT) [3] reduces the n umber of streamlines that prematurely terminate in white mat ter or cerebrospin al fluid b y using maps of anatomical information. PFT uses a tra jectory correction (backtrac king) allo wing streamlines to reac h gra y matter. Flo cking T r actograph y (FT) [4] generates streamlines using the collective b eha v ior of a group of particles that comm unicate and correct their tra jectories through sp atial information exchange. In this w ork, w e implemented FT within the DIPY soft ware library [5]. The FT’s new implementation allows comparing and con trasting the p erformance of the three state-of-the-art metho ds ab o v e, as w ell as hybridize them, combining PTT and PFT algorithms (PTT-PFT), and FT and PTT algorithms (FT-PFT). The t wo hybrid methods follo w their original directi on selection strategies, while also using the PFT b ac ktracking correction-strategy when a trac king prob lem preven ts the particles to con t in ue mo ving, for instance when a streamline en ds in CSF. T o ev aluate their p e rformances, w e used the synthetic phantoms from the DiSCo Challenge 2021 (DiSCo) [6] and the ISMRM T ractography Challenge 2015 (ISMRM) [1]. F or the DiSCo phan tom, signal noise was added with SNR of 5, and a single b-shell of 3094 with only 30 b-vectors was used to sim ulate clinical conditi ons. F or each phantom, the o ” cial scoring met rics from eac h c hallenge are used as follo ws. F or the DiSCo data, w e compute the P earson correlation co e ” cient ( r ) betw een the estimated and ground-truth (GT) connectivity matrices [6]. F or the ISMRM data, w e compute the p ercentage of v alid c onnections (VC), the av erage p ercentage of volumetric o verlap (OL) and ov erreach (OR) p er bundle [1]. Moreov er, for both phantoms, we ev aluated the volumetric Dice co e ” cient ov er the bundles [7]. All metho ds used the same Fib er Orien tation Distributions (FODs) [5]. Performances of the DIPY probabilistic tractography metho d [5] are shown as reference. Results and Conclusion. T ables 1 and 2 rep ort the quan ti tativ e results (b est scores highligh ted in b old) on the DiSCo and ISMRM dataset, resp ectively . Figure 1 shows examples of the tra jectories re co vered for the Corticospinal T ract (CST) bundle of the ISMRM dataset. Both the Figure and T ables show that the hybridized prop osals reco ver a greater p ortion of GT v olume than the standalone metho ds. The PFT backtrac king improv es v alid connections and o verlap with the GT, but also increases ov erreach. This suggests a trade-o ! b etw een cov erage and precision, whic h future w ork will aim to optimize. The hybrid PTT-PFT method stands out in particular, as it achiev es the b est corre lation p erformance in DiSCo, and v alid connections and volumetric ov erlap in ISMRM. REFERENCES. [1] Maier-Hein, K. H., et al. Nat. Commun. 2017 ; [2] Aydogan, D. B., Shi, Y. IEEE T r ans. Me d. Imaging 2021 ; [3] Girard, G., et al., Neur oImage 2014 ; [4] Aranda, R., et al., Me d. Image Anal. 2014 ; [5] Garyfallidis, E., et al., F r ont. Neur oinform 2014 ; [6] G irard et al., Neur oImage 2023 . [7] Rheault, F., et al. Hum. Br ain Mapp. 2020 . Probabilistic PTT FT Probabilistic PTT-PFT FT-PFT PFT GT Figure 1: ISMRM dataset CST from di ! erent tractography metho ds. Individual metho ds on top, hybrid methods in the middle. F rom T ables 1 and 2, PTT-PFT p erforms b est. T able 1: T ractogram correlation with the GT connectivity matrix of the DiSCo dataset. Best v alues in b old font. Metho d r Dice Probabilistic 0.818 0.636 Probabilistic-PFT 0.835 0.619 PTT 0.850 0.648 PTT-PFT 0.856 0.603 FT 0.846 0.642 FT-PFT 0.850 0.601 T able 2: V alid Connection (VC), V olumetric ov erlap (OL), Ov er- reac h (OR) and volumetric Dice of the di ! erent metho ds on the ISMRM dataset. Best v alues in b old font. Metho d V C (%) OL (%) OR (%) Dice Probabilistic 54.89 51.74 24.42 0.593 Probabilistic-PFT 61.89 69.22 34.23 0.658 PTT 64.47 59.6 2 28.59 0.605 PTT-PFT 65.61 72.33 45.06 0.556 FT 56.11 54.9 8 25.64 0.598 FT-PFT 63.15 67. 20 31.98 0.642 88 Clinica l-ComBAT: To wards Flexib le Harm onization of W hite Matter m easures in C linical Diffus ion MR I Mano n Edde 1 , Gab riel Girard 1 , Feli x Dum ais 1 , Yoa n David 1 , Max ime Desc oteaux 1,2 , Pier re-Marc J odoin 1,2 1 Unive rsité de S herbr ooke, QC , Canada, 2 Imek a Solution s inc, QC , Canada. INTRO DUCTIO N. ComBAT 1 is a widely used neuroim aging harmonization method that corrects scanner-re lated effects while preserving biological signa ls. While it’s effectiv e in a controlled research context, its assump tions (linear covaria te effects, homogene ous populations, and full data access) limit its use in clinical practice . In real-life situation s involving diverse patients, continuo us data collect ion and continually evolving imaging centers, the usual approac h of aligning data to an average site become s inappropriate. Further more, ComBAT' s linear model struggles to handle no nlinear patterns, such as age-r elated ch anges in diffusion im aging-de rived measures. Th is can introduce residua l bias, wh ich is particularly problem atic when harm onizatio n is used to support no rmative modellin g, diagnosis or the m onitoring of dis ease progress ion. METHO D. We intro duce Clinical-Co mBAT , a novel harmon ization method specifica lly designed to meet the constra ints enc ountered in rea l-life clinical environ ments. It incorpo rates three key innovation s: (1) site-s pecific harmon ization , where each site is aligned to a fixed referen ce dataset, allowing new clinical sites and patient data to be ad ded incremental ly. Clinica l-ComBAT uses informe d priors from the refer ence site to enhance th e robustn ess of paramet er estim ation, particula rly variances and slopes, enabling good performa nce to be maintained even with a low number of subjects; (2) polynom ial modelin g of covaria tes such as age, to better capture the non-line ar relatio nships between these variables and imaging measures; (3) a robust variance estimation framew ork adapted to limited sample sizes, as well as an index of harmon ization quality using the Bhattachar yya distanc e (BD). Clinic al-ComBAT was evaluate d on Diffusion Weighted Images (DWI) from T he National Institute of Mental H ealth 2 (NIMH, n=119), and the Cambridg e Centre for Ageing Neuros cience 3,4 (CamCAN , n=4 41). All datasets were process ed with the TractoFlow 5 pipeline. DTI scalar maps, Fraction al Aniso tropy (F A) and Mean Diffusivity (MD), were derived from b-values <1200 s/mm². The apparent fiber density map (AFD) was obtain ed from the fiber Orien tation Distribu tion Functio n ge nerated using a spherical harmon ics order of 8 and a standardized respon se function 6 . All measur ements were regis tered in MN I spac e, and the average scalar values for 42 white matter bundles were extract ed using the streamlin e density map and the IIT Hum an Brain Atl as 7 (v5.0). We compa re the harmonizat ion perform ance of Clinical-Co mBAT versus ComBAT using the Bhattachary a distance (BD). The NIMH w as used a s a moving site , and the Cam CAN dat aset is used as a fixed referen ce site . T he moving site data sets have been split into trainin g and testing d atasets. RESUL TS. Using a modif ied version of the CamCAN data, Figure 1(a) shows that compared with the ComBAT method , Clinical-Co mBAT corrects additiv e, multiplic ative, and slope biases more accura tely without causing data overfitt ing . Clinical-Co mBAT a lso demo nstrates a more ac curate alignmen t of the moving sit e distribu tion with th at of the reference site. This is evident from the consist ent improvemen t in harmonizatio n quality observe d across all bundles and scalar maps (BD decrea se, Fig. 1b). Clinical -ComBAT also stands out for its ability to genera lize harmon izations to new subjects (green percentiles) and age groups that were not observed during the training subjects (green dots) (Fig. 1c). Finally, this method remains robus t even when the number of healthy subjects available per site is low ( Fig. 1d ). CONCL USION. Clinical-ComB AT tackles the limitations of tradition al harmoniz ation methods by adapting to the dynamic and heteroge neous nature of clinical imaging workflows. By decoupling harmonizat ion from centralized cohort structur es and adopting non -linear modelling, it enables scalabl e and reprod ucible harmoniza tion tailored to clinical translat ion. This approach paves the way for robust multi-site integratio n of diffusion MRI into routine care, ultimately improvi ng earl y detec tion an d follow-up of br ain diseases. REFER ENCES. 1. Fo rtin, e t al. N euroim age 1 61 (20 17): 1 49-170, 2. Nu gent, et al. Scienti fic Da ta 9.1 (2022) : 518. , 3. S hafto e t al. BMC neurolo gy 14 (201 4): 1-25, 4. Ta ylor et al. Ne uroima ge 144 (201 7): 262-2 69., 5. Thea ud, G. et al. Ne uroIma ge 218, 116 889 (202 0)., 6. Desc oteaux et al. M agnetic Reson ance in Medici ne 58 (2 007), 7 . Qi and Konsta ntinos Neuroim age 2 25 (202 1): 117 462. 89 Ti tle: V ariability of white matter activat ion pathways for conne ctomic targeting in subcallosal cingulate deep brain st imulati on Authors : Ha Neul Song , Helen S. May berg, K i Sueng Choi Intr oduction The subcallo sal cingulate deep brain stimulatio n (SCC DBS) has shown effi cacy in treating treatment-res istant depress ion (TRD). Recent develo pment of conn ectomic targe ting has shifted the focus from a focal tar get to a multi- node n etwork target w ithin the SCC. Th e SCC is inter connect ed with other brain regions t hrough white m atter (WM) bundles, and recent studies reported that stimul ation of all connections is necessary for a clinical response. Connec tome-ba sed sur gical tar geting of SCC DBS relies on individual structural connectiv ity analysis to maximi ze the activation of critic al WM bundles: c ingulum bundle, forceps minor , and subcortica l j unction. H owever , norm ative connect ome data-based individual patient tar get selec tion was suggested d ue to the limitations of the clinical environm ent in collectin g high spatial and angular diffus ion-we ighted data, and the convenience of selecting a persona lized SCC tar get, nece ssitating de fining individual diffusion data fo r each c ase. Th is study explored in ter - and intra-su bject variabilities of WM activatio n pathway s in SCC targ ets using 100 subjects’ human connec tome data to investig ate connectome -based t ar geting a ccuracy . Methods Whole brai n tractogra phy was performed usin g FSL probtractx2 toolbox on hum an connect ome data (HC P; n=1000) using a p robabilistic stim ulation m ap seed (Figur e 1, Left : x = -9, y = 28, z = -6, Rig ht: x = 7, y = 29 , z = -4, ra dius = 3 mm), which is derived from bilateral volume s of tissue activated (VT As) of 47 TRD patient s with given patient- specific stimulatio n settings (amplitude and contact configuratio n) and the difference in patients’ Hamilto n Depression Rating Scale (HAMD -17) using Lead DBS software. Correlation coefficie nt values were used to measure the inter- subject sim ilarity in each crit ical W M bundle. Furthermo re, intra-subject simila rity (spatial similarity) was measured in each critical WM bundle while the seed was moved in (1) superior -inferior , (2) anterior -posterior , and (3) medial- lateral d irections. Results W e found low inter -subject similarity in the cingulum bundle compared to others (p < 0.001). Spatia l similarity analysis demonstrate d a low similarity when the seed was moved in the medial-late ral axis (0.56 ± 0.14), wher eas high spa tial similarity w as obser ved with movem ent in the ante rior -posterior axis (0.84 ± 0.1 1; p < 0 .001, Fig ure 2). Conclus ions Our findi ngs supp ort the importance of patient-speci fic targetin g using individual connectivity profiles. Identi fying SCC targets using normative data may compromise treatment efficac y due to low inter -subject similarity . Spatial similarit y results emphasize the nece ssity of delivering a precise targ et identification due to the large variability of WM act ivation pathways in me dial-late ral directions. Figur e 1. Left and Ri ght SCC seeds. Seeds w er e derived from 47 TRD patien ts who u nderwe nt bilate ral SCC DBS. Figur e 2. Inter- and Intra-subject similarity . The cingu lum bundle shows lower similarity compar ed to others in intersub ject similar ity an alysis. Intra- subject simil arity (spatial simil arity) shows vulnerability to seed locati on in the medial-l ateral dir ection, wh ile r obustness in th e anterior-p osterior dir ection. Left SCC T arg et (X = -9, Y = 28 , Z = -6) Right SCC T arg et (X = 7, Y = 29, Z = -4) 90
Original Paper
Loading high-quality paper...
Comments & Academic Discussion
Loading comments...
Leave a Comment