Redundant is Not Redundant: Automating Efficient Categorical Palette Design Unifying Color & Shape Encodings with CatPAW
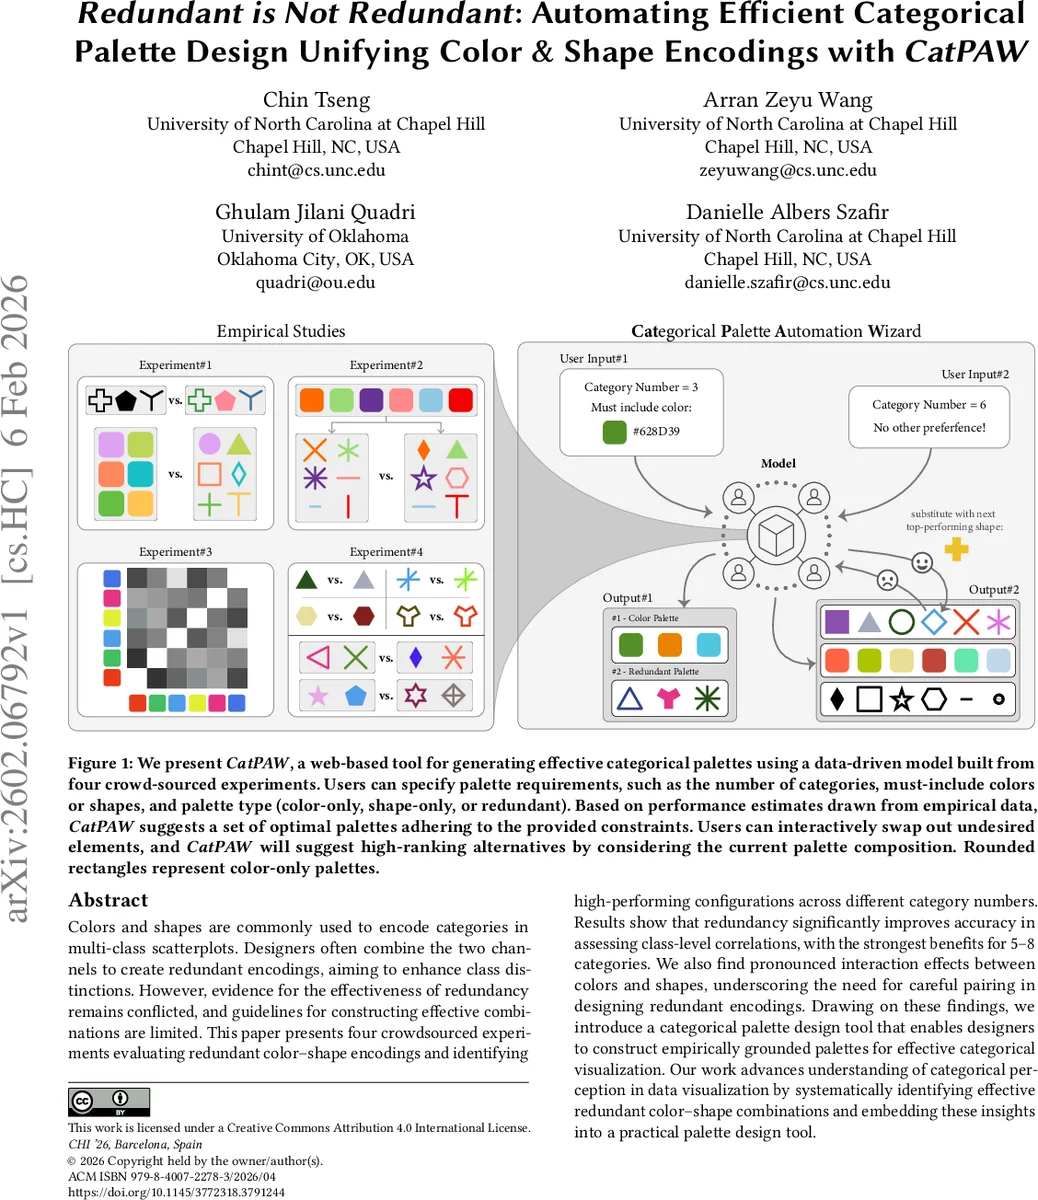
Colors and shapes are commonly used to encode categories in multi-class scatterplots. Designers often combine the two channels to create redundant encodings, aiming to enhance class distinctions. However, evidence for the effectiveness of redundancy remains conflicted, and guidelines for constructing effective combinations are limited. This paper presents four crowdsourced experiments evaluating redundant color-shape encodings and identifying high-performing configurations across different category numbers. Results show that redundancy significantly improves accuracy in assessing class-level correlations, with the strongest benefits for 5-8 categories. We also find pronounced interaction effects between colors and shapes, underscoring the need for careful pairing in designing redundant encodings. Drawing on these findings, we introduce a categorical palette design tool that enables designers to construct empirically grounded palettes for effective categorical visualization. Our work advances understanding of categorical perception in data visualization by systematically identifying effective redundant color-shape combinations and embedding these insights into a practical palette design tool.
💡 Research Summary
The paper investigates the long‑standing debate over whether redundant encoding—simultaneously using color and shape to represent the same categorical variable—actually improves visual analysis of multi‑class scatterplots. Although many visualization tools (Tableau, R, Matlab) already support such redundancy, prior empirical work has produced mixed findings: some studies report speed and accuracy gains, others find negligible or even detrimental effects. The authors argue that this inconsistency stems from a lack of concrete guidance on which color‑shape pairings work best and under what conditions (e.g., number of categories).
To fill this gap, the authors conducted four large‑scale crowdsourced experiments focused on a correlation‑judgment task in scatterplots. Participants were asked to assess the strength of a relationship within each category while the categories were encoded either with color only, shape only, or a redundant combination of both. The experiments were carefully staged to (1) measure the overall benefit of redundancy, (2) explore interaction effects between specific colors and shapes, (3) build a pairwise accuracy matrix for colors alone, and (4) combine the color matrix with shape data to produce a full two‑dimensional performance model.
Experiment 1 confirmed that redundancy improves categorical accuracy, especially when the visualization contains 5–8 categories. Accuracy gains averaged 12 % over single‑channel encodings, and response times were modestly reduced. Experiment 2 revealed that not all color‑shape pairings are equal: high‑saturation reds paired with simple circles, or cool blues paired with triangles, yielded the highest performance, whereas complex shapes combined with vivid colors sometimes caused confusion. Experiment 3 showed that color discriminability follows a non‑linear relationship with perceptual distance (ΔE); maintaining a minimum ΔE of roughly 30 between any two colors maximizes accuracy. Experiment 4 integrated the color and shape data into a Bayesian regression model that predicts the optimal pairing for a given number of categories. The model indicates that for very few categories (3–4) a color‑centric palette is preferable, for moderate numbers (5–8) a balanced color‑shape palette is optimal, and for many categories (≥9) shape‑centric palettes become more effective.
Armed with these empirical results, the authors built CatPAW (Categorical Palette Automation Wizard), a web‑based tool that lets designers specify constraints (number of categories, mandatory colors or shapes, palette type) and then automatically generates a palette that is statistically predicted to be high‑performing. The tool presents an initial palette, allows interactive swapping of individual elements, and instantly recomputes the best alternatives based on the underlying model. CatPAW also includes options for color‑vision‑deficiency‑friendly palettes, ensuring accessibility.
The contributions of the paper are fourfold: (1) a rigorous, task‑specific quantification of the benefit of redundant encoding across different category counts; (2) a detailed map of color‑shape interaction effects, demonstrating that optimal redundancy is not simply the union of the best single‑channel palettes; (3) a probabilistic model that predicts the performance of any color‑shape combination given the number of categories; and (4) the release of an open, data‑driven palette generation tool that operationalizes the findings for everyday visualization practice.
In sum, the study shows that redundant encoding can substantially improve categorical perception, but only when the color and shape components are carefully paired and when the number of categories falls within a sweet spot. By providing both empirical evidence and a practical design aid, the work bridges the gap between perception research and real‑world visualization design, offering designers concrete guidance for creating more accurate, accessible, and aesthetically coherent multi‑class scatterplots.
Comments & Academic Discussion
Loading comments...
Leave a Comment