Quantum capacitance and parity switching of a quantum-dot-based Kitaev chain
An array of quantum dots coupled via superconductivity provides a new platform for creating Kitaev chains with Majorana zero modes, offering a promising avenue toward topological quantum computing. In this work, we theoretically study the quantum capacitance of a minimal Kitaev chain weakly coupled to an external normal lead. We find that in the open regime, charge stability diagrams of quantum capcaitance can help to identify the sweet spot of a Kitaev chain, consistent with tunnel spectroscopy. Moreover, the quantum capacitance of a single quantum dot coupled to Andreev bound states reveals the interplay between two distinct parity switching mechanisms: coupling to an external normal lead and intrinsic quasiparticle poisoning. Our work provides useful physical insights into the quantum capacitance and parity dynamics in a quantum-dot-based Kitaev chain device.
💡 Research Summary
In this paper the authors present a comprehensive theoretical study of the quantum capacitance (QC) of a minimal Kitaev chain realized with two gate‑defined quantum dots (QDs) that are coupled through Andreev bound states (ABS) in a proximitized superconducting segment. The work is motivated by recent experimental progress in fabricating two‑ and three‑site Kitaev chains in semiconductor‑superconductor hybrids, where the identification of the “sweet spot”—the parameter regime in which Majorana zero modes are robust—remains a central challenge. While tunnel spectroscopy has been the primary diagnostic tool, the authors argue that QC, defined as the second derivative of the many‑body energy with respect to a gate voltage, offers a complementary, highly sensitive probe of the underlying ground‑state curvature and parity dynamics.
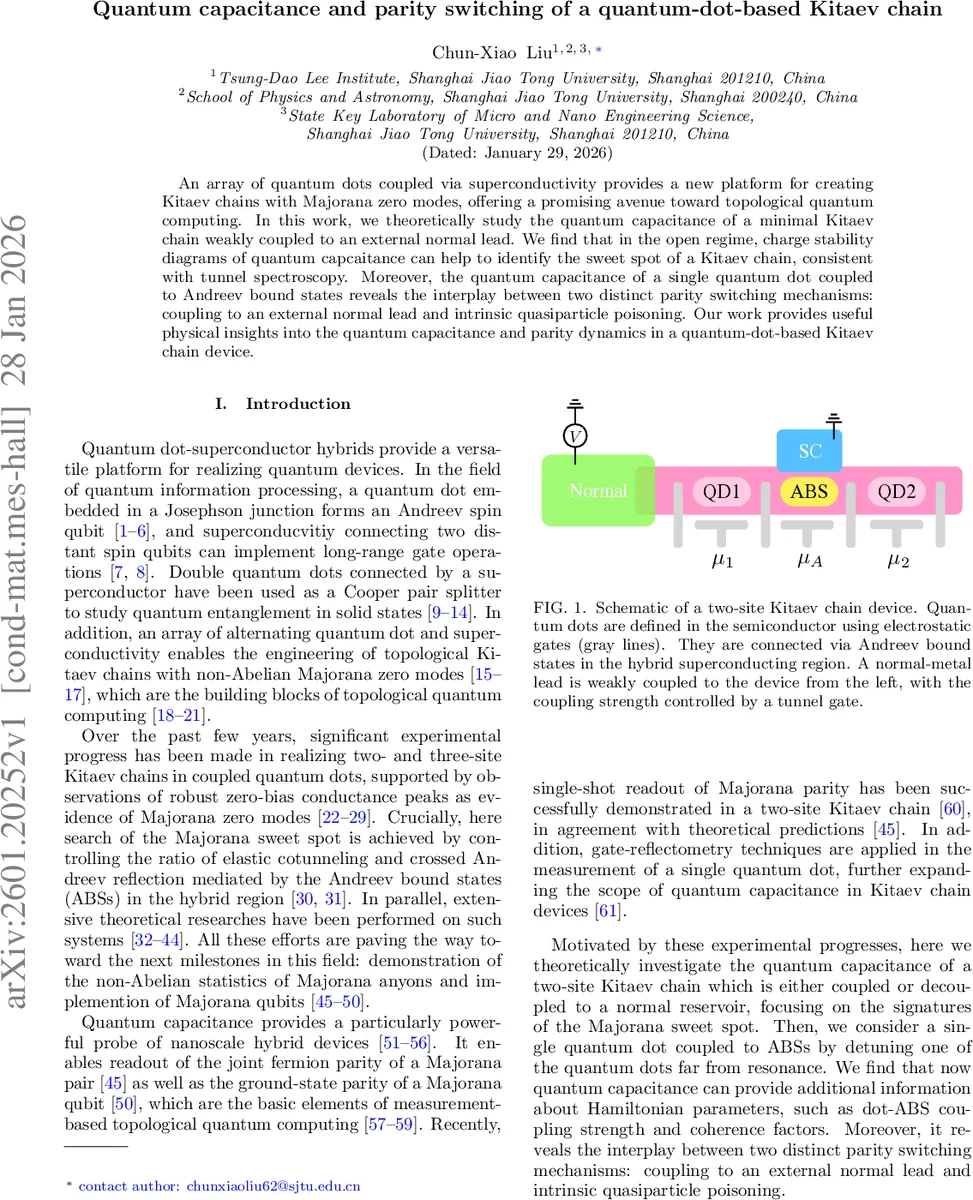
The model Hamiltonian consists of three parts: (i) the dot Hamiltonian H_D, containing the dot chemical potentials μ_i, Zeeman splittings E_Zi (assumed equal and large enough to render the system effectively spinless), and on‑site Coulomb repulsion U_i; (ii) the ABS Hamiltonian H_A with a single s‑wave pairing amplitude Δ_0 (set to unity as the energy unit) and a normal‑state chemical potential μ_A; (iii) a tunneling term H_tunn that includes both spin‑conserving (t_sc) and spin‑flipping (t_sf) amplitudes, the latter arising from spin‑orbit coupling in the hybrid region. An external normal lead is coupled weakly to QD1 via a tunnel amplitude t_c, giving rise to a lead‑dot rate γ_lead.
To capture non‑equilibrium effects the authors solve a semiclassical master equation for the occupation probabilities {P_α} of the many‑body eigenstates |α⟩. Transition rates Γ_{β←α} contain three contributions: (1) single‑electron tunneling (SET) to/from the lead, which flips the total fermion parity; (2) quasiparticle poisoning (QPP) that also flips parity but originates from spurious excitations in the superconductor; (3) intra‑parity relaxation, which brings the system from an excited to a lower‑energy state without changing parity. The rates are expressed in terms of the Fermi function, the bias voltage V, and phenomenological parameters γ_lead, γ_qpp, and γ_relax. Once the steady‑state distribution is obtained, the differential conductance G = dI/dV and the average quantum capacitance ⟨C_q⟩ = –∑_α P_α ∂²ε_α/∂μ_1² are evaluated.
The analysis proceeds in two regimes. In the “open” regime (γ_lead ≫ γ_qpp,γ_relax) the lead dominates the dynamics, forcing the system into the global ground state. By sweeping the ABS chemical potential μ_A the authors map out conductance and QC stability diagrams. When normal tunneling (t_sc) dominates (μ_A = –1), the conductance lines cross along the μ_1 = μ_2 diagonal; when crossed‑Andreev processes dominate (μ_A = 0), the crossing rotates to the μ_1 = –μ_2 diagonal. At an intermediate value μ_A ≈ –0.725 the two couplings balance, producing a characteristic “crossing” pattern in the conductance and a small diamond‑shaped QC peak at the centre of the charge‑stability diagram. This configuration corresponds to the Majorana sweet spot. An effective 2×2 Hamiltonian for each parity sector reproduces the numerical results: the QC peaks scale as Δ′²/
Comments & Academic Discussion
Loading comments...
Leave a Comment