Placenta Accreta Spectrum Detection using Multimodal Deep Learning
Placenta Accreta Spectrum (PAS) is a life-threatening obstetric complication involving abnormal placental invasion into the uterine wall. Early and accurate prenatal diagnosis is essential to reduce maternal and neonatal risks. This study aimed to de…
Authors: Sumaiya Ali, Areej Alhothali, Sameera Albasri
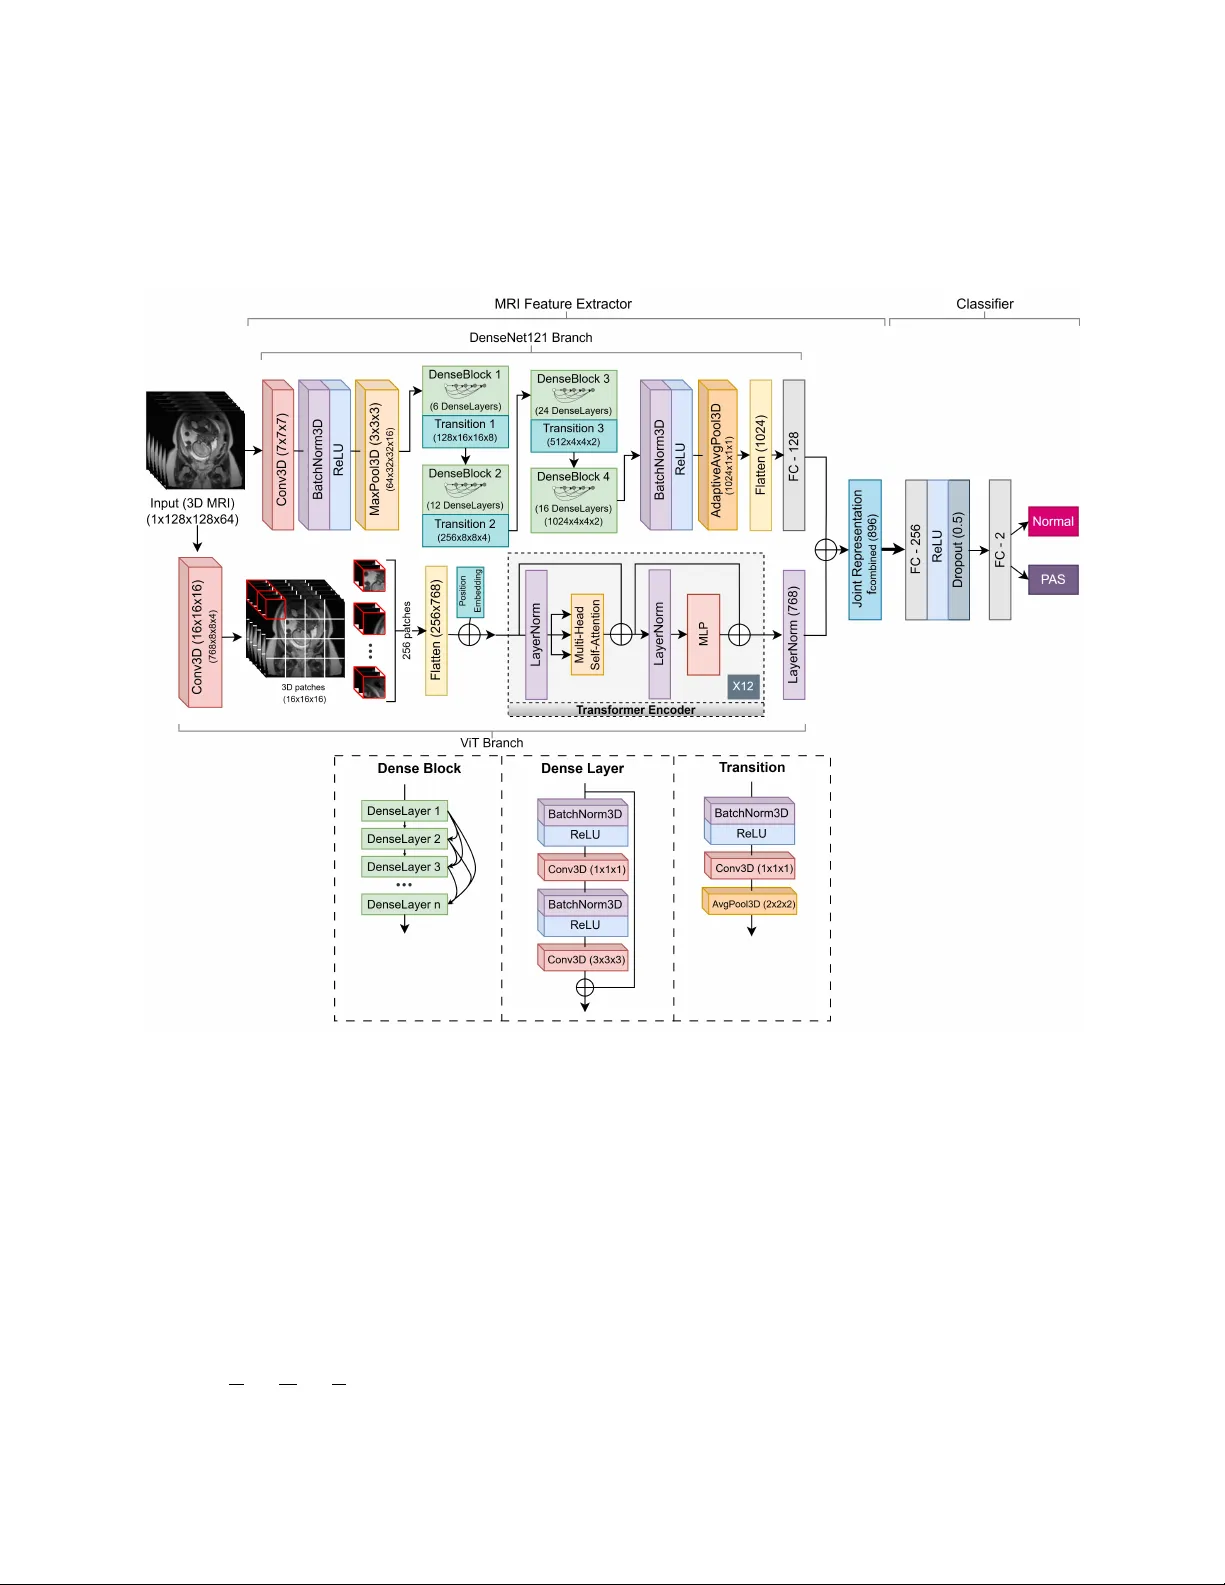
Placenta Accreta Spectrum Detection using Multimodal Deep Learning Sumaiya Ali 1* , Areej Alhothali 1* , Sameera Albasri 2* , Ohoud Alzamzami 1 , Ahmed Abduljabbar 3 , and Muhammad Alw azzan 3 1 Department of Computer Science, Faculty of Computing and Information T echnology , King Abdulaziz Uni versity , Jeddah, Saudi Arabia 2 Faculty of Medicine, King Abdulaziz Uni versity , Jeddah, Saudi Arabia 3 Department of Radiology , King Abdulaziz Uni versity Hospital Jeddah, Saudi Arabia * sali0174@stu.kau.edu.sa, aalhothali@kau.edu.sa, salbasri@kau.edu.sa Abstract Placenta Accreta Spectrum (P AS) is a life-threatening obstetric complication in volving abnormal placental in vasion into the uterine wall. Early and accurate prenatal diagnosis is essential to reduce maternal and neonatal risks. This study aimed to de velop and v alidate a deep learning frame work that enhances P AS detection by integrating multiple imaging modal- ities. A multimodal deep learning model was designed using an intermediate feature-lev el fusion architecture combining 3D Magnetic Resonance Imaging (MRI) and 2D Ultrasound (US) scans. Unimodal feature e xtractors, a 3D DenseNet121-V ision T ransformer for MRI and a 2D ResNet50 for US, were selected after systematic comparative analysis. Curated datasets comprising 1,293 MRI and 1,143 US scans were used to train the unimodal models and paired samples of patient-matched MRI-US scans was isolated for multimodal model de velopment and ev aluation. On an independent test set, the multimodal fusion model achie ved superior performance, with an accuracy of 92.5% and an Area Under the Receiv er Operating Charac- teristic Curve (A UC) of 0.927, outperforming the MRI-only (82.5%, A UC 0.825) and US-only (87.5%, A UC 0.879) models. Integrating MRI and US features provides complementary di- agnostic information, demonstrating strong potential to enhance prenatal risk assessment and improv e patient outcomes. K eywords: Placenta Accreta Spectrum, Deep Learning, Multimodal Learning, Magnetic Reso- nance Imaging, Ultrasound 1 Intr oduction The Placenta Accreta Spectrum (P AS) is a complex and life-threatening condition in which the placenta attaches too deeply to the uterine wall. The incidence of P AS has been steadily increasing, 1 primarily due to the increase in cesarean section deliv eries and the associated uterine scarring. It is estimated that the incidence has more than doubled ov er the past fe w decades [1], with a 2022 study reporting a prev alence of 13.32 per 1000 births in Saudi Arabia [2]. P AS poses significant risks during pregnanc y and childbirth, including sev ere maternal hemorrhage, infection, the need for in vasi ve procedures such as emergenc y hysterectomy , and increased maternal morbidity and mortality [1]. The underlying mechanisms of P AS are still not fully understood [3] and no reliable protein markers ha ve been identified to date [4]. Early and accurate detection of P AS is crucial for timely intervention and optimal manage- ment of affected pregnancies [1]. T raditional diagnostic methods in volv e a combination of clinical e v aluation, biochemical markers, Ultrasound (US) imaging, and Magnetic Resonance Imaging (MRI) [5]. Ho wev er , these methods often require subjecti ve interpretation and can hav e limita- tions in accurately predicting the e xtent and sev erity of placental in v asion. The comple xity of P AS requires a multidisciplinary approach; howe ver , the integration of data and expertise from various fields to combine the results of different tests and imaging methods in order to provide a timely and accurate diagnosis remains a challenge [6, 7]. This can lead to delayed or inadequate management that increases maternal and fetal complications [7]. Giv en these challenges, artificial intelligence (AI), especially deep learning, has become a promising objecti ve way to improve the diagnosis and clinical decisions in P AS. Deep learning models, particularly con volutional neural networks (CNN), ha ve sho wn remark- able capabilities in learning intricate patterns and features from complex medical images including detection of P AS from dif ferent data sources [8]. Ne vertheless, limitations still exist where tra- ditional machine learning and deep learning models often rely on a single modality such as US images or MRI to make predictions. This unimodal approach can result in the loss of rele v ant information that could otherwise improv e diagnostic performance. New innov ati ve deep learning models hav e been de veloped that use multiple modalities for detection and classification in v ari- ous medical diagnostic tasks [9 – 11]. Research sho ws that multimodal learning can improv e the performance of unimodal learning [8]. T raining deep learning models on extensi ve and hetero- geneous datasets composed of both US and MRI images enables the dev elopment of robust and accurate algorithms for P AS detection [7]. Ho we ver , current research on P AS detection using mul- timodal deep learning frameworks that combine the complementary strengths of dif ferent imaging modalities remains limited. Recent studies hav e mostly focused on single imaging modalities, particularly MRI, which is often considered superior to US when US findings are inconclusi ve [12]. Some studies [13, 14] demonstrated that radiomic features from T2-weighted imaging (T2WI) sequences of MRI could predict P AS with high accurac y , while subsequent studies combined both radiomic and deep fea- tures [15, 16]. Peng et al. [16] presented a deep learning radiomics model using MRI that e xtracted radiomic features via transfer learning with MedicalNet, achie ving 0.861 A UC and 75% accu- racy on an independent test set and 0.852 A UC on external v alidation. More recent approaches employed segmentation networks (e.g., nnU-Net) combined with deep classifiers, achie ving Area Under the Recei ver Operating Characteristic Curves (A UC)s abov e 0.86 and accuracy 84.3% that outperformed radiologists [7]. Xu et al. [17] fused T1-weighted imaging (T1WI) and T2WI se- quences of MRI features using a dual-path neural network, achie ving 82.5% accurac y , demonstrat- ing the potential of multi-sequence MRI data integration. Compared to MRI, fewer studies hav e explored US-based detection, despite its accessibil- ity and cost-eff ecti veness, due to operator dependence and lo wer sensiti vity [18, 19]. A recent 2 study [20] dev eloped machine learning models using texture features from 2D US images, re- porting stable cross-validation accuracies of 83.0% and 88.7% for classical and linear classifiers including the reported 92.3% and 87.2% test results. Furthermore, radiomic features and k-nearest neighbors classification approaches hav e achiev ed over 80% accuracy [18], while deep dictionary learning and placental thickness analysis using US have also shown promise [19, 21]. Beyond imaging, sev eral studies have in vestigated clinical and biochemical predictors of P AS. Shazly et al. [22] built predicti ve models for hemorrhage risk using multicenter clinical data, while Y AS ¸ AR et al. [4] applied machine learning to plasma proteins, identifying potential biomarkers. While these prior works ha ve explored single-modality data, very few hav e examined P AS detection using multimodal approaches. Y e et al. [23] combined MRI and clinical data using en- semble learning, b ut applied only decision-lev el (late) fusion, achieving improved performance (A UC 0.857) ov er unimodal models. Zhu et al. [3] combined MRI radiomics and clinical variables using nnU-Net segmentation and logistic regression, achieving A UC 0.849, outperforming radiol- ogists (A UC 0.744). In other domains, multimodal deep learning has been applied successfully . Holste et al. [10] sho wed that intermediate feature fusion of breast MRI and clinical data improved diagnostic accuracy (A UC 0.898); Y an et al. [11] integrated pathological images with clinical fea- tures for breast cancer classification, achie ving 92.9% accuracy; and V enugopalan et al. [9] fused MRI, genetic data, and clinical tests for Alzheimer’ s disease diagnosis, with multimodal models consistently outperforming unimodal ones. Existing work demonstrates that deep learning, particularly CNN-based approaches, outper - forms traditional machine learning in P AS detection. Howe ver , most studies remain modality- specific, rely on manual segmentation, and/or use limited datasets. While prior work has com- bined imaging with clinical data using late-fusion or ensemble methods [3, 23], and multimodal deep learning has pro ven effecti ve in other medical domains [8], the dev elopment and v alidation of an end-to-end, feature-le vel fusion model combining US and MRI imaging for P AS detection remains a critical, unaddressed research gap [24, 25]. This gap motiv ates the approach presented in this work. The main motiv ation behind this study is to increase the accuracy and reliability of P AS de- tection by taking advantage of deep learning and multimodal data to help healthcare practition- ers make informed decisions and deliv er appropriate prenatal care. Inte grating data from various sources will enable a more detailed vie w of a patient’ s condition, enhance diagnostic accuracy , and potentially reduce false positi ves and ne gati ves [7]. Therefore, this study dev elops a multimodal deep learning model that uses an intermediate feature fusion method to identify P AS from a curated dataset of 1,293 MRI and 1,143 US images. The contributions of this study include the dev elopment of a dual-modality dataset of P AS and control cases incorporating both MRI and US images; the dev elopment of a multimodal deep learning model trained on this dataset for automated P AS detection; a comprehensiv e e valuation of the model’ s performance using accuracy , precision, recall, and other relev ant metrics; and a comparati ve analysis demonstrating the advantages of the proposed multimodal approach ov er corresponding unimodal models. 3 2 Methods 2.1 Data Collection A retrospecti ve cohort of patients’ data, collected in collaboration with the Department of Fetal Medicine at King Abdulaziz Univ ersity Hospital, was used in this study . All patients’ data were collected and used in accordance with institutional guidelines and ethical standards. Ethical ap- prov al was secured prior to the start of the study , and strict measures were taken to ensure patient confidentiality and compliance with data pri v acy regulations. A preliminary revie w of the health records in the hospital rev ealed a high proportion of patients who had been assessed with suspected P AS disorders. After applying rigorous inclusion criteria to select cases with confirmed diagnostic outcomes and suf ficient image quality for computational analysis, the initial data comprised 1,293 T2WI MRI scans and 1,143 US images. Figure 1 presents a fe w examples of the MRI and US collections, with the MRI displaying a single slice of the 3D scan. On MRI, P AS is commonly identified by intraplacental dark bands, interruption of the myometrial border and abnormal vas- cularity (Figure 1B), where as non-P AS cases sho w smooth uninterrupted utero-placental surface (Figure 1A). On US, P AS cases (Figure 1D) often present prominent irregular spaces of v arious sizes in placenta kno wn as placental lacunae, thinning of myometrial thickness and loss of retro- placental clear space, while non-P AS image retains a uniform placental appearance and intact retroplacental zone (Figure 1C). The multimodal image pairs (Figure 1E-F) further highlight the complementary diagnostic information provided by MRI and US for distinguishing P AS-positiv e and non-P AS cases [12, 26]. The data collection was intended to represent a wide range of patients, both confirmed P AS and Normal (non-P AS), to dev elop robust and generalizable deep learning models that can perform accurate diagnosis in a clinical en vironment. Figure 1: Example of non-P AS MRI (A), P AS-positi ve MRI (B), non-P AS US (C), P AS-positiv e US (D), non-P AS multimodal pair (E), and P AS-positiv e multimodal pair (F). 4 2.2 Data Pr eparation and Prepr ocessing After the initial data collection, three separate datasets were created: a unimodal MRI dataset (1,133 scans), a unimodal US dataset (983 scans), and a paired multimodal dataset (160 pairs) in which each sample pair consists of an MRI scan and an US scan of the same patient. The unimodal datasets were kept larger than the multimodal dataset. Large unimodal datasets are essential for training deep feature extractors capable of learning the comple x patterns associated with P AS from a single imaging modality . Then a smaller , high-quality paired dataset can be used for the final, more nuanced task of data fusion. This hierarchical approach allows the study to first maximize the kno wledge extracted from large volumes of modality-specific data before learning the relationships between the modalities in a more focused, patient-matched data. A standardized, modality-specific preprocessing pipeline was implemented for all images to ensure data consistency , normalized intensity distributions, and an appropriate format for input to deep learning models. 2.2.1 MRI Prepr ocessing Raw 3D MRI was stored in the Digital Imaging and Communications in Medicine (DICOM) for- mat in the form of 2D slices. These DICOM series were con verted to the Neuroimaging Informat- ics T echnology Initiativ e (NIfTI) format, which combined the indi vidual 2D slices into a single 3D volumetric file suitable for 3D CNNs. T o eliminate variability arising from different scan orienta- tions, the axes of each 3D volume were rearranged to a standard (height, width, depth) order . All volumes were resized to a fixed dimension of 128 × 128 × 64 vox els using cubic interpolation, with padding applied as needed to maintain original aspect ratio. Finally , the maximum voxel in- tensity for each scan was identified and the intensities were normalized to a floating-point value in the range 0 to 1 using min-max scaling. This spatial standardization is a prerequisite for batch processing in deep learning models with fixed-size input layers (see Figure 2) [26]. Figure 2: Preprocessing pipeline for standardizing MRI scans. [26] 2.2.2 Ultrasound Prepr ocessing The 2D US images were processed through a dif ferent pipeline (see Figure 3). Pix el intensities were first normalized using a min-max scaler and rescaled to 8-bit integers in the range 0 to 255. The single-channel grayscale images were then conv erted to a three-channel RGB format and resized to a resolution of 224 × 224 pixels, which is a standard input format for man y of the pretrained CNN models e v aluated in this study . Figure 3: Preprocessing pipeline for standardizing US images. 5 2.3 Data Distrib ution and A ugmentation The splitting of these datasets was performed using stratified sampling to ensure that the original class distribution was preserved across the training, v alidation, and test sets, thus prev enting sam- pling bias. Dif ferent split ratios were used to accommodate the varying sizes and specific analytical purposes of the datasets. This stage also included data augmentation and modeling strategies to address the class imbalance e vident in the datasets, such as o versampling and class weighting dur - ing model training, aimed at pre venting model bias to wards the majority class. T able 1 details the distribution of P AS (labeled 1) and Normal (labeled 0) cases across the training, v alidation, and test sets for the unimodal MRI, unimodal US, and paired multimodal datasets. 2.3.1 Unimodal MRI Dataset In the case of the unimodal MRI analysis, 1,133 distinct 3D MRI T2WI scans were chosen. There was a se vere imbalance of classes in this dataset, as 853 scans were of the type Normal and 280 scans were P AS. The dataset was split into a training set (70%; n = 793), a validation set (10%; n = 113), and a hold-out test set (20%; n = 227). 2.3.2 Unimodal US Dataset The unimodal US dataset was dev eloped using a sample of 983 distinct 2D US scans. There was also a class imbalance in this dataset, as there were 676 scans of Normals and 307 scans of P AS. The data was di vided in a training set (n = 687) and a validation set (n = 99) and a test set (n = 197), follo wing the same 70:10:20 split ratio. 2.3.3 Multimodal Dataset A smaller sample size of 160 paired samples was isolated from the larger MRI and US sample collections to de velop and test the multimodal fusion model. Each sample in this data set consists of an MRI and a US scan of the same patient, so the anatomy of the two modalities is directly matched. This patient-lev el matching is essential for the model to acquire the complementary diagnostic information of each modality . The distribution of classes consisted of 100 Normal pairs and 60 P AS pairs. A distinct split ratio was adopted for this smaller dataset. The data was split into 60% for training (n = 96), 15% for v alidation (n = 24), and 25% for testing (n = 40). A higher percentage of data was selected for the test set to focus on a more statistically sound estimate of the o verall generalization performance of the final model, which is critical when testing models on smaller datasets. 2.3.4 Data A ugmentation T o minimize the risk of o verfitting and deal with imbalances in classes, a set of data augmentation methods was used in the training sets of the unimodal datasets. In the case of the MRI dataset, data augmentation and oversampling of the minority class (P AS) were used to deal with the class im- balance in the training set. P AS samples were synthetically oversampled from 196 to 597 samples to obtain a final balanced training set of 1,194 volumes. The geometric transformations that were 6 T able 1: Dataset distribution across training, v alidation, and test sets. Dataset Class T raining Set V alidation Set T est Set T otal Unimodal MRI Normal (0) 597 85 171 853 P AS (1) 196 28 56 280 T otal 793 113 227 1133 Unimodal US Normal (0) 473 68 135 676 P AS (1) 214 31 62 307 T otal 687 99 197 983 Multimodal Normal (0) 60 15 25 100 P AS (1) 36 9 15 60 T otal 96 24 40 160 performed on the 3D MRI volumes were random flips along the height and width axis, random rotation (90°, 180°, 270°) and random zoom (factors 1.1-1.3). In the case of the US data training set, augmentations were random horizontal flips and ran- dom rotations in a continuous range of ±10 degrees. Class imbalance was solved algorithmically using class weights during loss computation. This method puts a heavier penalty on misclassifica- tion of samples belonging to the minority class (P AS), which causes the model to better learn its distinguishing characteristics. 2.4 Deep Learning Model Ar chitectures In order to determine whether fusion can enhance the prediction of P AS, unimodal baseline mod- els are initially de veloped. It in volv ed a systematic search through different state-of-the-art deep learning architectures to find the most successful feature e xtractors of each modality . Each imag- ing modality was ev aluated on these architectures. The primary strate gy consisted of fine-tuning models that were pretrained on lar ge scale public data to take advantage of their po werful, e xisting feature extraction properties, therefore enhancing performance and reducing the amount of train- ing data needed. The resulting selected unimodal models in this process guided the de velopment of a nov el multimodal fusion model. 2.4.1 MRI F eature Extraction Model In the case of the volumetric MRI data, six 3D architectures were explored. These included pure CNN 3D ResNet18 [27], 3D DenseNet121 [28] and 3D EfficientNet-B0 [29]; hybrid models like 3D DenseNet121 with 3D V ision T ransformer (V iT) and 3D ResNet18 with 3D Swin trans- former [30]; and a pure transformer model, the 3D Swin transformer [31]. T o reduce ov erfitting, regularization techniques such as dropout layers were incorporated [26]. V arious dropout rates in the range of (10%-50%) were examined for the 3D DenseNet121-V iT and 3D ResNet18. The optimal dropout rates were found to be 50% for 3D DenseNet121-V iT and 10% for 3D ResNet18. The 3D ResNet18 model was pretrained using the MedicalNet [26, 32]. Follo wing the comparati ve analysis detailed in Results section, the hybrid 3D DenseNet121- V iT architecture was selected as the feature extraction backbone for the MRI data. The simplified structure of the selected MRI model is shown in Figure 4. The hybrid 3D DenseNet121-V iT model 7 has two parallel modules of DenseNet121 and V iT that takes MRI volumes as input before fusing their extracted features for joint processing. The 3D MRI inputs are denoted as X ∈ R C × H × W × D , where H is height = 128, W is weight = 128, D is depth = 64 and C is channel dimension = 1 (grayscale). Figure 4: The selected MRI model architecture of 3D DenseNet121-V iT . [26] DenseNet121 Branch : The DenseNet121 branch extracts high-lev el local features through densely connected con volutional layers. The initial feature extraction stage applies a 3D con volu- tional layer (Con v3D) to capture low-le vel spatial features while performing downsampling. For the input volume X , the Con v3D operation is defined as in equation (1), where X conv ( i, j, l , f ) rep- resents the acti vation at spatial coordinates ( i, j , l ) for the f th feature map, σ denotes the Rectified Linear Unit (ReLU) acti v ation function, s is stride, W ( m, n, p, c, f ) denotes the learnable weight of the filter at the local kernel position ( m, n, p ) for the c th input channel and f th output feature map and b f is the bias term for the f th feature map. The kernel W has a spatial size of K × K × K with K = 7 . By utilizing a stride of s = 2 , the layer reduces the spatial dimensions of the input X by half ( H 2 × W 2 × D 2 ) , outputting 64 feature maps. The batch normalization (BatchNorm3D) and ReLU acti v ation function normalizes the outputs and applies non-linearity . 8 X conv ( i, j, l, f ) = σ C X c =1 K − 1 X m =0 K − 1 X n =0 K − 1 X p =0 X ( i · s + m, j · s + n, l · s + p, c ) · W ( m, n, p, c, f ) + b f ! (1) The max-pooling layer (MaxPool3D) further reduces spatial dimensions by half with equation (2), where, X max ( i, j, l , c ) is the do wnsampled output v alue for the c th channel at coordinates ( i, j, l ) , the indices m, n, p represent the spatial coordinates within the window , while k = 3 and s = 2 denote the pooling kernel size and stride, respecti vely . The max operation chooses the maximum v alue within the defined window . This process results in a final output of volume ( H 4 × W 4 × D 4 ) , which is (32 × 32 × 16) for each of the 64 feature maps, before being passed into the dense blocks. X max ( i, j, l , c ) = max 0 ≤ m,n,p 1 in order to reduces spatial size and increase channels. While identity blocks preserves size and channels and only learns features. 11 x ′ = σ ( F ( x ) + h ( x )) (18) I res = σ ( F ( x ′ ) + x ′ ) (19) The output I res from the last residual layer (7 × 7 × 2048) passes to an adapti ve av erage pooling (Adapti veA vgPool2D) layer (equation (20)) that reduces the 7 × 7 feature maps to 1 × 1 by av eraging each channel to single v alue ( z ). A FC layer maps the resulting flattened 2048-dimensional feature vector to 2 output classes (P AS and Normal) with softmax to produce the probabilities (equation (21)). z c = 1 H · W H X i =1 W X j =1 I res ( i, j, c ) (20) ˆ z = Softmax ( FC 2048 → 2 ( z )) (21) Figure 5: The selected US model architecture of 2D ResNet50. 2.4.3 Multimodal Intermediate Fusion Architectur e Building upon the unimodal feature extractors, an intermediate fusion architecture (also known as feature-le vel fusion) w as de veloped to inte grate the information from both MRI and US modalities. This approach was chosen ov er early (input-le vel) or late (decision-lev el) fusion as it provides a balance between feature div ersity and model complexity . The architecture is designed to identify and learn from the complementary relationships between the high-le vel abstract features e xtracted from each modality . This process computationally mirrors the diagnostic process of a multidis- ciplinary clinical team, where the findings of a sonography expert are combined with the MRI findings of a radiologist to arri ve at a unified diagnosis. The model architecture was designed to replicate this combination of abstract clinical signs. 12 The o verall architecture of the proposed multimodal intermediate fusion model is illustrated in Figure 6. The multimodal fusion model was constructed as follo ws: 1. F eature Extraction: The fine-tuned unimodal MRI and US models served as the parallel feature extraction branches. As sho wn in Figures 4 and 5, all layers in the MRI and US Feature Extractor blocks were retained, while the unimodal classifiers were removed. Their weights were left unfrozen to allo w for end-to-end fine-tuning where the unimodal branches do further learning of features that are complementary to each other . 2. F eature V ector Generation: For a gi ven patient’ s paired MRI and US scans, each scan was passed through its respectiv e feature extractor to generate high-dimensional feature v ectors that numerically represent the most important diagnostic information from each imaging modality . The MRI feature extractor generated 869-feature vector ( f mri ) and the US gener- ated 2048-feature vector ( f us ). 3. F eature Fusion: The feature vector extracted from the MRI scan and the feature vector from the corresponding US scan are concatenated to form a single, unified feature vector: f f used = f mri + f us . This joint representation contains a rich, complementary blend of information from both modalities. 4. Classification: The fused v ector is then passed to an MLP which consisted of two FC dense layers. It compresses the fused features, learns complex non-linear relationships between the MRI & US features, regularizes, and outputs a probability for classification. The fusion model uses the ReLU activ ation function, follo wed by a dropout layer with a rate of 30% for regularization. The final output layer is a single-neuron FC layer with a sigmoid activ ation function, producing the binary prediction Y for the presence or absence of P AS: Y = Sigmoid ( FC 2944 → 128 → 1 ( f f used )) (22) Figure 6: The proposed multimodal architecture. 13 2.5 Experimental Setup and T raining All experiments were performed in the PyT orch and MON AI [36] framework. The data were di vided into training, v alidation and testing sets with stratified sampling to make sure that the data of one patient was not included in more than one set. 2.5.1 T raining Hyperparameter The training protocols and hyperparameter settings such as batch size, weight decay , and layer freezing strategies were systematically v aried to identify the optimal configuration for each modal- ity . The Adam optimization algorithm was used consistently across all e xperiments for its adaptiv e Learning Rate (LR) capabilities and robust performance in deep learning tasks. A default initial LR of 1 × 10 − 4 was used for all models. A ’ReduceLR OnPlateau’ LR scheduler was utilized to adjust the LR by reducing it when a monitored metric, such as validation loss, stops improving, facilitating a more stable con ver gence to an optimal solution. Cross-Entropy Loss was chosen as the loss function for the unimodal models and Binary Cross-Entrop y loss was employed for the multimodal model. A regularized version of the loss function with a label smoothing factor of 0.1 was used for the US model only for performance improv ement due to higher noise observed in US imaging compared to MRI. Dropout w as applied before the final FC layer with rate 0.5 for the MRI model and 0.3 for the multimodal model to mitigate overfitting. The optimal batch size for the giv en data sizes was found to be 8. Models were trained for an extensi ve number of epochs (ranging from 50 to 200) to ensure full con vergence. The weights of the model were restored from the epoch with the highest accuracy on the validation set for final e valuation on the test set. The optimized hyperparameters used in the proposed approach are presented in T able 2. For the V iT in the hybrid 3D DenseNet121-V iT architecture, ke y hyperparameters included a patch size of 16x16x16, an embedding dimension of 768, 12 attention heads and transformer layers. T able 2: Hyperparameters and their optimized values used in the proposed approach. Hyperparameters MRI model US model Multimodal model Optimizer Adam Adam Adam Initial LR 0.0001 0.0001 0.0001 LR scheduler ReduceLR OnPlateau ReduceLR OnPlateau - Loss function Cross Entrop y Cross Entropy Binary Cross Entropy Label Smoothing - 0.1 - Dropout rate 0.5 - 0.3 Batch size 8 8 8 Epoch 100 200 100 Split ratio 70:10:20 70:10:20 60:15:25 2.5.2 Model Selection and Evaluation Throughout the training process, model performance w as continuously ev aluated on the validation set after each epoch. The set of network weights that achie ved the highest v alidation accuracy w as sav ed. This saved checkpoint represents the model at its peak performance on unseen v alidation 14 data. It was then used for the final unbiased ev aluation on the held-out test set. This standard practice ensures that the reported performance metrics are a true reflection of the model’ s ability to generalize to new data and are not influenced by overfitting to the training set. Each model was trained and ev aluated in 5 independent runs and the av erage performance across 5 runs was recorded. This result is a more stable and realistic estimate of ho w the model will perform in general. A repeated-measures Analysis of V ariance (ANO V A) followed by Benjamini–Hochberg False Discov ery Rate (FDR) corrected post-hoc paired t-tests was conducted to show statistical signif- icance of performance differences among the MRI-based models ( p < 0 . 05 ) and the US-based models ( p < 0 . 05 ). The model with the highest mean accuracy and A UC was selected as the backbone feature extractor for the multimodal model. 2.6 Final Comparativ e Evaluation Pr otocol T o ensure a fair and direct comparison, a standardized ev aluation protocol was implemented. Three distinct models were e v aluated on the same held-out multimodal test set of 40 paired samples. This approach allows comparison between the best-performing standalone unimodal models (trained on larger datasets) and the final fusion model, which lev erages the pretraining and is fine-tuned on the smaller paired dataset. The three models compared are as follows: 1. Unimodal MRI : This is the top-performing MRI-based 3D model that was fully trained on the lar ge unimodal MRI dataset (n = 793). Its performance on the 40 test MRIs serves as the baseline for what is achie v able with MRI alone. 2. Unimodal US : This is the top-performing US-based 2D model that was trained on the large, 687-sample unimodal US dataset. Its performance on the 40 test US images serves as the baseline for US alone. 3. Multimodal Fusion Model : This model employed the architectures from the best-performing unimodal experiments as feature extraction backbones. Their weights were initialized from the respectiv e unimodal training runs on the lar ger datasets. These weights were left un- frozen and the entire fusion model was trained and v alidated end-to-end on the 120 paired samples. This allowed both branches to be further fine-tuned for extracting complementary features optimized for multimodal fusion. The final performance of the model was ev aluated on the 40 paired sample test set. 2.7 P erf ormance Evaluation Metrics The diagnostic performance of the final selected models on their respecti ve test sets w as ev aluated using a comprehensi ve set of standard metrics for binary classification tasks. T o conduct the qual- itati ve analysis of model errors, a confusion matrix was created in each of the experiments.The confusion matrix giv es a clear account of the classification results, which tabulates the true posi- ti ves (TP), true negati ves (TN), false positi ves (FP), and false negati ves (FN). The key performance indicators were: 15 • Accuracy: The proportion of total predictions that were correct. Accur acy = T P + T N T P + T N + F P + F N • Pr ecision (Positiv e Predictiv e V alue): The proportion of positi ve predictions that were actually correct. It helps reduce false positi ves. P r ecision = T P T P + F P • Recall (Sensitivity): The proportion of actual positi ve cases that were correctly identified by the model. It helps to minimize false neg ati ves. Recal l = T P T P + F N • F1-Scor e: The harmonic mean of precision and recall, providing a balanced measure of both false positi ves and false ne gati ves. F 1 - S cor e = 2 × ( P r ecision × R ecal l ) P r ecision + Recal l • Ar ea Under the Receiver Operating Characteristic Curve (A UC-R OC): A measure of the model’ s ov erall discriminativ e ability across all possible classification thresholds. A UC- R OC quantifies the overall performance of the model in a range of 0-1 where 1.0 signifies a perfect classifier , while an A UC of 0.5 indicates performance no better than random chance. 3 Results The unimodal and multimodal deep learning models were ev aluated on their respecti ve held-out test sets. The performance metrics were statistically analyzed and compared to find if there are significant dif ferences between the multimodal fusion model and the single-modality models. 3.1 Unimodal MRI Model P erf ormance A set of e xperiments was conducted to identify the optimal architecture and training configuration for P AS classification using 3D MRI data. Among the v arious models tested, the Densenet121-V iT hybrid architecture yielded the best ov erall performance on the hold-out test set of 227 samples. This model achiev ed an a verage accuracy of 84.3% and an A UC of 0.842. The best run for the model had an accuracy of 85% and an A UC of 0.862. The confusion matrix for the best run sho wed that it correctly identified 144 out of 171 normal cases and 49 out of 56 P AS cases in the test set. Among the other architectures, the pretrained ResNet18 and DenseNet121 performed well (accuracy ∼ 80%), while the rest resulted in lo wer performance, with test accuracies ranging from 62% to 70%. T able 3 presents the summary of performances from each MRI model. Figure 7 sho ws 16 the Recei ver Operating Characteristic (R OC) curves for the best run of each model, highlighting dif ferences in sensiti vity and specificity across models. T o ev aluate the significance of the observed performance differences, repeated measures ANO V A across the six models, follo wed by post-hoc paired t-tests with FDR correction was conducted. It sho wed that DenseNet121-V iT outperformed all other models ( p < 0 . 05) . DenseNet121 and ResNet18 also performed significantly better than Ef ficientNet-B0, ResNet18-Swin, and Swin- T ransformer , while no significant differences were found between DenseNet121 vs ResNet18 and ResNet18-Swin vs Swin-T ransformer ( p > 0 . 05) . T able 3: Performance metrics of unimodal 3D MRI model architectures. Best results in bold. [26] Model Accuracy (%) A UC Precision Recall F1-Score DenseNet121-V iT DenseNet121-V iT DenseNet121-V iT 85.0 ( 84 . 3 ± 1 . 3 ) 85.0 ( 84 . 3 ± 1 . 3 ) 85.0 ( 84 . 3 ± 1 . 3 ) 0.862 ( 0 . 842 ± 0 . 012 ) 0.862 ( 0 . 842 ± 0 . 012 ) 0.862 ( 0 . 842 ± 0 . 012 ) 0.799 ( 0 . 790 ± 0 . 013 ) 0.799 ( 0 . 790 ± 0 . 013 ) 0.799 ( 0 . 790 ± 0 . 013 ) 0.859 ( 0 . 842 ± 0 . 013 ) 0.859 ( 0 . 842 ± 0 . 013 ) 0.859 ( 0 . 842 ± 0 . 013 ) 0.818 ( 0 . 808 ± 0 . 014 ) 0.818 ( 0 . 808 ± 0 . 014 ) 0.818 ( 0 . 808 ± 0 . 014 ) DenseNet121 82.8 ( 79 . 5 ± 2 . 0 ) 0.804 ( 0 . 766 ± 0 . 026 ) 0.770 ( 0 . 732 ± 0 . 023 ) 0.802 ( 0 . 764 ± 0 . 025 ) 0.783 ( 0 . 743 ± 0 . 024 ) ResNet18 80.2 ( 79 . 3 ± 1 . 3 ) 0.829 ( 0 . 783 ± 0 . 028 ) 0.759 ( 0 . 738 ± 0 . 018 ) 0.832 ( 0 . 781 ± 0 . 030 ) 0.772 ( 0 . 750 ± 0 . 018 ) ResNet18-Swin 71.3 ( 70 . 0 ± 1 . 9 ) 0.644 ( 0 . 600 ± 0 . 029 ) 0.629 ( 0 . 599 ± 0 . 028 ) 0.642 ( 0 . 604 ± 0 . 031 ) 0.634 ( 0 . 601 ± 0 . 029 ) Swin-T ransformer 72.7 ( 69 . 0 ± 2 . 8 ) 0.592 ( 0 . 548 ± 0 . 029 ) 0.608 ( 0 . 552 ± 0 . 034 ) 0.585 ( 0 . 546 ± 0 . 028 ) 0.591 ( 0 . 548 ± 0 . 030 ) EfficientNet-B0 64.8 ( 62 . 8 ± 1 . 7 ) 0.692 ( 0 . 604 ± 0 . 047 ) 0.596 ( 0 . 573 ± 0 . 018 ) 0.622 ( 0 . 592 ± 0 . 023 ) 0.593 ( 0 . 569 ± 0 . 019 ) Note: V alues are reported as Best (Mean ± Standard De viation) over fi ve independent runs. Figure 7: R OC comparisons of 3D MRI models. [26] 3.2 Unimodal US Model P erf ormance For the 2D US image classification, sev eral established CNN architectures were e valuated. The ResNet50 model emerged as the best performing, achieving an av erage accuracy of 86.9% and an A UC of 0.856 with the best run accuracy of 89.3% and an A UC of 0.889. The confusion matrix re vealed that on the best run, this model correctly classified 123 of the 135 normal cases and 53 of the 62 P AS cases in the test set. Other models, including ResNet18 and EfficientNet, also showed 17 strong performance, with accuracies reaching up to 88%. T able 4 presents the summary of the performances from each US model. Figure 8 presents the R OC curv es of the best-performing runs for each US model. T able 4: Performance metrics of unimodal 2D US model architectures. Best results in bold. Model Accuracy (%) A UC Precision Recall F1-Score ResNet50 ResNet50 ResNet50 89.3 ( 86 . 9 ± 1 . 7 ) 89.3 ( 86 . 9 ± 1 . 7 ) 89.3 ( 86 . 9 ± 1 . 7 ) 0.889 ( 0 . 856 ± 0 . 022 ) 0.889 ( 0 . 856 ± 0 . 022 ) 0.889 ( 0 . 856 ± 0 . 022 ) 0.874 ( 0 . 847 ± 0 . 020 ) 0.874 ( 0 . 847 ± 0 . 020 ) 0.874 ( 0 . 847 ± 0 . 020 ) 0.883 ( 0 . 855 ± 0 . 021 ) 0.883 ( 0 . 855 ± 0 . 021 ) 0.883 ( 0 . 855 ± 0 . 021 ) 0.878 ( 0 . 850 ± 0 . 019 ) 0.878 ( 0 . 850 ± 0 . 019 ) 0.878 ( 0 . 850 ± 0 . 019 ) EfficientNet-B0 88.3 ( 85 . 9 ± 2 . 2 ) 0.869 ( 0 . 839 ± 0 . 027 ) 0.862 ( 0 . 836 ± 0 . 025 ) 0.871 ( 0 . 837 ± 0 . 029 ) 0.866 ( 0 . 836 ± 0 . 027 ) ResNet18 87.3 ( 85 . 1 ± 1 . 4 ) 0.859 ( 0 . 821 ± 0 . 028 ) 0.854 ( 0 . 831 ± 0 . 015 ) 0.851 ( 0 . 819 ± 0 . 022 ) 0.852 ( 0 . 824 ± 0 . 018 ) DenseNet121 84.2 ( 82 . 7 ± 1 . 2 ) 0.867 ( 0 . 825 ± 0 . 024 ) 0.825 ( 0 . 801 ± 0 . 015 ) 0.872 ( 0 . 826 ± 0 . 024 ) 0.833 ( 0 . 809 ± 0 . 015 ) Note: V alues are reported as Best (Mean ± Standard De viation) over fi ve independent runs. Figure 8: R OC comparisons of 2D US models. For the US modality , the ANO V A test indicated no statistically significant differences among the models ( p > 0 . 05 ). Ho wev er , ResNet50 achiev ed the highest mean Accuracy (86.9%) and A UC (0.889) and was therefore chosen as the US backbone for multimodal model. Although Ef ficientNet-B0 sho wed comparable results, its performance was slightly lo wer across all metrics. 3.3 Multimodal Fusion Model P erf ormance T o thoroughly assess the advantage of data fusion, a direct comparison was established by ev aluat- ing the best unimodal models and the fusion model on the exact same unseen test set of 40 paired samples. Overall, the model trained on both MRI and US data outperformed its unimodal coun- terparts in both accuracy and A UC (T able 5). The feature fusion approach achie ved a significantly higher accuracy of 92.5% and an A UC of 0.927 on its best run. The fi ve run av erage produced an accurac y of 90.5±1.9% and A UC of 0.902±0.024. This superior performance was consistent across all metrics, with a precision of 0.892, a recall of 0.903, and an F1-score of 0.897. In the best run, this model correctly identified 23 of 25 normal cases and 14 of 15 P AS cases, resulting 18 in only three overall misclassifications. Figure 9 presents the best run A UC-R OC comparison and their confusion matrix. T able 5: Comparison of Unimodal and Multimodal Model Performance on same test set. Model Accuracy (%) A UC Precision Recall F1-Score Unimodal MRI 82.5 ( 80 . 5 ± 1 . 9 ) 0.825 ( 0 . 800 ± 0 . 018 ) 0.813 ( 0 . 793 ± 0 . 020 ) 0.820 ( 0 . 799 ± 0 . 018 ) 0.816 ( 0 . 795 ± 0 . 019 ) Unimodal US 87.5 ( 86 . 0 ± 1 . 2 ) 0.879 ( 0 . 844 ± 0 . 024 ) 0.865 ( 0 . 859 ± 0 . 012 ) 0.873 ( 0 . 843 ± 0 . 022 ) 0.868 ( 0 . 847 ± 0 . 016 ) Multimodal 92.5 ( 90 . 5 ± 1 . 9 ) 92.5 ( 90 . 5 ± 1 . 9 ) 92.5 ( 90 . 5 ± 1 . 9 ) 0.927 ( 0 . 902 ± 0 . 024 ) 0.927 ( 0 . 902 ± 0 . 024 ) 0.927 ( 0 . 902 ± 0 . 024 ) 0.917 ( 0 . 892 ± 0 . 022 ) 0.917 ( 0 . 892 ± 0 . 022 ) 0.917 ( 0 . 892 ± 0 . 022 ) 0.927 ( 0 . 903 ± 0 . 022 ) 0.927 ( 0 . 903 ± 0 . 022 ) 0.927 ( 0 . 903 ± 0 . 022 ) 0.921 ( 0 . 897 ± 0 . 022 ) 0.921 ( 0 . 897 ± 0 . 022 ) 0.921 ( 0 . 897 ± 0 . 022 ) Note: V alues are reported as Best (Mean ± Standard De viation) over fi ve independent runs. Figure 9: A UC-R OC and confusion matrix (CM) comparison: (A) R OC of multimodal and uni- modal models, (B) Multimodal CM, (C) MRI-only model CM, (D) US-only CM. 3.4 Statistical Analysis T o compare model performance across e valuation metrics, a repeated-measures ANO V A was con- ducted for each metric. When significant dif ferences were found, post-hoc paired t-tests were 19 performed with FDR correction using Benjamini–Hochberg method to control for multiple com- parisons. T able 6 summarizes the statistical results across all metrics. T able 6: Statistical comparison of model performance across five ev aluation metrics using FDR- corrected post-hoc pairwise comparisons. Significant p-values ( p < 0 . 05 ) are shown in bold. Metric Fusion vs MRI Fusion vs US MRI vs US Accuracy < 0 . 001 < 0 . 001 < 0 . 001 0.026 0.013 A UC < 0 . 001 < 0 . 001 < 0 . 001 0.021 0.030 Precision 0.003 0.270 0.023 Recall < 0 . 001 < 0 . 001 < 0 . 001 0.006 0.030 F1 0.002 0.036 0.013 The ANO V A rev ealed significant differences among the three models for each of the metrics. FDR-corrected post-hoc analyses showed that the fusion model significantly outperformed both the MRI-only and US-only models in terms of Accuracy , A UC, Recall, and F1-score (all p < 0 . 05 ). For Precision, the fusion model performed significantly better than the MRI (p = 0.003), while the dif ference between fusion and US models was not significant (p = 0.270). 3.5 Interpr etability Analysis T o e v aluate the interpretability of the proposed model, Grad-CAM [37] visualizations were gener - ated for representati ve MRI and US cases. These visualizations highlight the regions in the input images that contributed the most to the model’ s decision. Figure 10 illustrates the MRI and US feature extractors’ attention maps alongside the original images for qualitati ve assessment. Figure 10: Grad-CAM heatmaps for MRI and US feature extractors. The Grad-CAM was computed from the last 3D con v olutional layer of the MRI and US feature extractors. The resulting 3D activ ation maps were visualized as 2D slice overlays to highlight anatomical regions most contributing to the classification. Each Grad-CAM output was resized, normalized and superimposed on the corresponding input image to form a heatmap o verlay . For 20 the US modality , the visualization was displayed side-by-side with the original image. For MRI volumes, Grad-CAM was computed across slices, and representati ve slices from different depths were visualized. By visualizing the Grad-CAM heatmaps for MRI and US images, it was observed that the mul- timodal model primarily focused on anatomically relev ant regions associated with P AS [12]. In MRI, the attention was concentrated on the uterine wall and areas of abnormal placental in vasion, while in US, the model highlighted the lower uterine se gment and the interface between the pla- centa and myometrium, which are known key signs of P AS [5, 12]. These findings suggest that the model correctly identifies the critical regions that are indicati ve of P AS. The attention maps provide insights into the decision-making process of the model, supporting the reliability of the predictions and enhancing interpretability , which is crucial for clinical application. 4 Discussion 4.1 Unimodal and Multimodal P erf ormance Analysis The unimodal experiments rev ealed a notable outcome, the stronger performance of the 2D US- based ResNet50 model (89.3%, A UC 0.889) relati ve to the more complex 3D MRI-based hybrid DenseNet121-V iT model (85%, A UC 0.862) on their own unimodal test sets. MRI is often consid- ered a more reliable imaging modality for assessing deep myometrial in vasion. The performance gap is lik ely influenced less by the diagnostic capability of the modalities and more by the capacity of the learning methods applied. 2D CNNs lik e ResNet50 are highly optimized and benefit greatly from transfer learning on huge 2D medical image databases lik e RadImageNet, making them po w- erful feature extractors that are less likely to ov erfit [34]. In contrast, 3D models are well kno wn to require substantially larger datasets, and the complex 3D DenseNet-V iT architecture may hav e been under trained giv en the av ailable data. This suggests that for P AS detection, within the con- text of this study , the relev ant diagnostic features may be more readily identifiable from 2D US data, at which fine-tuned 2D CNNs e xcel. This promising performance of the unimodal US model therefore warrants further in vestigation to rigorously assess its potential as a first-line screening tool. Building on the unimodal baselines, this study demonstrates the significant benefit of a multi- modal deep learning frame work for the accurate and non-in v asiv e diagnosis of P AS. T o accurately assess the added v alue of multimodal fusion, a direct ev aluation of the multimodal model and the unimodal models on a same test set was essential. The true strength of this study lies in the multi- modal model’ s ability to surpass these unimodal baselines. Ev aluation on the dedicated paired test set (n = 40) sho wed that while unimodal models using either MRI or US data can achie ve strong performance, the integration of both modalities through an intermediate fusion architecture led to superior diagnostic performance. The multimodal model results indicates that MRI and US offer complementary diagnostic information by achie ving an accuracy of 92.5% and an A UC of 0.927 on the test set, outperforming the unimodal MRI model (accuracy 82.5%, A UC 0.825) and US model (accuracy 87.5%, A UC 0.879). Statistical analysis demonstrates that integrating MRI and US features giv es a statistically sig- nificant performance improvement ov er unimodal models. The multimodal approach consistently achie ved higher Accuracy , A UC, Recall, and F1-score, indicating improv ed overall detection ca- 21 T able 7: Comparison of unimodal baseline results with related P AS detection studies. Study Y ear Modality Dataset Model Accuracy A UC Notes MRI-based P AS Detection Peng et al. [16] 2023 3D MRI 324 (206 P AS) 3D ResNet 75.0% 0.861 No class balancing W ang et al. [7] 2023 3D MRI 540 (170 P AS) 3D nnU-Ne, 2D DenseNet-P AS 84.3% 0.860 Manual annotation; Extensiv e preprocessing Xu et al. [17] 2022 2D MRI 321 (179 P AS) 2D ResNet50 82.5% – Slice-lev el split; Non-independent test set Unimodal MRI (This Study) 2025 3D MRI 1,133 (280 P AS) 3D DenseNet121-ViT 85.0% 0.862 End-to-end pipeline; Patient-lev el split; Balanced training set; Independent test set US-based P AS Detection Y oung et al. [20] 2024 2D US Features 154 (77 P AS) Extra T rees Linear Classifier 83.0% 88.7% 0.90 – Manual R OI extraction; Feature-based model Unimodal US (This Study) 2025 2D US 983 (214 P AS) 2D ResNet50 89.3% 0.89 End-to-end pipeline; A utomated feature extraction pability and sensiti vity . The lack of significant improvement in Precision compared to the US-only model suggests that while fusion helps identify more true positives, it may not greatly reduce false positi ves. Overall, these findings highlight the complementary nature of MRI and US modalities and support the ef fectiv eness of multimodal fusion for robust classification. This supports the primary hypothesis of the study that combining imaging modalities could provide more compre- hensi ve and accurate diagnostic information than either modality alone. 4.2 Comparison with Prior W ork T able 7 compares the unimodal baseline results with related studies on P AS detection. The reported results are obtained using internal independent test sets to pro vide a comparativ e analysis. Studies are grouped by imaging modality and the table highlights key methodological dif ferences. Exist- ing MRI-based deep learning studies demonstrated promising performance with accuracy ranging from 75-84.3%. But they are limited by factors such as small datasets, class imbalance [16], slice-le vel data splits [17], or multi-stage pipelines in volving manual annotation and e xtensi ve pre- processing [7], which can introduce data leakage, class imbalance bias, and limited scalability . Whereas, the unimodal MRI in this study used end-to-end hybrid DenseNet121–V iT architecture directly on whole 3D MRI v olumes, with patient-le vel data splitting, balanced training and e v al- uation on an independent test set that eliminate manual feature engineering and improve model generalizability . With its automated end-to-end approach, the proposed model achiev es competi- ti ve performance (85% accurac y , A UC 0.86) and outperforms the prior studies. For US-based approaches, there is no prior studies with deep learning for P AS detection using US images. Existing US work [20] relies on manually extracted R OI from US images and R OI- based machine learning methods on small dataset with results (accuracy 84-92%) reported on very small test sample (39 images). For this reason, cross-v alidation performance of accuracy 83-88.7% is compared as a more stable indicator of model capability . In contrast, the unimodal US model in this study automatically learns diagnostic patterns from the full 2D US image on a larger dataset, achie ving high performance (89.3% accuracy , A UC 0.89) with greater generalizability . Additionally , the proposed multimodal model performance was compared with rele v ant stud- 22 ies. T o the best of current kno wledge, there are no prior studies published that perform feature- le vel multimodal fusion of US and MRI images for P AS detection. The only related multimodal work [23] integrates 2D MRI images with MRI-deriv ed radiomic features and clinical v ariables using decision-lev el fusion and ResNet34 encoder with machine learning to get 85.2% accuracy and 0.857 A UC. In comparison, the proposed end-to-end multimodal model uses feature-lev el fu- sion with deep learning architectures that take both 3D MRI and 2D US as inputs to achie ve 92.5% accuracy and A UC of 0.927. This study differs fundamentally from image-based multimodal learn- ing and comparison is intended to highlight methodological differences rather than performance. This result also holds up well when compared with multimodal fusion studies in other medical areas, such as breast cancer (A UC 0.898) [10] and Alzheimer’ s disease [9]. The intermediate (or feature-le vel) fusion architecture was chosen deliberately as it is a technique that has prov en ef fec- ti ve in various medical imaging applications [8, 10]. This strategy allo ws the model to first learn high-le vel, abstract features from each modality independently before combining them to identify complex inter -modal relationships. 5 Conclusion In conclusion, this study successfully dev eloped and validated a multimodal deep learning model for the diagnosis of P AS that integrates information from both MRI and US images. The results suggest that the proposed intermediate fusion architecture has the potential to outperform models trained on either modality alone, achie ving a diagnostic accuracy of 92.5% and an A UC of 0.927 on a test set. These results highlight the complementary value of combining the anatomical detail of MRI with US functional information. W ith further validation, this frame work has the potential to become a powerful decision support tool in clinical practice, improving the precision of prenatal P AS diagnosis and ultimately contrib uting to improved maternal and neonatal outcomes. While the study showed promising results, se veral limitations are recognized. Its retrospecti ve design based on data from a single institution may limit the generalizability of the proposed trained models. Future work is needed to ev aluate the performance on external data from other sites with dif ferent imaging protocols. Additionally , the size of the paired multimodal dataset was modest, a common challenge in medical AI. Hence, v alidation on larger , multi-center datasets is needed to confirm these preliminary findings. Additionally , expanding the multimodal approach to include clinical data, which has sho wn promise in other studies, would also be a v aluable addition. Acknowledgments The data collected for this study was approved by the Research Ethics Committee at King Abdu- laziz Uni versity (Reference No. HA-02-J-008 ) on September 11, 2023, ensuring compliance with ethical guidelines for participant rights and confidentiality . Refer ences [1] Alison G. Cahill, Richard Beigi, R. Phillips Heine, Robert M. Silver , and Joseph R. W ax. Placenta accreta spectrum. American J ournal of Obstetrics and Gynecology , 219(6), Dec 23 2018. [2] Samera Basri and Ettidal Jahdali. Maternal outcomes after placenta pre via and its spectrum at a single saudi academic tertiary care center: 21-year experience. J ournal of Complementary Medicine Resear ch , 13(4):98, 2022. [3] Hao Zhu, Xuan Y in, Haijie W ang, Y ida W ang, Xuefen Liu, Chenglong W ang, Xiaotian Li, Y uanyuan Lu, Guang Y ang, and He Zhang. A computerized diagnostic model for automat- ically e v aluating placenta accrete spectrum disorders based on the combined mr radiomics- clinical signatures. Scientific Reports , 12(1), Jun 2022. [4] Se yma Y asar and Saim Y ologlu. Prediction of placenta accreta spectrum by machine learning methods and determination of candidate biomarkers. The Journal of Cognitive Systems , Dec 2022. [5] Arcade Arakaza, Li Zou, and Jianwen Zhu. Placenta accreta spectrum diagnosis challenges and controv ersies in current obstetrics: A revie w . International Journal of W omen’ s Health , V olume 15:635–654, Apr 2023. [6] Maddalena Morlando and Sally Collins. Placenta accreta spectrum disorders: Challenges, risks, and management strategies. International Journal of W omen’ s Health , V olume 12:1033–1045, Nov 2020. [7] Haijie W ang, Y ida W ang, He Zhang, Xuan Y in, Chenglong W ang, Y uanyuan Lu, Y ang Song, Hao Zhu, and Guang Y ang. A deep learning pipeline using prior kno wledge for automatic e v aluation of placenta accreta spectrum disorders with mri. Journal of Magnetic Resonance Imaging , May 2023. [8] Xiangdong Pei, Ke Zuo, Y uan Li, and Zhengbin Pang. A revie w of the application of multi- modal deep learning in medicine: Bibliometrics and future directions. International J ournal of Computational Intelligence Systems , 16(1), Mar 2023. [9] Janani V enugopalan, Li T ong, Hamid Reza Hassanzadeh, and May D. W ang. Multimodal deep learning models for early detection of alzheimer’ s disease stage. Scientific Reports , 11(1), Feb 2021. [10] Gre gory Holste, Sav annah C. Partridge, Habib Rahbar , Debosmita Biswas, Christoph I. Lee, and Adam M. Alessio. End-to-end learning of fused image and non-image features for im- prov ed breast cancer classification from mri. 2021 IEEE/CVF International Conference on Computer V ision W orkshops (ICCVW) , Nov 2021. [11] Rui Y an, Fa Zhang, Xiaosong Rao, Zhilong Lv , Jintao Li, Lingling Zhang, Shuang Liang, Y ilin Li, Fei Ren, Chunhou Zheng, and et al. Richer fusion network for breast cancer classi- fication based on multimodal data. BMC Medical Informatics and Decision Making , 21(S1), Apr 2021. [12] V aleria Romeo, Francesco V erde, Laura Sarno, Sonia Migliorini, Mario Petretta, Pier Paolo Mainenti, Maria D’Armiento, Maurizio Guida, Arturo Brunetti, and Simone Maurea. Pre- diction of placenta accreta spectrum in patients with placenta pre via using clinical risk 24 factors, ultrasound and magnetic resonance imaging findings. La radiolo gia medica , 126(9):1216–1225, Jun 2021. [13] V aleria Romeo, Carlo Ricciardi, Renato Cuocolo, Arnaldo Stanzione, Francesco V erde, Laura Sarno, Giov anni Improta, Pier P aolo Mainenti, Maria D’Armiento, Arturo Brunetti, and et al. Machine learning analysis of mri-deri ved texture features to predict placenta accreta spectrum in patients with placenta pre via. Magnetic Resonance Ima ging , 64:71–76, Dec 2019. [14] Ka’T oria Leitch, Maysam Shahedi, James D. Dormer , Quyen N. Do, Y in Xi, Matthew A. Le wis, Christina L. Herrera, Catherine Y . Spong, Ananth J. Madhuranthakam, Diane M. T wickler , and et al. Placenta accreta spectrum and hysterectomy prediction using mri ra- diomic features. Medical Imaging 2022: Computer -Aided Diagnosis , Apr 2022. [15] Qian Shao, Rongrong Xuan, Y utao W ang, Jian Xu, Menglin Ouyang, Caoqian Y in, and W ei Jin. Deep learning and radiomics analysis for prediction of placenta in vasion based on t2wi. Mathematical Biosciences and Engineering , 18(5):6198–6215, Jul 2021. [16] Lulu Peng, Zehong Y ang, Jue Liu, Y i Liu, Jianwei Huang, Junwei Chen, Y un Su, Xiang Zhang, and Ting Song. Prenatal diagnosis of placenta accreta spectrum disorders: Deep learning radiomics of pelvic mri. J ournal of Magnetic Resonance Imaging , May 2023. [17] Jian Xu, Qian Shao, Ruo Chen, Rongrong Xuan, Haibing Mei, and Y utao W ang. A dual- path neural network fusing dual-sequence magnetic resonance image features for detection of placenta accrete spectrum (pas) disorder . Mathematical Biosciences and Engineering , 19(6):5564–5575, Mar 2022. [18] Carlo Ricciardi, Renato Cuocolo, Francesco V erde, Gio v anni Improta, Arnaldo Stanzione, V aleria Romeo, Simone Maurea, Maria D’Armiento, Laura Sarno, Maurizio Guida, and et al. Resolution resampling of ultrasound images in placenta previa patients: Influence on ra- diomics data reliability and usefulness for machine learning. 8th Eur opean Medical and Biological Engineering Confer ence , page 1011–1018, Nov 2020. [19] Xiao Y ang, Zheng Chen, and Xiaozhou Jia. Deep learning algorithm-based ultrasound image information in diagnosis and treatment of pernicious placenta previa. Computational and Mathematical Methods in Medicine , 2022:1–9, Jun 2022. [20] Dylan Y oung, Naimul Khan, Sebastian R. Hobson, and Dafna Sussman. Diagnosis of pla- centa accreta spectrum using ultrasound texture feature fusion and machine learning. Com- puters in Biology and Medicine , 178:108757, Aug 2024. [21] Ahmed Mohammed Elmaraghy , Salah T aha Fayed, Mahmoud Abd ElHamid Ali, Monira Ali Hassanien, and Ahmed Mohamed Mamdouh. Diagnostic accuracy of placental thickness in lower uterine segment measured by ultrasound in prediction of placenta accreta spectrum in patients with placenta pre via. a diagnostic test accuracy study . International J ournal of W omen’ s Health , V olume 15:311–320, Feb 2023. [22] Sherif A. Shazly , Ismet Hortu, Jin-Chung Shih, Rauf Melekoglu, Shangrong F an, Farhat ul Ahmed, Erbil Karaman, Ildar Fatkullin, Pedro V . Pinto, Setyorini Irianti, and et al. Prediction 25 of clinical outcomes in women with placenta accreta spectrum using machine learning mod- els: An international multicenter study . The Journal of Maternal-F etal & Neonatal Medicine , 35(25):6644–6653, Jul 2021. [23] Zhengjie Y e, Rongrong Xuan, Menglin Ouyang, Y utao W ang, Jian Xu, and W ei Jin. Predic- tion of placenta accreta spectrum by combining deep learning and radiomics using t2wi: A multicenter study . Abdominal Radiology , 47(12):4205–4218, 2022. [24] Mahsa Danaei, Maryam Y egane gi, Sepideh Azizi, Fatemeh Jayervand, Seyedeh Elham Shams, Mohammad Hossein Sharifi, Reza Bahrami, Ali Masoudi, Amirhossein Shahbazi, Amirmasoud Shiri, Heewa Rashna v adi, Kazem Aghili, and Hossein Neamatzadeh. Machine learning applications in placenta accreta spectrum disorders. Eur opean J ournal of Obstetrics & Gynecology and Repr oductive Biology: X , 25:100362, 2025. [25] Asmaa Jittou, Khalid El Fazazy , and Jamal Rif fi. Placenta segmentation redefined: revie w of deep learning integration of magnetic resonance imaging and ultrasound imaging. V isual Computing for Industry , Biomedicine, and Art , 8(1):17, 2025. [26] Sumaiya Ali, Areej Alhothali, Ohoud Alzamzami, Sameera Albasri, Ahmed Abduljabbar , and Muhammad Alw azzan. Placenta accreta spectrum detection using an mri-based hybrid cnn-transformer model, 2025. [27] Kaiming He, Xiangyu Zhang, Shaoqing Ren, and Jian Sun. Deep residual learning for image recognition. In 2016 IEEE Confer ence on Computer V ision and P attern Recognition (CVPR) , pages 770–778, 2016. [28] Gao Huang, Zhuang Liu, Laurens van der Maaten, and Kilian Q W einber ger . Densely con- nected con v olutional networks. In Pr oceedings of the IEEE Conference on Computer V ision and P attern Recognition , 2017. [29] Mingxing T an and Quoc V . Le. Ef ficientnet: Rethinking model scaling for con volutional neu- ral networks. In Pr oceedings of the International Confer ence on Machine Learning (ICML) , 2019. [30] Shakif AHMED, Dhruba Jyoti SHIL, T an vir Ahmed SOUR O, Sakib Al MAHMOOD, and Ferdous Irtiaz KHAN. Adv ancing brain tumor mri classification using swrd: A parallel swin transformer-resnet approach. V irtual Reality & Intelligent Har dware , 7(5):501–522, 2025. [31] Ze Liu, Y utong Lin, Y ue Cao, Han Hu, Y ixuan W ei, Zheng Zhang, Stephen Lin, and Baining Guo. Swin transformer: Hierarchical vision transformer using shifted windows. In Pr oceed- ings of the IEEE/CVF International Confer ence on Computer V ision (ICCV) , 2021. [32] Sihong Chen, Kai Ma, and Y efeng Zheng. Med3d: Transfer learning for 3d medical image analysis, 04 2019. [33] Mohammed Aloraini, Asma Khan, Suliman Aladhadh, Shabana Habib, Mohammed F . Al- sharekh, and Muhammad Islam. Combining the transformer and con volution for ef fecti ve brain tumor classification using mri images. Applied Sciences , 13(6), 2023. 26 [34] Xue yan Mei, Zelong Liu, Philip M. Robson, Brett Marinelli, Mingqian Huang, Amish Doshi, Adam Jacobi, Chendi Cao, Katherine E. Link, Thomas Y ang, Y ing W ang, Hayit Greenspan, T imothy Deyer , Zahi A. Fayad, and Y ang Y ang. Radimagenet: An open radiologic deep learning research dataset for effecti ve transfer learning. Radiology: Artificial Intelligence , 4, 2022. [35] Jia Deng, W ei Dong, Richard Socher , Li-Jia Li, Kai Li, and Li Fei-Fei. Imagenet: A large- scale hierarchical image database. In Pr oceedings of the IEEE Confer ence on Computer V ision and P attern Recognition (CVPR) , 2009. [36] M. Jorge Cardoso, W enqi Li, Richard Brown, Nic Ma, Eric K erfoot, Y iheng W ang, Benjamin Murrey , Andriy Myronenko, Can Zhao, Dong Y ang, V ishwesh Nath, Y ufan He, Ziyue Xu, Ali Hatamizadeh, Andriy Myronenko, W entao Zhu, Y un Liu, Mingxin Zheng, Y ucheng T ang, Isaac Y ang, Michael Zephyr , Behrooz Hashemian, Sachidanand Alle, Mohammad Zalbagi Darestani, Charlie Budd, Marc Modat, T om V ercauteren, Guotai W ang, Y iwen Li, Y ipeng Hu, Y unguan Fu, Benjamin Gorman, Hans Johnson, Brad Genereaux, Barbaros S. Erdal, V ikash Gupta, Andres Diaz-Pinto, Andre Dourson, Lena Maier -Hein, Paul F . Jaeger , Michael Baumgartner , Jayashree Kalpathy-Cramer , Mona Flores, Justin Kirby , Lee A. D. Cooper , Holger R. Roth, Daguang Xu, David Bericat, Ralf Floca, S. Ke vin Zhou, Haris Shuaib, Ke y- v an Farahani, Klaus H. Maier-Hein, Stephen A ylward, Prerna Dogra, Sebastien Ourselin, and Andre w Feng. Monai: An open-source frame work for deep learning in healthcare, 2022. [37] Ramprasaath R Selvaraju, Michael Cogswell, Abhishek Das, Ramakrishna V edantam, De vi Parikh, and Dhruv Batra. Grad-cam: V isual explanations from deep networks via gradient- based localization. International J ournal of Computer V ision , 128(2):336–359, 2020. 27
Original Paper
Loading high-quality paper...
Comments & Academic Discussion
Loading comments...
Leave a Comment