3D-TDA -- Topological feature extraction from 3D images for Alzheimer's disease classification
Now that disease-modifying therapies for Alzheimer disease have been approved by regulatory agencies, the early, objective, and accurate clinical diagnosis of AD based on the lowest-cost measurement modalities possible has become an increasingly urge…
Authors: Faisal Ahmed, Taymaz Akan, Fatih Gelir
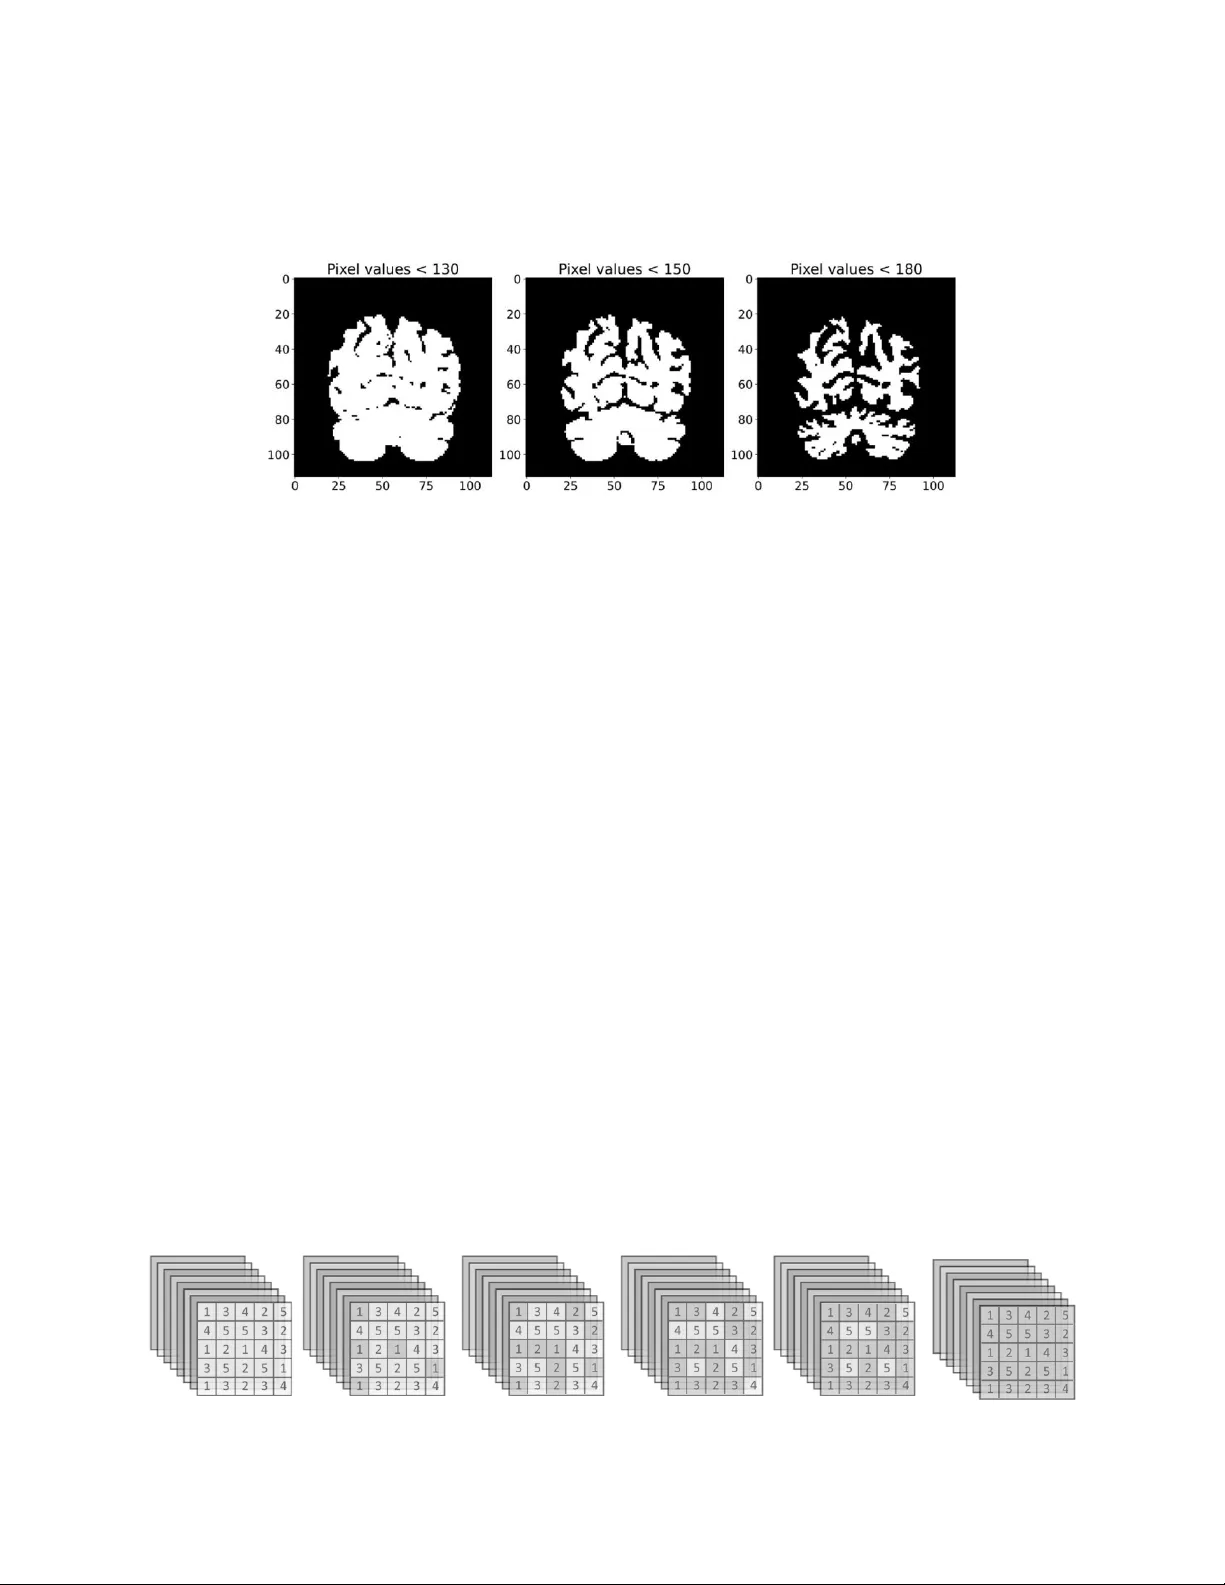
3D -TDA: Topolog ical feature extr action from 3D images f or Alzheimer’s dise ase classif ication Faisal Ahmed † 1 , Taymaz Akan † 2 , Fatih Gelir 2 , Owen T. Carmichael 3 , Elizabeth A. Disbrow 4 , Steven A. Conrad 2 and Mohammad A. N. Bhuiyan * 2 1 Department of M athematical Sciences, U niversity of Texas at Dallas 2 Department of M edicine, Louisiana State U niversity (LSU) H ealth Sciences C enter , Shrevep ort 3 Pennington Biomed ical Research C enter, LSU 4 Department of N eurology and Center fo r Brain Health , LSU H ealth Scienc es Center, Shrevep ort faisal.ahmed@utdall as.edu, {taymaz.a kan, fatih.gelir }@lsuhs.edu , owen.carm ichael@pbrc. edu , {elizabeth.disbrow , steven.conrad , nobel .bhuiyan}@lsuhs.edu † These authors contrib uted equally to th is work. Abstract Now that disease- modifyin g therapies for Alzheimer’s disease (AD) have been appr oved by regulatory agencies, the early, objective, and accurate c linical d iagnosis of A D based on the lowest -cost me asurement modalities possible has become an increasingly urg ent need. In this study, we propose a novel feature extraction me thod using persistent homology to analyze str uctural MRI of the brain . This approac h converts topological features into powerful feature vectors through Betti functions. By integrating these feature vecto rs with a simple machin e learning mod el like XGBoost, we achie ve a com putationally efficient machine l earning (ML) model. Our model outperforms state - of - the -art deep l earning models in both binary and three -class classification tasks for ADNI 3D MRI disease diagnosis. Using 10-fold cross-valid ation, our model achieved an average accuracy of 97.43% and sensitiv ity of 9 9.09% for binary c lassification. For three -class classification, it achieved an average accuracy of 95.47% and sen sitivity of 94. 98%. Unlike many deep l earning models, our approach doe s not r equire data augmentatio n or extensive p reprocessing, making it partic ularly suitable for smaller datasets. Topological features differ significantly from those commonly extracted us ing convolutional filters and other deep learning machinery. Because it provides an entirely different type of information from ML models, it has the p otential to combine topological features with o ther ML models late r on. Keywords: Top ological data analysis (TDA), M achine learnin g, Deep learnin g , Mathematics, Medic al image 1 In tr odu ct ion Alzheimer's disease (AD ) is a brain disor der character ized by the acc umulation of abnormal b eta amyloid and phosph-tau prote in deposits associated with apoptosis and brain atr ophy . AD results in decreased me mory and ot her cognitiv e function s, as wel l as mood and behavior changes. AD can be charac terized by the presence of plaques and tangles, and clinical deme ntia syndrom e. I t is preceded in time by a state of having plaques and tangles as well as some cogn itive decline, but not frank dementia (cal led MCI) , and preceded further by a state of hav ing plaques and tangles but no identifiab le cognitive decline (pr eclinical AD). . Th e preclinical stage is characterized by brain, b lood, and cerebrospinal fluid abnormalit ies without outward signs, and AD pathology begins at least 20 years befor e symptoms appear [1]. The second stage, MCI, involves cognitive impairment confined to a single domain, usually memory. Dementia, the final stage, is characterized by cognitive disturbances in multiple domains, often affecting memory and executive function. Early detection is crucial for successful interventi on and m anagement. AD pathology h as been dete cted using neuroima ging. Th e importan ce of structural brain m agnetic resonance imaging (MRI) is increasingly highlighted in the earl y diagnosis of AD. Neuroima ging techniques, su ch as structural MRI (sMRI), hav e not only identified spe cific structural changes in the b rains of AD patients but also provided ne w in sights into b rain function [2]. sMRI scans capture the three -dimensional shape and structure of brain tissue, enabling detailed analysis and precise vo lume measurements of various brain components [3 ]. Early AD is ass ociated with atrop hy of the entorhinal cortex, hippocampus, and posterior cingulate gyrus , with a 24% reduction in bilater al hip pocampal volume in AD patients rel ative to normal contr ols [4] . In add ition, frontal and parietal l obes have been shown to exhibit greate r atrophy in people with AD com pared to mild cognitive impairment . Additionally, [5] in troduced a machine-learn ing framework to differentiate AD patie nts from those with mil d cognitive impair ment. Given th e complexity and volume of neuroimaging data, advanced anal ytical techniques such as mac hine learning (ML), to pological data analysis (TDA), and deep l earning have become invaluable in th e e arly detection and diagnosis of Alzheime r's disease. M L algorithms can analyze vast d atasets, identi fying subtle patterns and features that may be indicativ e of early -stage AD or M CI. TDA provides a robust framework for extractin g features from image s [6], c apturing th e underly ing topologic al structures; however, the appl ication of TDA in imaging, especially in 3D images, is still relati vely limited, with fewer studies available. On th e other hand , deep learning, with its powerful neural networks, can auto matically learn hierarc hical features from raw data, improving diagnostic accuracy and aiding in p redicting disease progression. Together, these advanced techniques enhance the capability to detect and classify AD at its e arliest stages, fac ilitating timel y intervention and be tter patient outcom es. In this pap er, we pr esent a novel approach for d iagnosing AD using 3D MRI, lev eraging the application of TD A. TDA to ols have been successful in me dical image analysis b y capturing hidden shape patte rns wi thin images and generating reliab le representations . Topologic al features extracted prov ide unique insights in to data, enabl ing discovery of new information and dete rmining relevant features. When combined with suitable machine learning models, these feature vecto rs enab le the developme nt of interpretable, robust, and high -performance mach ine learning models. 2 TD A in Im ag e Pr oces sing TDA represents an in novative method to study c omplex data by id entifying both local and glob al structures across various scales. It addresses challenges re lated to data dim ensionality, differences in d ata collection methodologie s, and varying scales [7]. Over the past decade, TDA has bee n widely applied across multipl e domains, including image analysis, neurology, cardio logy, hepatology, gene -level and single-ce ll transcriptomic s, dr ug discov ery, evolution, and protein structural analysis [ 8]. By lever aging in herent topological features within images, TD A pr ovides a fr esh perspe ctive on image analysis. The abil ity of TD A to capture hidden patt erns in images ope ns new opportunit ies for tasks such as image segmentation, obje ct recognition, image registration, and im age rec onstruction. One c ommonly utilized tool from TDA in image analysis is per sistent homol ogy (PH), which h as demon strated impressive re sults in p atte rn recogn ition for image and shape analysis over the past two d ecades [9] . In the realm of medical image anal ysis, PH has p roven effective in the analysis of hepatic lesions, h istopathology [10], fibrin images, retinal images [11], [12], Chest X-ray images [6], tumor cl assification, neuronal mo rphology , brain arter y trees [13], fMRI d ata [14], and genomics data [ 15]. A thorough review of TDA methods in b iomedicine is availab le in excellent surveys [16]. 3 Met ho d In this study, we employ PH as an effective feature extraction method for classification of the stages of AD from MRIs. PH is a key technique in TDA, which allows for systemat ic explor ation of hidden patterns in data by varying a scale paramete r. The extrac ted patterns, known as topological features, and their persistence throughout the filtrati on proc ess, reveal signific ant in sights into the data's characteristics and organization. We provid e a basic ov erview of PH with in the con text of image anal ysis (cubic al persistence) for those unfamiliar with the concept . M ore com prehensive background information and PH applic ations to other d ata types, such as poi nt clouds and networks, can be found in [17]. The PH pr ocess c onsists of three main steps: first , the filtr ation step, where one induces a sequenc e of c ubical comple xes from the i m a g e data ; s econd, the p ersistence d iagram st ep, wh ere PH machin ery reco rds the evolut io n of topolo gica l featu res (birt h/de ath times) in the fil tration sequence ; a nd final ly , the vectorization step, where one can convert these records to a feature vector to be used in suitable ML models. 3.1 The P er sistent Homology P roce ss Step 1: Construc ting Filtrations Figure 1: A series of binary images , , are generate d fr om a 2D slice of Alzheimer' s disease (AD) using threshold values 130, 150, and 180 respecti vely. PH involves tracking the evolution of topological features in a sequenc e of cubical comp lexes. For image analysis, this sequence is typical ly constructed from a n ested serie s of bin ary im ages. Given a 3D gray scale image (e.g., with pixels and a depth of h slices), we use the grayscale values of each pixel . For a sequence of grayscale v alues , we obtain a nested sequenc e of binary images , where . This is cal led sublevel filtration. Al ternatively, superle vel filtration can be used by activ ating pixels in decreasing order of gray scale value s. Both meth ods convey the same information due to Alexander d uality. Step 2: Persistence Di agrams The second step in PH proce ss involves obtaining persistence diagrams (PDs) for the filtration , which represents th e sequence of c ubical complexes (binary images). PDs are formal summaries of the evolution of topological features in this filtr ation sequence, represented as collections of 2 -tuples , where denote the birth and de ath times of the topological features appearing in the filtration. Specifically, if a topological f eature appears for the first time at , the birth time is is r ecorded . If the topological fe ature vanishes at , the death time is marked. In other words, , wher e represents th e hom ology group of , c apturing topological features (i.e. ) in the cubical complex . For image analy sis, meaningf ul dimensions are cor responding to . For instance, features are connec ted components, and features are loops (holes) , features are cav ities (voids). For example, in Figure 2, if a l oop first appears at the binary image and is filled in at , the 2-tuple is added to the persistence diagram . Similarly in Figure 2, if a new connected component appears in and merges wi th othe rs in , is adde d to . F or example, in Figure 2, Image is a 5 × 5 grey scale image . After performing sublevel filtration, we obtain sequence of binary images . Consequently , the diagrams are and . X X 1 X 2 X 3 X 4 X 5 Figure 2: Th e figure on the le ft displ ays an image with di mensions of 5 × 5, showing specific pix el values. The sublevel filtration process in volves creating a sequence of binary images, represente d as . Step 3: Vecto rization PDs , b eing collecti ons of 2-tuple s, are n ot directly usable in machine learning (ML) mo dels. Therefore , vectorization is employed to convert PD in formation into v ectors or function s. A common vectorization method is the Betti function, which track s the number of 'a live' topological featu res at each threshold. In p articular, the Betti function is a step function with the count of con nected components in the sequ ential binary image , the number of holes (loops) in , a n d the numb er of cavities (voids) in . In ML applications, Betti functions a re usual ly taken as a vec tor of size with entries , i.e . . The Betti curve is an integer v alued step function where is the total # barc odes in containg . For example, from Figure 2, we have and . One can consider TDA as a powerful fe ature extraction me thod that captures shape patterns in images, with the Betti vectors , and serving as corresponding feature vectors. It's important to note that there are ot her various method s to convert PDs into v ectors in Persistent Homology (PH) (vectorization ), such as Persistenc e Land scapes, Persistence Ima ges, and Silhouettes . Sil houette f unction is defined as where is we ight. The choi ce of vectorization meth od can significantly i mpact the model' s performance depending on the data type . Generally, t opological features with short lifespans are considered top ological noise. While other vectorization methods aim to minimize topological noise, Betti functions also consider these short -lived features along with dominant ones. In the c ase of Al zheimer’s 3D MRI s, most topologic al features have short lifespans, making Betti functions effe ctive in capturing topological patte rns. Add itionally, among these vectorization meth ods, Betti functions are the easie st to inter pret since th ey directly count t opologic al features. F or these reason s, we utilize Betti function s as the vecto rization method in this study. 3.2 T opologic al Fea tures Extr actio n fr om Alzheimer’ s 3D MRIs The flowc hart (Figure 3) is a summary of our model. Sin ce all Alzheimer’s 3D MRI s consist of sequential 2D slices and are grayscal e images, they dictat e a gray scale filtr ation method for our persistent homology (PH) approach. Using the gr eyscale pixel values for any Al zheimer’s 3D MRI , we define a sublev el filtration as described in the previous sec tion. Whi le grayscal e values range from 0 (bl ack) to 255 (whit e), we chose the number of thresholds as in our filtr ation step, as further increasing th e numb er of threshol ds did not improve the performance of our model. In other word s, we normalized the grayscale interval to . After defining the filtration , we ob tain the persistent d iagrams of each 3D MRI for dimensions . Since MRI ar e 3D, only are m eaningful dimensions for PH. After obtaining persistent diagrams, we convert them into feature vectors as explained in the previous s ection. In this vecto rization step , several choices can be used, such as Betti func tions, Silhouettes, or Persistence Images. Given that most topological features have short lifespans, Betti functions were the natural c hoice as they provide the c ount of topologic al features at a given threshol d. F urthermore, for interp retability, we use Betti functions in our model s. Thus, we con vert , and into the corresponding Betti functions , , and as our feature vectors (Figure 3 - Step 2 ,3 ). Therefore, our topological feature extraction p rocess pr oduces features for any 3D M RI . To use machin e learning tools mor e effectively, we generate function s (topologic al summaries) from these pe rsistence diagrams. Figure 3: Flowchart of our mode l: For any 3D MRI of AD , we first gene rate persistence diagram s using the grayscale values ranging fr om 0 to 255. F rom these persistence diagrams, we extract topological feature vectors by using Betti functions. Instead of feeding the o riginal images to our machine learning models, we use these feature vecto rs as input. This approach y ields highly accurate c lassification results. 3.3 ML Model After obtaining o ur topological feature vec tors, the fin al step is to apply ML tools to these top ological fingerprints. To k eep our model computationally feasible, we applied XGBoost to classify these Betti vectors. No data augmentation or preprocessing was used for our model. The model uses topological feature vectors, and our feature extraction method is invariant under rotation, flipping and other common data au gmentation techniques. This makes our mod el c omputationally very feasible and can easily be applied to v ery large datasets. 4 Da tas e t The Alzheimer' s disease Neuroimaging Init iative (ADNI) database (adni.lon i.usc.edu) was the so urce of the data utilized in this study [18], [19]. In 2003, the A DNI was established as a public -private partnership under the leadership of Princip al Investigator Mich ael W. Wei ner, MD. Th e primary ob jective of ADNI has been to determine wh ether the pr ogression of mil d cognitive im pairment (MCI ) and ear ly Alzheimer' s d isease ( AD) can b e monitored through the combin ation of serial magnetic resonance imaging (MRI), positr on emi ssion tomography (PET), clinical and neurop sychological assessment, and oth er biological markers. Using T1- weighted 3D MRI scans fr om ADN I, we c onducted binary and multiclass c lassification. The models we re trained and tested on subjects who under went scans at screening, as well as at 6 months, 1 year, and 18 months (MCI only), and 2 an d 3 years (normal and MCI only) (ADN I1: Comple te 3Yr 3 T data). We perfor med 10 -fold cross-val idation on the dataset . In order to evaluate the pr oposed method, we conducted ex tensive experiments on bin ary (NC/AD) and multi -classification tasks (NC/MCI/AD). M oreover, only the middle 50 slices were conside red the model input. 5 Exp eri me nt al Re s ul ts a n d Se tu p The Alzheimer's Diseas e Neuroimaging Initiative ( ADNI) dataset is widely used for evaluating machine learning models in the field of neuroi maging, specifically for classifying AD patients. Several models have been applied to this dataset with varying i mage classes and performance metrics. In this study, we used XGBoost to classify the Betti vecto rs extracted from 3D MRI provid ed by ADNI dataset [18], [19 ]. In order t o evaluate the prop osed method, we conducted extensive experiments on binary (NC/AD) and multi -classification tasks ( NC/MCI/AD). AD usually has three stage s. Prec linical (NC) is the fir st stage, with brain and blood without sympto ms. AD pathology may start 20 years be fore sympto ms. The second stage of the disease is mil d cognitive impairment (MCI), which affects one cognitiv e domain , usually memory. The final stage of the disease, dementia (AD), is a cognitive disturbance in multiple domains, of ten memory and executive function, that interferes with daily life [20], [21] . For b inary c lassification, we merged the M CI and AD disease cl asses into a single class. The mo del was con structed and evaluated using a 10-fold c ross-validation strategy to ensure robustnes s and generalizability of the results. To enhanc e our mod el's performance in terms of accuracy and computational efficiency, we d id parametric tuning and feature selection methods. For feature sele ction, we used the SelectFromMo del function from scikit-le arn. We first assigned importan ce scores to each feature and then sorted them in descending order based on these s cores. Features with importance values below the specified threshold were considered unimportan t and subsequently ignored. We got the best model performance using XGBoost with the foll owing parameters: colsample_bytree = 0.3, learnin g_rate = 0.2, max_depth = 7, and n_estimators = 500. These parameters resulted in the highest average accuracy. To comprehensivel y evaluate the model's performance, we computed precision, r ecall, accuracy, AU C (Area Under the Curve ), and F 1 -score for each fold, and subsequently calculated their mean values. For multi -class classification, we computed the Area Under th e Receiver Operating Charac te ristic Curve (ROC AUC) usin g the one - vs -rest (OvR) approac h. 6 Re su lts In this section , we present the performan ce of our model on Alzheimer' s 3D. It is important to not e that refers to 0 -dimensional top ological features (componen ts), re fers to 1 -dimensional topol ogical features (loops or holes), and refers to 2-dimensional topolog ical features (cav ities or v oids) extracted from Alzheimer’s 3D MRI s. combines (100 -dim ensional) and (100-dimensional ) features, totaling 200-dimensional features. comb ines al l three feature sets, totaling 300 -dimensional features. We will now c ompare the p erformance of our model w ith recent dee p learning models for both b inary and 3 - class classification setting s. 6.1 Binary Classica tion: The performance of various models on the ADNI dataset for 2-class classification highlights differences in their ability to capture relev ant features in me dical imaging. As shown in Table 1, t he High-Frequency Compon ent Network (HFC N) achieves an accuracy of 90 .30%, s ensitivit y of 82.40%, and specific ity of 96.5% using a training d ataset on ANDI -1 and test dataset on ADNI -2. Th e 3D DenseNet, empl oying a five -fold cross- validation on 119/233/97 image c lasses, reaches an accuracy of 88.90%, with a sensitivity of 86.60% and specificity of 90.80%. A 3D ResNet model, using a 90:10 train -test split with 457/808/346 image classes, achieves an impressive accuracy of 94.00%, although sensitivity and spec ificity metrics are not re ported. The 3D -CNN mo del, with a 67:33 split on 330/29 9/299 image c lasses, performs at 93.20% acc uracy, 95.00% sensitivity, and 89.80% specificity. A 2.5D -CN N applied with a 10 -fold cr oss-validation on 209/4 01/188 image classes achieves 79.90% ac curacy, 84.00% sensitivity, and 74.80% spe cifici ty. Th e proposed mo del, using a 10 -fold cross-validation on 129/145/7 7 ima ge c lasses, stands o ut with a remar kable accuracy of 9 7.43%, sensitivity of 99.09%, and specificity of 95.43%, highl ighting its p otential effec tiveness for Alzheim er’s classification tas ks. Figure 4a shows the average confu sion matrix (per centage) for the proposed model, highlighting its performance in terms of tr ue positiv es, true neg atives, fal se positives, and fal se negativ es. This visualization confirms the robustness and accuracy of the proposed model in binary classification tasks for Alzheimer's 3D MRIs. T able 1. Results f or binar y disease patient classication on ADNI Method Ima ge Cl asses T r ain/ T est Cla ss Acc Sen Spe HFCN [22] 429 /–/8 58 - 2 90.3 0 82.4 0 96. 5 3D DenseNet [23] 119 /23 3/97 5-Fold 2 88.9 0 86.6 0 90.80 3D ResNet [24][19] 457/808/346 90 / 10 2 94.00 - - 3D - CNN [25] 330 /29 9/29 9 67 / 33 2 93.2 0 95.0 0 89.80 2.5D-CNN [ 26] 209 /40 1/18 8 10 -Fold 2 79.9 0 84.0 0 74.80 Propos ed Model 129 /14 5/77 10 -Fold 2 97.4 3 99.0 9 95.43 a b Figure 4 a Av erage Confusion matrices for multiclass disease pa tient classica tion on ADN I . The confusion matrix shows that the model correctly iden ties 95% of true negative s and 99% of true positi ves with 5% and 1% false positives and nega tives , respectively . b Aver age Receiver Oper ating Char acteristic (ROC) Curve for binary Cla ssication using 10- fold cros s-validation. Figure 4b il lustrates the Receiv er Operating C haracteristic (ROC) curve for the proposed mod el, showcasing its perfor mance in distinguishing between the positive and n egative c lasses. The ROC curve plots th e true positive rate (sensitiv ity) against the fal se positi ve rate (1-spec ificity) at various thres hold settings. 6.2 Multi-Class Clas sica tion: In the realm of 3-class c lassification using the A DNI dataset, several adv anced mode ls have d emonstrated their effectiveness. Tab le 2 rev eals that t he De mNet app roach, ap plied with a 70:30 train -te st split across 300/300/300 im age c lasses, achieves a high ov erall ac curacy of 91.85%, though specifi c prec ision, recall, and F1-score metr ics are not reported. The Natural I mage b ase mod el, trained on 755/2282/12 78 images with a 90:10 spl it, attain s an accuracy of 85.00% with recall of 90. 51%. Simil arly, th e MRI -base mo del show s an accuracy of 78.20% and rec all of 78.07%. The 3D ResNet model, employing a 90:10 split on 457/80 8/346 image cl asses, achieves an accuracy of 87%, though other performance metrics are not detailed. Th e 3D VGGNet model, with a 90:10 split on 207/215/193 image classes, reaches an accuracy of 91.13%. Notably , the p roposed model, evaluated using 10 -fol d cross-v alidation on 129/145/77 image classe s, excels with a precision of 95.97%, r ecall of 94.98%, accuracy of 95.47%, and an imp ressive F1 -score of 95.24%, showcasing its superior p erformance in th e classification of AD across three classes. T able 2 . Results f or multiclass (Three clas ses) disease patient class ication on ADNI Method Image Cla ss es T rain/T est Cla ss es Prec Rec Acc F1 - score DemNet [27] 300/ 30 0/3 00 70 / 30 3 - - 91.85 - Nat.Img base [28] 755/2282/1278 90 / 10 3 - 90.51 85.00 - 2D CNN [2 8] 755/2282/1278 90 / 10 3 - 78.07 78.20 - 3D ResNet [24] 457/808/346 90 / 10 3 - - 87 - 3D VGGNet [29] 207/ 21 5/1 93 90 / 10 3 - - 91.13 - Proposed Mode l 129/145 /77 10 -Fold 3 95.9 7 94.98 95.47 95.2 4 Figure 5a presents the average confusion matrix (percentage) for the multi-c lass classification task, visualizing the performance of th e pr oposed model acr oss th ree c lasses. The matrix provides insights into the true positive, true n egative, false positive, and fal se negative rates for each c lass. The values along the diagonal represent the percentage of correctl y predicted labels for each c lass, while the off - diagonal val ues in dicate the miscl assification rates. For cl ass 0 (NC), the model correctly identifies 95% of instances, with 5% misclassified as clas s 1 and 1% as class 2. F or class 1 (M CI), the m odel achieve s a 98% correct classification rate, with 1% misclassified as c lass 0 and 1% a s cl ass 2. For class 2 (AD ), the mo del corr ectly identifies 92% of instances, with 4% misclassified a s class 0 and 4% as class 1. This confusion mat rix illustrates the high performance and rel iability of the proposed mo del in distinguishing between th e three classes, with a strong emphasis on correc tly predicting true labe ls while maintaining low m isclassification rate s Figure 5. a Av erage Confusion matrices for multiclas s disease patient class ication on ADN I . The model correctly identies 95% of class 0 (NC) instances, misclassifying 5% as class 1 and 1% as class 2. Class 1 (MCI) is classied 98% correctly , with 1% misclassied as class 0 and 1% as class 2. For class 2 (AD), the model correctly identies 92 % of instances, misclassifying 4% as class 0 and 4% a s class 1. b Aver age Receiver Opera ting Char acteristic (ROC) Curve for Multi - Class Classication using 10 fold cros s- validation. Figure 5b illustrates the Receiver Operating C haracteristic (ROC) curve for the pr oposed model in a multi -class classification task. Th e ROC curve plot s th e true positiv e rate (sensitiv ity) against t he false positive r ate (1 - specificity) at v arious threshold settin gs. 7 Dis c us s ion The app lication of per sistent homology (PH) as a feature extr action me thod in 3D MRI imaging for Alzheimer’s disease (AD) present s a nov el approach that lever ages the strengths of topol ogical data anal ysis (TDA). Our study demonstrates that PH can effe ctiv ely capture to pological features, such a s loops and cavities, within 3D MRI data, p roviding insightful patterns that contribute to ac curate classification of AD stages. Th e ke y advantage of using PH in this context is its ability to maintain in terslice dep endencies, which is crucial for preserving the spatial and structural integrity of 3D images. As our figures suggest, our topological descriptors are highly effective in distinguishing be tween different stages of AD. Remar kably, even with out employing deep learning techniques, our mo del surpasses state- of - the -art models in benchmark datasets for A D c lassification (Table 1 and 2). Our re sults cl early de monstrate the remarkable capabilit y of TD A in generating powe rful feature v ectors from 3D MRI images. Howev er, the number of studies utilizing TDA for 3D im age anal ysis, particularly in me dical im aging, r emains limited. While our method shows significant p romise, it is im portant to acknowl edge that TDA's appl ication in this are a is stil l in its early stages. De spite this, the integration of these top ological descriptors with mac hine learning models has prov en highl y effe ctive in our experiments. The ability to transform complex 3D MRI data into manageable and interp retable topological feature vectors addresses the chal lenges o f computational feasibil ity and in terpretability faced by traditional ML and DL models. This transformation not only makes the data more manageabl e but also retains essential structural information that is oft en los t in other p reprocessing me thods. Our exp eriments reveale d that th e proposed method, inte grating PH-derived fe atures with XGBoost, significantl y outperformed state- of - the -art D L models in b oth binary and multi -class classification ta sks on the ADNI dataset. The use of Betti functions as feature vectors proved partic ularly effectiv e, prov iding a rob ust and in terpretable representation of the topological features present in the MRI images. Nevertheless, our results al so indicate that there is room for improvement, particularly when it comes t o integratin g these top ological features wi th advanc ed deep learning mo dels. By seamlessly comb ining these descriptors with deep l earning, we can pot entially enhance the effec tiveness of clinical decision support systems for AD diagnosi s. 8 Con c l usi on Our study presents a pioneering approach to Alzheimer's disease diagnosis us ing 3D MRI images by leveraging the strengths of pe rsistent homology and topological data anal ysis. The integration of PH with machine learning, specific ally XG Boost, h as demo nstra ted superior perfor mance in c lassifying AD stage s, highlighting the potential of this method to enh ance early detec tion and diagnosis. The ability of PH to main tain interslice dependencies and prov ide a com prehensive analy sis of 3D structure s is a signific ant advanc ement in neuroimaging. The results underscore the importance of fu rther exploring and developing TDA methods for 3D medical imaging, as th ey offer a promising avenue for improving diagnostic accuracy and patient outc omes. Future work s hould focus on expanding the ap plication of TDA in med ical i maging, exploring other vectorization methods, and integrating these approaches with more advance d ML and DL mod els. Additionally, large-scale studies and clinical trials will be ne cessary to validate the ef fective ness and reliability of these methods in real-worl d settings. By continuing to refine and enhance these techniques, we can contribute to the development of more effective clinical decision support s ystems for Alzheimer's disease and other neurologic al disorder s. Ac kn o wl edg emen t This work was s upported by In stitutional Dev elopment Aw ard (IDeA) from the National Institutes of Ge neral Medical Sciences of th e NIH unde r grant n umber P20GM121307 to MANB, and the project was partially supported by the I ke Muslow, MD Endowed Chair in Hea l thcare Informatics of LSU Health Sciences Center Shreveport.
Original Paper
Loading high-quality paper...
Comments & Academic Discussion
Loading comments...
Leave a Comment