Deep Generative Models for Enhanced Vitreous OCT Imaging
Purpose: To evaluate deep learning (DL) models for enhancing vitreous optical coherence tomography (OCT) image quality and reducing acquisition time. Methods: Conditional Denoising Diffusion Probabilistic Models (cDDPMs), Brownian Bridge Diffusion Mo…
Authors: ** - 논문에 명시된 저자 정보는 제공되지 않았습니다. (예: Simone Sarrocco 등) **
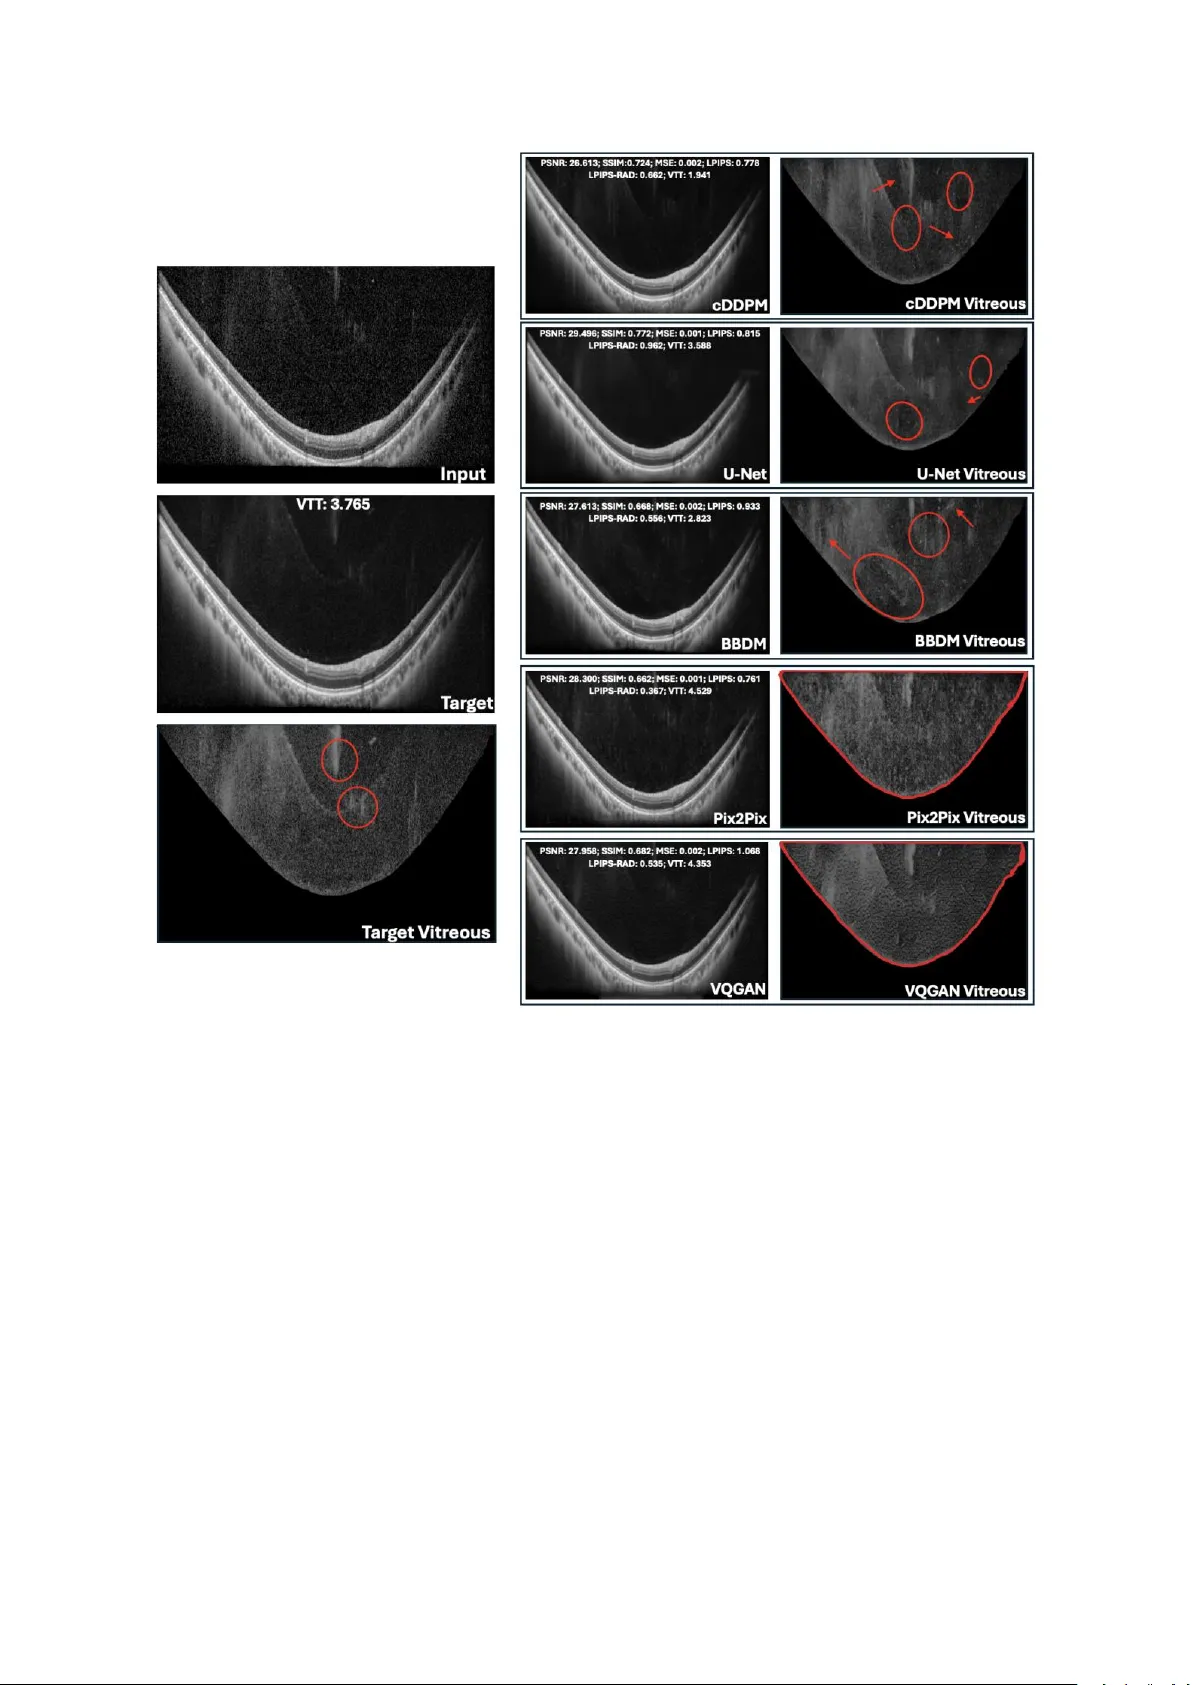
Deep Generative Models for Enhanced Vit reous OCT Imaging Simone Sar rocco 1 , Ph ilippe C. Cattin 1 , Peter M. Maloca 1,2 ,3 , Paul Friedrich *,1 , Philippe Valmaggia *,1,2,3 * Shared last authorship 1 Depa rtme nt of Biomedi c al Enginee r ing, University of Basel, Allschw il, Switzerla nd 2 Depa rtme nt of O phthal mology, University Hospital Basel, Basel, Switzerland 3 Moorfields Eye Hospital NHS Fou ndation Trust, London, EC1 V 2PD , United Kingdo m Corres pon ding author: Simon e Sarrocco, Department of Bio m edical Engineering, Unive rs ity of Basel, Allschwil, Switzerland . Email: simon e.sarrocco@unibas.ch Commercial relationshi ps: Simone Sarr occo: None Philippe C. Catt in: None Peter M. Maloca: Consultant at Roche, Zeiss Forum, and holds i ntellectual prope rty for machin e learning a t MIMO AG and Visio nAI, Switzerland. Paul Fried r ich: None Philippe Valmagg ia: Recipien t of Heidelberg Engineering and Ba y er, Funding from Swiss Na ti onal Science Foundation (Grant 323530_ 199395), Swiss Academy of Medical Science s (YTCR 43/23) and Jangg en -Pöhn Foundation. Keywords: optical coherence tomograph y, vitreous bo dy , imag e qu ality enhanceme nt, dee p learning , diffusion models, visual Turing test , U -Net, Pix2Pix, VQ- GAN Abstrac t Purpose : To evalua te de ep lea r ning (DL) m odel s for enhancing vi treous optical coherence tomography (OCT) image quality and reducing acquisition t ime. Methods : Condi tional Denoising Diffusion Pro babilistic Models (cDD PM s), Bro wnian Bridge Di ffusi on Models (BBD Ms), U-Net, Pi x2Pix, a nd Ve ctor-Quan tised Gen erative Adversarial Network (VQ-GAN) were u s ed to generate high-q uality spectral-domain (SD) vitreous OCT images. Inp uts w ere SD AR T10 images, a nd o utputs were compared to pse udoAR T100 images o btained by a veraging ten ART10 image s p er eye location. Model perform ance was assessed using i mage quality me trics an d Visual Turing Tests, w here ophthalmologists ra nked ge nerated images a nd evaluated anatomi c al fid elity. The be st model’s performance wa s further tested within the manually seg mented vitreo us on newly acquired data. Results : U-Net achieved t he highest Peak Signal- to -Noise Ratio (PSNR: 30 .230) an d Structural Si milarity Index Measure (SSIM: 0 .820), foll owed by cDDPM . For Learned Perceptual Image Patch Simil arity (LPIPS), Pix2Pix (0.697) an d cDDPM (0.75 3) performed best. In the first Visua l Turing Test, cDDPM ranked highest (3.07); in the second (best model only) , cDDPM a chieved a 32.9% fool r ate and 85.7% a natomical preserva ti on. On newly acquire d data, cD DPM g enerated vitre ous regions m ore simila r in PSN R to the ART10 0 reference than true AR T1 or ART10 B -sca ns and achie v ed higher PSNR o n whole images when conditioned on ART1 than ART10. Conclusio ns : Resu lts reve al discrepancies between quan titativ e me trics and clinical evaluation , hig hlighting the n eed for combined assessment. cD DPM showed strong potential f or gene rating clinically meaningful vitreous OCT images while reducing acqui s ition time fourfold. Tra nslation al Relev ance : cDDPMs show pr omise for cl inical integration, supp orting faster, h ighe r-quality vitreous imaging. Dataset an d code will be ma de publicly available. Introd uction Optical coherence tomography (O CT) is a non -invasive im aging technique widely used in op hthalmology to visuali s e different compartments of the eye at micro met re -scale resolu ti on. 1 Despi te its widespread adop tion , O CT imagin g faces chal lenges, particularly in acquiring high-q uality images of the vitreous body , wh ose main function is to remain transparent. 2 Due t o its transparency, it is not easy to pr operly visualise it through im aging techniques. 3 Recent work by Spa ide et al. ha s introduce d an enhanced imaging technique aimed at i mproving the visuali sation of the vitreous body , allowing for a n eva luation of a natomic chan ges in the vi treous associated wi th posterio r vitreous d etachment, vitreo us degeneration and cisterns. 3,4 This approach invol v es a veraging fou r A -scans a t each position before image reconstruction, signi fic antly boo sti ng image quality through detai led frame averaging a nd high - resolu ti on imaging . Howe v er, obtain ing high -quality OCT scans ca n take seve ral minutes, sign ificant ly burden ing patients an d reducing cli nical efficie ncy. Another limi tation i s the presen c e of sp eckle , a g ranula r p attern i nherent to O CT ima ging that often obscu res fin e structural details. 5 Speckles a rise from the interference o f coherent light waves scattered by micro structures within tissue, leading to random inten s ity and phase variations. In OCT, thi s mani fests as a gran ular, grainy texture that red uces i mage contrast a nd obscure s fine an atomical d etails , thereby decreasing o verall imag e quality and diagnost ic clarity. 5,6 In addition, OCT image s are a lso aff ected by artef acts due to p atient motion during the acquisition , which results in long st rips of bl ack pixels that might comple tely obscure p arts of the images. There h ave b een many d ifferent ap proaches to enhan ce the quality of OCT ima ges. A common denoising technique is signal a veraging . 7 It consists of sequentially acqui r ing multiple scans o f the same eye locati on and a veraging th em in magnitude to increa se the o verall quality of the i m age . 8 Also, cl assical denoi s ing approache s, such as med ian filtering , sparse and wavelet-based filtering metho ds, and Bay esian techniques , h ave sh own some promi se i n re ducing n oise in OCT imag es . 9– 11 Re cent breakthrough s in mach ine le arning h ave given rise to deep neural ne tworks . Mode ls like con volutional neural ne tw orks (C NNs ) and g enerative a dversarial netwo rks (GANs ) have been e m ployed on medical i m ages for many different tasks , i ncluding OCT image enhancement. 12 – 14 Howe v er, ea ch of the me ntioned method s has its li mitations. Trad itional de noising approache s , such a s filtering metho ds and Bayesian techniques, often bl ur critical anatomi c al details or requ ire extensive parameter tuning , thereby limiting their clinical utility. 15 Whe n performing signal ave raging, the o verall acquisition time increases linearly in , crea ting a burden for the patient and introducing motion a rtefacts. 16 In multi-frame averaging, motion causes local misalignment b etween B -scans, especially at the e dges where fewer frames overlap. This prod uces da rk bands o r b lack strips that p artially o r co mpletely obscure affected region s . CNNs a nd GANs were able to gene r ate better results thanks t o the deep arc hit ecture of deep le arning mod els . 14,17,18 Howe v er, they are s till prone to un stable trai ning , introdu ction of artefacts a nd blurriness in the outp ut images . 19 More re cently, d iffusion models, a n ew class o f dee p g enerative models, have be en emplo y ed for many image- to -image translation tasks. 20 – 23 Thanks to thei r ability to preserve fin e image detail s, they have be en wid ely used in the med ical fiel d to enhance the q uality of the image s. 24,25 Therefore, i n this wo rk, we p ropose app lying diffusion models for enhancing vitreous OCT images a nd compare their performance with other well-known de ep le arning models , like U-Net, Pix2Pix, an d VQ-GAN. 26 – 28 The pe rformance of ea ch model is assessed from both a quantitative and qualitative perspe ctiv e. For the qu antitative comparison, stan dard image quali ty metrics like PSNR, MSE, SSIM , an d L PIPS are use d to measu re the similarity b etween the gene r ated i mages and the original high-qual ity OCT imag e; for the qu alitative assessmen t, the model o utputs a r e compared by visual insp ection , bo th g lobally across the entire image a nd specifically w ithin t he vitreo us region by masking out all other structures. The clin ic al va lue is assesse d via two visual Turing tests performed by expert ophthalmologists from t he University H ospital Bas el and ot her clin ical sites. 29,30 Add itiona lly, a qu antitative eva lua ti on wi thin the regions of interest i nside the vitreous body is p erformed on newly acquired data comprise d of AR T1, ART10, an d ART100 volumes that sh ow t he f ull gr adation f or a proper comparison . In this way, we aim to i dentify a d eep learning -based approac h capable of en hancing the qu ali ty of vitreous OCT images by si gnificantly reducing acquisition times with respect to acqui r ing an ART1 00 i mage and potentially bein g deployed in clinic al practice . The code, tog ether with the d ataset and the vi sual Turing tests, w ill be made publicly available at https:// github .com/SimoneSarro cc o/vitreous_enh ancement . Methods Data Ac qui sition The ma in dataset used in this study consisted of retin al s pectral - domain (SD ) OCT image s from six he althy sub jects at the University Hospital Basel using a Spectrali s OCT devi ce (H eidelberg En gineering GmbH , Heidelberg, Germany ) i n AR T10 mod e . Follow - up da ta, used to e valua te the p erformance of the best model insid e the vitreous body, con sisted of retinal SD OCT image s acquired in Lucerne from one healthy subje ct usi ng the sa me device as the ma in dataset, in ART1, ART10, a nd ART100 mode s . Ethical approval for data collection was granted from the Eth ics Committee of Northwe st and Central Switzerland (ID: EKNZ 2022 -01091), and all participants provided i nformed written consent. The an onymised d ata we re transferred under a coded data-sharing a greement to the De partment of Biomedi cal Engineering o f the Unive rs ity of Basel. The OCT i mages of b oth datase ts w ere acquired in v ideo mode, ge nerating consecu tiv e B-scans of 768 496 pi x els on a 55 ° field- of -view . The n ominal acqui s ition sp eed w as set at 20 kHz, co rresponding t o an inte gration time of 44 per scan. F or the main dataset, for each scan location , ten ART10 images were acqui red , where each ART10 is in turn the average of ten consecu tiv e B-scans. Since a total of 132 different lo cations were scanned, the datase t consisted of 132 0 ART10 imag es, from he re on wards also denoted as l ow -quality images or input images. For the follo w- up da taset, ten ART1 volume s, ten ART10 volumes, and o ne ART100 volume were acqui r ed on the same pa ti ent, w here e ach volume consi ste d of 21 B -sc ans (i.e., 21 different eye loca ti ons). Weighted Sign al Averaging Figure 1 . Schematic representation of the ste ps for gen erating the gr ound truth and vi sual comparison with a simp le signal av eraging without artefact detectio n . a) T he steps performed to detect and mask out the arte fact regions in each ART10 image are shown: 1) A binary mask of the origina l ART10 image is computed with a th reshold of 0 to ke ep only b lack pixels. 2) T he m orphological closing operation is ap plied to fill small ga ps between ne ar by black pixe ls w ith white pixels, th us keeping only conti guous re gions of black pixels. 3) R efinement checks are a pplied to ke ep only those black pixels tha t are surrounded by other black pixels in at least 3 of the 4 differen t directions (up, down, left, right) so that small protuberances are removed from the mask. 4) The contours of the black region are drawn on t he o riginal ART10 i mage, showing a perfect match with the mo tion artefact r egion (long, contiguo us region of only black pixels at the botto m of the image ). b) Visual comparison betwe en the prop osed w eighted signal averaging (left i mage) and simple arit hmetic si gnal av eraging (righ t image) for generating t he ground truth. As shown in the zoom ed area in th e red rec tang l e , the proposed appr oach led to an in creased level of de tail and b rightness in re gions where many input ART10 images had a motion artefact. In Fig ure 1a, a visualisatio n of the main steps of the p roposed averaging method i s provided. Since many input images had mo tion art efacts , we developed a w eighte d image averaging me thod to g enerate the grou nd truth . Motion artefacts appe ar as long black strips that co mpletely o bscure part o f the image. To detect the m in ea c h o f the ART10 image s, a comb ination of binary threshold ing and morphological operations was used to i solate contiguous strips of black pixels . Then, the fina l a veraged i mage (i.e., the ground truth) was generated by assigni ng a w eight of 0 to all p ixels i nside the detected artefact re gion s a nd a w eight of 1 otherw ise. 31 In other words, each pi xel in the grou nd truth i mage is the average of all non -artefact corresponding pixels in the input images . As sh own in Figure 1b , t his ma sk ed averaging a pproach result ed in an enhanced ground t ruth imag e with less shadowi ng eff ect and a better level of con trast in the regions w ith many motion artefacts in the ART10 images . Since a target image at each eye l ocation was g enera te d by a veraging the ten ART10 of the same loca tion, w here each o f them was in turn the a verage of ten consecutive B-scans, we re ferred to it a s p seud oART100 , repre senting the average o f 1 00 B - scans, yet not acquired w ith the original ART100 sett ings. Preprocessing For each pa ir, inpu t a nd target images w ere normali s ed to a p ixel i ntensity ra nge of [0,1] by min-max no rmalisation . Padding of 8 rows of bla ck pixels, both at the top and at the b ottom of each image , wa s app lied to make the ima ges co mpatible w ith the architecture of the models . The fin al pre-pro cessed images, ready to be fed in to th e model s, were graysca le vitreous OCT images of size 768 512 pixels. Model Architecture s Many d ifferent de ep learning models we r e i nclu ded in the comparison , including two different kinds of diffusio n models: cDDPMs and BBDMs. 20,32 – 34 Diffusion models aim to en hance the quality of the ART10 image s by a dding d ifferent levels of noise to th e correspondi ng p seudoART100 and learning to i teratively denoise them. 20 After learning th e de noising process on the p seudoART100, only the ART10 i mage is given as in put to the model, which returns its enhanced versi on by iteratively re movin g the noise pattern learn ed during training . 35 The two models were compared with a U -Net, and adversa r ial networks like Pix2Pix and VQ-GAN. 27,28,3 6 A more extensive explanatio n of eac h model architecture is provided in Supplementary Material 1. Tra ini ng Details Table 1. Best config uration parameters for e ach deep learning model Parameter U-Net cDDPM BBDM Pix2 Pi x VQGAN Image Size 768x512 768x512 768x512 768x512 768x512 Batch Size 1 1 1 1 1 Learning Rate 2e -5 2e -5 2e -5 2e - 4 G: 1e-4, D: 5 e-4 Optimi zer AdamW AdamW Adam AdamW Adam Weight Decay 0.01 0.01 0.01 Linearly decaying the learning rate to 0 from epoch 100 0.01 Dropout 0.1 0.1 0.0 0.0 0.1 Best Epoch 50 300 170 200 10 Numb er of Channels 128 128 128 G: 128, D : 64 G: 512, D :64 Training Timesteps - 1000 1000 - - Sampling Timesteps - 1000 200 - - Variance schedule - Linear Linear - - Channel Multiplier (0.5, 1, 1, 2, 2, 4, 4) (0.5, 1, 1, 2, 2, 4, 4) (1, 2, 4, 6, 8) (1, 2, 4, 8) (1, 2) Attent ion Resol utions 16, 8 16, 8 128, 64, 32, 16, 8 - - Numb er of Attent ion Heads 1 1 8 - - Numb er of Heads per Channel 1 1 64 - - Numb er of Residual Blocks 2 2 2 - 2 Emb edding Dimension - - 8 - 8 Numb er of Emb edding Vectors - - 16,384 - 16,384 Loss Type L2 L2 L1 10 L1 + LSGAN L1 + 0.01 Adv + 0.001 Perc Discriminator - - - PatchGAN PatchGAN EMA 0.9999 0.9999 0.995 - - DDPM = Deno ising Diffusion Probabilistic Model; BBDM = Brownian -Bridge Diffusion Model; VQGAN = Vector-Quan tized Generative Adversarial Network; G = Generator; D = Discriminator; L1 = Mean Absolute Err or; L2 = Mean Squared Error; LSGAN = Leas t-squared GAN; Adv = Adversarial Loss; Perc = Per ceptual Loss. To train a nd eva luate the mo dels , the datase t was spl it into train ing (9 90 pa irs of image s), validation (160 pai rs), and test sets (170 p airs) i n a patien t -wise man ner to avoid having OCT scans of the same patie nt in more than one set . The train ing se t comprised image s from 4 p atients, whe reas th e valid ation and test sets comp rised image s from 1 patient each. The validation set was used to choose the best setup for each model; the test set was used to compare the best-p erforming configurations and assess the best model from a quantitative perspective. F or the BBDM, instead of using the pre-trai ned che ckpoi nts o f the VQ -GAN p rovided by the authors , which were trained on R GB images from the Ce lebAMask-HQ dataset, we trained our own la te nt space on b oth ART10 and pseud oART100 images from our traini ng se t to make i t more suitable for reconstructin g gra ysc ale vitreou s OCT imag es. 37 The hyperparame ter ch oices o f each best-performing se tup are shown in Tab le 1 . All model s were trained and tested on a single N VIDIA® Quadro R TX 60 00 24 GB (Nvidia, Santa Clara , US). Evaluation Metrics Quantitative eva luation was performed usi ng both pixel -wise metrics like PSNR and MSE , and similari ty and pe rceptua l me asures like SSIM and LPIPS, resp ectively. 38,39 All metrics w ere comp uted be tween o utput images and the co rresponding ground truth. Moreo ver, sin ce the ori ginal LPIPS is b as ed on a C NN a rchitecture pre -trained on Imag eNet (i.e., RGB no n-me dical images), we decid ed to also use a versi on of LPIPS pre-trai ned on the RadImageNe t dataset, which we called LPIPS-R AD. The latter can be found i nside the MONAI Generative repository . 40,41 To e valua te cl inical applicability, re levance, a nd usa bility, expe rt o phthalmologists condu cted two visual Turing tests and rated the models. The g raders for the visual Turing tests were recruited throu gh a req uest via professional ophthalmology n etworks of the Moorfie lds Eye Ho spital, London, U K, and the U niversi ty Eye Hospi tal, Unive rs ity of Base l, Switzerla nd. The first test consi sted of ten qu estions , whe re i n each of them a true low-q uality OCT i mage (i.e., AR T10) was shown together w ith the Figure 2. Str ucture of the two v isual T uring te sts . In P anel a (above), the re is an examp l e of a question from the fi rst visual Turing test, wh ere clinicians were asked to rank the 6 model outputs displayed at the bottom of the page from best (left) to wor st (right). B y clicki ng on one of the 6 images below, they could visualise it in full resolution side- by -sid e with the low -qua lity imag e (ART10, always displayed on the top left). In Panel b (bottom-lef t), a question fro m the first section of the second visu al Tur ing test is shown, where clinicians had to s po t the ps eudoART100. In this p art, t hey coul d zoom i n on specific p arts of both images using a synchronised mag nifier that appeared on both images. In Panel c (bottom-r ight), a represen t ation of the second section of the secon d visual Turing t est is sh own. Here, ophth almologists ha d to compare the ps eudo ART100 with the generated image using a slide r, to the n answer a ll the sub -que stions related to the preservation o f ana tomical details both in the vitreous body and in o ther compartments of the eye. correspondi ng five model o utputs plus the “true” h igh -quality image ( i.e., the pseudoART10 0 used as ground truth i n o ur study). In e ach q uestion, ophthalmologists were asked to ra nk the six im ages from best (rank 1 ) to worst (rank 6) based on wh ich they thou ght w as the best artificial ly generated enha nced versio n of the ART10 . In Figure 2a , the structure o f the first visual Turing test is displayed , and i t can be accessed at htt ps://v0-visualturingtest-rho.vercel.app/ . The second visu al Turing test was performed using the o utput i mages from the de ep learning model that performed best i n the first test. The test w as di vided into two sections , each of ten questions . I n the first section (Figure 2b ), in each question, they had to spot the “real” hi gh -quality OCT imag e, and the fool rate was compu ted as the percen ta ge of wrong answers . 42 In the second se ction (Figure 2c), in each que sti on, they had to answer a set o f Yes/No sub-questions regarding the preservation of anatomi c al details o f both the vitreo us b ody and other rele vant anatomical structures of the eye (Su pplementary Ma terial 2). This se cond test can be a ccessed at h ttps:/ /v0- new -project-atjqtgf4o4e.vercel.app/ . Bo th Turi ng tests w ere created a nd deployed using the cloud pl atform Vercel (Vercel, San Francisco, US). Since each e ye location i ncluded ten similar ART10 i mages, we randomly chose one per locatio n to preven t multiple image s from the sa me location from app earing in the two visual tests. How ever, since the s econd test consisted of a t otal of twenty questions (i.e., twen ty d ifferent images), for three of the ey e loc ations o f the patient included i n our test se t, we had to p ick two images. Once the image s to be included in the visual test we re randoml y sel ected, we al ways showed the same set of image pairs in each question to all participants. Results Quali tative Comparison Figure 3 . Visual comparison of model outputs and tar get image with an additional focus on the vitreous body. In the le ftmost column, in put A RT10, target pseudoART100, an d t he segmented vitreou s of the target f or an example from t he t est set are displayed. In the two colum ns on the righ t, the model outputs from ea ch o f the five DL models and the cor responding vit reous extracted by masking out all o ther ana t omical features in the image are shown, respect ively. B efor e segmenting the vitreous body, histogram equalisation was applied using the open -sour ce Fiji ima ging s oftware to enhance t he contra st f or a better visu alisation. 44 The se gmentations w ere obtained by using th e S egm ent Anything demo , and they might slightly diff er at the edges. 51,52 In red, some a rtefacts for each image are highlighte d with ci rcles and arrows. For Pix2Pix and VQG AN, the whole r egion is hi ghlighted beca use of the p resen c e of to o m any artefacts. Additionally, at the top of each generated image, th e sco res of all quan titative metrics with respect to the ground truth and the average rank score from the first visual Tur ing test ar e displayed. P SNR = Peak Signal- to -Nois e Ratio; S SIM = S tructural S imilarity In dex Measu re; MSE = Me an S quared Error; LPIPS = Learne d Perceptual Ima ge Patc h Similarity; LPIP S - RAD = LPIPS pre-tra ined o n RadImage Net; V TT = average ran ki ng from the first Visual Turing Test. Figure 3 displays an exa mple o riginal AR T10 imag e with a motion artefact a t the bottom tha t obscures the choroid and the sclera. In this region, the reconstructions in the mo del outputs are very different from e ach o ther. For i nstance, i n the output ima ge from the U-Net model, no meaningful anatomical details were recon structed, but rather a b lurry re gion mostly filled with pi x els of average i ntensity . A simi lar behavio ur can be seen in the ou tp uts from the two GANs, where the re is a sort of grid-shaped artefact in the output f rom Pix2Pix a nd a strip-shaped ar tefact in VQ-GAN. On the other hand, the two di ffusion mod els we re able to reco nst ruct the anatomi c al structures of the choroid in a way that resembles the gro und truth. When looking a t the retin al l ayers, in the output from the BBDM, the bo undaries between each laye r are less de fined than in the targe t image. In the case o f VQ-GAN a nd U -Net, the layers a re cl early visible , but there is a gen eral loss of detail withi n each layer, w here the reconstructio n appear s to be ve ry ho mogen eous a nd o verly smoothe d . When iso lating the vitreou s reg ion of the images by masking out all other an atomi cal structures , artefacts were vi sible across all model s. The U-Ne t output showed a g eneral lo ss o f fine details du e to blurriness , along w ith se veral localised a rtefacts (hig hlighted by re d ci rcles a nd arr ows in Fig ure 3). Both diffusion -based models also pro duced artefacts w ithin the vitreous region, with the BBDM generating anatomical st ructures that differed completely from the target. The vitreous gen erated by the cDDPM and the U -Net appe ared simil ar, with the U-N et o utput being smoother a nd da rk er, whi le the cDDPM sho wed a texture pattern mo re consi ste nt with the targe t but containing a few di storted structures. In add ition, both GANs exhibited the same repeating texture patterns across the whole Figure 4. Add itional visual comparison o f the mo del outpu ts with the tar get ima ge. On the l eft, the ART10 image used a s i nput i n ea ch of th e mod els is s hown. O n the two c olumns on t he right, th e output image from each of the five de ep learning models, together with the ta rget pseudo ART100 ima ge us ed as ground truth. Also, on top of each im age, the sco res of all quantitative metr ics and the average r anking from the first visual Tu ring te st are d is played. PSNR = Peak Signa l- to - Noise Ratio; SS IM = Structural Similarity In dex Measure; M SE = Mean S quared Error; LPIPS = Learned Perceptu al Im age Patch Similarity; LPIPS -RAD = LPIPS pre-trained o n RadImageNet; V TT = av erage ranking from the first Visual Turing Test. vitreous as i n the co rrespondin g g lobal i mage s. It is wo rth n oting tha t the ori ginal acqui s itions we re al so not free of artefacts. For in stance, in this case, the target i mage presen ts mostly mirroring artefacts, which genera te d stal actite-like hyperintense regions . In Figure 4, there is an example of an input ART1 0 with a signific ant amount of spe ckle . It is ea sy to n otice that in the case of Pix2Pix, t he speckl es are n ot sufficien tly reduced, and the ov erall quality of the input ART10 image is not enhanced . Al so in this case, and many cases amon g the test set, the output from the VQ-GAN presented a w ave effect across the whole ima ge. The retinal la yers in the outpu t images from the U -Ne t and BBDM we re di storte d wi th no clear boun daries . In co ntrast, in the reco nstructed image from the cDDPM, they are well reconstructed an d d elineated as in the gro und truth. The only exception is the retinal pigment epithelium , which is const antly brighter than the ground truth . Quanti tative Comparison Table 2. Quantit ative Metrics on the Test Set (mean ± standard devi ation) Metrics U-Net cDDPM BBDM Pix2 Pi x VQ -GAN Input/Target PSNR 30.230 ± 2.089 28.6 15 ± 1.769 27.5 70 ± 1.326 28.46 8 ± 1.697 28.962 ± 1.769 25.336 ± 2.067 SSIM 0.820 ± 0.041 0.771 ± 0.043 0.711 ± 0.041 0.719 ± 0.041 0.748 ± 0.048 0.518 ± 0.072 MSE 0.001 ± 0.001 0.002 ± 0.001 0.002 ± 0.001 0.002 ± 0.001 0.001 ± 0.001 0.003 ± 0.002 LPIP S 0.838 ± 0.062 0.753 ± 0.067 0.870 ± 0.061 0. 697 ± 0.0 58 0.986 ± 0.052 0.823 ± 0.081 LPIP S-RAD 1.069 ± 0.073 0.627 ± 0.107 0.445 ± 0.091 0.267 ± 0.092 0.552 ± 0.054 0.894 ± 0.098 Avg. sampling time (s) <1 96 7 <1 <1 - GPU Training usage 17342 MiB 9196 MiB 6318 MiB 4700 MiB 13638 MiB - The a rrows indicate if higher (pointing up) o r lower (pointing down) values cor respond to better re sults. PSNR = Pea k S ignal- to -No ise Ratio; S SIM = S tructu ral Similarity Index Measure; MSE = Me an Squared Error; LPIPS = Learned Pe rceptual I mage Patch Similarity; LPIPS-RAD = LPIPS pre-trained on RadIma geNet. In bold, the best scores for each metric. The quantitative results a re presented i n Tabl e 2. In the last co lumn, the metrics between inpu t ART10 a nd target pseudoART100 are computed to have baseline Figure 5. Differe nce ma ps b etween ge nerated im ages a nd g round tr uth. In the first column, the grou nd truths o f three sa mples from the test set are sho wn. Each of the five followin g colu mns sh ows the generated image (le ft) and the corresponding diffe renc e map (right) for on e of the five dee p learning mode ls. The d ifferences are computed a s the generated i mage minu s grou nd truth, where both images are in the range [0,1], leading to differences in th e range [-1,1]. Red col ours: p ositive differences; blue colours: nega tive differences. value s for better u nderstanding the p erformanc e o f each model in ge nerating images more simil ar to the ground truth tha n the ART10. The U-N et model ach ieved the best results on all pixe l -based metrics, w ith a PSNR o f 30.230 ± 2.089 and an MSE of 0 .001 ± 0.00 1 . VQGAN, cDDPM, a nd Pix2Pix achie v ed similar values of PSNR (VQGAN: 28.962 ± 1. 769 ; cDDPM: 28.61 5 ± 1.769; Pix2Pix: 28.468 ± 1.697). In Figure 5, pixel - wise differences b etween model output and g r ound truth of three randomly ch osen image s from the test set a re displayed. For each model, b oth the gene r ated i m age and the dif ference map are shown, where red colo urs represent p ositive d ifferences (i.e., pixel value of the genera ted image larger than the grou nd truth), bl ue co lours represent negative differences (i.e. pixel value of t he gen erated imag e lo wer t han the ground truth), and white means no difference. Most of t he model s s eemed to st rugg le with the reconstruction of the same anatomical struct ures, li ke t h e nerve fibre layer and other retinal layers in the first sample (f irst ro w of Figure 5 ), or the right part of the image in the second sample (s econd row of Figure 5). Pix2 P ix, most of the time, co uld not reconstruct the v itreous body, as can be e asily spotted from the d ifference map of the first sample , w here the predicted pixel i nt ensitie s were always higher tha n the ground truth. In terms of SSI M, U-Net also performed be st ( 0.820 ± 0.041). The cDDPM was the second b est, with an average of 0.771 ± 0.043 , f ollo wed by VQ -GAN (0.748 ± 0.048 ), Pix2Pix (0.719 ± 0 .041), a nd BBDM (0 .711 ± 0.041). When l ooking a t the pe rc eptual metrics , Pi x2Pix performed best in terms of b oth LPIPS (0.697 ± 0.058 ) and LPIPS- RAD (0.267 ± 0.092). U - Net , on the other hand, generated i mages that were e ven l ess simila r to t he groun d truth than the input ART10 accord ing t o both LPIPS (U-Net: 0.838 ± 0.062; Baseli ne: 0.823 ± 0.081) an d LPIPS-RAD (U -Net: 1.069 ± 0.07 3; Base line : 0.894 ± 0.098). The same happe ned with the scores o f LPIPS for BBD M and VQ-GAN, both worse than the baseline v alu es shown i n the last column (BBDM: 0.870 ± 0.061; VQ -GAN: 0 .98 6 ± 0.052). Among the diffusio n mode ls, cDDPM performed bett er t han the BBDM in terms o f LPIPS (0.753 ± 0.067, BBDM: 0.870 ± 0.061), but worse in terms of LPIPS-RAD (0.627 ± 0.107, BBDM: 0.445 ± 0.091) . Visual Turing Tests Of the total o f 39 9 ophthalmologists con tacted, 17 participants (4.3% ) r egistered for the first Turi ng test, a nd 7 pa rticipants (1.8%) for the secon d Turing test. Among the 17 partici pants in the first vi sual t est, 13 had at least 5 years of e xperie nce with OCT i mages. In thi s test, the l ower the average rank, and closer to 1, the better the evaluation o f a model . The results are pre sented in Fig ure 6. The signal ave raging approach still perform ed better tha n all d eep lea rning models, with an average rank of 2.78. This means that, on avera ge, clin icians stil l preferred the “true” hi gh -quality Figure 6. Results from the first visual Turing te st. The average r anking s are sh own tog ethe r wit h the 95% confidence intervals. The low er the av erage rank for a mod el, and the closer to 1, the bett er the per formance. Models that are significantly worse tha n signal averaging (ad justed p -val ue < 0. 05, Holm-correcte d for multiple comparisons) are marked wit h a r ed dagger ( † ). image to the gene rated o nes. Amon g the deep lea r ning mod els, the cDDPM performed b est with an aver age rank of 3 .07, wit h the U -Net model right b elow it (3 .11). Pix2Pix and BBDM we re the worst, with a n average rank above 4 o ut of 6. When performing hypothesi s testing be tw een the results of the first visual test, as shown in Figure 6, only cD DPM and U-N et were no t significantly differen t from signal ave r aging, with adjusted p -values > 0.05 (Holm-co rr ected for multip le comparisons). 43 Whe n stratifying the ranki ngs by years of experience, a s sh own in Figure 7, the major difference was in the average ranking of the two GANs. In both sub -g roups, cD DPM and U-Net were still the closest to sig nal a v eraging, with al most the same ave rage score among clini cians w ith at least 5 years of e xperience. Since the cDDPM pe rform ed best among the deep learning model s in the first test, the image s generated w ith this mod el were use d for the seco nd test to h ave a more detailed cli nical eval uation . Among the 7 particip ants in the second visual test, si x had at least 5 yea rs of experie nce with OCT imag es. The results from both sectio ns are shown i n Figure 8 . In Section 1, the fool r ate, def ined as the percentage of how many times op hthalmologists wrongly stated that the genera ted image was the real high - quality OCT ima ge , was computed . The ideal fo ol ra te is 50%, which means that , on average, cli nicians ca nnot di stinguish be tween g enera ted and re al images . In our case, a mong the 7 participants, the average fool rate was 3 2.9%. In Se ction 2 , we computed the percentage of positive answers to questions rel ated to the preservation of t he most relevant anatomical features i n the images. The overall anatomical preserva ti on of all participant s was 85.7% . Whe n focusi ng on the vitreous body (Figure 8a), the an atomical pre servation was 78 .9%, with the low est percen tage occurring in the are a of Marteg iani (7 0% of pre servation), and the posterior vitreou s membrane being the most preserved structure (8 4.3 %) . From t he commen ts clinicians left when Figure 7 . Average ranks stratified by l evel of experience wit h OCT data . In blue, the average ranks among clinicians with less than 5 years of expe rience are sh own, whereas in orange, the corre sponding scores among clinicians with at least 5 years of experience are displayed, together with the 95% confidence intervals. To hel p understand how each mo del is ranked a mong t he two sub - grou ps, the ranking position is displayed at the bottom of each b ar. answe r ing “No”, we kn ow that in just one case, the hyalo cytes were visible in the ground truth but no t in the generated image. R egarding the o th er an atomica l compartmen ts of the eye (Figure 8b), the re tinal la yers w ere perfectly p reserve d with a percen tage of 100% , f ollo wed by the choroid (97 .1 %) . The lowe st preservation was about the i dentification o f pa th ological structures, whe re the percentage was 80 %. Here , we had the most heterogeneous answers, with ca ses in w hich the y spotted pathologi cal structures in 9 out of 10 images, especially dense vitreous, and c ases in which they spotted n one i n 9 out of 10. Figure 8 . P ercenta ge of a natomical p reservation for the vit reous body a nd oth er relevant anatom ic al structures. In Panel a (above), the percentages of positive answers for the vitreous body are sh own, which include the posterior vi treous m embrane, the bursa praemacularis, the area of Marte giani, and hyalocytes. I n Panel b (below), t he per c enta ge of positive answers for t he remaining key anatomical str uctures, like retinal laye rs, optic nerve head , choroid, scl era, a nd pathological structu res, is displayed. Quanti tative Evaluation of the Be st Model Inside the Vitreous Body The qu antitative performance of the cDDPM within subregions of the vitreous body was evaluated on the newly acquired data. Each ART volum e comprised 2 1 B-scans, Figure 9 . Qual itative a nd quan tit ative comparison o f tru e ART1 , ART10, a nd ART100 B - scans, and the co rresponding images generated by the cDD PM. In the first row, the true ART1, ART10, a nd ART1 00 B-scans at the sam e eye location ar e displayed. On the ART100 image, the ROI inside the vitreous body is highlighted in green. In the second row, fro m left to right, the images generated from the cDDPM by using e it her the ART1 B-s can or the ART10 B -scan a s conditioning are shown, respectively. In the last row, the correspond ing di fference m aps, c ompu ted on a pixel level as the generated image minus t he A RT100 ima ge, are dis played. Difference maps a re in the range [ -1, 1] since the y are computed between images in the pixel range [0,1]. thus 21 different eye locations. For each eye location , a region of interest (ROI) i nside the vitreo us bod y was manually se gmented using the open-source Fij i imaging software. 44 T he cDDPM, which was assessed as the best-p erforming model by ophthalmol ogists, was used to g enerate the corr esponding output im ages starting f rom either a true AR T1 B-scan or a n ART10 B-scan. Then, the PSN R in the R OI (highlighted in green in Figure 9) was computed o n a B-scan level between either true ART1 or true ART10 and the corresp ondi ng true ART100 , and b etween generated image s and the corresponding true ART100. The averaged sco res across a ll locatio ns Figure 10 . Average PSNR in the R OI in s ide the vitreous b ody across all eye loca tions computed on the n ewly a cquired d ata. The a verage PS NR against t he true ART100 ac ross a ll eye locations is disp l ayed fo r the true A RT1 im ages, true AR T10 ima ges, and the corresponding i mage s generated by the cDDPM starting from either true ART1 (cDDPMfromART1) or true A RT10 images (cDDPMfrom ART10), respectively. are shown in Figur e 10 . As e xpected, t he PSNR of ART10 images (17.35 0 ± 2.112) is higher than the PSNR of ART1 image s (16.14 2 ± 1.78 2). The image s gene rated by the cD DPM from b oth AR T1 an d AR T10 B -scans exhi bit higher similarity to the ART100 reference in terms of PSNR (18.377 ± 2. 127 and 18.616 ± 2.21 2, res pectively) than the co rresponding true AR T1 and AR T1 0 B -scans . In the exampl e shown in Figure 9, the d ifference ma ps computed betw een e ach generated i m age and the ART100 imag e a re very similar i nside the vitreou s ROI , co nfirmed also by the PSN R scores (1 7.333 for the ima ge ge nerated from an AR T1, an d 17 .468 for the i mage gene r ated from a n ART10). Ad dition ally, w hen looki ng at the scores in Figu re 11 computed o n the whole i mages, PSNR i s e v en hi gher w hen u sing ART1 image s Figure 11 . Avera ge PSNR acro ss a ll e y e l ocations comp uted on the whole images of th e newly acquired da t a. The average PS NR against t he tru e A RT100 across all eye loc ations is displayed for the true ART1 images, true ART 10 images, and the c orresponding images generated by the cDDPM starting from either true A RT1 (cDDPMfrom ART1) or true ART10 ima ges (cDDPMfrom ART10), respectively. (22.399 ± 1 .688) to ge nerate h igh-quality i mages i nstead o f usi ng AR T10 images (21.761 ± 1.707). Discussion High image quality is e ssential for rel iabl e OCT i mage interpretation, particu larly whe n assessing low -c ontrast regions such a s the vi tr eous body. How ever, acqui ring su c h high -quality images often requires long scan times, w hich can be challenging for patien ts – esp ecially those with poor fixation o r li mited coope ration – lea ding to incomplete or compromi s ed acqui sitions. Recent ad vancements in deep learning have introdu c ed deep neural networks tha t address th ese limitations. In a supervised setting where pairs of low-q uality and high-quality OCT i ma ges are availabl e, t here ha ve been many different applications o f CNNs for t he denoisin g task . 12,13 With the ri se of gene r ative mo dels, a rchitectures like U-Net and GANs h ave be en e xtensively explo r ed. 17,26,27 U-Net, with its en coder -decoder structure and ski p conne ctions, has been w idely used for i ts ab ility to prese rve spatial resolution while re constructing features. GANs h ave show n promise i n generating sh arper ou tp uts thro ugh adversa r ial training. However, GANs are prone to unstable training and can int rodu c e artefacts i nto the ge nerated imag es, w hereas U -Net and other CNNs can introduc e blurriness, whi c h obscures subtle anatomical fe atures that might be critical for clin ical evaluation . Diffusion models ha ve become a valid option in medi c al i maging. 20 –23,33 Diffusion models l earn to i teratively remove noise to g enera te a noise -free final image. By in corporating additional i nput conditions to g uide the g ene r ation pr ocess, cDDPMs, such as Pa lette, became a powerful tool for medica l image - to -image transl ation tasks. 21,35,4 5 This study showe d that it is possi ble to use D L to en hance the visu ali sati on o f the vitreous. F irst, we ge nerated high-quality image s by signal-a verag ing th em . We ca lled these high -q uality images “pseudoART100” because they resemb led the quali ty of a n ART100, which u sually take s a round 10 minutes to acqui re. By emplo ying the use of DL models , starting f rom a single ART10, we a imed at generating a clinic ally re levant, high -quality versio n as simi lar as possible to th e corresponding p seudoART100 . All DL models generated a high -quality OCT image in a much shorter amount of time than the acq uisition time of an ART100. It wa s found that an artificial OCT ima ge d erived from the conditional di ffusi on model w as clinically useful a nd could be generated, on average, i n 96 seconds whe n sampling with the de fault 1000 timesteps. By considering also the acqui sit ion time of an ART10, which is around 1 mi nute, we were able to gener ate a high-quality OCT image similar to an ART100 in approx imately 2 minutes an d 36 seconds, in contrast to the avera ge 10 min utes needed to acquire an original ART100. This results in a lmost a 4 x sp eedup under cu rr ent experimental condi ti ons, which could h elp ophthalmologists make fast er a cquisitions and diagnoses and ma k e the w hole proce ss more comfortable for the patient . Interestin gly, when focusing o n re gions inside the vitreo us b ody , the mo del p erformed comparably well when giving as in put an ART1 image instead of a n ART10 imag e, de spite having u sed ART10 images a s condi tioning during training. In other words, starting from a n ART1 B-scan, on average , the mod el gen erated a vi treous region more similar to the ART100 than a true ART10 , and very si m ilar to the image gene r ated by using the true ART10 as inp ut . These findin gs also hold for the entire images rather than just inside the vitreous, suggesting that the model cou ld be used to enhance the qu ality of ART1 image s a nd poten ti ally save even more time for g enera ting a high-quali ty vi treous OCT image . Considering bo th qualitative a nd quantitative results on the whole ima ges, no sing le model clearly dominates, hi ghlighting the com plementary streng ths e ach a pproach bring s to vitreous OCT im age enhancement . As shown in Table 2, even among th e quan titative results, there are ma ny incon sistencies depe nding o n which metric w as used to a ssess the DL pe rformance. In terms of pixel -w ise di fferences, the U -Net achie v e d the be st results, whi le GANs p erform ed the w orst . When looking at the percep tu al qu ality, we have almost the opp osite si tuation with Pix2Pix and VQ-GAN achie v ing better scores than U -Net and diffusion mo dels in terms of LPIPS-RAD . Howe v er, even amon g perceptual qual ity metrics, there is high variability in the results. For instance, depen ding on wh ether we look at LPIPS -RAD or LPIPS, BBDM is either the second - best model or the second worst, a nd VQ -GAN is either the third -best mod el in L PIPS-RAD or ev en w orse than the b aseline LPIPS between ART10 a nd pseudoART10 0. In other wo rds , i n terms o f L PIPS , the o utput image s from the VQ - GAN were less similar to the ground truth than the ART10 . The introdu cti on of new artefacts, espec ially within the vitreous body , re quires careful consideratio n. New artefacts are l ikely d ue to the l imited sa mple si z e an d lack o f diversi ty, a s the dataset i nclud ed only a few he al thy subjects. Hallucinated anatomical structures in the genera ted images co uld critic ally und ermine the clinical reliability of the me thod. Su ch a rtefacts may mislead clinicians du ring image interpretation, potentially resulting in diagnostic errors and patient harm . This underscor es the need for rig orous evaluation strateg ies that go b eyond stand ard i mage sim il arity metrics . To this end, the two visual Turing tests that w e deve loped helped us to better unde rstand how well ea ch model preserved the key an at omical feature s usually vi sibl e in a vitreous OCT image. Mo dels such as Pix2 Pix and VQ-GAN, despite achi eving strong LPIPS score s – which are i ntended to a pproxi m ate h uman perception o f image qua lity – w ere, o n a verage , rated poorly b y cli nicians . Si milarly, BBDM was the secon d-be st model according to LPIPS-RAD but was ranked w orst in th e visual test. I nstead, even if their average score wa s w orse than signal averaging, cDDPM and U -Net were th e only two mo dels no t sig nificantly w orse than si gnal averag ing in terms of clini cal judg m ent. The correla tion ma trix (Supple m entary Material 3) betwe en all quantitative metrics a nd results from the first visual Turing test confirms the fact tha t the p ixel -based and percep tu al-b ased q uantitative metrics l ed to very different rankings of the mode ls and were d ifferent from t he clin ical evaluation. This highlights the need for a more reli able way o f evalua ting the qua lity of g enerated OCT imag es in terms of pre servation of anatomi c al details, which is essential for a f uture dep loyment of the method in clinical practice. Solely relying on metrics that measure pixel -wise di ffere nces o r that try to mimic how humans perceive the qua lity of an imag e m ight not detect sub tle but importan t differences i n how specific a natomical structure s we r e (o r w ere not) reconstructed , as well as the introduction o f new structures that are very u nrealistic from a clini cal point of view. These findi ngs are in accordance with the results in Bayhaqi et al, where they trained ResNe t and U-Net model s with diff erent loss functions t o enha nce O CT image s of pig tissues to imp rove the accuracy of a tissue cl assifier for smart la ser osteotomy. 17 In their w ork, they also state that quantitative imag e similarity metrics alone are insufficient to assess the di fference between the DL model s, and tha t a clinical evaluation is needed to understand the pre servation of d etails achieved by each model . They also e xperienced blurriness in the gen erated i mages when training the U-Net w ith the MSE as a loss functio n, and j ust a partial removal of speckl e s by the model trained with an adversarial network, similar to what we obse rved in the images gene r ated by Pix2Pix and VQ -GAN. Furthermore, Halupka et al . trained b oth a CNN with the MSE loss and a GAN to enhance retinal OCT image s. 46 In their w ork, the C NN performed best i n terms of quantitative metrics, b ut t he GAN mo del was preferre d from a q ualitative po int of view by the three clinicians who rated the generated i mages. Also in their work, cl inicians on average still preferred the hi gh -quality image s obtained b y signal avera ging rather than the ones g enerat ed by DL mo dels. How ever, this is expected since we tra ine d the models by using the a veraged OCT images as ground truth, so the goal was to generate OCT images with a similar - but likely lower - quali ty much faster, a nd thi s slig ht reduction in the ove rall i mage quality w as spo tted by the ophthalmol ogists. Thanks to the se cond visual Turing test, we were able to quantify the anatomical preserva ti on capabilities of the cDDPM. The res ults show tha t the condition al di ffusion model was able to preserve and recon struct most of the ke y an atomical features o f the eye. In gen eral, the already cl early visible structure s, such a s re tinal la yers and choroid, rema ined clea r ly visi ble also i n the gene rated images. Ha r dly vi sible structures on t he or iginal O CT image we re not a lways visible on the generat ed ima ge. An explana tion co uld be that the clinicians ha d di fferent l evels of confidence when looking at the ima ges for nuance d structures in the vitreous bod y. Still, these findi ngs are very promising for a future deployme nt o f th ese models into cl inical practice, to reduce acquisition times and a ssist both clini cians and pa tients . Future work sho uld focus on expl oring these models mo re by trying to deve lop a qua ntitative metric that considers p ixel - wise , perceptual, an d ana tom ical d ifferences betwee n generated image s a nd ground truth. Su ch evaluatio n fra meworks should explicitly q uantify the presen c e of newl y introduce d artefacts, as their detection is essential for ensuri ng the clini c al safety and reliability of these methods in practice. Some limitati ons in this study m ight be a ddressed with future work. First, the relative ly small sample size l imits the generalizability and statistical power of the findings, potentially reducing the robustness of mod el performance . Sin c e the dataset consisted exclusi v ely of heal thy subjects, the models may strugg le to generali s e to pathological cases (e .g., vitreoma cular traction synd rome, dia betic retin opathy) or to accurately reconstruct previously unsee n anatom ical a lterations, further limiting their a pplicability in cli nical scenarios i nvolving di sease. Second, emplo ying signa l averaging of ten ART10 ima ges to g enerate our true high -quality OCT imag e for trai ning instead of directly a cquiring a n ART100 might h ave red uced the den oising cap abilities o f the model s; that is, the quality o f the p seudoART10 0 i s li kely to b e lower than an original ART100. Third, it could be w orth exploring altern atives to the weighted signal averaging we proposed by i mplementing more so phistica ted and accurate ways o f detecting the motion a rtefacts in each ART10 before a veragi ng. Fou rth, ou r mo dels were trained on OCT i mages acqui red from t he same device (Hei delberg OCT Spectrali s) and might not gen erali se well when used on imag es from other de vices. The use of k -fol d cross -valida tion, as we ll a s testing the mod els o n a larger externa l dataset and performing a more extensive h yperparameter tuning, mi ght also help in achie v ing more robust an d g eneralisa ble results . Furthermore, t he impl ementation o f more rece nt techniques to sp eed up the image g eneration process in the diffusion model , such as the denoising d iffusion implicit mo del (DDIM), coul d po tentially improve the sa mpling speed wi thout compromising image qual ity. 47 More recen tly, Durre r et al . emplo y ed a varian c e-pre s erving no ise sch ed ule a nd re construction lo ss es that enabled th eir 3 D wavelet cDDPM to g enerate high -quality images for h eal thy tissue inpain ting with just two timesteps d uring inference, paving the way for extremel y fast and accu r ate medical imag e generation . 48 R egarding the visual Turing tests, the numbe r of participa nts in t he seco nd t est was lo wer t han i n t he f irst test, bu t still in line with some othe r work. Co mpared to typical medical on line surveys, the response rates of the co nducted visua l Turing tests (4 .3% for t he first test , and 1.7% for the secon d test) were wi thin the a verage ran ge between 1 to 6.3% of co mparab le medi cal surveys. 49 For instance, Bayhaqi et al. l et se ven experts evaluate the quality o f denoised OCT i mages o f p igs ob tained from both a U -N et and a ResNe t mo del. 17 Belle m o e t al. le t four clinici ans evaluate the clinical relevance of their mode l o utputs for e nhancing the ch oroid in SD -OCT images. 50 In the latter w ork, in addition to the fool rate, they let cl inicia ns measure choroidal thickness, a rea, volume, and vascularity inde x from b oth original images and generated o nes, to then compute th e correlations between the measure m ents. 50 For future wo rk, it would be in ter esting to include a simila r approach to have q uantitative measurements or seg mentations of the most relevant a natomical fea tures i n the images. Al so, let ting clini c ians evaluate real hi gh- quality OCT images and AI -gen erated versi on s separately in a random order (i. e., not one after another) instea d of visualising both i n the same question (as it was i n Section 2 of our second visu al Turing test) could be an idea to let them focus only on a sing le image at a time and pote ntially provide a more detailed and i ndependent e valuation of anatomi c al prese rv ation for each image. Conclusio ns This study inco r porated for the first time diff usion models into a comparison of deep learning mode ls for e nhancing the quality of SD vitreous OCT ima ges. We showed that the most common qua ntitative metrics for e valuating the p erformance of each model ( i.e., PSNR , SSIM, MSE, LPIPS) can ge nerate very different results; thus, focusing on a subset of them can be misl eading. Furthermore, non e o f the q uantitative metrics stron gly correla ted wi th the e valuati on given by o phthalmologists . The mismatch observed between image similarity metrics and clinical ev aluations indicates that stand ard performanc e measures may not full y reflect clinical relevance o r usability, l acking a n e valuation of ana tom ical prese rv ation that is essen ti al for potential ly deploy ing the method into cl inical practice. In a ddition, the introduction of artefacts , such a s hallu cinated or distorted vi tre ous structures , or the obscuratio n of importan t ana tomical features, shoul d b e ca ref ull y asse ssed . should be care fully assessed . If these a rtefacts a re not pro perly iden tified, they cou ld co mpromise the method’ s cl inical applicability. Based o n the cli nical evaluation, the cDDPM se ems to be a promisi ng ge nerativ e model for ge nerati ng clinically re levant, high-quality vitreous OCT images tha t preserve ke y anatomi c al features a nd red uce acqui sition time . Speci fically, u nder current exp erimental con ditions, the co nditiona l diffusio n model led to al most a 4x speedup in generati ng a hi gh-qual ity reti nal OCT image , which could poten tially benefit both ophthalmologists a nd patients . On the follow-u p d ataset, the cD DPM achieved higher si milarity to ART10 0 wi thin the vitreous r egion than true ART1 and ART10 B- scans. The good performance of the model w hen genera ti ng high -quality vitreous OCT image s starting from ART1 B-scans rather than ART10 B-sca ns suggests that future work co uld further re duce acq uisition time whi le ma intaining compa r able image quality. Acknowledgements The researchers wo uld like t o thank all the partic ipants w ho volunteered for this study. Stateme nts and Declarations Data A vailabil ity State ment : The da tasets acqui red and /or an alysed during the current study will be ma de publicly available fro m the co rresponding author . Any reus e of the data must appropriately acknowledge a nd cite t his article . Code Ava ilabi lity Sta tement : The code used wil l be made avai lable from the correspondi ng author. Any reuse of the code must app ropriately a ck nowledge an d ci te this article . References 1. Fujimoto JG, Pitris C, B oppart SA, Brezinski ME. Optical Coherence Tomography: An Emer ging Tech nolo gy for Biom edical Imag ing a nd O ptical Biopsy. Neopla sia N Y N . 2000;2(1- 2):9-25. 2. Forrester JV, Dick AD, McMenamin PG, R oberts F, PhD EP BSc. The Eye: Bas ic Sciences i n Practice . Else vier Health Sciences; 201 5. 3. Spaide RF, Valmaggia P, Maloca PM. IMAGING THE VITREOUS WITH A NOVEL BOOSTED OPTI CAL COHE RENCE TOMOGRAPHY TECHNIQUE: Pos terior Vitreous Detach ment. Retina Phila Pa . 2 022;42(8):1425 -1432. doi:10. 1097/IAE.0000000000003500 4. Spaide RF, Valmagg ia P, M alo ca PM, Scholl HPN, Otto TP, Caujolle S. IMAGING THE VITREOUS WITH A NOVEL BOOSTED OPTICAL C OH ERE N CE TOMOGRAPHY TE CHNIQUE: Vitreous Degen eration and Cisterns. R etina Phila Pa . 20 22;42(8):1433 -1441 . doi:10.1097/IAE.0000000000003474 5. Schmitt JM, Xiang SH, Yung KM. Speckl e in opti cal coherence tomography. J Biomed Opt . 1999;4(1):95 -10 5. d o i:10.1117/1.429925 6. Zhang X, Li Z, Nan N, Wang X. Denoising a lgo rithm of OCT i mages via sparse representation based on noise estimation an d global d ictionary. Opt E xpress . 2 022;30(4):5788 -5802. doi:10.1364/OE.447668 7. Szkulmowsk i M, Wojtko wski M. Averaging techn iqu es for OCT i maging. Opt E xpress . 2013;21(8):9757-9773. do i:10.1364/OE.21.009757 8. Baumann B , Merkle C W, Lei tgeb RA, et al. Signal averaging imp roves signal - to -n oise i n OCT images: B ut which approach wo rks best, and when? Biomed Opt Expr ess . 2 019;10(11):5755- 5775. do i:10.1364/BOE.10.005755 9. Ozcan A, Bilen ca A, Desjardins AE, Boum a BE, Tearney GJ . Speckle reduction i n optical coheren ce t omography i mages u sing d igital filtering. J Opt Soc Am A Opt I mage Sci V is . 2007;24(7):1901-1910. 10. Li W, Zou J, Meng N, Fang Y, H uang Z . Evaluation of di fferent denoising algorithms for OCT image denoising. 2020;11553:115532T. doi:10.1117/1 2.2575240 11. Li u H. OCT im age denoising based on Bayesian n on -local mean fil ter and deep learning network. 2023;12707:127070G. doi:10.1117/12.26813 19 12. Shi F, Cai N, Gu Y, et al . DeSpecNet: a CNN -bas ed m ethod for speckle redu ction in retinal optical coherence tomography i mages. Phys Med B iol . 2019;64(17):175010. doi:10.1088/1361 -6560/ab3556 13. Qiu B , Huang Z, Liu X, et al. Noise r eduction i n optical coherence tomography i mages u sing a d eep neur al network wi th perceptu ally-se nsitive los s function. Biomed Opt E xpress . 2020;11(2):817 -83 0. d o i:10.1364/BOE.379551 14. Kugelman J, Alonso-C aneiro D, Read SA, C oll in s MJ . A revi ew of gen erative adversarial network applications in optical co herence tomography image analys is. J Optom . 2022;15:S1 - S11. doi:10.1016/j.optom.2022.09.004 15. Li M, Idoughi R, Choudhury B, Heidrich W. Statistica l model for OC T i mage denoising. Biomed Opt Express . 2017;8(9 ) :3903-3917. doi: 10.1364/BOE.8.003903 16. Wu W, Tan O, Pappuru RR, Duan H, Huang D. Assessm ent of frame -averaging algorithms i n OCT im age analysis. Ophthal mic Surg L ase rs I maging Retin a . 2013;44 ( 2):168 -175. doi:10.3928/23258160 -20130313- 09 17. Bayhaqi YA, Hamidi A, Canbaz F, Navarini AA, C attin PC, Zam A. Deep -Learning-Bas ed Fast Optical Coherence Tomography (OC T) Image Denoising for Sm art Laser Osteo tomy. IEEE Trans Med Imag ing . 2 022;41(10):2615 -2628. doi:10.1 109/TMI.2022.3168793 18. Yan Q , Chen B, Hu Y, et al . Speck le reduction o f OCT via super resolution reconstruction and its application on ret inal l ayer seg mentation. Art if Inte ll Me d . 2020;106:101871. doi:10.1016/j.artmed.2020.101871 19. Fri edrich P, Frisch Y, Cattin PC. Deep Gene rative Models for 3D Medical Image Synthe sis. arXiv . Preprint posted onl ine October 2 3, 2024. doi:10 .48550/arXiv.2410.17664 20. Ho J, Jain A, A b beel P. Denoising Diff usion P robabilisti c Mo dels. arXiv . Preprint posted online December 16, 2020. doi:10.48550/arXiv.2006.11239 21. Wolleb J, Sa ndkühler R , B ieder F , Val maggia P, Cattin P C. D i ffusion Models for Implicit Imag e Segmentat ion Ensembles. arXiv . Prepri nt pos ted on line Dece mber 2 7, 2 021. doi:10.48550/arXiv.2112.03145 22. Dur rer A, Woll eb J, Bi eder F, et al. Diffusion M odels for Contrast Harmonization o f Magnetic Resona nce Images. arXiv . Preprint pos ted online March 14 , 2 023. doi:10.48550/arXiv.2303.08189 23. Dur rer A, C attin PC , Wolleb J . Denoising Diffusion Models for I npainting of Healthy B rain Tissue. arXiv . Prepri nt post ed online Oct ober 23, 2024. doi:10.48550/arX iv.2402.17307 24. Sanqian L, Ri sa H, Huazhu F, Hen g L, Jingxuan N, J iang L. Conten t -Preservi ng Diffusion Mode l for Uns upervi sed AS -OCT image Despeckling. arXiv . P repri nt p ost ed onl ine June 30, 2023. doi:10.48550/arXiv.2306.17717 25. Luo J, Yang L, Li u Y, et al. Revi ew of di ffusion m odels a nd its app lication s in b iomedi cal informatics. BMC Med Infor m Decis Mak . 2025;25:390. doi:10.1186/s12911 -025-03210-5 26. Goodfellow IJ, Pouget-Abadi e J , Mirza M , et al. Generative Adversarial Networks. arXiv . Preprint posted onl ine June 10 , 2014. doi:10. 48550/arXiv. 1406.2661 27. Ronneberger O , Fische r P, Brox T. U -Net: Convolutional Networks f or Biomedical Image Segmentat ion. arXiv . Prepri nt post ed online May 18 , 2 015. d o i:10.48550/arXiv.1505.04597 28. Isola P, Zhu JY , Zhou T, Efros AA. Image - to -Image Tra nslation wi th C onditional Adversarial Networks . arXiv . Prepr int poste d online November 26 , 2018. doi:10.48550/arXiv.1611 .07004 29. Higaki A, Kawada Y, Hi asa G, et al. Using a Vi sual T uri ng Test to Evaluate the Realism of Generat ive Adver sarial Network (GAN)-Based Synthesized Myocardial Perfusion Images. Cureus . 2022;14 (10 ). doi:10.7759/cureus.30646 30. Jang M, B ae H j in, Kim M, et al. Image Tur ing test and its applications on synthetic ch est radiographs by using the progressive growing generat ive adversarial network. Sci Rep . 2023;13(1):2356. doi:10.1038/s41598- 023-28175-1 31. OpenCV: Morpholog ical Tran sformations. Access ed March 24, 2025. https://docs.open cv.org/4. x/d9/d61/tutorial_ py_morphol ogical_ops.html 32. Nichol A, Dhariwal P. Improved D enoising Di ffusion Probabilistic Models . arXiv . Preprint posted on line February 18 , 2021. doi:10.48550/arXiv. 2102.09672 33. Li B, Xue K , Liu B, Lai YK. BBDM: Image- to -image Transla tion wi th B rownian Br idge Diffusion Models. arXiv . Preprint posted onl ine March 23, 2 023. doi:10.48550/arXiv .2205.07680 34. Lee E , J eong S, Sohn K. EBDM: Exemp lar-guided Ima ge Translation wi th B rownian -brid ge Diffusion Models . In: Vol 1507 1. 2025:306 -323. doi:10 .1007 / 978 -3-031-72624-8_18 35. Saharia C, Cha n W, Chan g H, et a l. P alette: Image - to -Image Diff usion Mo dels. arXiv . Preprint posted on line May 3, 2 022. doi:10.48550/arXiv.2111.0 5826 36. Yu J, Li X, Koh J Y, et al. Vector-q uantized Image Mo deling wi th Imp roved VQGAN. arXiv . Preprint posted onl ine June 5, 2022. doi:10.485 50 /arXi v.2110.04627 37. Lee CH, Liu Z , Wu L, Luo P. MaskGAN: Towards Di verse and Interact ive Facial Ima ge Manipulation. arXiv . Prepri nt pos ted online April 1, 2020. doi:10.48550/arXiv.1907.11922 38. Wang Z, B ovik AC, Sheikh HR , Simoncel li E P. Image qual ity assessment : from error visibility to structural similarity. IEEE Trans Image Proces s . 2004;13(4):600 -612. doi:10.1109/TIP.2003.819861 39. Zhang R, Isola P, E fros AA, Shechtman E, Wang O. Th e Unreasonable Effectiveness of Deep Features as a Perceptual Metric. arXiv . Preprint posted online Ap ril 10, 2018. doi:10.48550/arXiv.1801.03924 40. Mei X, Liu Z, Robson PM, et al. R adImageNet: An Open Radiolog ic Deep Le arning Research Dataset for Effective Tran sfer Le arning. Radi ol Artif Intell . 2 022 ;4(5):e210315 . doi:10.1148/ryai.210315 41. Project-MONAI/tutorials . Published online March 24, 2025. Access ed March 2 4, 2025. https://github.com/Project-MONAI/tutorials 42. C huquicusma MJM, Hussein S, Burt J, Bagci U. How to Fool Radiologists wi th Generative Adversarial Networks? A Visual Turing Test for Lung Ca ncer Diagnosis. arXiv . Preprint po sted onl ine January 9, 2018. doi:10.48550/arXiv.1710.0976 2 43. C hen SY, Feng Z, Yi X . A g eneral introducti on to adj ustment for multiple comp arisons . J Thorac Dis . 2 017;9(6):1725 -1729. doi:10.2 1037/jtd.2017.05.34 44. Schindelin J , Arganda-Carreras I, Frise E, et al. Fiji: a n open-source platform for biological- image anal ysis. Nat Methods . 2012;9(7):676 -682. doi:10.1038/nmeth.2019 45. Wolleb J, Bieder F , Sandkühler R , C attin PC. Diff usion M odels for Medical Anomaly Detect ion. arXiv . Prepri nt poste d online October 5, 2 022. doi:10.48550/arXiv.2203.04306 46. Halupka KJ , Antony B J, Lee MH, et al . Retinal opti cal coherence tom ography im age enha ncement via deep lea rning. Biomed Opt Express . 2018;9(12):6205. doi:10.1364/BOE.9.006205 47. Song J , Meng C , Erm on S. Denoising Diffusion Imp licit Models. arXiv . Prepr int p osted online October 5, 2022. d o i:10.48550/arXiv.2010.02502 48. Dur rer A, Bieder F, Friedr ich P, Menze B, C att in PC, Kofler F. fastWDM3D: Fast and Accurate 3D Healthy Tissue Inpainting. In: Mukhopa dhy ay A, Oksuz I, Enge lha rdt S, Mehro f D, Yuan Y, eds. De ep G enerative Mode ls . Springer Nature Switzer la nd; 2026:171 -181. doi :10.1007/978- 3-032 - 05472-2 _17 49. Knapova L, Sm ahel D, Dedkova L, Matyas V. Comparing Nonresponders and R espon ders of Online Intercept Surveys: A Large-Sca le Ex perim ent al ICT Securi ty-R ela ted Study. Hum Behav Emerg Tech nol . 2 022;2022(1):3107621. doi:10. 1155/2022/3107621 50. Bellemo V, Ku mar Das A, Sr eng S, et al. Opti cal coherence tom ography choroidal enha ncement u sing generat ive deep learning. Np j Digit Med . 2024;7(1 ):115 . doi:10.1038/s41746-024 -01119-3 51. Ki rillov A, Mintun E, Ravi N, et al. Segment Anything. arXiv . Preprint posted onl ine Ap ril 5, 2023. do i:10.48550/arXiv.2304.02643 52. Segment Anythi ng | Me ta AI. Acces sed Oct ober 28 , 2025. https://segment - anything .com/dem o 53. Vente C de , Is lam MM, Valmagg ia P , Ho yng C, Tufa il A, Sánchez CI. Conditi oning 3D D iffusion Models wi th 2D Images: To wards Standardized OC T Volumes through En Fa ce -In formed Super-R esol ution. arXiv . P repri nt posted online October 1 3, 2024. doi:10.48550/arXiv.2410.09862 54. Pinsky MA, Karlin S. 8 - Brownian Motion and Related Process es. In: Pinsky MA, Karlin S, eds. An Introduction to Stochastic Modeling (Fourth Editi on) . Academic P ress; 2011:391 -446. doi:10.1016/B978 -0- 12 -381416 -6.00008-3 55. x uekt98. xu ekt98/BBDM. Published online June 2 6, 2025. Accessed June 30, 2025. https://github.com/xuekt98/BBDM 56. j unyanz/pytorch-CycleGAN-a nd-pix 2pix: Image- to -Image Translat ion in PyTo rch. Accessed March 24, 2025. https://github.com/junyan z/pytorch -C ycleGAN-and-pix2pix 57. GenerativeModels/tutorials/g enerative/2 d_vqgan at main · Project- MONAI/Gen erativeModels. Accessed June 30 , 2 025. https://github.com/Project - MONAI/Gen erativeModels/tree/main/tutorials/generative/2 d_vqgan 58. Dhariwal P, Nicho l A. Diffusion M odels Bea t G ANs on Image Synt hesis. arXiv . P reprint post ed onl ine June 1 , 2021. doi:10.48550/arXiv.2105. 05233 Supp lementary Material 1 Denoising diffusion pro babilistic models are a class of ge nerative models based on a parame ter ised Markov chain, which co nsists of two p arts: an iter ative forw ard diffusion process an d a learned reverse pr ocess . 20 The forward process f or a given image – in our case, a p seudoART100 – is defi ned by the Markov chain : (1) With fixed forward variance s and an id entity matrix . During this process, the pseudoART100 is transformed i nto pure Gau ssian no ise by injecting at each timestep, from 1 to , Gaussi an noise based on Equ ation 1. It follow s that the noisy version of t he pseudoAR T1 00 can be com puted as , (2) where . In the reverse proce ss , a neu ral network i s trai ned to reverse the forward process and iteratively predict the slightly denoised image from for . Follo wing p revio us work, the correspon ding input AR T10 image , denoted as , wa s conca tenated to channel -wise, and the con catenation was then f ed into the model. 21 –23,35 The reason for the concatenatio n was to provide additional informatio n to help the model reconstruct an enhanced den oised vitreous OCT image, which prese rv ed the anatomical features of the conditioning input ART10, instea d of just ge nerating a n ew synthe ti c pseu doART100 i mage from the learned pro bability distribution. The model was t rained to minimi se t he MSE loss (3) between the predicted noise and the Gaussian noise that was added to when computing . During infere nce, at ea ch reversed timestep f rom t o , a sligh tly denoised version of the pseud oART100 was computed as (4) until we got the final denoised image , where repre sents the ra ndom component of the process and is the model ou tput at t imestep . The model architecture is based on the D DPM for se gmen tation used in the MONAI Genera tive tutorial. 41 Si nce we exp erienced a n intensity shift in the gene rated images whe n directly p r edicting the noise , fol lowing De Vente e t al ., we trai ned the mode l to predi ct the velocity . 53 Spe cifically, the i nput was still , and the mod el output at timestep wa s . On the other hand, the BBDM ai ms at learning a st ochastic Brownian br idge between the starting point (p seudoART100) and the e nding point (ART10) thro ugh a bidi r ectional diffusion process. 33,54 The main di fference w ith re spect to the cDDPM i s that the diffusion process of the BBDM is p erformed in the latent space of a pre -trained VQ -GAN. Moreove r, sin ce the la tent repre sentation o f the ART10 is the en ding point of the b ridge, inference starts from there inste ad o f from pu re Gaussian noise (i.e., ). In this way, it is no t necessary to guide the d enoising process by concaten ating the ART10 at each timestep a s in the cD DPM . In the BBDM, Equation 2 become s: (5) where , and is the va riance of the forward distribution. Since the di ffusion p rocess i s performed in the laten t space, Eq uation 5 invo lves the latent representations of both , deno ted as , and , de noted as . The model is then trained to pre dict the noise by minimising the f ollo wing loss function: (6) During inferen ce, the process starts from the lat ent represen tation of the ART10 , and it is accel erated b y reducing the number of timesteps , a s w ith de noising d iffusion impli c it models. 47 The fin al output at t imestep 0 i s the latent representati on of the fi nal denoised ima ge, which is then de coded ba c k i nto the ima ge space throu gh the decoder o f the pre -train ed VQ-GAN. Our impleme ntation of the BBDM is base d on the GitHub repo s itory of the original paper. 55 To b etter u nderstand the p otential o f these approaches for e nhancing the q uality of vitreous OCT images , the two diffusion models are compared with other well -kn own CNN s and GANs: a residual-att ention U-Net with the sa me architecture as the one in the improved cD DPM from OpenAI (excep t for the timestep e mbeddi ng) is used as CNN, wh ereas the default a rchitectures o f Pix2 Pix and VQ -GAN are e mployed as GANs. 56 – 58 Pix2Pix is a conditional GAN that learns a mapping from paired images using a U -Net ge nerator and a PatchGAN di sc rimina tor. 28 The two co m ponents are trained in an adversarial manner: t he gen erator learn s t o produ ce high -quality, real istic image s as similar as p ossible to the ground tru th to fool the discriminator, while the discriminator le arns to d istinguish between real and ge n erated images. VQ -GAN combines a GAN architecture w ith vector qu antisation. 36 The model learns a di scret e latent repre s entation of t he den oised image, wh ich is t hen mapped back to the im age domain through a de coder. In o ur ca se, the train ing procedure for both models consists of gi ving as input a n AR T10 i m age a nd generating ou tput images that minimi s e a combina tion of adversa rial loss, mean a bsolute error ( i.e., ) loss, a nd percep tu al l oss with re spect to the gro und truth. Pi x2Pix wa s trai ned b y u sing i ts original GitHub repository, whe reas the VQ-GAN w as train ed using the tutorial in side the MONAI Generative repo sitory. 41,56 Supp lementary Material 2 Figure 12. E xamp le question f rom S ection 2 of the second Visual Turing Test. In this section , a tota l of ten questions were asked, where e ach of th em consi sted of four sub - qu estions related to the preservation of ana tomical structures inside th e vitreous body (Panel a, on the left), a nd fiv e s u b -q uestions related to t he preservation o f ot her relevant a natomical struct ures in the e ye ( Panel b , o n the right), such as the optic ner v e disk and the retinal la yers. W hen answer ing “ No” , t here was t he chance to sele ct a sub - option “No : not p re s ent in the image” to speci fy w hether the a natomical feature was not pre sent i n either the r ea l or gener ated image . The pre s ervation of an anatomical fe atur e was computed as the percentage o f posi tiv e answer s, th at is, the perc en t age of “Yes ” a nswers a nd “No: not p resent i n the image” answers for the c orresponding sub -question. Supp lementary Material 3 Figure 13 . Correlation m atrix between quantitative metrics and avera ge scores fro m the first visual Turing test. Blue va lues in dica t e negative co rrelation, red va lu es indicate positive correlation. The dar k er the colour, the stronger the magni tud e of the correlation.
Original Paper
Loading high-quality paper...
Comments & Academic Discussion
Loading comments...
Leave a Comment