Image-based ground distance detection for crop-residue-covered soil
Conservation agriculture features a soil surface covered with crop residues, which brings benefits of improving soil health and saving water. However, one significant challenge in conservation agriculture lies in precisely controlling the seeding dep…
Authors: Baochao Wang, Xingyu Zhang, Qingtao Zong
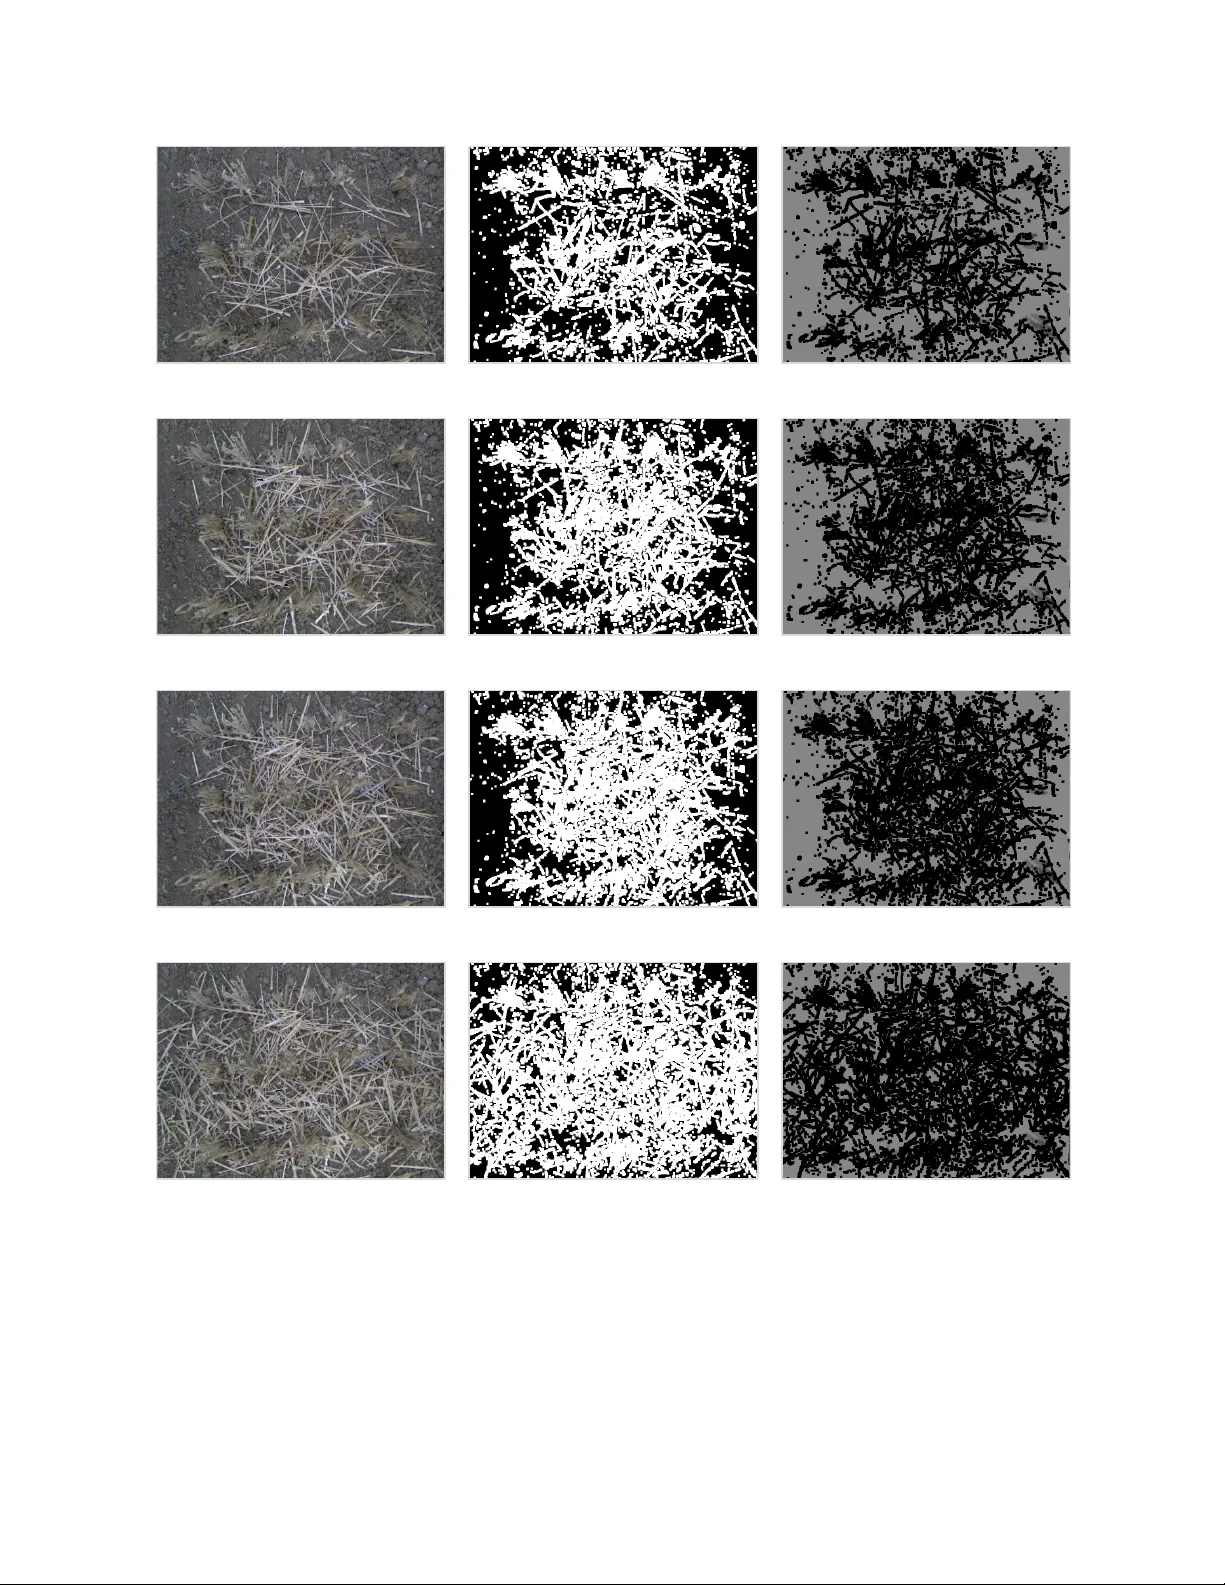
Im age- based g round d istance det ection for crop - res idue - cove re d soil Baochao WANG a, * , Xi ngyu ZHANG a , Qingtao Z ONG a , Al im PULATOV b , Shuqi SHANG a , Dongwei WANG c a College of Mechani cal and Electri cal Engineeri ng, Qingdao Agri cultural U niversity, Qi ngdao 266109, China b Natio nal Re sear ch U niver sity “Tas h kent I nstit ute of Ir rigatio n a nd A gric ultura l Me ch aniza tion Engineers”, Ta shkent, 1 00000, Uzbe kistan c Yel low River Delta Intellige nt A gricultura l Machinery Equipme nt Industr y A cadem y Abstract Conservation agriculture features a s oil surface covered with crop res idues, which brings benefits of improving soil health and saving water. However, one significant challenge in conservation agriculture lies in precisely controlli ng the seeding depth on the s oil cove red with crop residues. This is cons trained by the lac k of gro und distance information, since current distanc e measurem ent techn iques, like laser, ultrasonic, or mechanical di splacement sensors, ar e incapable of differentiating whethe r the dis tan ce in formation comes from the res idue o r the soil. This paper presents an i mage - based method to get the g round dista nce in formation for the crop - residues - covered soil. This method is per formed with 3D camera and R GB camera, obtaining depth image and color ima ge at the s ame time . The color ima ge is us ed to distinguish the different areas of residues a nd soil and finally generates a mask image . T he mask i mage i s applied to the depth image so that only the soil area de pth inform ation can be used to c alculate the ground distance, and residue areas can be recognized and e xcluded from ground distance de tection. Experimenta tion shows that t his distance m easuremen t meth od is feasible f or real - time impleme ntation, a nd the measurement error is within ±3mm. It can be applied in conservation agriculture machinery for precision depth seeding, as well as othe r depth - control- demanding applications like t ransplant or tillage. Keywo rds : 3D vision; distance detec tion; crop residue - covered f ield; precision agriculture . 1. Introduc tio n Conservation agricul ture technique has the char acteristics of min imal soi l disturbance an d crop residues remaining on the soil s urface, and the soil sur face cover ed with crop residues ha s mult iple adv antages such as water saving , soil c ons ervation and ecological p rotection (Zhou et al.,2020; Deng et al.,2022; Wen et al.,2023; Jahangi rpour et al.,2023; Zhang et al.,2024) . However, no- till and stubble m ulch can have an impact on some ope rations of the agr iculture machine, such as crop residues affecting ground distanc e mea surement and as sociated de pth control, thus traditional planters cannot achieve precision de pth s owing. For traditional agricultu r al mach inery, the re are two primary adjustable depth setting str ate gi es. Th e f ir st i s a pre ssur e - based control strategy. In thi s approach, constant depth s etting could be accomplis hed by relying on the constant downward for ce generated by a hydraulic or electr ic actuat or . For instance , models like J ohn De ere 1725C and LEMKEN Solitair 9 follow this appro ach ( John Deere,2024; LEMKEN ,2024) . Ho wever, this kind of depth control is indirect and can be in fluenced by various factors such a s soil ty pe, soil mois ture, resi du es and other par ameter s ( Jing et al.,2020 ; Virk et al.,2021 ) . The sec ond depth setting strategy for traditional agricultural machiner y r elies on sensor measurem ent. Sensor s s uch as ultr asonic, laser, or other ty pes can be used. This app roach offers a m ore direct meas urement of the depth compared to the p ressure - bas ed control strategy. However, the above downward- fo rce - bas ed and sens or - based appr oaches cannot work well in conservation agriculture where the soil surface is covered with crop r esidues . For the downward- force - based depth adjusting technique s , it is only suitable for pre - cultivat ed seedbeds, and i n the case of soil surf aces with residues, the force generated by pressing on the residues cannot ref lect the relations hip with depth. The s ensor - based depth a djusting te chniques als o encounter a simila r problem. Laser and ult rasonic sens ors cannot distinguis h the distance mea sured from the soil or residue in conse rvation agricultu re. As a result, they a re not s uitable fo r conservation ag riculture either . Mor e specifi cally , existing depth determination strategy based on s ensor meas urement mainly includes two types: direc t ground distan ce measurement and indirect g r ound distance measurem ent. The direct ground distance measurement method use s laser, ultr asonic and optical s ensors to measur e the distance dir ectly (Søgaard 1998; Kia ni et al.,2010; W en et al.,2014; Sharipov et al.,2018; Mapoka et al ., 2019; Machleb et al. ,2020; L i et al.,2023; Ye et al.,2023) . LEE e t a l. designed a de tection unit for a till age depth contro l by ins talling optical and ultrasonic sens ors on a tract or to measure grou nd distance (LEE et al .,1998) . VAN DE R L INDEN et al. developed a depth sens or based on infrared laser t r iangul ation to measure the distance bet ween the machin ery frame and the ground in real - time, validated throug h experiments to be unaffected by soil structure and sunlight (VAN DER L INDE N et al .,2008) . Suo mi and Oks anen measured the relat ive di stance between the f rame and the soil surface by installi ng ultrasonic sens ors on the frame (Suomi and Oksanen,2015) . NIELSEN et al. developed a me asurement s ystem using ultrasonic s ensors to measure t he distance b etween the frame and the ground (NIELSEN e t al. ,2017) . Moham madi et al. used infr ared sens ors and ultrasonic sens ors to measure the dis tance change of soil surface at different dr iving s peeds, the results s howed that the infr ared sensors can quickly measure c hanges in soil surface distance , while ultrasonic sens ors are inaccur ate (Mohammadi et al.,2023) . NIE LSEN et al. us ed a position sens or combine d with an ultrasonic sensor to meas ure the furr owing depth of the plow blade (N IELSEN et al .,2018) . The indirect ground distance me asurement is ca r ried out us ing mechanical geometric relationships and mec hanical displace ment sensors mounted on machines (J IA et al . ,2016) . J I A e t al. calculat ed the tillag e depth b y measuring th e an gle between t he impl ement and the swin g arm (JIA et a l.,2016) . MOUAZ EN et al. developed a pe ndulum - type sensor that calculat es the relative distance to the gr ound by meas uring the dista nce between the f rame a nd the whe el axle (MOUAZE N et al., 2004) . However, the above study cannot work well in cons ervation agriculture where the soil surf ace is covered with cr op r esidues . Because t h e existin g measurem ent met hods are u nable t o distinguish the inf luence of crop residue from tha t of the s oil. (LEE et al.,1996; MOUAZEN e t al.,2004; Saeys et al . ,2004) . S aeys et al . showe d tha t on the ground where there is a corn crop, the ultrasonic sens or's signal is reflected f rom the c orn crop rather than f rom the g round ( Saeys et al.,2004) . Thus, facing the exis ting problems o f detecting ground dis tance in conse rvation agriculture, this paper has propos ed a solu tion with the ab ility to distinguis h the dis tance information from the soil or crop residues. This method is performed with 3D came ra and RGB camera, obtaining depth image and color image at the same time. The dist ance information of a large area is obtained by the 3D cam era. The color image is used to d i stinguish the dif ferent areas of res idues and soil and fin ally gen erates a mask. Th e mask is applied t o t he depth image so that only the soil area depth inf ormat ion can be used to calculat e the ground distance, and residue ar eas can be recogni zed and excluded from ground distance detection. 2. Materials and M et hods 2.1 G eneral p rinciple an d me thod The schemati c diagr am of the propos ed method is s hown in Fig . 1 . T he ground distance is obtained from images ac quired by 3D cameras and RGB cameras. The 3D camera image acquir es distance image inc luding distance inf ormation , and t he RGB camer a acquir es the color image. T he two im ages are pr ocessed and al igned . T hen , the color image is us ed to distinguish the crop - residue and the ground for gener at ing a bina ry mask . T h e mask is then applied to the depth image, and finally the ground d istanc e info rmation af t e r remov ing the crop residue in flu ence can be calculated. Fig. 1 G round dista nce de tection schematic di agra m 2.2 Hardware configuration The hardware includes 3D camera, RGB camer a, a nd I ndustr ial PC (I PC). The 3 D camer a is Basler Blaze -101 , t h e RG B cam era used is Bas ler Aca1 300 -75gc . T he two cameras are RGB Camera 3D Camera RGB Image Depth image Image Acquisition Image Alignment Col or S e gm e nt a t i on Binary Mask Depth image without crop residue influence Subtract Felid D istance without crop residue influence Cro p - residues - cove red soil Image Segmentation combined together with a plastic frame, as shown in Fig . 2 . T he I P C is Beckhoff C 6030-0060 . The key par ameter s of the hardw are ar e shown in Table 1 . Tabl e1 K ey param eter s o f hardwar e components Name Va l u e 3D C amera Bas ler B l aze -101 Depth informa tion ac quisition princip le T ime of f ligh t (TO F ) W orking ra nge 0.3~10m I nterfac e GigE Resolution 640×480 Accura cy ( typ ical ) ±5mm(0.5~ 5. 5 m ) Field of V ie w 67°×51° Illumina tion VCSEL, 940n m Fram e R ate 20fps(d efault ) 30fps(f ast mode) RGB Ca mer a I nterfac e GigE Resolution 1280×1024 Sensor Format 1/2" Effectiv e Sen so r Diag onal 7.9 mm Fram e R ate 88fps(fa st mode) 81fps(norma l mode) IPC Beckhof f C 6030 CPU Inte l i7 -7700 , 3.6 GHz, 4 cores Eth ernet 4×100/1000BASE-T Opera ting system W indows 10 IoT Ent erpris e C amera i nt egrat i on D imen sion (W ×H× L) 140×81× 63 mm Fig . 2 Camer a com bin ati on 2.3 D e p t h image acquisition and processin g The working principle of a 3D Time of flight (TO F) camera is to calcula te the dis tance between t he measured object and the camera b y m easuring the time differ ence from the emission of a light pu lse to i ts reflection back to the camera . A 3D camera is ca pable of providing two types of images : an optical ima ge that is derived from th e intens ity of light, and a distance image which is generat ed based on t he distan ce calculated fr om the flight time of light . Th e f irst step is t o pro cess t he di stance image acquir ed by 3D camera , in order to get depth image only including vertical ground d istanc e info rmation . In the mono colo r image obtaine d by the 3D cam era, each pixel of fers a 16 - bit gray val ue that spans from 0 to 65535 , representing the ori ginal d istance ( encompassing the x, y, and z directions) between t he camer a and the targ et . F or our application, it is required to us e t h e vert ical distance (the distance only includes z direction). Thus, a cal culati on is required to ge t depth image f rom original image, as in eq ( 1 ). 22 1 1 offset zg z u cx v cy ff µ = ×× − −− ++ ( 1) where g is the pixel gray va lue; μ is the scale factor between g ray value and real d istance , which is 0.0229 f or the used cam era ; u is the absciss a size of depth image, ranging from 1 to 640 for the used camera; v is the ordinate s ize of de pth image , ranging from 1 to 480 fo r the used camera; f is the f ocal length of 3D camera , which is 509 .935 pixels for the used camera ; cx is th e absci ssa of the opt ical cent er , which is 313.05 for the u sed c amer a ; cy is the o rdinate of the optical cent er , which is 239.60 f or the used camera ; offset z is the z - axi s of f set f or compens ating the dis placement between t he inter nal sensor plane and the camer a mountin g s urf ace , which is 23. 97mm for the used camera . 2.4 Image alig nment Because t he resolu tion of 3D cam era and RGB ca mer a is dif fer ent, it is necessary to al ign RGB image and depth image before image proces sing. The coordinate system s of diffe rent images are converted to the same by Fo rmula (2~5), so th at the same pixel positions of RGB image an d the dept h imag e are in corres pondence. [ ] M RT = (2) 1 dc W K MK − = (3) 14 ( , ) 11 12 13 (, ) xy xy w u xw yw w z = + ++ (4) 24 ( , ) 21 22 23 (, ) xy xy w v xw yw w z = + ++ (5) w here M is the external pa rameter mat rix; R is the rotation mat rix; T is a t ranslatio n matrix ; K d is the int ernal param eter m atri x of 3 D camer a; K c is the internal parame ter matrix of RGB camera; u is the abscissa of t he optical center in RGB image; v is the ordinate of th e optical ce nter in RGB image; x is the abscis sa of the o ptical center i n depth image; y i s the ordinate of the o ptical center in depth image . M , K d a nd K c a re obtained by the camera calibration method proposed by Zhang (Z hang,2000) . T h e im ages bef ore an d after alignmen t are shown in Fig . 3 . (a) Origin al RGB image ( b) Aligned R GB imag e (c) Depth i mag e (o pti cal imag e by light dens ity ) (d ) Depth im age ( gray v alue image by distan ce ) ( e ) Dept h i mag e represen ted in t he form of po int cloud Fig . 3 RGB imag e befo re and after al ig nm ent 2.4 Image segmentation and c o mbinatio n After alignment, t he image segmen tatio n is perfor med to rem ove the image ar eas influenced by crop residue s , so as t o generate a bin ary mask to remo ve crop residu e infl uence. T he process involves several steps such as color segmentation, binarization, dilation operation, subtraction operation. After these ste ps are completed, the final output is the de pth image w ithout the influence of crop residue s covering. Firstly, thr ough implementing di fferen t color thres hold s in the RG B image , gr ound and crop re sidues can be effect ively separ ated. Secondly, the R GB image with the crop residues remo ved is binarized to generate a mask. Subsequently, the binarized mask is applied to the depth image for subtracting the area influenced by the c r op residues. Finally, the ground dis tance value is computed bas ed on the process ed depth image. Fi g. 4 (a) gives orig inal RGB i mage . F ig . 4 ( b) is the depth image after r emoving the covering crop residues . Th e black part in Fi g. 4 ( b) is the ar ea of covering cr op residues , and the gray part is the verti cal ground distance information. B y comparing with RGB image in Fig . 4 (a ), it can be seen t hat the image segm entati on meth od can reali ze the separat ion of th e ground and the covering crop r esidues , and thus effectively ge tting ground distance information . (a) RGB Image (b) Dep th im age aft er rem oval of res id ues (c) Dept h i mag e after r emov al o f residues ( in form of point c loud) Fig . 4 I mag e processing res u l ts 3. Res ults The proposed ground distance detection method is ev aluated ex peri mental ly by static te st, dynami c test an d fi eld test . 3.1 Static test To verify the feasibility and to evaluate accur acy of the p roposed ground distance dete ction method, an experimental rig for sta tic test was first ly set up, as s hown in F i g. 5 . I n the experiment rig, t he complex ground environment f or conservation agricultur e is emulate d with wheat s tubble and mulching . Th e static tests wer e perf or med with div erse case s in which t he r esid ues coverag e levels wer e dif fer ent. Fig . 5 Ground dista nce mea surement test diagra m unde r static condi tions In t he fir st case (CASE A) , the s oil is configured o nly with stubbles . The configur ation for CASE A is shown in Fi g. 6 ( a) , w her e the stubb le height is around 60~70mm. Fi g. 6 (a ) al so presents the a ctual ground distance that was meas ured with the measuring tape, which i s around 518.0 mm. Fi g . 6 ( b) shows the ground distance detection result by the proposed method after removing the cover ing , which is 517 .2 mm. Com pared with the actual dis tance (518 .0 mm ), the error is within 1mm . T hi s resu lt pr eliminarily dem onstrating the feasibility of the ground distance detection method. (a) Configuration and a ctual dis t ance (b) Ground distance dete ction r esults Fig . 6 Ground dista nce de tection results for C AS E A Base d on CASE A, subs equent cas es (CASE B ~E) are conducted by adding more c rop residues without disturbing the soil, so the a ctual ground distance could remain the sa me. The key intermediate r esul ts f or CASE A~E ar e s h ow n i n F i g. 7 . I n Fi g. 7 , it c an be observed that fo r different levels of coverage, the p roposed method h as the ability to distinguish betwe en the residue and the ground. Even the g round area is decreasing with mo re residue coverage, the method can provide enough da ta to calculate the g r ound dis tance. The drawback lies in the fact that once the ground is entirely covered, the ground distance cannot be calculate d effectively. However, in the context of c onservation agriculture, the shape and p hysical characteristics of the mulching are s uch that it is ha rdly poss ible for the surface t o be fully covered. E ven if some local ar eas are fully covered in extreme , the invalid f rames can be ignored. With the motion of the whole ma chine, the s oil surf ace distance can al so be detected. Consequently, the method proves to be effective fo r distance cal culatio n . (a) CAS E A (b) C AS E B (c) CAS E C (d) C AS E D (e) CAS E E Fig . 7 Int erm ediat e key resul t s fo r dif fe re nt ca se s (F rom le ft to r igh t: RGB image , Bin ary mask , De pth image af ter re moving the r esidue influenc e) The f inal result s f or CAS E A~ E ar e summa rize d i n T able 2 . F r o m T able 2 , it can be observed the detected ground distance ma ximum e rror is 2 .2 mm . In terms of statis tics , t he average error i s - 1.66 mm, the standard deviation of the e rrors in the detection results is 0 .523 mm, and the 95% confidence interval o f the e rrors is [-2.319, -1.001]. Giv en the diameter of a s ingle wheat straw is often above 5mm , after s tacking to gether, the total residu e thicknes s is us ually more than 20mm, so the error a round 2mm could indicate feasibility and per formance of the propose d method of removing crop residue. On the other hand, the possible ca use of the slight v ariation erro r in different cases may also come f rom the f act that the soil sur face i s not per fect ly fl at, after the cr op residue cov ers diffe rent ar ea i n differ ent cases, t he rest o f th e soil ar ea could be differen t and could cause variations. Table 2 Gr ound distanc e detect io n under di fferent amount of residue Dis tan ce det ecti on r esul t s mm A ctual di st ance mm Error mm CAS E A 517 .2 518 -0.8 CAS E B 516.4 -1.6 CAS E C 516.2 -1.8 CAS E D 516 .1 -1.9 CAS E E 515.8 -2 .2 3.2 Dynamic test T o verify the performan ce of the propose d method in real - time, a circu lar experi mental platform was established. Th e cameras ar e fixed on the st ationar y f rame and the cir cular experimental platform was ro tated by four moto rs. On the ro tatin g circular p l a tf o r m, a layered soi l structure with 20mm, 40mm, 60mm and 80mm thick ness w a s constr ucted . T he total length of the layer ed so il structure is 4000mm. The experiment setup is s hown in F i g. 8 . During di ffere nt cases for t he test, di fferent amou nt of wheat s traw is spread on the soil layer to simulate the complex g round sur f ace in cons ervation agriculture . The camer a is placed at a position of 455 mm from the bot tom of the ci rcular experi ment platf orm , and the ground distance change is det ected in r eal time by the RGB a nd 3D camera s using the proposed method , and the detected ground distance vs. time is shown in follo wing fi gures. 1. 3D Cam era and RGB Camera 2. Cir cula r e xpe rime ntal p latfo rm 3. D C power sup ply 4. I PC 5. The layere d soil structur e Fig . 8 Exp erim ent ri g for of dynamic tes t Fi g. 9 presents the dynamic testing configuration and results of two case s with di fferent quantities of crop res idue. The distribution of crop residue s for CASE F and CASE G is shown in Fig. 9 (a ) and Fig. 9 (b) respectivel y . The r esults a re shown in Fig. 9 (c) . In Fi g. 9 (c) , the red curve stands for the original ground distance detecte d prior to s preading the res idue, whereas the black and blue curves denote the detected g round distanc e after spreading the residues . From F i g. 9 (c) , it is observed that the wavef orm s are qui te similar , w it h the e rror being within 2mm , and there is a ph ase delay among differen t cur ves. T he delay is mainly ca used by the fact that our experiment platform is driven by fou r induc tion motors with open loop c ontrol, a nd the speeds cannot be exactl y the same i n each test. Th e consistency of th e three curves val idates the feas ibility of the p rop osed method in real - time . (a) C ase F : sparse st raw distr ibution (b) C AS E G : th in straw dis tri bution (c) G round distance detect io n res ults Fig . 9 G round dista nce detec tion for s mall amount of c rop residue covera ge To further explore the pe rformance with thick cov erage of residues, all the residues we re collect ed and gr aduall y incr eased on the 20mm - thick soil layer for test with large amount residue condition, as shown in Fig.11 (a ) a n d Fi g.11(b) . The dete cted ground dis tance is s hown in Fig.11 (c) . From F ig. 10 (c) , i t can be seen th at the th ree cur ves are in consi stent before 7.5s and the err or is within 1mm. The error start to incr eases after 7.5s, and t he maximum erro r is 3mm compared with the case without crop residue. The caus e for err or is a lso discus sed in following paragraph. (a) CAS E H : thick st raws d istr ibut ion (b) C AS E I : muc h thick stra w di stribution (c) G round distance de tection result s Fig. 10 G round d i stance dete ction for lar ge amount of crop r esidue cove rage (a) D iam eter of a single straw (b) Thickness o f res idu e cov erage Fig. 11 F ea sibility pr oof f rom m eas urem ent of straw an d res id ue cov erage T he error is not from the crop residue , since a sin gle str aw diameter is more than 3mm and the residu e cover t hi ckn ess i s about 22 mm , a s shown in Fig. 11 . As analy zed befo re, this result may come f ro m the fact that the soi l surface is not perf ectly flat , after the crop residue cover s dif feren t area i n differ ent cases, the rest o f th e s oil ar ea could be differe nt and could caus e variations. T he results indicate that the method i s f easible and s table for distance detec tion under dif feren t levels of wheat straw coverage. 3.3 Field test The ground distanc e detection method i s applied to a depth-c ontrol led pl anter which is designed for conservation agricultu re , the test environment is shown in Fi g. 12 ( a) . F i g. 1 2 (b) presents t he actual distance f rom the camera to t he groun d, measured with the measuring t ape, which is approximately 585.0mm. Fi g. 1 2 (c) sho ws RGB image in the R OI acquired by the color camera. F i g. 1 2 ( d) shows original depth image in the ROI, which is pr esented in t he form 3D poin t cloud by post p rocessing tool. F i g. 1 2 (e) shows t he depth image af ter removing the influence of residues, and the ground distance detection result b y the proposed method is 583. 4mm. C ompared with the measured distance ( 5 85 .0mm), the er ror is 1 .6 mm. Fig. 12 (f ) shows the depth image after removing residue s in the form o f point cloud, it can be s een some loca l area s are not fully removed. (a) T he field test environment (b ) Configuration a nd a ctual dis t ance (c ) RGB i mage i n ROI (d ) Depth im age in ROI shown in t he form of po int c loud (e) Depth image afte r removing residues (f) Depth image af ter re moving residues ( by point cloud) Fig. 12 Ground d i stance de tection of the planter using t he method in this pape r Conc lusio n s (1) A novel Image - based method for detecting the ground distance of soil covered with crop residues has been proposed . It has ove rcome th e limitations of c onventional g round distance meas urement method s, which lac k the ability to distinguish the distan ce from the so il or the re sidu es. (2 ) T he fusion of in for mati on from 3D and R GB cameras enab les effective m easuremen t, eliminating the influence of crop residues and achieving accurate ranging in complex soil surface environments. (3 ) T he method is experimentally validated under both static , dynamic and field conditions. The results demonstrate that the propose d approac h can effectively detect ground distance in complex ground environments , the error cloud be less tha n 3mm . (4) On e limitation is that when the covering is ove r l y thick to the extent that the ground become s comple tely invis ible , the ground distanc e cannot be meas ured. However, the phys ical characteristics of the res idues along with the move ment cause d by machinery make such a situation quite r are. Besides, th e full y covered im age frames can also be ignor ed. (5 ) T his method make s it possible to achieve precis e depth contro l in the complex so i l conditions of conservation agriculture in the future. It can be applied to various types of machinery, including those use d for sowing, ti llage, transplanting, and so on. This method has the potential to contribute to the deve lopment of precision agr icult ure and susta inable agriculture. Ackno wle dge m ents This research was supported by the National Key R &D Program of China (Grant No. 2022YFE0125800) , Shandong Provincial Natur al Science Foundation, China (Grant No. ZR2021ME018), as well as Collaborative Innova tion Center for Shangdong ’ s M ain cro p Production Equipment a nd M echanization ( SD X TZX - 22 ). Any views, findings, conclus ions or recommendations express ed in this publication are those of the author . R efer ence s Deng X, Yang Q, Zhang D, et al. Applica tion of conse rvation tillage in China: a method to improve climate resilience[J]. Agronomy, 2022, 12(7): 157 5. Jahangirpour D, Zibaei M. Farme rs' Preferences in Adopting Conservation Tillage Systems Considering Ris k Attitudes in Bakhtegan B asin[J]. J. Agric. Sci , 2023, 25: 6. Jia H , Guo M , Yu H, et al. An adaptab le tillage d epth mo nitoring system for tilla ge machine [J]. Biosys tem s Engineering, 2016, 151: 187 - 199. Jing H, Zh ang D, Wang Y, et al. Develop ment and perfor mance eval uation of an electro -hydraulic downforce control sys tem for planter row un it[J]. Computers and E lectronics in Agriculture , 2020, 172: 105073 . John Deere. 1725C Planter . Available f rom: https ://www.deere.com/e n/planting - equipment/1725c- planter/ [Accesse d 15 Nov. 2024]. Lee J, Yamazaki M, Oida A, et al. N on - contact s ensors for distance mea surement from ground surface[J]. Journal of Terramechanics, 1996, 33(3 ): 155 - 165. Lee J, Yamazaki M, Oid a A, et al . Electr o - hyd raulic tillage de pth control sys tem for rotary implements mounted on ag ricultural tractor Design and respons e experiments of control system[J]. Journal of Ter ramechanics , 1998, 35(4): 229 -238. LEMK EN. Solitair 9 Pneuma tic Seed Dr il l. Available from: https ://lemken.com /en - en/agr icult ural - machines/sowing / seed - drills/p neumatic - see d - drills/s olitair -9-1 [A cce sse d 15 Nov. 2024]. Li H, He J, Wang C , et al. Research Progress on the Deve lopment of the Planter Unit f or Furrowing Control and the Depth Me asurement Technolog y[J]. Applied Sciences, 2023 , 13(21) : 11884. Kiani S, Kamgar S , Raoufat M . Automatic on - lin e depth control of seeding units us ing a non - contacting ultrasonic se nsor[J]. International Journa l of Natural and Engineering Science s, 2010, 6(2): 39 -42. Mapoka K O M, Birrell S J, Tekeste M. A co mprehensive survey of nondestructive sens ing technologies for the detection of corn s eeds in a closed trench and mea suring planting depth to augment the conventional method[J]. Computers a nd electronics in agricultu re, 2019, 158: 249 -257. Mouaze n A M, Anthonis J, Sae ys W , et al. An automatic depth control s ystem fo r online measurement of spatial variation in soil compaction, Part 1: Sens or design for measurement of frame height variation f rom s oil surface[J]. Bio sys tems Engineering, 2004, 89(2): 139 - 150. Mohammadi F, Maleki M R , Khodaei J. Laboratory evaluation of i nfrared and ultrasonic range - finder sensors for on -the- go measurement of soil surface roughness [J]. Soil and Tillage Rese arch, 2023, 229: 105678. Machleb J, P eteinat os G G, K ollend a B L, et al. S ensor - ba sed mechani cal weed cont rol : Pr esent state and prospe cts[J]. Computers and electronics i n agr iculture, 2020 , 176: 105638. Niels en S K, Munkholm L J, L amandé M, et al. Seed d rill instrumentation fo r spatia l coulter depth measurements [J]. Computers and Electronics in A griculture, 2017, 141: 207 - 214. Nielsen S K, Munkholm L J , La mandé M, et al . Seed dri ll depth c ontrol sys tem for precision seeding[J]. Computers and elec tronics in Agricultu re, 2018, 144: 174 -180. Suomi P, Oksanen T. Automatic w orking depth c ontrol for see d drill using ISO 11783 remote con tr ol messa ges[ J] . Computers and Electron ics in Agriculture, 2015 , 116: 30 -35. Sharipov G M , Paraforos D S , Gr iepentrog H W . Implementation of a magnetorheological damper on a no - till see ding assembly for optimising s eeding depth[J]. Computers and electronics in agriculture, 2018, 150: 465 -475. Søgaard H T. Automatic control of a finger w eeder with respect to the harrowing inte nsity at varying soil structures[J]. J ournal of Agricultural E ngineering Resea rch, 1998, 70(2): 157 - 163. Saeys W, Mouazen A M, Antho nis J , et al. A n automatic depth control s ystem fo r online measurement of spatial variation in s oil compactio n, part 2: Modelling of the depth contr ol system[J]. Biosys tems engineering, 2004, 89(3): 2 67 - 280. Van der Linden S, Mouaze n A M, Anthonis J, et al. I nfrar ed laser sensor fo r dept h measur ement to improve depth control in intra - row mechanical weeding[J]. Biosyste ms engineering, 2008, 100(3): 309 -320. Wen L, Fan X, Liu Z, et al . The design and development of the p r ecision planter sowing depth control system[J]. Sensors & Transduc ers, 2014, 1 62(1): 53. Wen L, Peng Y, Zhou Y, et al. Effects of conservation tillage on s oil enzyme activities of global cultivate d land: A meta - anal ysis[ J] . Journal of E nvironmental Management, 2023, 345: 118904. Ye S, Xue X, Sun Z, et al . R esearch and Expe rime nt on Soybean P lant Identification Bas ed on Las er Ranging Sensor[J]. Agronomy, 2023, 13 (11): 2757. Zhang W, Yu Q , Tang H, et al. Cons ervation tillage ma pping and moni toring using r emote sens ing[J]. Computers and Electronics in Agricult ure, 2024, 218: 108705. Zhan g Z. A flexibl e new techn ique f or cam era cali brat ion[ J]. IEEE Trans actions on Pattern Analysis a nd Machine Intelligence, 2000, 22(11): 1330 –1334. Zhou D, Li M, Li Y, et al . Detection of ground s traw c overage under c onservation tillage based on deep learning[J]. Computers a nd electronics in agric ulture, 2020, 172: 105369.
Original Paper
Loading high-quality paper...
Comments & Academic Discussion
Loading comments...
Leave a Comment