DeepVIS: Bridging Natural Language and Data Visualization Through Step-wise Reasoning
Although data visualization is powerful for revealing patterns and communicating insights, creating effective visualizations requires familiarity with authoring tools and often disrupts the analysis flow. While large language models show promise for automatically converting analysis intent into visualizations, existing methods function as black boxes without transparent reasoning processes, which prevents users from understanding design rationales and refining suboptimal outputs. To bridge this gap, we propose integrating Chain-of-Thought (CoT) reasoning into the Natural Language to Visualization (NL2VIS) pipeline. First, we design a comprehensive CoT reasoning process for NL2VIS and develop an automatic pipeline to equip existing datasets with structured reasoning steps. Second, we introduce nvBench-CoT, a specialized dataset capturing detailed step-by-step reasoning from ambiguous natural language descriptions to finalized visualizations, which enables state-of-the-art performance when used for model fine-tuning. Third, we develop DeepVIS, an interactive visual interface that tightly integrates with the CoT reasoning process, allowing users to inspect reasoning steps, identify errors, and make targeted adjustments to improve visualization outcomes. Quantitative benchmark evaluations, two use cases, and a user study collectively demonstrate that our CoT framework effectively enhances NL2VIS quality while providing insightful reasoning steps to users.
💡 Research Summary
This paper presents “DeepVIS,” a novel framework that integrates Chain-of-Thought (CoT) reasoning into the Natural Language to Visualization (NL2VIS) pipeline to address the critical transparency issue in automated visualization generation. While LLMs show great potential for translating analytical intent expressed in natural language into visualizations, existing methods operate as black boxes. This opacity prevents users from understanding the rationale behind design choices and makes refining erroneous or suboptimal outputs difficult. DeepVIS tackles this by making the intermediate reasoning steps explicit, interpretable, and actionable.
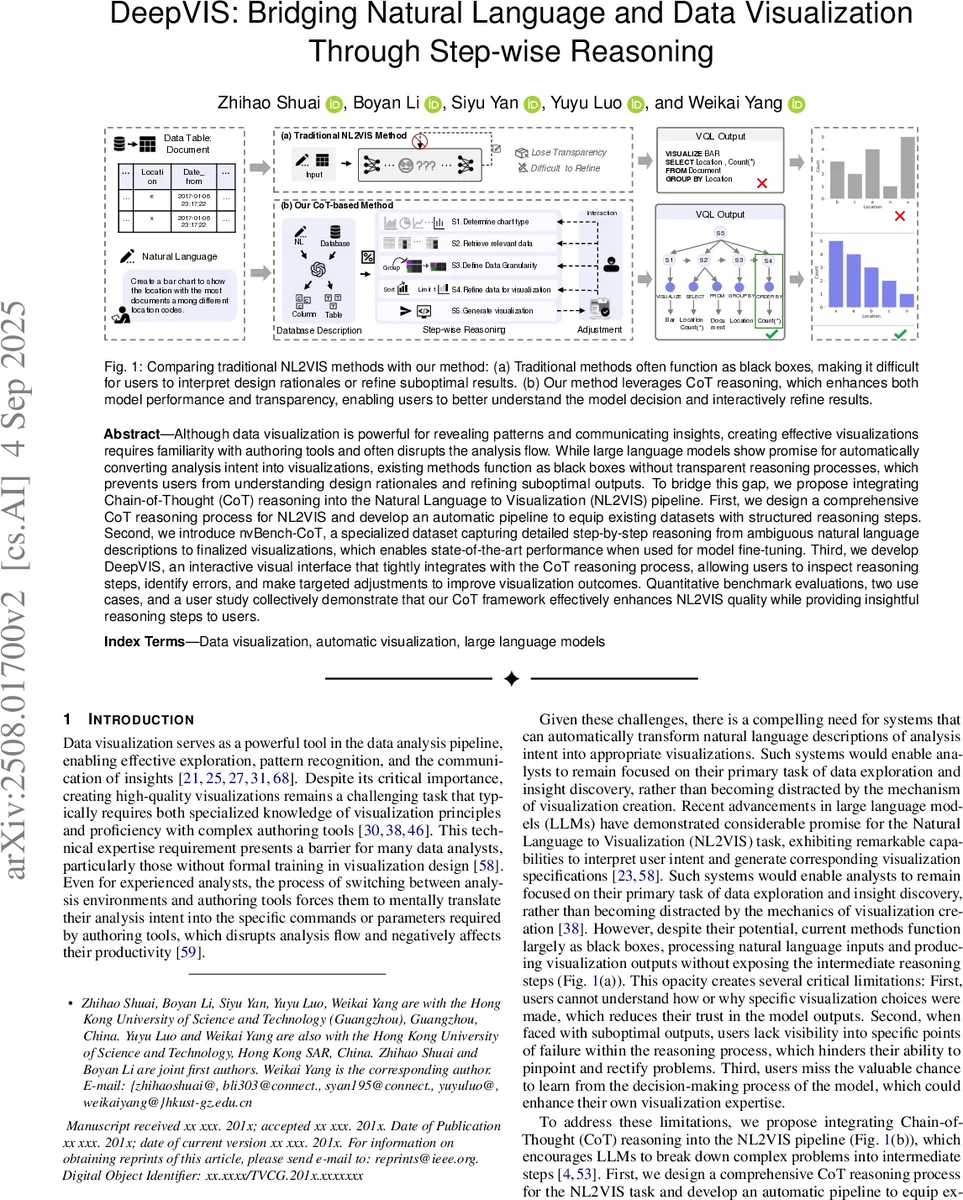
The core technical contribution is the design of a comprehensive, five-step CoT process specifically tailored for NL2VIS. Informed by visualization literature and expert interviews, the process decomposes the task into sequential stages: determining the chart type (S1), retrieving relevant data columns (S2), defining data granularity (S3), refining data for visualization (e.g., aggregation, sorting) (S4), and generating the final visualization specification or code (S5). This structured reasoning mirrors an expert’s workflow and provides a scaffold for the model to follow.
To enable the learning of this reasoning process, the authors developed an automated pipeline to augment existing NL2VIS datasets with detailed CoT steps. They applied this pipeline to the nvBench benchmark, creating a new dataset called “nvBench-CoT.” This dataset contains not only natural language queries and corresponding visualization outputs but also the structured reasoning chain that connects them. Fine-tuning state-of-the-art models on nvBench-CoT led to superior performance on standard NL2VIS benchmarks, demonstrating that learning to reason step-by-step directly improves generation accuracy.
Beyond algorithmic improvement, the paper introduces the DeepVIS interactive visual interface, a practical system that embodies the CoT philosophy. The interface visually presents the entire reasoning chain (S1-S5) alongside the generated visualization and the source data table. Each reasoning step is displayed with its conclusion (e.g., “Chart Type: Bar chart”) and, crucially, offers interactive controls (like dropdown menus) that allow users to inspect and modify the model’s decision at that specific step. For instance, if the model incorrectly chose a line chart, the user can change step S1 to “bar chart,” and the subsequent steps and final visualization update automatically. This enables “targeted adjustment” without requiring the user to rewrite the original query or understand the underlying code.
The framework is rigorously evaluated through quantitative benchmarks, in-depth use cases, and a controlled user study (N=12). The benchmark results confirm the state-of-the-art accuracy of the CoT-fine-tuned model. The user study, comparing DeepVIS against a traditional black-box interface, provides compelling evidence for the benefits of transparency. Participants using DeepVIS were significantly better at identifying the root cause of errors in flawed visualizations, more efficient and effective at correcting them, and reported higher levels of trust, understanding, and learning. The use cases further illustrate how the system handles ambiguity and enables iterative refinement through human-AI collaboration.
In summary, this work makes three key contributions: 1) a principled CoT reasoning design for NL2VIS, 2) the nvBench-CoT dataset to foster research in explainable NL2VIS, and 3) the DeepVIS interactive system that operationalizes CoT for end-user transparency and control. It successfully bridges the gap between the power of automated visualization generation and the need for interpretability and user agency, marking a significant step towards more collaborative and trustworthy human-AI data analysis tools.
Comments & Academic Discussion
Loading comments...
Leave a Comment