Graph Neural Networks Based Anomalous RSSI Detection
In today’s world, modern infrastructures are being equipped with information and communication technologies to create large IoT networks. It is essential to monitor these networks to ensure smooth operations by detecting and correcting link failures or abnormal network behaviour proactively, which can otherwise cause interruptions in business operations. This paper presents a novel method for detecting anomalies in wireless links using graph neural networks. The proposed approach involves converting time series data into graphs and training a new graph neural network architecture based on graph attention networks that successfully detects anomalies at the level of individual measurements of the time series data. The model provides competitive results compared to the state of the art while being computationally more efficient with ~171 times fewer trainable parameters.
💡 Research Summary
The paper addresses the growing need for automated, fine‑grained monitoring of wireless links in large‑scale IoT deployments. Traditional anomaly detection approaches for link‑layer metrics either operate on handcrafted thresholds, classify whole links as anomalous, or work on fixed‑size windows that cannot pinpoint the exact time step of a fault. To overcome these limitations, the authors propose a two‑stage pipeline that (1) converts univariate RSSI time series into graphs using a Markov Transition Field (MTF) and (2) classifies each graph node (i.e., each time step) as anomalous or normal with a lightweight Graph Attention Network (GAT) architecture.
In the transformation stage, each RSSI sample becomes a node; the series is quantized into as many bins as the series length (300 in the experiments). Transition probabilities between bins are computed across all time steps, yielding a sparse MTF matrix that serves as the adjacency matrix of the graph. Edges are created for any non‑zero transition probability, preserving both temporal ordering and value similarity. This results in a dense graph with 300 nodes and several hundred edges per sample.
The classification stage employs a GAT‑based model consisting of three attention layers interleaved with linear skip‑connections. The first two GAT layers have four attention heads each, while the third uses six heads; all linear layers have 128 units. The architecture contains roughly 0.6 million trainable parameters—about 171 times fewer than the image‑based deep learning baselines (recurrence plot, GASF, GADF) used for comparison. ReLU activations are applied to hidden layers and a sigmoid output produces a per‑node probability of anomaly.
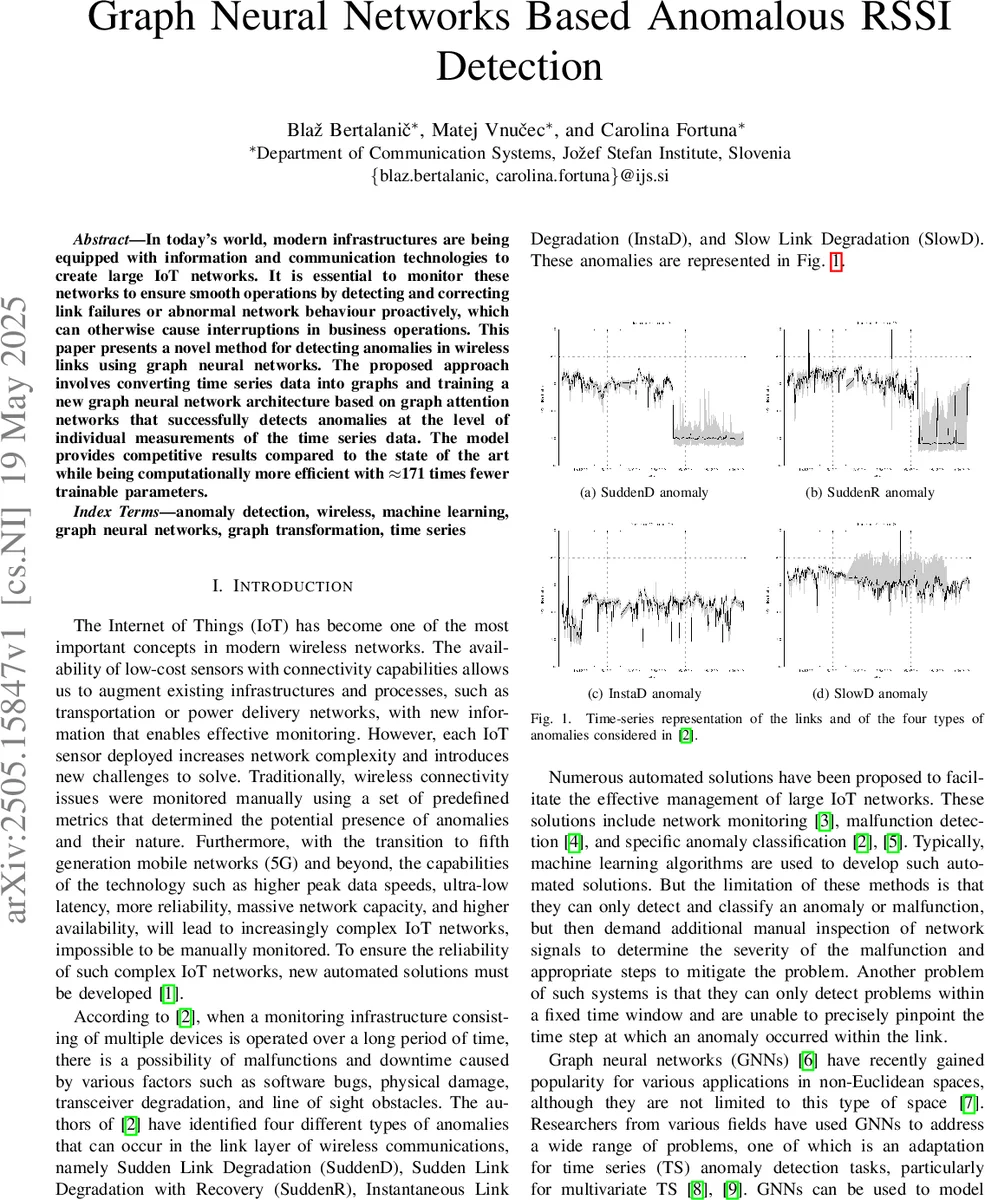
Experiments use the Rutgers WiFi dataset, which provides raw RSSI traces from 29 nodes under five noise levels. Four link‑layer anomaly types defined in prior work (SuddenD, SuddenR, InstaD, SlowD) are synthetically injected according to a prescribed schedule, yielding 8,492 samples (700 per anomaly type, 5,692 normal). The data are split using a stratified 10‑fold shuffle split (80 % train, 20 % test) with class‑weighting to mitigate imbalance. Performance is measured with precision, recall, and F1‑score, averaged over the ten folds.
Results show that the proposed GAT model achieves an F1‑score of 0.94 for binary classification, slightly below the recurrence‑plot model (0.99) and GASF model (0.98) but above the GADF model (0.91). For multi‑class classification (distinguishing the four anomaly types), the GAT model outperforms all three baselines, improving the best baseline by 0.01–0.04 in F1‑score. Importantly, because the model predicts at the node level, it can locate the exact start, end, and duration of each anomaly, enabling downstream actions such as targeted retransmission or adaptive routing, and even inference of the anomaly type based on temporal patterns.
The authors highlight three main contributions: (1) a novel time‑series‑to‑graph conversion that retains both temporal dynamics and value similarity, (2) a compact yet powerful GAT architecture that delivers state‑of‑the‑art detection performance with dramatically fewer parameters, and (3) per‑measurement anomaly labeling that provides precise localization and duration information, a capability lacking in prior work.
Future work is suggested in three directions: extending the approach to multivariate sensor streams, adapting the pipeline for online streaming scenarios where graphs must be constructed and classified in real time, and applying transfer learning to other wireless technologies such as BLE or LoRa. Overall, the paper demonstrates that graph‑based representations combined with attention mechanisms constitute an efficient and highly interpretable solution for fine‑grained anomaly detection in wireless IoT networks.
Comments & Academic Discussion
Loading comments...
Leave a Comment