A Note on the Prediction-Powered Bootstrap
We introduce PPBoot: a bootstrap-based method for prediction-powered inference. PPBoot is applicable to arbitrary estimation problems and is very simple to implement, essentially only requiring one application of the bootstrap. Through a series of ex…
Authors: Tijana Zrnic
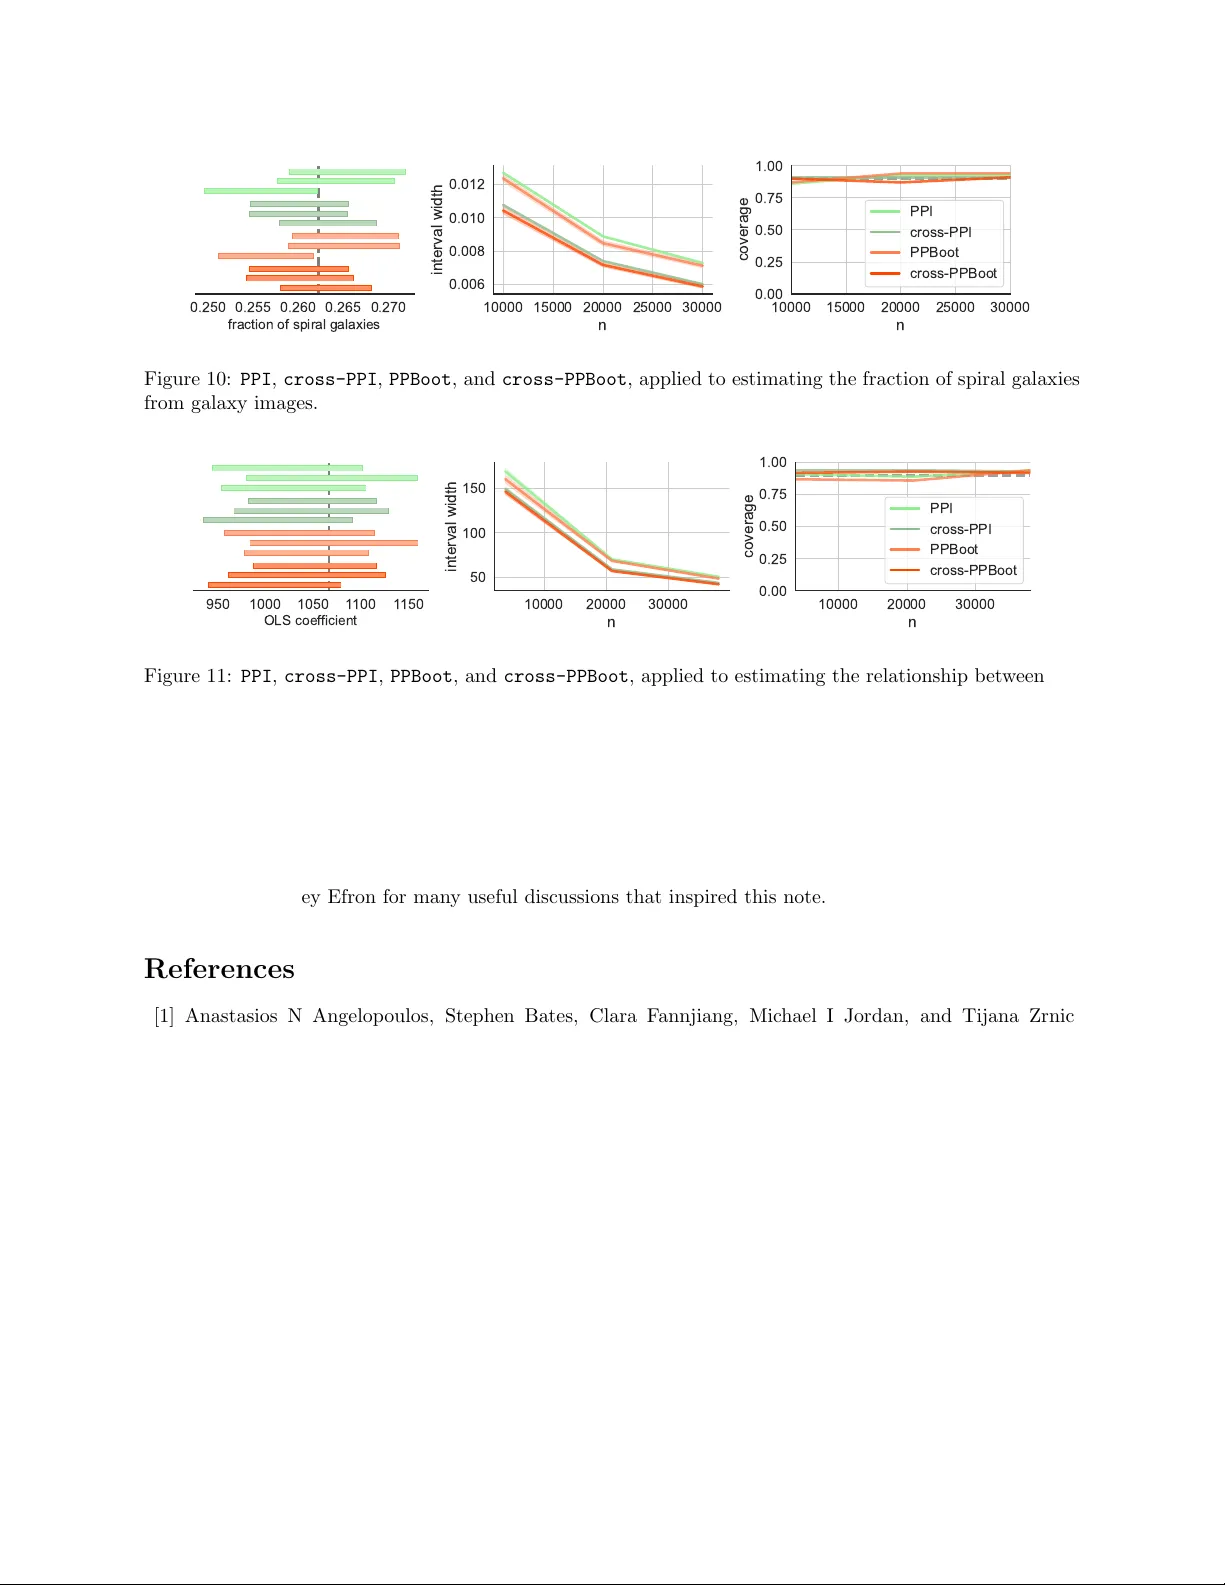
A Note on the Prediction-P o w ered Bo otstrap Tijana Zrnic Departmen t of Statistics and Stanford Data Science Stanford Univ ersity Abstract W e in tro duce PPBoot : a b o otstrap-based metho d for prediction-pow ered inference. PPBoot is appli- cable to arbitrary estimation problems and is v ery simple to implemen t, essen tially only requiring one application of the bo otstrap. Through a series of examples, w e demonstrate that PPBoot often p er- forms nearly iden tically to (and sometimes b etter than) the earlier PPI(++) metho d based on asymptotic normalit y—when the latter is applicable—without requiring any asymptotic characterizations. Given its v ersatility , PPBoot could simplify and expand the scop e of application of prediction-p o wered inference to problems where cen tral limit theorems are hard to prov e. 1 In tro duction Blac k-b o x predictive mo dels are increasingly used to generate efficient substitutes for gold-standard lab els when the latter are difficult to come by . F or example, predictions of protein structures are used as efficient substitutes for slo w and exp ensiv e exp erimental measuremen ts [3, 4, 8], and large language models are used to c heaply generate substitutes for scarce human annotations [5, 7, 14]. Prediction-pow ered inference ( PPI ) [1] is a recent framework for statistical inference that combines a large amoun t of mac hine-learning predictions with a small amoun t of real data to ensure sim ultaneously v alid and statistically p o werful conclusions. While PPI [1] (and its impro vemen t PPI++ [2]) offers a principled solution to incorp orating black-box predictions into the scientific workflo w, its scop e of application is still limited. The current analyses fo cus on certain conv ex M-estimators suc h as means, quan tiles, and GLMs to ensure tractable implementation. F urthermore, applying PPI requires case-by-case reasoning: inference relies on a central limit theorem and problem-sp ecific plug-in estimates of the asym ptotic v ariance. This mak es it difficult for practitioners to apply PPI to en tirely new estimation problems. W e introduce PPBoot : a b o otstrap-based method for prediction-p o wered inference, which is applicable to arbitrary estimation problems and is v ery simple to implemen t. PPBoot do es not require an y problem-specific deriv ations or assumptions suc h as conv exity . Across a range of practical examples, we show that PPBoot is v alid and typically at least as p o w erful as the earlier PPI [1] and PPI++ [2] metho ds. W e also develop tw o extensions of PPBoot : one incorp orates p ow er tuning [2], improving the p o wer of basic PPBoot ; the other incorp orates cross-fitting [15] when a go od pre-trained mo del for pro ducing the predictions is not av ailable a priori but needs to b e trained or fine-tuned. Ov erall, PPBoot offers a simple and v ersatile approach to prediction-p o w ered inference. Our approac h to debiasing predictions is inspired b y PPI(++) [1, 2], but differs in that our confidence in terv als are based on b o otstrap sim ulations, rather than a central limit theorem with a plug-in v ariance estimate. F urthermore, our approach enjoys broad applicabilit y , going b ey ond conv ex M-estimators. A predecessor of PPI , called p ost-prediction inference ( postpi ) [10], w as motiv ated b y inference problems in a similar setting, with little gold-standard data and abundant mac hine-learning predictions. Lik e our metho d, the postpi metho d also leverages the b ootstrap. Ho wev er, PPBoot is quite differen t and has pro v able guaran tees for a broad family of estimation problems. PPBoot is implemen ted in the ppi py pac k age. 1 Problem setup. W e ha ve access to n lab eled data points ( X i , Y i ) , i ∈ [ n ], dra wn i.i.d. from P = P X × P Y | X , and N unlab eled data p oin ts ˜ X i , i ∈ [ N ], drawn i.i.d. from the same feature distribution P X . The lab eled and unlab eled data are indep enden t. F or no w, we also assume that we ha ve a pre-trained machine learning mo del f that maps features to outcomes; w e extend PPBoot beyond this assumption in Section 4. Thus, f ( X i ) and f ( ˜ X i ) denote the predictions of the mo del on the lab eled and the unlab eled data p oin ts, resp ectiv ely . F urthermore, we use ( X , Y ) as short-hand notation for the whole lab eled dataset, i.e. X = ( X 1 , . . . , X n ) and Y = ( Y 1 , . . . , Y n ); similarly , f ( X ) = ( f ( X 1 ) , . . . , f ( X n )). W e use ˜ X, f ( ˜ X ), etc analogously . Our goal is to compute a confidence in terv al for a population-level quan tity of interest θ 0 . F or example, w e might b e interested in the av erage outcome, θ 0 = E [ Y i ], a regression co efficien t obtained by regressing Y on X , or the correlation co efficien t b et ween a particular feature and the outcome. W e use ˆ θ ( · ) to denote an y “standard” (meaning, not prediction-p o wered) estimator for θ 0 that takes as input a lab eled dataset. In other words, ˆ θ ( X, Y ) is an y standard estimate of θ 0 . F or example, if θ 0 is a mean o ver the data distribution, θ 0 = E [ g ( X i , Y i )] for some g , then ˆ θ could b e the corresp onding sample mean: ˆ θ ( X, Y ) = 1 n P n i =1 g ( X i , Y i ). Unlik e existing PPI metho ds, whic h fo cused on M-estimation, PPBoot do es not place restrictions on θ 0 and can be applied as long as there is a sensible estimator ˆ θ . 2 PPBo ot W e present a b ootstrap-based approach to prediction-p o wered inference that is applicable to arbitrary es- timation problems. The idea is v ery simple. Let B denote a user-c hosen n umber of b ootstrap iterations. A t every step b ∈ [ B ], we resample the lab eled and unlab eled data with replacemen t; let ( X ∗ , Y ∗ ) and ˜ X ∗ denote the resampled datasets. W e then compute the bo otstrap estimate for iteration b as θ ∗ b = ˆ θ ( ˜ X ∗ , f ( ˜ X ∗ )) + ˆ θ ( X ∗ , Y ∗ ) − ˆ θ ( X ∗ , f ( X ∗ )) , where ˆ θ is any standard estimator for the quan tity of interest. Finally , we apply the p ercen tile metho d to obtain the PPBoot confidence in terv al: C PPBoot = quantile { θ ∗ b } B b =1 ; α/ 2 , quantile { θ ∗ b } B b =1 ; 1 − α/ 2 , where α is the desired error level. W e summarize PPBoot in Algorithm 1. The v alidit y of C PPBoot follo ws from the standard v alidit y of the b o otstrap. The key observ ation is that θ ∗ b is a consisten t estimate if ˆ θ is a consisten t estimator: indeed, ˆ θ ( X ∗ , Y ∗ ) conv erges to θ 0 and ˆ θ ( ˜ X ∗ , f ( ˜ X ∗ )) − ˆ θ ( X ∗ , f ( X ∗ )) simply estimates zero due to the fact that the lab eled and unlab eled data follow the same distribution. F urthermore, not only is our estimation strategy consisten t, but it is also asymptotically normal around θ 0 when ˆ θ ( X, Y ) yields asymptotically normal estimates (such as in the case of M-estimation), under only mild additional regularit y . F or mathematical details, we refer the reader to the work of Y ang and Ding [12], who prop ose a similar estimator for av erage causal effects relying on this fact. The asymptotic normalit y implies that it would also b e v alid to compute CL T interv als centered at ˆ θ PPBoot = ˆ θ ( ˜ X, f ( ˜ X )) + ˆ θ ( X, Y ) − ˆ θ ( X, f ( X )) with a b ootstrap estimate of the standard error via θ ∗ b , though we opted for the p ercen tile b o otstrap for conceptual simplicit y . Many other v ariants of PPBoot based on other forms of the b ootstrap are p ossible; see Efron and Tibshirani [6] for other options. Algorithm 1 PPBoot Input: lab eled data ( X , Y ), unlabeled data ˜ X , mo del f , error level α ∈ (0 , 1), b ootstrap iterations B ∈ N 1: for b = 1 , . . . , B do 2: Resample ( X ∗ , Y ∗ ) and ˜ X ∗ from ( X, Y ) and ˜ X with replacement 3: Compute θ ∗ b = ˆ θ ( ˜ X ∗ , f ( ˜ X ∗ )) + ˆ θ ( X ∗ , Y ∗ ) − ˆ θ ( X ∗ , f ( X ∗ )) Output: C PPBoot = ( quantile { θ ∗ b } B b =1 ; α/ 2 , quantile { θ ∗ b } B b =1 ; 1 − α/ 2 ) 2 F urthermore, w e exp ect θ ∗ b to b e more accurate than the classical estimate ˆ θ ( X, Y ) if the the mac hine- learning predictions are reasonably accurate, since an accurate mo del f yields ˆ θ ( X ∗ , f ( X ∗ )) ≈ ˆ θ ( X ∗ , Y ∗ ), and thus the b ootstrap estimate is roughly θ ∗ b ≈ ˆ θ ( ˜ X ∗ , f ( ˜ X ∗ )). Since ˆ θ ( ˜ X ∗ , f ( ˜ X ∗ )) leverages N ≫ n data p oin ts, w e exp ect it to hav e far low er v ariability than ˆ θ ( X, Y ). 3 Applications W e ev aluate PPBoot in a series of applications, comparing it to the earlier PPI and PPI++ metho ds [1, 2], as w ell as “classical” inference, which uses the lab eled data only . T o av oid cherry-pic king example applications, w e primarily fo cus on the datasets and estimation problems studied b y Angelopoulos et al. [1]. T o show case the versatilit y of our metho d, we run additional exp erimen ts with estimation problems not easily handled b y PPI . F or no w, we do not use p o w er tuning in PPI++ ; we will return to p o w er tuning in the next section. Ov er 100 trials, we randomly split the data (which is fully lab eled) into a lab eled comp onen t of size n and treat the remainder as unlab eled. The confidence interv als are computed at error level α = 0 . 1. W e rep ort the in terv al width and cov erage av eraged o ver the 100 trials, for v arying n . T o compute cov erage, w e tak e the v alue of the quantit y of in terest on the whole dataset as the ground truth. W e also plot the in terv al computed by each metho d for three randomly c hosen trials, for a fixed n . W e apply PPBoot with B = 1000. Eac h of the following applications defines a unique estimation problem on a unique dataset. W e briefly describ e each application; for further details, we refer the reader to [1]. Galaxies. In the first application, w e study galaxy data from the Galaxy Zo o 2 dataset [11], consisting of h uman-annotated images of galaxies from the Sloan Digital Sky Survey [13]. The quantit y of interest is the fraction of spiral galaxies, i.e., the mean of a binary indicator Y i ∈ { 0 , 1 } which enco des whether a galaxy has spiral arms. W e use the predictions b y Angelopoulos et al. [1], which are obtained by fine-tuning a pre-trained ResNet on a separate subset of galaxy images from the Galaxy Zo o 2. W e show the results in Figure 1. W e observ e that PPI and general PPBoot hav e essentially identical interv al widths, significantly outp erforming classical inference based on a standard CL T in terv al. All methods appro ximately ac hieve the nominal co verage. AlphaF old. The next example concerns estimating a particular o dds ratio b et w een tw o binary v ariables: phosphorylation, a regulatory prop ert y of a protein, and disorder, a structural prop ert y . This problem w as studied b y Bludau et al. [4]. Since disorder is difficult to measure experimentally , AlphaF old [8] predictions are used to impute the missing v alues of disorder. F or the application of PPI , w e apply the asymptotic analysis based on the delta metho d provided in [2], as it is more p o werful than the original analysis in [1]. Figure 2 sho ws the p erformance of the metho ds. General PPBoot performs similarly to PPI in terms of in terv al width, though slightly worse. As exp ected, classical inference based on the CL T yields m uch larger in terv als than the other baselines. All metho ds ac hieve the desired cov erage. 0.20 0.25 0.30 fraction of spiral galaxies 500 1000 1500 n 0.025 0.050 0.075 0.100 interval width 500 1000 1500 n 0.00 0.25 0.50 0.75 1.00 coverage classical PPI PPBoot Figure 1: Classical inference, PPI , and PPBoot , applied to estimating the fraction of spiral galaxies from galaxy images. 3 1 2 3 4 odds ratio 200 300 400 500 600 n 1 2 3 interval width 300 400 500 600 n 0.00 0.25 0.50 0.75 1.00 coverage classical PPI PPBoot Figure 2: Classical inference, PPI , and PPBoot , applied to estimating the o dds ratio b et ween protein phos- phorylation and protein disorder with AlphaF old predictions. 5.0 5.5 6.0 median gene expression 2000 4000 6000 n 0.25 0.50 0.75 1.00 interval width 2000 4000 6000 n 0.00 0.25 0.50 0.75 1.00 coverage classical PPI PPBoot Figure 3: Classical inference, PPI , and PPBoot , applied to estimating the median gene expression with transformer predictions. Gene expression. Building on the analysis of V aishna v et al. [9], who trained a state-of-the-art transformer mo del to predict the expression level of a particular gene induced b y a promoter sequence, Angelop oulos et al. [1] computed PPI confidence interv als on quantiles that characterize how a p opulation of promoter sequences affects gene expression. They computed the q -quantile of gene expression, for q ∈ { 0 . 25 , 0 . 5 , 0 . 75 } . W e rep ort the results for estimating the median gene expression with PPBoot , though our findings are not substan tially different for q ∈ { 0 . 25 , 0 . 75 } . See Figure 3 for the results. W e observ e that PPBoot leads to substan tially tighter interv als than PPI : PPBoot improv es ov er PPI roughly as m uch as PPI improv es ov er classical CL T inference, all the while maintaining correct cov erage. Census. W e inv estigate the relationship b et w een so cioeconomic v ariables in US census data, in particular the American Communit y Surv ey Public Use Micro data Sample (ACS PUMS) collected in California in 2019. W e study t wo applications: in the first we ev aluate the relationship b et ween age and income, and in the second we ev aluate the relationship betw een income and ha ving health insurance. W e use the predictions of income and health insurance, respectively , from [1], obtained b y training a gradient-bo osted tree on historical census data including v arious demographic co v ariates, suc h as s ex, age, education, disability status, and more. 1000 1200 1400 OLS coef ficient 1000 1500 2000 n 200 300 interval width 1000 1500 2000 n 0.00 0.25 0.50 0.75 1.00 coverage classical PPI PPBoot Figure 4: Classical inference, PPI , and PPBoot , applied to estimating the relationship b et ween age and income in US census data. 4 1 2 3 logistic coef ficient 1e 5 500 1000 1500 n 1.0 1.5 2.0 interval width 1e 5 500 1000 1500 n 0.00 0.25 0.50 0.75 1.00 coverage classical PPI PPBoot Figure 5: Classical inference, PPI , and PPBoot , applied to estimating the relationship b et ween income and ha ving health insurance in US census data. 0.2 0.4 0.6 correlation coef ficient 500 1000 1500 n 0.00 0.05 0.10 interval width 500 1000 1500 n 0.00 0.25 0.50 0.75 1.00 coverage classical PPBoot imputed Figure 6: Classical inference, PPBoot , and the imputed approach, applied to estimating the correlation co efficien t betw een age and income in US census data. In the first application, the target of inference is the ordinary least-squares (OLS) co efficien t betw een age and income, con trolling for sex. In the second application, the target of inference is the logistic regression co efficien t b et ween income and the indicator of having health insurance. W e plot the results for linear and logistic regression in Figure 4 and Figure 5, resp ectiv ely . In both applications, PPBoot yields similar interv als to PPI , and b oth metho ds give smaller interv als than classical inference based on the CL T. In the second application, PPBoot sligh tly undercov ers, though that ma y b e resolved b y increasing B . T o sho w that PPBoot is applicable quite broadly , w e also quantify the relationship b et ween age and income and income and health insurance, resp ectiv ely , using the Pearson correlation co efficien t. Prior w orks on PPI(++) do not study this problem, as the theory is not easy to apply to this estimand. T o demonstrate that this is a non trivial problem, we also form confidence interv als via the “imputed” approach, whic h naiv ely treats the predictions as real data, and sho w that it severely undercov ers the target. (F or all previous applications, Angelop oulos et al. [1] demonstrated the lack of v alidity of the imputed approach.) W e show the results in Figure 6 and Figure 7, resp ectiv ely . PPBoot yields smaller interv als than classical inference, while main taining approximately correct cov erage. In this application, classical inference uses the classical p ercen tile bo otstrap method. The imputed approac h yields very small interv als and zero co verage. 0.2 0.3 correlation coef ficient 500 1000 1500 n 0.00 0.05 0.10 interval width 500 1000 1500 n 0.00 0.25 0.50 0.75 1.00 coverage classical PPBoot imputed Figure 7: Classical inference, PPBoot , and the imputed approach, applied to estimating the correlation co efficien t betw een income and ha ving health insurance in US census data. 5 4 Extensions W e state tw o extensions of PPBoot that improv e up on the basic metho d along different axes. The first one is a strict generalization of PPBoot that handles a version of “p o wer tuning” [2], leading to more p o w erful inferences than the basic metho d. The second one extends PPBoot to problems where the predictive model f is not av ailable a priori, the setting studied in [15]. 4.1 P o wer-tuned PPBo ot A t a conceptual level, pow er tuning [2] is a wa y of choosing how muc h to rely on the mac hine-learning predictions so that their use never leads to wider in terv als. In particular, p o wer tuning should enable reco vering the classical b o otstrap when the predictions provide no signal ab out the outcome. W e define the p o w er-tuned version of PPBoot b y simply adding a m ultiplier λ ∈ R to the terms that use predictions: θ ∗ b = λ · ˆ θ ( ˜ X ∗ , f ( ˜ X ∗ )) + ˆ θ ( X ∗ , Y ∗ ) − λ · ˆ θ ( X ∗ , f ( X ∗ )) . (1) The parameter λ determines the degree of reliance on the predictions: λ = 1 reco vers the basic PPBoot ; λ = 0 recov ers the classical bo otstrap. W e will next sho w ho w to tune λ from data as part of PPBoot . Before doing so, w e deriv e the optimal λ that the tuning pro cedure will aim to approximate. One reasonable goal is to pic k λ so that the v ariance of the b ootstrap estimates V ar( θ ∗ b ) is minimized. A short calculation shows that the optimal tuning parameter for this criterion equals: λ opt = Co v ˆ θ ( X ∗ , f ( X ∗ )) , ˆ θ ( X ∗ , Y ∗ ) V ar ˆ θ ( X ∗ , f ( X ∗ )) + V ar ˆ θ ( ˜ X ∗ , f ( ˜ X ∗ )) . T o incorp orate p o wer tuning into PPBoot , w e simply p erform an initial b ootstrap where we draw ( X ∗ , Y ∗ ) and ˜ X ∗ —as in PPBoot —and compute ˆ λ opt = d Co v ˆ θ ( X ∗ , f ( X ∗ )) , ˆ θ ( X ∗ , Y ∗ ) d V ar ˆ θ ( X ∗ , f ( X ∗ )) + d V ar ˆ θ ( ˜ X ∗ , f ( ˜ X ∗ )) , where the empirical cov ariance and v ariances are computed on the b o otstrap draws of the data. After that, w e pro ceed with PPBoot as usual, the only difference b eing that we use the multiplier ˆ λ opt , as in Eq. (1). W e ev aluate the b enefits of p o wer tuning empirically . W e revisit tw o applications: estimating the fre- quency of spiral galaxy via computer vision and estimating the o dds ratio b et ween phosphorylation and disorder via AlphaF old. The problem setup is the same as b efore, only here we additionally ev aluate the p o w er-tuned versions of PPI and PPBoot . W e plot the results in Figure 8 and Figure 9. As we saw b efore, PPI and PPBoot yield interv als of similar size. P erhaps more surprisingly , the tuned v ersions also yield inter- v als of similar size, even though the tuning procedures are differen tly derived. F or example, in the AlphaF old application, tuned PPI has t w o tuning parameters, while tuned PPBoot has only one. Also, as expected, the p o w er-tuned pro cedures outperform their non-tuned counterparts. 4.2 Cross-PPBo ot Next, we extend PPBoot to problems where we do not hav e access to a pre-trained mo del f . W e therefore ha ve the lab eled data ( X, Y ) and the unlabeled data ˜ X , but no f . This is the setting considered in [15], and our solution will resemble theirs. It helps to think of PPBoot as an algorithm that takes ( X , Y , f ( X )) and ( ˜ X, f ( ˜ X )) as inputs: C PPBoot = PPBoot ( X, Y , f ( X )) , ( ˜ X, f ( ˜ X )) . 6 0.250 0.255 0.260 0.265 0.270 fraction of spiral galaxies 2000 4000 6000 8000 n 0.015 0.020 0.025 interval width 2000 4000 6000 8000 n 0.00 0.25 0.50 0.75 1.00 coverage PPI PPI (tuned) PPBoot PPBoot (tuned) Figure 8: PPI , PPBoot , and their tuned v ersions, applied to estimating the fraction of spiral galaxies from galaxy images. 2.0 2.2 2.4 2.6 odds ratio 1000 2000 3000 4000 n 0.6 0.8 interval width 2000 3000 4000 n 0.00 0.25 0.50 0.75 1.00 coverage PPI PPI (tuned) PPBoot PPBoot (tuned) Figure 9: PPI , PPBoot , and their tuned v ersions, applied to estimating the o dds ratio b et ween phosphoryla- tion and protein disorder with AlphaF old predictions. One ob vious solution to not having f is to simply split off a fraction of the lab eled data and use it to train f . Once f is trained, w e use the remainder of the labeled data and the unlabeled data to apply PPBoot . Of course, this data-splitting baseline may b e wasteful b ecause we do not use all lab eled data at our disp osal for inference. F urthermore, we do not use all lab eled data to train f either. T o remedy this problem, we define cross-PPBoot , a metho d that lev erages cross-fitting similarly to cross-PPI [15]. W e partition the data into K folds, I 1 , . . . , I K , ∪ K j =1 I j = [ n ]. T ypically , K will b e a constan t suc h as K = 10. Then, we train K mo dels, f (1) , . . . , f ( K ) , using any arbitrary learning algorithm, such that mo del f ( j ) is trained on all lab eled data except fold I j . Finally , we apply PPBoot , but for every p oin t X i in fold I j , we use f ( j ) ( X i ) as the corresp onding prediction, and for every unlabeled p oin t ˜ X i , we use ¯ f ( ˜ X i ) = 1 K P K j =1 f ( j ) ( ˜ X i ) as the corresp onding prediction. In other w ords, let f (1: K ) ( X ) = ( f (1) ( X 1 ) , . . . , f ( K ) ( X n )) b e the vector of predictions corresponding to X 1 , . . . , X n , and let ¯ f ( x ) = 1 K P K j =1 f ( j ) ( x ) denote the av erage mo del. Then, w e hav e C cross-PPBoot = PPBoot ( X, Y , f (1: K ) ( X )) , ( ˜ X, ¯ f ( ˜ X )) . The cross-fitting prev ents the predictions on the lab eled data from ov erfitting to the training data. W e no w sho w empirically that cross-PPBoot is a more pow erful alternativ e to PPBoot with data splitting used to train a single model f . W e also compare cross-PPBoot with cross-PPI [15], since b oth are designed for settings where a pre-trained mo del is not av ailable. cross-PPI leverages cross-fitting in a similar wa y as cross-PPBoot , how ever it computes confidence interv als based on a CL T rather than the b ootstrap. As b efore, to av oid c herry-picking, w e fo cus on the applications studied by Zrnic and Cand` es [15]. W e consider the applications to spiral galaxy estimation from galaxy images and estimating the OLS co efficien t b et ween age and income in US census data. W e use the same data and mo del-fitting strategy as in [15]. See Figure 10 and Figure 11 for the results. In these tw o figures, PPI and PPBoot refer to the data-splitting baseline, where we first train a mo del and then apply PPI and general PPBoot , resp ectiv ely . Qualitativ ely the takea w ays are similar to the tak eaw ays from the p o wer tuning experiments. The use of cross-fitting improv es up on the basic versions of PPI and PPBoot , but again, somewhat surprisingly , 7 0.250 0.255 0.260 0.265 0.270 fraction of spiral galaxies 10000 15000 20000 25000 30000 n 0.006 0.008 0.010 0.012 interval width 10000 15000 20000 25000 30000 n 0.00 0.25 0.50 0.75 1.00 coverage PPI cross-PPI PPBoot cross-PPBoot Figure 10: PPI , cross-PPI , PPBoot , and cross-PPBoot , applied to estimating the fraction of spiral galaxies from galaxy images. 950 1000 1050 1 100 1 150 OLS coef ficient 10000 20000 30000 n 50 100 150 interval width 10000 20000 30000 n 0.00 0.25 0.50 0.75 1.00 coverage PPI cross-PPI PPBoot cross-PPBoot Figure 11: PPI , cross-PPI , PPBoot , and cross-PPBoot , applied to estimating the relationship betw een age and income in US census data. cross-PPI and cross-PPBoot lead to very similar in terv als. Ac kno wledgemen ts T.Z. thanks Bradley Efron for many useful discussions that inspired this note. References [1] Anastasios N Angelop oulos, Stephen Bates, Clara F annjiang, Michael I Jordan, and Tijana Zrnic. Prediction-p o w ered inference. Scienc e , 382(6671):669–674, 2023. [2] Anastasios N Angelop oulos, John C Duchi, and Tijana Zrnic. PPI++: Efficient prediction-p o wered inference. arXiv pr eprint arXiv:2311.01453 , 2023. [3] Inigo Barrio-Hernandez, Jingi Y eo, J ¨ urgen J¨ anes, Milot Mirdita, Cameron LM Gilchrist, T anita W ein, Mihaly V aradi, Sameer V elank ar, Pedro Beltrao, and Martin Steinegger. Clustering predicted structures at the scale of the known protein univ erse. Natur e , 622(7983):637–645, 2023. [4] Isab ell Bludau, Sander Willems, W en-F eng Zeng, Maximilian T Strauss, Fynn M Hansen, Maria C T anzer, Ozge Karay el, Brenda A Sch ulman, and Matthias Mann. The structural context of p osttrans- lational modifications at a proteome-wide scale. PL oS biolo gy , 20(5):e3001636, 2022. [5] Pierre Bo yeau, Anastasios N Angelopoulos, Nir Y osef, Jitendra Malik, and Mic hael I Jordan. Auto ev al done righ t: Using syn thetic data for model ev aluation. arXiv pr eprint arXiv:2403.07008 , 2024. [6] Bradley Efron and Robert J Tibshirani. A n intr o duction to the b o otstr ap . Chapman and Hall/CRC, 1994. 8 [7] Shuxian F an, Adam Visok ay , Kentaro Hoffman, Stephen Salerno, Li Liu, Jeffrey T Leek, and Tyler H McCormic k. F rom narratives to num b ers: V alid inference using language mo del predictions from verbal autopsy narrativ es. arXiv pr eprint arXiv:2404.02438 , 2024. [8] John Jump er, Richard Ev ans, Alexander Pritzel, Tim Green, Michael Figurnov, Olaf Ronneb erger, Kathryn T uny asuvunak o ol, Russ Bates, Augustin ˇ Z ´ ıdek, Anna P otap enk o, et al. Highly accurate protein structure prediction with alphafold. Natur e , 596(7873):583–589, 2021. [9] Eeshit Dhav al V aishnav, Carl G de Bo er, Jennifer Molinet, Moran Y assour, Lin F an, Xian Adiconis, Da wn A Thompson, Joshua Z Levin, F rancisco A Cubillos, and Aviv Regev. The evolution, evolv ability and engineering of gene regulatory dna. Natur e , 603(7901):455–463, 2022. [10] Siruo W ang, Tyler H McCormick, and Jeffrey T Leek. Methods for correcting inference based on outcomes predicted by machine learning. Pr o c e e dings of the National A c ademy of Scienc es , 117(48): 30266–30275, 2020. [11] Kyle W Willett, Chris J Lintott, Stev en P Bamford, Karen L Masters, Bro ok e D Simmons, Kevin R V Casteels, Edward M Edmondson, Lucy F F ortson, Sugata Kavira j, William C Keel, et al. Galaxy zo o 2: detailed morphological classifications for 304 122 galaxies from the sloan digital sky survey . Monthly Notic es of the R oyal Astr onomic al So ciety , 435(4):2835–2860, 2013. [12] Shu Y ang and Peng Ding. Com bining m ultiple observ ational data sources to estimate causal effects. Journal of the Americ an Statistic al Asso ciation , 2019. [13] Donald G Y ork, J Adelman, John E Anderson Jr, Scott F Anderson, James Annis, Neta A Bahcall, JA Bakk en, Rob ert Barkhouser, Steven Bastian, Eileen Berman, et al. The sloan digital sky survey: T echnical summary . The Astr onomic al Journal , 120(3):1579, 2000. [14] Lianmin Zheng, W ei-Lin Chiang, Ying Sheng, Siyuan Zh uang, Zhanghao W u, Y onghao Zh uang, Zi Lin, Zh uohan Li, Dacheng Li, Eric Xing, et al. Judging LLM-as-a-judge with MT-Bench and Chatb ot Arena. A dvanc es in Neur al Information Pr o c essing Systems , 36, 2024. [15] Tijana Zrnic and Emman uel J Cand ` es. Cross-prediction-p o wered inference. Pr o c e e dings of the National A c ademy of Scienc es (PNAS) , 121(15), 2024. 9
Original Paper
Loading high-quality paper...
Comments & Academic Discussion
Loading comments...
Leave a Comment