Model-based Stochastic Fault Detection and Diagnosis for Lithium-ion Batteries
Lithium-ion battery (Li-ion) is becoming the dominant energy storage solution in many applications such as hybrid electric and electric vehicles, due to its higher energy density and longer life cycle. For these applications, the battery should perfo…
Authors: Jeongeun Son, Yuncheng Du
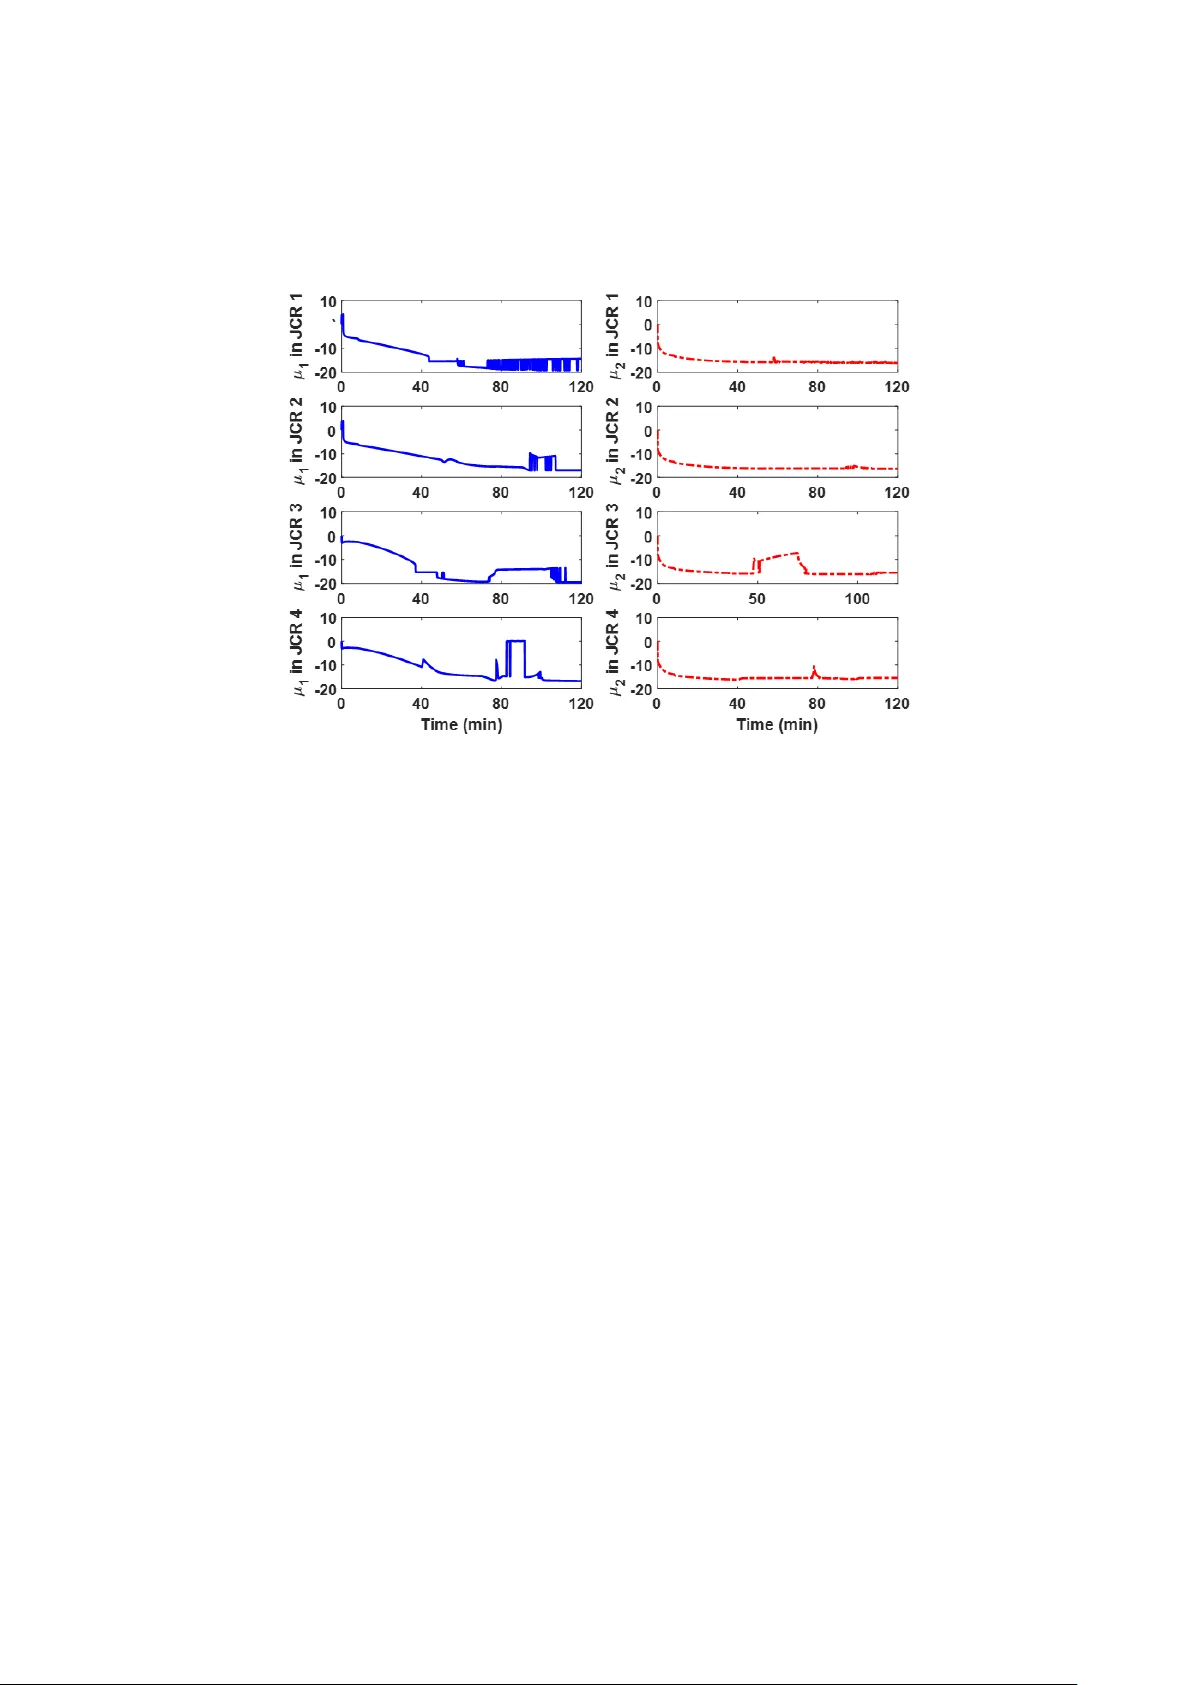
Processes 2019 , 7 , Firstpage-Lastp age; doi: FOR PEE R REVIEW www.mdpi.com/jo urnal/process es Article Model-based Stochastic Fault Detection and Diagnosis for Lithium-ion Batteries Jeongeun Son , Yunch eng Du* Department of Chemical & Biomo lecular Eng ineering, Clarkson University, Po tsdam NY 13676, USA * Correspondence: ydu@clarkson.edu ; Tel.: +1 -315-268-2284 Abstract: Lithium-ion battery ( Li-i on) is becoming the dominant e nergy sto rage sol ution in many applicatio ns such as hybrid electric and electric vehicles, due to its higher energy densi ty and longer life cycle. For th ese applications, the battery sho uld perform reliably an d pose no safety threats. However, the performa nce of Li -ion batteries can be affected by abnormal thermal b ehaviors, defined as faults. It is essenti al to develop reli able thermal m anagement system to accurately predict and monito r thermal behaviors of Li- ion battery. Usin g the fi rst-pri nciple models of batteries, this work presents a sto chastic fault detecti on and diagnosis (FDD) algori thm to identify two parti cular faults in the Li -ion battery cells , using easily measured quantities such as tempe ratures. Models o f Li -ion battery are typicall y derived from th e underl ying physi cal pheno mena. To make model tractable and useful, it is common to make si mpli fications during model development, wh ich may consequently i ntroduc e mismatch between models and battery cells. Further, FDD algori thms can be affected by uncertai nty, which may ori ginate from either intrinsi c time varyi ng phenome na or m odel ca li bration with noisy data. A two -step FDD algorithm is develope d in t his work to correct model of Li -ion battery cel ls and to identi fy faulty o perations fro m a normal operating condi tion . An iterative optimization problem is proposed to correct the model by incorporating the errors between me asured qu antities and model predictio ns, which is followed by a n opti mization-based FDD to pr ovide a pro babilisti c descr iptio n of the o ccurrence of possi ble faults, while taking t he uncertainty i nto account. The two -step stoch astic FDD algorithm in this work i s shown to be effi cient in terms of fault detectio n rate for both individual and simul taneous faults i n Li-i on batteries, as compared to Mo nte Carlo (MC) simul ations. Keywords: fault detecti on and classificatio n; uncertainty analysis; lithium io n batte ry; optimization; thermal manageme nt; polyno mial chaos expansio n 1. Introduction Lithium-ion ( Li-ion) batteries are widel y used in many appli cations such as cell phones, electric and hybrid el ectric vehicl es, since they exhibit higher energy density and have rel atively l onger life as compared to other b atteries [1]. In these systems, Li-ion batteries must posses s high reliability and pose n o safety threats [2]. However, the thermal behavior ca n greatly a ffect the safe ty, durabili ty, and performance of L i-io n b atteries [3]. For example, fire and ex plo sion caused by thermal runaway were reported [4 ]. Thus, reliable battery management systems are essential to mitigate negative effects (e.g. thermal runa way) and avoid catastrophic fai lures [5]. As a key component o f the battery management system, fault detection and di agnosis pl ay an i mportant rol e in the management o f Li -ion batteries [6]. Fault detection and diagnosis (FDD) m ethods generally can be classified into two major grou ps, i.e., first -principle model -based methods and data drive n (or empiri cal) methods [7 ]. For the former, models descri bing physical mech anisms of the fault dynamics are oftentimes u sed, while hi storical data are typically collected for data driven methods to derive empiri cal mod els. Each of th ese Processes 2019 , 7 FOR PEE R REVIEW 2 approaches has its own advantage and drawback depending o n specifi c problem s. It i s recogni zed that fi rst-principl e model -based methods exhibit better extrapolation ability, whereas d at a-driven methods are easier to design [8] . This work focuses o n the use of the f irst -princi ple models for FDD, since these model s provide fundamental under standing of the thermal physics o f batteries [9]. Several first-pr inciple thermal models have been pre viously develope d for Li -io n batteries. For example, a three- dimensional thermal fini te element model was develo ped to investigate the ce ll behavior under abnormal events such as overheating and ex ternal short circuits [10 ]. This model requires hi gh computational capabilities, and i ts application is limited to stationary storage [11] . As compared to the thre e-dimensi onal model s, one -dimensio nal model of Li-ion batteries, develo ped using the aver age lumped t emperature o f the cell , is viable for re al -time appl ications and can e nable online battery man agement [12 ]. Ho wever, such a mod el may fail to provide insights of the thermal (fault) dynamics due to i ts simpli city [13] . A s a trade -off, a two- dimensional thermal model was developed, which ca n pred ict the core and the surface temperat ure of the Li -ion battery ce lls [3 , 13] . Since the two-dimensi onal model can pr ovide a better understanding of the thermal dynamics of battery ce lls, whil e maintaining the com putational co mplexity, it i s used i n t his work fo r the design of a stochast ic FDD scheme . Measurements of temperatures such as surface and core temperatures are often used for FDD in Li -ion batteries, but th ere is no direct measurement of the core temperature. To take the core temperature into account, estimatio n techniques are of ten required. In the literature, several estimation techniques have been developed. For ex ample, adaptive observer based on lumped thermal model [14] and state observer usi ng p artial differential algebraic equations [15] were proposed to estimate the temperature. As compared to these esti mation techniques, the re al -time monitori ng and diagnosis of faul ts in batteries are less expl ored. Al though there have been sever al proposed works related to diagnos tic algorithms for internal faults in Li -ion batteries [3, 16, 1 7], it is important to note that pre vio usly reported FDD works mostl y investig ated sensors or actuator fault detection pro blems [18, 19 , 20]. In this work, we propose to estimate th e core temperature and further use the estimation results to identif y and classify two sets o f faults. That i s, faults that can introduce dynamic changes in core temperatures and f aults th at can affect t he surface temperat ures. The FDD sc heme in this work can potentiall y provide more information about the thermal dyn amics of batteries and enable i nternal thermal fault dete ction to improve the pe rformance of Li -ion battery. For FDD, the available algorithms compare the obser ved behavior to the corresponding model results, estimated from fi rst-pri nciple models [2 1]. When a fault i s d etectable, the FDD sche me will generate f ault signatures, whi ch i n turn can be refer red to an FDD scheme to identif y the roo t cause of faults using a threshold [22]. However, the m ain restri ctive facto r for the first -principle model- based FDD i s the model uncertainty [23]. The accuracy of fault detection al gorithm can be affected by any uncertainty in mo del parameters. Such an uncertainty ma y result fro m intrinsic time varyi ng phenomena or ori ginate from model cali bration with noisy measure ments [24]. Th e uncertainty can be quantitatively approximated by c alibration with e xperimental data, which include princi ples such as least squares erro rs or the Delphi method [25, 26]. The procedures that fi rstly quantify the uncertainty and then propagate the uncertai nty onto the FDD scheme are typicall y omitted in previousl y reported wo rks. This subsequently may lead to a loss o f informatio n about the effect o f uncertainty on FDD perf ormance. Recently, several techniques, such as adaptive observer [27, 28] and sliding mode obser ver [29], were developed for FDD in the presence of uncertainty. However, most of these methods cannot provide i nform ation such as the probability that a fault has occurred. In addition, since the faults in the batteries may happen in a stochastic fashion, the use of fixed thresholds to identify the root cause of faults may not be effective. There are differences between the actu al therm al dynamics of Li -ion batteries and fundamental models d erived fro m physical pheno mena. For example, to make mo dels tract able and u seful, i t is common to make simpli fications duri ng the model development, which wil l introduce mismatch between the model and th e Li -ion battery syste m of i nterest. Thus, the first principl e model-based FDD scheme should be desi gned to compensate the mismatch. Specifi cally, a set of fi xed model Processes 2019 , 7 FOR PEE R REVIEW 3 parameters may not b e accurate enough for esti mating the co re temperature in t he presence of model mismatch. Consequently, any inaccuracy in temperature estimation may potentially lead to low fault detection rate. To ensure the accuracy of FDD, it is essential to simultaneously cali brate the model parameters and adjust the FDD sc heme. Howe ver, this is general ly chall enging due to the presence of uncertainty such a s measurement noise and unknown mo del mismatch. In this work, we propo se to address these aforementi oned limitatio ns by devel oping an FDD scheme for Li-ion batteries descr ibed by a two -dimensi onal first -principle thermal dynamic model, for which both model parameters and faults are of sto chastic nature. Specifically, the faults considered in this work suc h as the thermal runawa y a re stochastic pertur bations superimp osed on step changes i n specific thermal dynamic parameter a nd el ectric current. The objective is to identify the changes in the mea n values of thermal dynamic parameter and the current i n the presence o f the random pertur bations, measurement noi se, and mo del mismatch. As compared to other existing thermal di agnostic techni ques, the main fea ture of the FDD sche me is the effi cient quanti fication o f the effect of stochastic changes i n model parameters on f ault detection, and the rapi d propagation of the stochastici ty onto the estimatio n of temperatures that are re quired fo r FDD. Note that o ne possible way to propagate u ncertainty in model parameters onto temperature estimates i s the use of Mo nte Carl o (M C) simul ations [30 ]. Ho wever, methods such as MC may be computationally d emanding, since they o ften require a larger number o f simulatio ns in order to obtain accurate results. It is worth mentioning tha t although the cali bration of an FDD scheme can be performed offline, but the online re-calibration of the model in the presence of mod el mismatch with MC as shown l ater in current work is computati onally prohibiti ve. Recentl y, uncertainty prop agation with generali zed Polynomial Chaos (gPC) expansi on has been studied in differ e nt modelli ng [31] , optimizatio n [ 32], and fault detecti on problems [24]. As compared to MC, the advantage o f gPC is that it can pro pagate a co mplex probabil ity distri but ion of uncertai nty in model parameters onto model predictions rapidly and can analytically appro ximate the statistical moments of model predictions in a computationally efficient manner [31]. The improvement in computational time may facilitate its appl ication in real -time model adjustment for impro ved FDD. The FDD algorithm in this work i s spec ifically targeted to i dentify and di agnose stochastic thermal faults consisting of uncertainty aro und a set of mean values of thermal pr operti es in the presence of mo del mismatch. In summar y, the contributi ons i n thi s work include : ( i ) the use of an intrusive gPC mod el fo r stochastic FDD of Li-io n batteries by approxim ating the uncertainty in thermal dynamics with gPCs and by propagating the un certainty directl y onto temperatures that can be used for FDD; ( ii ) the i dentificatio n and classification o f a fault based o n the proba bility information of temperatures o ther th an a singl e point estimate or thres hold; ( iii ) the formul ation of an opti mization to account for model mismatch and adjust the therm al dynamic models by incorporati ng the discrepancy between model predictions and measurement s. This paper is organized as foll ows. Section 2 presents the theoretical b ackgr ound and the principal methodologies in this wo rk, including a two-di mensional thermal dynamic model, introduction of generalized polynomial chaos (gPC) exp ansion, and formul ation o f the stochastic fault detecti on and diagnosi s (FDD) problem. The methodo logy for FDD a nd the fo rmul ation of an optimizatio n for model correctio n to account for model mismatch is presen ted in Secti on 3. Analysis and discussion of the results are given i n Section 4 , followed by conclusions in Secti on 5. 2. Theoretica l Backgrounds 2.1. Thermal Model of Lit hium- ion Battery The two-d imensional deterministi c thermal dynamic model i s used to describe a cylindrical Li - ion battery cel l in this wo rk [3, 1 3] . A schematic diagram o f the Li -ion battery cel l is shown i n Fig ure 1. This model can provide information ab out the heat source of battery and estimate the core temperature based on measurements of surface temperature. The surf ace temperature T s and the core temperature T c ca n be defined as: Processes 2019 , 7 FOR PEE R REVIEW 4 (1) (2 ) (3 ) where I is the cur rent, T f represents the surrounding air temperature, R e is the internal (or electri cal) resistance, R c i s the therma l re sistance between the su rface and core of the battery, R u denotes the convection resistance b etwe en the surface and the surrounding of th e battery, C c and C s represent the heat capacity of the i nternal battery material and the surface battery m aterial, re spectively. The internal re sistance R e is gi ven i n Equ ation (3 ) which consists o f state o f charge ( SOC ), co re temperature T c , and parameters , , th at can be pre-esti mated by an o ffline estimatio n scheme [3]. Figure 1. Schematic of thermal model of Li-ion battery cell. For the Li -ion battery cell mo del given in Equations ( 1) and (2), model parameters incl uding R e are general ly assigned wi th constant values . A set of pa rameters used in the tw o -dimensional thermal dynamic model is given in Table 1 [33] . Table 1. Parameter Declaration for the Thermal Model of Li-ion Battery Cell. Model parame ters C c C s R e R c R u Units JK -1 JK -1 m KW -1 KW -1 Value 268 18.8 10 2 1.5 It is important to note that the model of battery and the model parameters may involve uncertainty. For example, the ther mal dynamics of a Li -ion battery ce ll can change with respect to time, which may be caused by factors such as the surro unding temperature and the state of charge. In addition, the estimates of model parameters can be affected by noisy data used for model calibration. These po ssible so urces of uncertainty c an be briefly categori zed into three groups a s follows. 1. Observational u ncertainty : This i ncludes measureme nt erro rs in experi mental dat a such as the measurements of vol tage, current, a nd surface temper atures. 2. Parametric uncertainty : This refers to uncertainty in parameters, which may originate from the observational uncertaint y or re sult from l ack of information. It may be advantageous to represent a model paramet er, e.g., R e in E quation (1), as a r andom varia ble wi th a d istribution other than a fixed value. Processes 2019 , 7 FOR PEE R REVIEW 5 3. Structural unce rtainty : Thi s descri bes the difference s between a mo del and the actual L i -io n battery system. For example, models in Equations (1) a nd (2) may not be a n exact representation of the thermal dyn amics of a Li -ion battery cel l. In this current work, we focus on the de velopment of FDD algorithms in the presence s of these uncertainties . Spe cificall y, the conducti on resi stance R c in Equations (1) and (2) is considered as an uncertain parameter and c hanges i n R c are defined as stochastic faults. The co nduction resistance R c is often used to i ncorporate conducti on and t hermal resi stance across materials wi th compact and inhomogeneous properti es. It is diffi cult to accurately estimate the exact parameter value of R c , since the roll ed elec trodes consist of the cathod e, anode, separator, and current coll ectors, which may compli cate the parameter e stimation and reduce the e stimation accuracy [14] . An y variations i n R c , may significantly affect the performance of battery. I n addition, it is assumed that the current I i n Equation (1 ) is the seco nd uncertai nty i n this work, since the i nternal state of the battery can be affected by curre nt [34] . For exampl e, as previo usly reported [14 ], current variation s may l ead to the fluctuation in temperatures of the battery. Furt hermore, the electric current o f battery can be time - varying in pr actice and can be corrupted by measurem ent errors , thus the e xact va lue of cur rent can be an unknown prio r. Since the convection resistance R u is related to the surrounding co olant flowrate [35] , which is oftentimes tightly controlled to maintain a consistent battery temperature , thus R u is assumed to b e a constant other th an a parametri c uncertainty. For t he internal re sistance R e i n E quatio n (1), it can be affected by various conditions such as the state of charge of battery, temperature, and drive cycle [14 , 36, 37] leading to the changes i n model predictio ns such as temperature. However, this therm al parameter i n Li- ion battery has been investig ated by many researchers and i s well fo rmulated with the state of charge and temperat ures as s hown i n Equatio n (3) [ 3, 14, 38]. For example, it can be estimated o ffline with experimental d ata or determined online with SOC estimation based on an equivalent circui t model (ECM) [38]. In this work, i t is assumed that R e is constant rather tha n ti me- varying p arameter and i t is not considered as a para metric uncertai nty fo r simplici ty. Howev er , the proposed uncertainty pro pagation and di agnostic scheme can be e xtended to R u and R e acco rding to their intri nsic properties when there is e vidence to suppo rt significant variation in R u a nd R e . In this work, sudden chan ges of temperatures i n Li -ion battery caused by the current I and resistance R c wil l be diagnosed and classi fied by the propo sed method. Addi tionally, to introduce structural uncertainty, i t i s assumed that the exact s tatistical mo ments o f uncertainties, such as the actual mean value of R c is unknown to the model ers, which will be co rrected by inco rporating the differences betwee n model predictions and measurement of temperatures. Further, it should be noted that only the surface temperature of b attery can be di rectly measured, thus the estimations of the core temperatures wil l be used in the model correc tion. 2.2. Generalized Polynomial Choas Expansion The general ized po lynomial chaos (g PC) e xpansion appr oximates a random variable w ith an arbitrary pro bability densi ty functio n (PDF) of another random varia ble (e.g., ξ) with a known pri or distribution. For brevity, suppo se that the battery ther mal models in Equations (1) and (2) can be described by a set of o rdinary diff erential equati ons (ODEs) as: (4 ) where the vector x ={ x j } (j=1, 2, …, n ) represents the core and the surface temperature s, i.e., T c and T s , with initial values x 0 at t =0 , u is determini stic parameter s, i.e., fixed constant v alues, while p is a vector of uncertainti es, i.e., I and R c i n this work, which will be appro ximated with PD Fs. To evaluate the effect of uncertai nty on temperatures, a key step is to appro ximate each par ameter in p ={ p i } (i=1,2, .., n p ) as a function o f a set of independent random variable ξ ={ ξ i } as: (5 ) Processes 2019 , 7 FOR PEE R REVIEW 6 where ξ i de notes the i th ind ependent r andom vari able follo wing a standard PDF [3 1]. Based o n the definition of gPC expansion, each p arametric uncertainty { p i } and the model pr edictions x can be defined usi ng the orthogonal pol ynomial basis functions ( ξ )} as: = ( ) k=0 (6 ) t , ξ = ( t ) ( ξ ) =0 (7 ) where denote the gPC coefficients o f the i th p arametric uncertainty, are t he gPC coefficients of the j th model pr edictions at time i nstant t , and ( ξ )} are t he orthogon al polyno mial basis functio ns of random variables ξ [31] . When the PDFs of p are a given prio r, a set of co efficients in Equation (6 ) can be determined such that follows a prior known distr ibution. Otherwise, optimization techniques can be used to esti mate . As compared to p , the gPC coefficients of x are unknown and have to b e calculated. To calculate , Equations (6) and (7 ) are firstly substituted i nto Equation (4 ) , whic h is followed by appl ying a Gal erkin pro jection and by projecting Equatio n (4 ) onto each of the polynomi al chaos basis functio n ( ξ )} as: ξ ( ξ ) t , ξ ξ ( ξ ) (8 ) For practical appli cation, truncation, i.e., a finite number of terms, i s often used other than infinite terms in Equations (6) an d (7). For ex ample, th e total numb er of approximation terms (i.e. , Q ) that can be used fo r in Equation (7 ) can be cal culated as: Q (9 ) where q is the number of terms that is necessary to app roximate an a rbitrar y uncertainty with a prior kn own PD F in Equ ation (6 ), and n p i s the to tal numbe r of parametric uncertainti es in p . As seen in Equation (9 ), the number of terms required for the gPC approximation of x ={ x j } depends on the order of polynomi al q and/or the number o f unknown par ametric uncertainty n p . The inner product between any two vectors i n Equation (8 ) can be calculated as [ 31]: ψ ξ ,ψ'( ξ ) = ψ ξ ψ'( ξ ) W( ξ )d ξ (10) where the integral is calculated ov er the entire domain defined by random variables ξ in the Wiener- Askey fra mework, W ( ξ ) is the PDF of ξ that i s def ined as a weighting function in gPC theo ry. Fo r example, Hermite po lynomial basis functions ca n be used for normal di stributions [31]. U sing gPC coefficients o f model pred ictions x i n Equation (7 ), the statisti cal moments of x at a gi ven time t can be quickly esti mated as follows: (1 1) (1 2) In a dditi on, the PDF of model predictions x can be estimated by sampling from the PDF of ξ an d by su bstituting samples into the gPC expressions of x in Equation (7 ) . The calculation of statistical moments with the analytical formulae in Equati ons (1 1) and (12) and the r apidly appro ximation of the PDF o f x are the m ain ratio nale of using the gPC in thi s current wo rk, since it can red uce the Processes 2019 , 7 FOR PEE R REVIEW 7 computational burden invol ved in the model correction in the prese nce of structu ral and parametri c uncertainty. Note that the FDD proce dure in this wo rk consists of the i nverse of the procedures summarized above, i.e., the identificatio n of the PDFs (e.g., mean values) of parametric uncertainty using the measure ments and mo del predictions o f x . The details about the FDD wi ll be discussed in Section 3. 2.3. Formulation of FD D problem The faults consi dered in this work consist of stochastic pertur bations superi mposed on a particular set of mean va lue s of these two aforementioned uncertainties, i . e ., current I and conduction resistance R c . For example, Figure 2 shows a possible fault profile (Fi gure 2 (a)) and the resul ting noise-fre e temperature re sponses (Figure 2 (b)) . For cl arity, two mean values of each faul ts in Fi gure 2 are presented. As can be seen, any changes in the mean values of faults can induce variations in temperatures. The o bjective is to use t he meas urements o f temper ature to identify the step ch anges between different mea n values of curre nt ( I ) and thermal re sistance R c . A mathematical descr iption of stoc hastic faults is defined as: (1 3) where p i ϵ p ( i =1,2, ..., n p ), { }denotes a set o f mean values, and { } represe nts the variatio n around each mean value of the i th uncertainty. For example, the sol id bold lines (blue and red) i n Figure 2 (a) are the mean values of current ( I ) and therm al resistance R c , while the purple and gre en lines are the perturbations around each of the mean values. It i s assumed in thi s work that the statistical momen t of { } is time-invariant for simplicity an d ca n be estimated with offline model calibration algorithms. In addi tion, the total number of possible mean val ues of p i can be e xperimentally inferred from the constancy of measured quantities such as the surf ace temperature as shown in Figure 2 (b), but the exact mean values ca n be unknown to the mo delers. ( a ) ( b ) Figure 2. Profiles of faults (a) and the corresponding noise-free temperature (b). Note that the purple and green lines in (a) represent the perturbations around the mean values of po ssible faults , and noise free measurements of temperatures are used in (b) fo r clarity. As seen i n Figure 2 (b), the core temperature is higher, when the mean values of I and R c are larger. Since any signifi cant changes in the core temperatures are har mful and may cause catastrophic failures in Li -ion batteries [4] , thus the smaller mean values o f I and R c are used to re present the normal o perating mode of Li -ion battery in this wo rk, while the l arger mean value in ei ther I and R c is used to represent t he fau lty o perating modes. Thus, the objective is to id entify the mean value (or mean value changes) o f I and R c in the presence o f uncertainty. To summarize, two types of faul ts are co nsidered. ( i ) Fault 1 : Current fault ( I ), representing t he switch betwee n two mean values of I , which can affec t the co re temperature dynamics and f urther induce thermal runaway f aults. ( ii ) Fault 2 : Thermal resistance fault ( R c ), representi ng a signif icant deviation in the mean value of thermal resistance R c , which may resul t fro m battery agi ng and c an affect both core and temperatures. Based o n the def inition of the faults, the setting o f normal and faulty operating mod es in this work i s given in Table 2 , respecti vely. Processes 2019 , 7 FOR PEE R REVIEW 8 Table 2. Faults Definition and Description. Modes Description Type Normal I = , R c = R c 1 No fault Faulty 1 I = , R c = R c 1 Individual fault Faulty 2 I = , R c = R c 2 Individual fault Faulty 3 I = , R c = R c 2 Simultaneous faults 3. Methodology of Fault Detection and Diagnosis The objective of the FDD al gorithm is to identi fy a chan ge in the mean values of I and R c a nd classify an operati ng condition as a normal or faulty mode described in Table 2, using measurements of temperatures. A Joi nt Confidence Region (JCR) bas ed FDD algori thm i s first presented in Secti on 3.1, which is followed by an optimization-based model co rrection method in Section 3.2 for impro ved FDD in the presence o f model mismatch. 3.1. Fault Detect ion Algorithm using JCR P rofiles In Secti on 2 , the propagation of uncertai nty onto model pr edictions was discussed, fro m which the PDF profile of each model prediction can be approximated using the gPC mo dels. The main idea of the FDD algo rithm in thi s work is to solve the i nverse problem, i . e ., to i dentify the me an values of uncertainty with gPC mode ls. The FDD method consists of three steps. ( a ) The stochastici ty in faults (i.e., I and R c ) i s propagated onto model predictio ns, thus produci ng a fami ly of gPC model s o f the core and surf ace temperat ure s around eac h mean value of faults considered in this work. ( b ) Since two uncertainties (faults) are studi ed, a set o f joint confidence re gion (JCR) profiles o f the core and surface temperatures i s used to i nfer the possible mean values or any ch anges in m ean values of faults. The genera tion of the JCR will be discussed late r, which predi cts the proba bility that a p air of measurements belongs to a particul ar JCR. ( c ) Because of the measurement noi se and the overlaps among JCRs, the JC R- based FDD may pro vide l ower fault detection rate. Thus, a gPC mod el -based minimum distance o ptimization i s developed to improve t he FDD performance. Step a The formulation of the gPC models for the co re and surf ace tempe ratures foll ows the pro cedures as outlined in Section 2 . It is assumed that the stochastic perturbations in faults I and R c are independent stochastic events, thus a two -dimensional random sp ace is used, i . e ., ξ = { ξ 1 , ξ 2 }. Consequently, the pred ictions of temperatures o btained from Equa tion (7 ) are fun ctions of ξ = { ξ 1 , ξ 2 }, i . e ., any changes i n faults can affect both core and surface temperatures. Step b Since two faul ts are st udied , JCR profiles of core and surface temperatures are used to infer mean value changes in faults I and R c . Figure 3 shows a schematic of generated JCRs from gPC models. The generation of J CRs proceeds as fol lows. Figure 3. Schematic of generated JCRs with different probabilities . Note that the units of temperatures in this work is Celsius degree ( C). Processes 2019 , 7 FOR PEE R REVIEW 9 ( i ) In the case o f stochasti c perturbatio ns in both I and R c , the maximu m variati ons of core and surface temperatures are first estimated. ( ii ) A two-dimensio nal discrete domain made of combinations o f core and surface temper ature values can be gener ated bas ed on the temper ature estimations in Step i . ( iii ) Ra ndom samples of ξ 1 and ξ 2 are substituted into the gPC models of the core and surf ace temperature s as defined i n Equation (7 ), which can pro vide the temperatures values. ( iv ) Each pair of the core and surface tem peratures is assigned to a p articular grid generated in Step ii , and the total numb er of temperature pa irs can be cal culated wh en all the samples from Step iii have been assigned. ( v ) The proba bility at each discrete grid is calculated as the rati o between the number of temperature pairs at a particular gri d point and the total number of temperat ure pairs (i.e., the number of combination of ξ 1 and ξ 2 that are used in Step iii ). ( vi ) A JCR can be ge nerated by connecting discrete gri d points with the same probabili ty (see Figure 3 ). Step c Followi ng the procedures above, a family of JCR profiles can b e generated for each pair of m ean values of I and R c , as shown in Table 2 , which can be used for FDD. However, as seen in Figure 4 (a), the JCRs used to i nfer faults can be misleadi ng, whe n a pair of measurements (red star) is f ound to be in the overlap o f JCRs. In additio n, the measurements m ay lay outsi de of JCR prof iles due to the measurement noise, as shown i n Figure 4 (b). Thus, a gPC model -based mini mum di stance criterio n is used to impro ve the FDD perfo rmance, which is expl ained below. Figure 4. Visual interpretation of FDD algorithm using JCRs . Note that (a) represents that a pair of measurements can be found in the overlap of the JCRs, and (b) represent that a pair of measurements can be found outside the JCRs due to measurement noise. In addition, d 1 and d 2 in (b) represent the distance between the measurements and the centers of JCRs, which can be used for FDD with a min imum distance criterion as defined in Equations (14) and (15). As see n i n E quation (7 ), the gPC mod els of the core and surf ace temperatures are functions of random variables ξ = { ξ 1 , ξ 2 }, which can pro vide the st atistical information of tempe ratures resulti ng from st ochastici ty in faults I a nd R c . The comb inati on of gPC models of core a nd surface temperatures can provide the mathematical description of JCRs. When a pair of temperatures i s avail able, e.g., red star in Figure 4, i t i s possible to calculate the di stance b etween a pair of temperatures and the center of a J CR. Fo r a pr escribed confi dence region (or speci fic pro bability), the shortest di stance between the measurements and a specific JCR can then b e used to infer the mean values of f aul ts. For ex ample, as seen in Figure 4 (b), the distance d 2 is small er than d 1 , thus indicating that th e mean values of faults, used to generate JCR -2, are the most pro bable operati ng mod e. To analyt i cally decide the Eucl idean distance between a p air of measureme nts and a JCR, an opti mization problem i s developed as: (1 4) Operating mode : (15) where i is the total num ber of co mbination of mean values of faults I and R c as shown i n Table 2 , T c,i , and T s,i are the gPC models for a pa rticul ar set of mean value I and R c , which are functions of ξ given in Equation (7 ), T c,p , a nd T s,p . are core and surface temperatures that are used for FDD. Note that M FCR in Equation (15) is the identi fied operating mode defined in Table 2 based o n the mi nimum distance criterion. It should be noted that there is n o direct measurement of core temperatur es of battery, thus models, i .e., Equations (1) and (2), are used to estimate the core tempe rature with the measureme nt of surf ace temperature. The decisio n variable λ i s a vector of random samples of ξ = { ξ 1 , ξ 2 } from the sample do main defi ned by the thr ee -sigma rul es [3 9]. This optimi zation problem in Equatio n (1 4 ) Processes 2019 , 7 FOR PEE R REVIEW 10 will be performed for each pair of co re and surf ace temperat ure me asurements a nd com bination of mean values of faults I and R c that are defined in Table 2. Then, the minimum distance as defi ned in Equation (1 5) can be used to identify an operating mo de as defined in Table 2. 3.2. Optimizat ion-based Model Correct ion Th e FDD algori thm in Section 3.1 assum es that the exact statistic al moments of I and R c are given priors, which can be propagated onto the temperatur es to formulate JCR profiles of temperatures. However, it cannot account for the discrepancy between the model and the actu al thermal dynamics of Li-ion ba ttery. For exampl e, model cali bration with noi sy data can introduce mod el uncertai nty. Further, model assumptions and simplifications are often ma de to make model tractable, which may result in structural uncertainty. To account for uncertainty (and/or mismatch) b etw een th e model a nd the actual batter y cel ls, we propo se to correct the model by inco rporating the err or between mod el predictions and avail able measurements. The co rrectio n criterion is formul ated as follows: (1 6) where ( j=1, 2, …, n ) is a vector of correction ga ins, i s model predictions, and i s measurements o f temperat ures. To implement E quation (1 6), i t i s assumed th at measureme nts of surface te mperature are avail able, and the core temperature can be esti mated wit h the model that i s being corrected. It is also assumed that the exact statisti cal info rmation such as mean value o f the uncertainty is no t available for the user, in o rder to represent a model involving model mismatch. Such a difference will be compensate d using co rrection gains in Equatio n (16 ). To calculate the correc tion gains, a set o f me asurements inside a sliding ti me window wi ll be used in this work. A schematic of th e sliding time moving window i s shown i n Figure 5 , where L represents the size of the moving window and M is the moving rate, i.e. , L determines a total number of re quired temperatures and M deci des the overlap between the windo ws. A sm aller window size can b e less a ccurate and may be time consumi ng, but it can be sensitive as it would better capture the thermal dynamics of battery. A larger window size can reduce the computational burden, bu t it may lead to a coarse estimation. The m o ving rate decides the n umber of m easureme nts changed at a time. For example, when 1 is used for M , which means that the one measurement i s changed at a time, i . e ., the first measurement i n L will be removed and o ne new measurement will be appended to L . When M is larger, it may produce poor model co rrection result, while it will i ncrease the computa tional load wh en M i s small er. The choi ce of L and M is pro blem specifi c and requires a t rade -off, which can be determined with i nsights of the d ynamic natures of batteries. Figure 5. Schematic of sliding time moving windows for model correction For a sliding time mov ing window with temperature measurements, the correction gains can be optimized with a n optimization as: (1 7) where T c,i , and T s,i are gPC model predi ctions of core and surfac e temperatures obtained from Equation (1 6), T c,p and T s,p denotes the temper atures insi de moving windows that a re used for model correction. Note that core temperatures are estimat ed from th e deterministic model that b e ing Processes 2019 , 7 FOR PEE R REVIEW 11 corrected based on the measuremen ts of surface tempe ratures. The d ecisio n variable in Equ ation (17) is the correction gain that can be recur sively up dated with mo ving time w indows. It wi ll be shown in the results secti on that the model correction ca n be executed at e ach time i nterval in a real - time fashion, and the fault detectio n resul ts can be greatly improved with the recursively -updated gPC model. 3.3. Summary of FDD Algorithm An overview of the propos ed model cor rection and FDD i s shown i n Figur e 6. In summary, the algorithm proce eds as follows. Figure 6. Overview of the proposed FDD algorithm Step i – Col lect measurem ents of surface te mperatures as a tr aining set when t he battery is operated a t normal and faulty operating modes, describe d in Tab le 2. Using the o ptimization defined as E quatio n (17), the models of Li -ion battery cell s can be co rrected around each pair of the mean values o f I a nd R c . Note th at measurements of temperatures for faults ca n be o btained f rom either historical database or designed experiment s. Step ii – Using the co rrected models, the JCR profiles of the core and surface tem peratures f or each operating mo de can be generated fo llowing the pr o cedures descri bed in Section 3.1 . Step iii – When a sample of surface temperature is available, the core temperature will be firstly estimated, and t he mi nimum di stance can be calc ulate d with Equations (14) and ( 15) , which can be used to infer a particular set of mean values of I and R c . To evaluate the performa nce o f the proposed FDD ap proach, the fault classif ication rate ( ) defined as below i s used: (1 8) where n total represents the to tal number of testing sampl es used for algorithm verificati on, and n id is the number of samples that have been correctly i dentified and classifi ed. 4. Results and Discussion 4.1. Uncertainty Propagation and Model Prediction s The FDD algori thm is applied to the Li -ion battery ce lls as explained in Section 2.1 . For clari ty, two mean values of fault I and R c are considered , respectively. For current fault, I , these mean values are 16.2 A and = 13.8 A, respecti vely. It i s assumed that the stochastic perturbations in I around each o f these mea n values fo llo w a normal distribution with a mean of zero and a standard deviation of 0.45 A. For the co nduction resistance R c , t wo mean values are R c 1 1.68 KW -1 and R c 2 = 2.28 KW -1 , re spectively. In additi on, the rando m variatio ns around each mean value are normally distributed, which has a mean value o f zero and a standard deviation of 0.066 KW -1 , i.e. , a 5% Processes 2019 , 7 FOR PEE R REVIEW 12 variation wi th respect to the average of two mean values. S ince the pert urbations around the me an values follo w a normal distribution, Hermi te polynomia l basis functions are used for gPC mo dels in this work. It is important to note that for a rbitrary distri butions, the polynomial basis functions from the Askey-Wiener sch eme other th an Hermite polynomial b asis functions can b e used to impro ve the convergen ce of the gPC approximation i n Equation (6) [31]. Followi ng uncertainty propagation pr o cedures described i n S ection 2.2 , Figure 7 shows the mean of temperatures and the corresponding variance around th e mean values at each time interval , when the battery is o perated at the normal mo de. Since two sourc es of uncertainty are studied (i.e., n p = 2 in Equation (9 )) and two ter ms ca n be used to approximate a norm ally distributed I o r R c ( i.e., p = 1), six terms are re quired to approximate eac h temperature (i.e., Q = 5 i n Equation (9 )). The gPC coefficients o f the te mperature s can be solved by substi tuting the gPC model s of uncertainties and temperatures into t he Li- ion battery model (Equations (1 ) and (2)), which can then be solved by a Galerkin pro jection as explained in Sec tion 2.2. Thi s will produce a set of coupled equatio ns to describe the stochastic thermal dynamics of Li -ion b attery cells. The resulting gPC models of the core and the surface te mperatures are given by Equ ations (A 1) to (A12) in the Appendix A for brevity. Figure 7. Uncertainty propagatio n in the lumped thermal models of Li -i on battery cell at the normal operating mode, (mean value of temperatures and the variance at a few particular time intervals). As seen in Figure 7, T c0 and T s0 represent the mean values of core and surface temperatures, and the b ar-plots represent the variances around the mean values which can b e calculated from th e higher order gPC coef ficients, using Equatio n (12) i n Section 2 .2. Additionally, it was found that the core temperature can b e significantly a ffected by vari ations in I and R c , as co mpared to the surface temperature, i .e., a l arger variance as seen in Figure 7. 4.2. FDD using J CR Profiles and Computa tional Efficiency Based on the gPC mo del develope d with each pair of the mean values of I and R c , a f amily o f JCRs can be generated fol lowing the proce dure s as explai ned in Section 3 . Figure 8 shows the JCRs for a set of specific confidence regions, where 1000 pairs of temperatures samples are used. Based on the JCRs profile, the mean values of I and R c can be i nferred by solving the opti mization pro blem defined i n Equations (14) and (15) for a pair of temperatures. Taking a pair o f temperatures a s given in Figure 8 (the star) as an example, it can be co ncluded that t he battery system is operated around the second set of mean values of I and R c , si nce the distance between the given sam ples of temperatures and JCR -2 is mini mal. It should be noted that the JCR profil es not only can distinguish a specific faulty operating mode from th e normal operation, but al so prov ide probability information of being in a parti cular operati ng mode. In additio n, comparison studies were conducted to compare the g PC - based FDD with Monte Carlo (MC) simul ations-based method. For M C, a similar o ptimization problem as do ne for the gPC is defined as: (1 9) where i s the decision variables, i.e., the mean and the standard deviation of I and R c that have to be deter mined with respect to a gi ven pair of measurements of temperature, i.e., T c,p , and T s,p . Also, N Processes 2019 , 7 FOR PEE R REVIEW 13 is the total nu mber of sampl es used in the MC si mulatio ns in each i teration of th e opti mization, and are a particular set of core and surf ace temperat ures simulated with respect to the decision variables. When the optimization of Equation (19) i s fi nished, the optimizatio n re sults are compared with mean values defi ned i n Table 2 based on a minimum di stance cr iterion, which can identify a co rresponding operating mode. Figure 8. JCRs generated with a set of specific mean values of I and R c , which are sum marized in Table A1 in Appendix B . ( i ) JCR 1: 16.2 and 1.68 for I an d R c ; ( ii ) JCR 2: 16.2 an d 2 .28 for I and R c ; ( iii ) JCR 3: 13.8 and 1.68 for I and R c ; ( iv ) JCR 4: 13.8 and 2.28 for I and R c . For the gPC-based FDD, it wa s found that the optimi zation problem described in Equations (14) and (1 5) can be finished within on average 5 seco nds. Ho wever, for the MC -based me thod, the calculation o f the mean val ues of I and R c o n average r equires appro ximately 321 seco nds, when 100 pairs of samples of I and R c were used to simulate and i n each o ptimization iteratio n. This clearly shows that the computational efficacy of gPC, as compared with MC. In addition, it was found that MC wi th 100 sampl es cannot p rovide as accurate r esults as gPC. For exampl e, it was fo und that the f ault classifi cation rate r FCR o f gPC and MC i s ~0.94 and ~0 .75, respectively. To improve the FDD performance, a larger number of samples a re require d in each iteratio n of th e optimization with MC. However, this may si gnificantly increase the computatio nal burden. Espec ially, for the real-time model correction that will be discussed in next section, it can be co mputationally prohibiti ve with MC. A summary o f the comparison between gPC and MC is gi ven in Appendix C . 4.3. FDD Results using J CRs in combination w ith Model Co rrection In previous ca se study, i t is assumed that model s of battery are accurate, and J CR pro files are used fo r FDD. In t his sect ion, the JCR profil es -based FD D algori thm is integra ted wi th a model correction procedure to deal with FDD pro blem in the pre sence of model mismatc h. Fo r cl arity, i t is assumed that t he exact mea n values of I a nd R c for eac h operating modes (JCRs) are unknown to the modeler, thus a set of co rrection gains wi ll be used to compens ate the effec t o f model mismatch on FDD. Since the e xact mean values of faults are unkno wn, the me an values in the gPC model s of core and surf ace temperature are co rrected using model predictions and measureme nts collected at each time interval insi de the time moving windo ws, which can be described as: (20) (21) where T c0 and T s0 are the first coefficients ( i.e., mean values) in gPC mo dels o f the core and surf ace temperatures, I 0 a nd R c0 are the gPC coefficients in Equation (6 ) used t o approximate the mean va lues of I and R c , and are the meas urements o f te mperatures. Note that a nd are co rrection gains which will be recursively opti mized with the opti mization defined in Equation ( 17 ), T s2 , T c2 , T s4 , and T c4 are higher ord er gPC coefficients of core and surface temperatures, which can be determined Processes 2019 , 7 FOR PEE R REVIEW 14 with gPC models as given in Appendix A . In addition, A , B , and C are constants calcul ated using gPC models with the Gal erkin pr ojection. For ill ustration, Fi gure 9 shows the model correc tion re sults o f and , when the syste m is operated at di fferent operating modes as defined in Tables 2 and B1 in Appendix B . To introduce the model mismatch, a ±10% change was randomly added to these mean values given Table B1. Figure 9 . Correction gains and for different operating modes, wh ere solid lines (blue) are the correction gain used for core temperatures an d the dash-dotted li ne (red) are the r esults of surface temperature. For different JCR profiles, the first column in Figure 9 represents the correction gains of the core temperature calculated at e ach time instant, whereas the second co lumn i s the corr ection gain of the surface temperature . As ca n be see n in Fi gure 9, the pr ofil es of correction gains a nd fl uctuate within a certain range when the optimi zation of Equation (17 ) was executed, and eventual ly reach ed a plateau. For ex ample, the correction gain of the core t emperature , i.e., , varies sig nifi cantly when the opti mization was initiall y executed, e.g., 0 to ~ 80 minutes. In co ntrast, the ch anges in correcti on gains appear to be small er after approximatel y 80 min ute s of simulations . It is important to note that the pertur bations in corr ection gains may ei ther result fro m measure ment noise s or stochasticity in current I and co nduction res istance R c . In addition, it was fo und t hat correcti on gain o f the surface temperature stabili zes faster than the correc tion gain of co re temperature . Thi s is due to the fact that random variations i n I and R c can si gnificantly aff ect core tempe ratures as pr eviously di scussed in section 4.1 (see Figure 7) . Note that the size of moving time window ( L ) is set to 80 for simulations as shown in Figure 9, i.e., 8 0 measurements were used to o ptimize the corr ection gains at eac h time instant. The moving r ate M i s set to 1 in this case study. In addition, random noi se was added to the surface temperatures, which was further used to estimate core temperatur es for optimi zation as defined in Equation (17 ). Using these co rrectio n gains and the gPC coeffi cients, the di stributions of the core and surf ace temperatures as eac h time interval can be r api dly estimated. Fo r e xample, Figure 10 shows the simulation resul ts of temperatures for the normal operation. Based on the corrected gPC models and the distributio ns of temperatures, a set of JCR profiles can be formulated and u sed for FDD followi ng the steps as explai ned in Secti on 3.1. To evaluate t he efficiency of th e correc tion and its effect on FDD, two case scenarios were investigated. Fo r the first one, J CR profiles generated with the i naccurate mean values of I and R c were used, whereas the correcti on al gorithm was combined wi th the JCR - based FDD in the second ca se scenario. Table 3 shows the resul ts of FDD for bot h case studies. Processes 2019 , 7 FOR PEE R REVIEW 15 ( a ) ( b ) Figure 10 . Distribution of temperatures for a few time intervals estimated w ith the gPC coefficients and the correction g ains, which can be used to define a two -dimensional domain to gen erate JCR profiles for FDD: (a) Core temperature approximated with gPC and correction gain s an d (b) Surface temperature approximated with gPC and correction gains. As see n in Table 3, the fault classification rate r FCR ca n be i mproved ap proximately by 25% on average wi th the co rrection algo rithm defi ned in Equatio n ( 17). In addition, study was co nducted to investigate the effect of measurement noise on the a cc uracy of FDD, and Table 4 shows the results of r FCR with re spect to different l evels of measure ment noise. It can be seen th at the m easurement noise can signifi cantly affect the accuracy of FDD. For instance, the fault classification rat e r FCR is about 73% with a 5 % measurement noise in the surface temper atures, which has bee n dec reased about 22% , as compared with the c ase where the mea surement noi se is 1%. Table 3. Faults Classification Rate with different JCR Profiles. r FCR (%) JCR 1 JCR 2 JCR 3 JCR 4 without correc tion 59.1 62.3 59.9 69.7 with correctio n 89.6 89.7 82.7 88.4 Table 4. Faults Classification Rate of the Mo del C orrected by Optimization-based Model Correction. 1% 2% 3% 4% 5% r FCR (%) 95 89.6 84.5 78.2 72.7 Using the gPC model s, it was found that t he opti mization of Equation (17) for o ne functio n evaluation can be compl eted in ~1 second on average and the optimum can be ac hieved in about 30 iterations, which resul ts in an o verall si mulation ti me about ~30 seconds. On the other hand, it was found that if Monte Carlo simulations were used for updating the correction gains with 100 sam ples, ~5 minutes were re quired for one evaluation o f the optimization in Equation (17). Thus, 30 iteratio ns would take ~2.5 hours. This is si gnificantly higher than the gPC - based FD D meth od, which may be computationally pr ohibitive for a real -time applicatio n of model correction with M C. 5. Conclusions Lithium-ion (Li-ion) batteries are widel y used due to its h igher energy density and longer life as compared to other batteri es. Ho wever, the thermal behavio r can gre atly affec t the safety, du r abili ty, and performance of Li -ion batteries. Fault dete ction and diagnosis ( FDD), as a key component of the battery m anagement system, play an i mportant role in the management of Li -ion batteries. Thi s paper presents a stoch astic FDD al gorithm to identif y thermal dyna mic faults such as therm al runaway fault in Li -ion battery usin g generalized polynomial chaos (gPC) expansio n models. The pro posed algorithm consists of three consecuti ve pro cedures: ( i ) uncertainty pro pagatio n wi th gPC model s to evaluate the eff ect of uncertainty on meas ured quantit ies, which can be used fo r FDD; ( ii ) accurate fault diagnosis with JCR profil es, which can provide the probab il istic informati on of being in a faulty Processes 2019 , 7 FOR PEE R REVIEW 16 operating mod e; ( iii ) recur sive opti mization to adjust the FDD al gorithm to acc ount for mismatch between model s and therm al dynamics of Li -ion battery cells. It was found that th e gP C-based FD D method c an outperfo rm sampli ng-based tec hniques such as Mo nte Carl o ( MC) simul ations i n terms of computational eff iciency and FDD accurac y. Thi s ensures its on -line appli cations in Li -ion battery systems suc h as el ectric and hybrid electri c vehicles . However, the appl ication of the proposed FDD algorithm in co mplex systems is not purpo sed for brevity and left for future study. In additi on, it is assumed that the uncertai nty in this work follows standard distri buti on in the Aske y-Wi ener scheme for al gorithm clari ty. Fo r other distri butions, the arbitrary gPC algorithm as explained in our previous work can be used to improve the comput ational effici ency [40]. Appendix A . Results of the gPC expa nsion for the lumped therma l model of Li -ion ba ttery (A 1) ( A2 ) ( A3 ) (A4 ) (A5 ) (A6 ) (A7 ) (A8 ) (A9 ) (A10) (A11) (A12) where A , B , C , D , E , F , G , and H are all constants calculated wi th the Galer kin Projectio n. Processes 2019 , 7 FOR PEE R REVIEW 17 Appendix B Defin ition and description of faul ts and their mean value s Table B1 . Faults Definition and Descriptio n. JCRs (Mode) Mean values Type JCR 1 (Faulty 1) I = 16.2 , R c =1.68 Individual fault JCR 2 (Faulty 3) I = 16.2 , R c =2.28 Simultaneous faults JCR 3 (No rmal) I = 13.8 R c = 1 .68 No fault JCR 4 (Faulty 2) I = 13.8 R c = 2.28 Individual fault Appendix C Summary of comparison b etween gPC and MC Table C1. Comparison results between gPC and MC. Method Classification rate Computational time gPC 0.94 5 s MC (100 samples) 0.75 324 s * * Per optimization it eration of Equation (1 7) References 1. Tarascon, J.-M.; Armand, M. Issues and challenges facing r echargeable lithium batteries . Nature 2001 , 414 , 359 – 367, doi:10.1038/35104644. 2. Yan, W.; Zhang, B.; Zhao, G.; Weddington, J.; Niu , G. Uncertainty Management in Lebesgue-Sampling- Based Diagnosis and Prognosis for Lithium -Ion Battery . IEEE Trans. Ind. Electron. 2017 , 64 , 8158 -8166 , doi:10.1109/TIE.2017.2701790. 3. Dey, S.; Biro n, Z. A.; Tatipamula, S.; Das , N.; Mohon, S.; A yalew , B.; Pisu, P . Mo del-based real-time thermal fault diagnosis of Lit hium-ion batteries . Control Eng. Pract. 2016 , 56 , 37- 48 , doi:10.1016/j.conengprac.2016.08.002. 4. Wang, Q. ; Ping, P.; Zhao, X. ; Chu, G.; Sun , J. ; Chen, C. Thermal runawa y caused fire and ex plosion of lithium ion battery . J. Power Sources 2012 , 208 , 210-224, doi:10.1016/j.jpowsour.2012.02.038. 5. Charkhgard , M. ; Farrokhi, M. State- of -Charge Estimation for Lithium-Ion Batteries Using Neural Networks and EKF . IEEE Trans. Ind. Electron. 2010 , 57 , 4178-4187, doi:10.1109 /TIE.2010.2043035. 6. Zhang, J.; Lee , J. A review on prognostics and health monitoring of Li -ion battery . J. Power S ources 2011 , 196 , 6007-6014, doi:10.1016/j.jpo wsour.2011 .03.101. 7. Ding, S. X. Model-Based Fault Diagnosis Techniques: Design S chemes, Algorithms and Tools , 2 nd ed. ; Springer- Verlag: Berlin, Germany, 2013, doi:10.1007/978-1-4471-4799 -2. 8. Du, Y.; Budman, H.; Duever , T. A. Comparison of stochastic fault detection an d classification alg orithms for nonlinear chemical processes . Comput. Chem. En g. 2017 , 106 , 57- 70 , doi: 10.1016/j.compchemeng.2017.05.016. 9. Venkatasubramanian, V. ; Rengaswamy, R.; Yin, K.; Kavuri , S. N. A review of process fa ult detection and diagnosis: Part I : Quantitative model-based methods . Comput. Chem. Eng. 2003 , 27 , 293-311 , doi:10.1016/S0098-1354(02)00160-6. 10. Guo, G. ; Long, B.; Cheng, B. ; Zhou, S. ; Xu , P. ; Cao. B. Three-dimensional thermal finite element modeling of lithium-ion battery in thermal abuse applica tion. J. Power S ources 2010 , 195 , 2393-2398 , doi:10.1016/j.jpowsour.2009.10.090. 11. Chen, S. C. ; Wan, C. C.; Wa ng, Y. Y. Thermal analysis of lithium-ion batteries . J. Power Sources 2005 , 140 , 111 -124, doi:10.1016/j.jpo wsour.2004.05.064 . 12. Smith, K .; Wang, C. -Y . Po wer and thermal characterization of a l ithium-ion battery pack for hybrid-electric vehicles . J. Power Sources 2006 , 160 , 662-673, doi: 10.1016/j.jpowsour.2006.01.038. Processes 2019 , 7 FOR PEE R REVIEW 18 13. Doughty, D. H.; Butler, P. C.; Jungst, R. G.; Roth, E. P. Lithium battery thermal models . J. Power Sources 20 02 , 110 , 357-363, doi:10.1016/S0378-7753(02)00198-2. 14. Lin, X.; Perez, H. E.; Siegel, J. B.; Stefanopoulou, A. G.; Li, Y.; Anderson, R. D.; Ding, Y.; Castanier, M. P. Online Parameterization of Lumped Ther mal Dynamics in Cyl indrical Lithium Ion Batteries for Core Temperature Es timation and Health Monitoring. IEEE Trans. Control Sy st. Technol. 2013 , 21 , 1745 -1755, doi:10.1109/TCST.2012.2217143. 15. Klein, R.; Cha turvedi, N. A.; Christensen, J.; Ahmed, J.; Findeisen, R.; Kojic, A. Electrochemical Model Based Observer Design for a Lithium -Ion Battery. IEEE Trans. Control S yst. Technol. 2013 , 21 , 289 -301, doi:10.1109/TCST.2011.2178604. 16. Dey, S.; Ayalew, B. A Diagnostic Scheme for Detection, Isolation and Estimation of Electrochemical F aults in Lithium-Ion Cells. In Proceedings of the ASME 201 5 Dynamic Systems and Contro l Conference , Columbus, Ohio, USA, 28-30 October 2015, doi:10.1115/DSCC2015-9699. 17. Muddappa, V. S .; Anwar, S. Electrochemical Model Ba sed Fault Diagnosis of Li -Ion Battery Using Fuzzy Logic. In Proceedings of the ASME 2014 International Mechanica l Engineering Congress and Exposition , Montreal, Quebec, Canada, 14-20 November 2014, doi:10.1115/IMECE2014-37134. 18. Dey, S.; Mohon, S.; Pisu, P.; Ayalew, B. Sensor Fault Detection, Is olation, and Estimation in Lithium -Ion Batteries. IEEE Trans. Control Syst. Technol. 2016 , 24 , 2141-2149, doi:10.1109/TCST.2016.2538200. 19. Lombardi, W. ; Zarudniev, M.; Lesecq, S.; Bacquet, S. Sensors fault diagnosis for a BMS. In proceddings of the 2014 European Co ntrol Conference (ECC) , Strasbourg, France, 24-27 June 201 4 , doi:10.1109/ECC.2014.6862432. 20. He, H.; Liu, Z.; Hua, Y. Ada ptive Extended Kalma n Filter Based Fault Detection and Isolation for a Lithium- Ion Battery Pack. Energy Procedia , 2015 , 75 , 1950-1955, doi:10.1016/j.egypro.2015.07.230. 21. Gao, Z.; Ding, S. X.; Cec ati, C. Real -time fault diagnosis a nd fault-tolerant control. IEEE Trans. Ind. Ele ctron. 2015 , 62 , 3752-3756, doi:10.1109/TIE.2015.2417511. 22. Izadian, A.; K hayyer, P.; Famouri, P. Fault Diagnosis of Time-Varying Parameter Systems With Application in MEMS LCRs. IEEE Trans. Ind. Electron. 2009 , 56 , 973-978, do i:10. 1109/TIE.2008.2010095. 23. Du, Y.; Duever, T. A.; Budman, H. Gene ralized Po lynomial C haos -Based F ault Detectio n and Classification for Nonlinear Dynamic Processes. Ind. Eng. Chem. Res . 2016 , 55 , 2069-2082, doi:10.1021/acs.i ecr.5b04694 . 24. Du, Y.; Duever, T. A. ; Budman, H. Fault detect ion and diagn osis with parametric uncertainty using generalized polynomial chaos. Com put. Chem. En g. 2015 , 76 , 63- 75 , doi:10.1016/j.compchemeng.2015.02.009. 25. Guo, H.; Wa ng, X.; Wang, L.; Chen, D. Delphi Method for E stimating Membership Function of Uncertain Set . Journal of Uncertainty Analysis and Applications 2016 , 4 , 1- 17 , doi:10.1186/s40467-016-0044-1. 26. Liu, B. Uncertainty Theory: A Branch of Ma thematics for Modelin g Human Uncertain ty ; Springer-Verlag: Berlin, 2010, doi:10.1007/978-3- 642 -13959-8. 27. Patton, R. J.; Putra, D.; Klinkhieo , S. Friction compensation as a fault tolerant control probelm," Int. J. Syst. Sci. 2010 , 41 , 987-1001, doi: 10.1080/00207720903434797. 28. Sidhu, A.; Izadian, A.; Anwar, S. A daptive Nonlinear Model- Based F ault Diagnosis of Li- Ion Batteries. IEEE Trans. Ind. Electron. 2015 , 62 , 1002-1011, doi:10.1109/TIE.2014.2336599. 29. Yan, X.-G.; Edwards, C. No nlinear robust fault rec onstruction and estimatio n using a sliding mode observer. Automatica 2007 , 43 , 1605-1614, doi: 10.1016/j.automat ica.2007.02.008 . 30. Spanos, P. D.; Zeldin, B. A. Mo nte Carlo Treatment of Random Field s: A Broad Perspective. App l. Mech. Rev. 1998 , 51 , 219-237, doi:10.1115/1.3098999. 31. Xiu, D. Numerical Methods for Stochastic Computation: A Spectral Method Approach . Princeton University Press: Princeton, New Jersey, USA, 2010. 32. Mandur, J.; Budma n, H. Robust optimization of chemical processes using Bayesian description of parametric uncertainty, J. Process Control 2014 , 24 , 422-430, do i:1 0.1016/j.jprocont.2013.10.004. 33. Lin, X.; F u, H.; Perez, H. E.; Siege, J. B.; Stefanopoulou, A. G.; Ding, Y.; Castanier, M. P. Parameterization and Observability Analysis of Scalable Battery Clusters for Onboard Thermal Management. Oil Gas Sc i. Technol. 2013 , 68 , 165-178, doi: 10. 2516/ogst/2012075. 34. Savoye, F.; Venet, P.; Millet, M.; Groot, J. Impact of Periodic Current Pulses o n Li-Ion Battery Performance. IEEE Trans. Ind. Electron. 2012 , 59 , 3481-3488, doi:10.1109/TIE.2011.2172172. 35. Lin, X.; Stefanopoulou, A. G.; P erez, H. E.; Siegel, J. B.; Li, Y.; Anderson, R. D. Quadruple Adaptive Observer of the Co re Temperature in Cylindrical Li-ion Batteries and t heir Health Monitoring. In Proceedings o f the Processes 2019 , 7 FOR PEE R REVIEW 19 2012 American Contro l Conference (ACC) , Montreal, QC, Canada , 27 -29 June 2012 , doi:10.1109/ACC.2012.6315386. 36. Mahamud, R.; Park, C. Reciprocating air flow for Li -ion battery thermal management to improve temperature uniformity. J. Power Sources 2011 , 196 , 5685-5696, doi:10.1016/j.jpowsour.2011.02.076. 37. Smith, K.; Kim, G.; Darcy, E.; Pesaran, A. Thermal/electrical modeling for abuse‐tolerant design of lithium ion modules. Int. J. Energy Res. 2010 , 34 , 204-215, doi: 10.1002/er.1666. 38. Mathew, M.; Janhunen, S.; Rashid, M.; Long, F.; Fowler, M. Comparative Analysi s of Lithium- Ion Ba ttery Resistance Estimation Techniques for Battery Management Systems. En ergies 2018 , 11 , 1- 15 , doi: 10.3390/en11061490. 39. Pukelsheim, F. The Three Sigma Rule. Am . Stat . 1994 , 48 , 88-91, doi:10.2307/2684253 40. Du , Y.; Budman, H.; Duever, T . Parameter est imation fo r an inverse nonlinear sto chstic problem: reactivity ratio studies in copolymerization. Macromol Theor Simul. 2017 , 26(2), 1- 15 , doi: 10.1002/mats.201600095. © 2018 by the authors. Submitted for possible open access publication under the terms and conditions o f the Creative Commons Attribution (CC BY) license (http://creativecommons.org/licenses/by/4.0/).
Original Paper
Loading high-quality paper...
Comments & Academic Discussion
Loading comments...
Leave a Comment