PMU-based Distributed Non-iterative Algorithm for Real-time Voltage Stability Monitoring
The Phasor measurement unit (PMU) measurements are mandatory to monitor the power system's voltage stability margin in an online manner. Monitoring is key to the secure operation of the grid. Traditionally, online monitoring of voltage stability usin…
Authors: Kishan Prudhvi Guddanti, Amarsagar Reddy Ramapuram Matavalam, Yang Weng
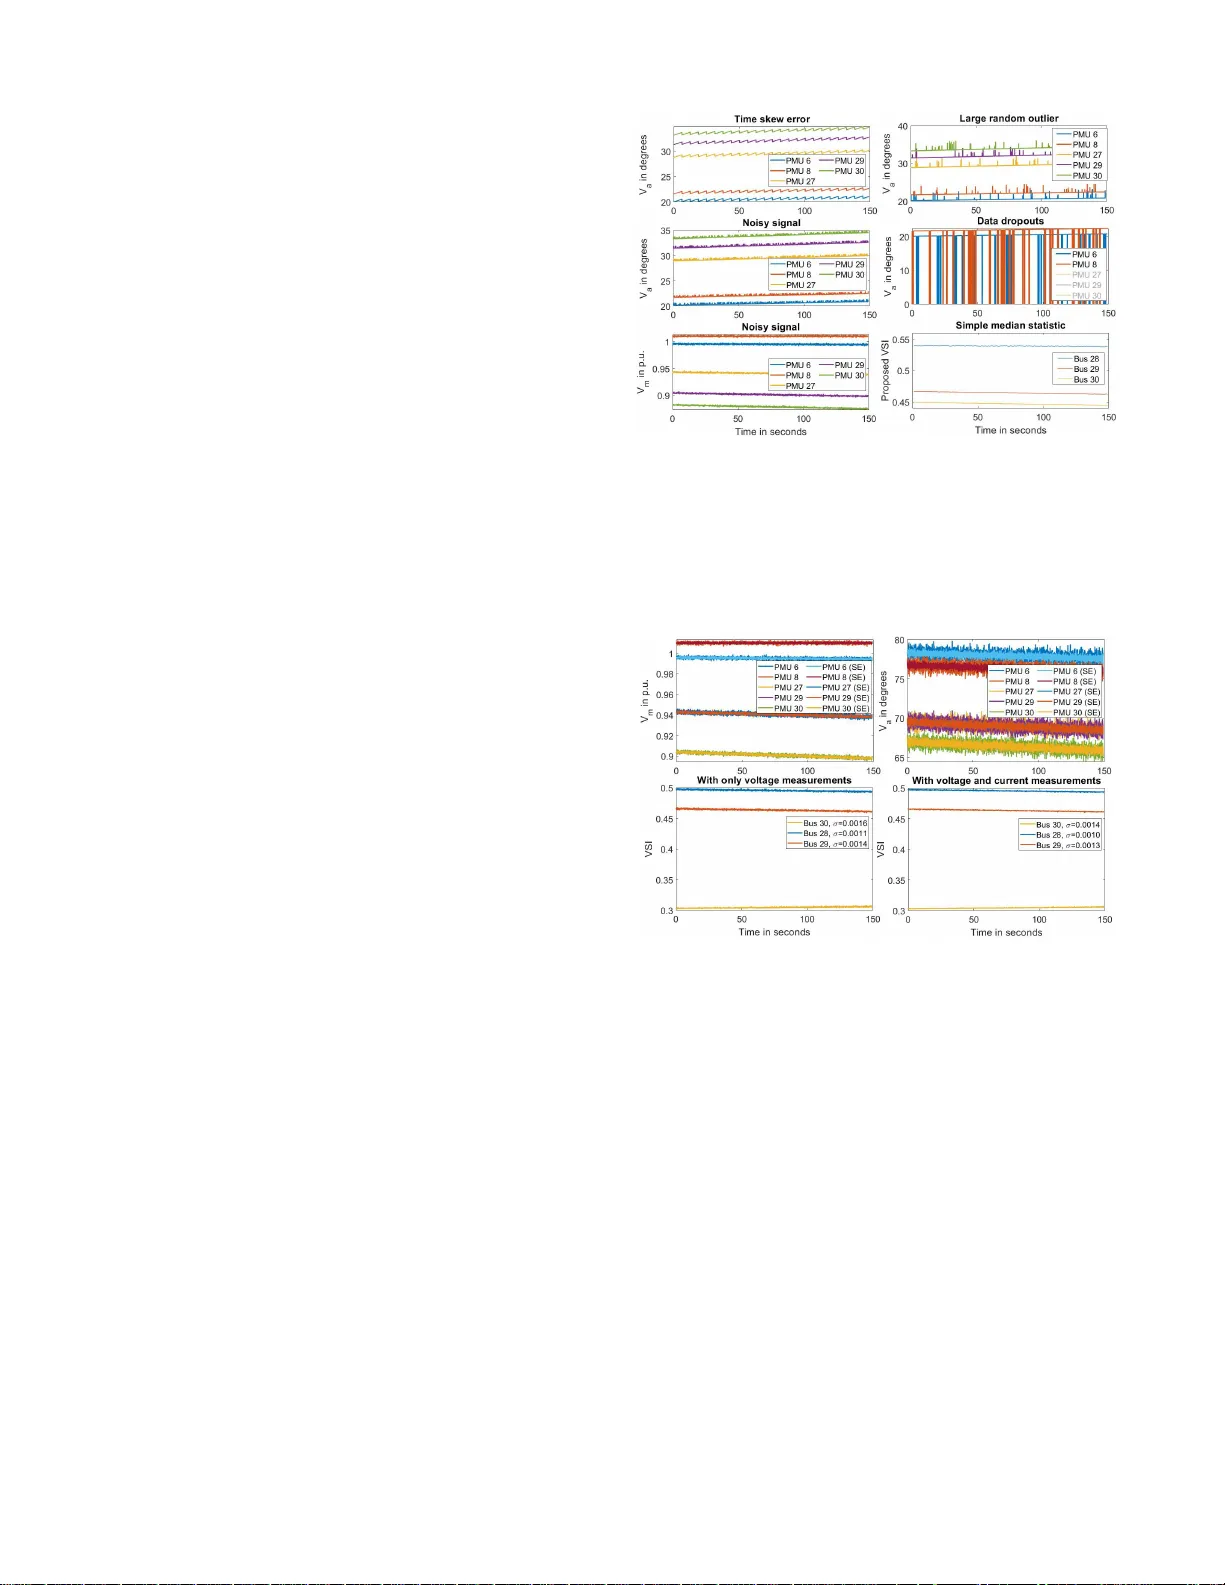
1 PMU-based Distrib uted No n -itera ti v e Algorithm for Real-ti me V oltage Stability Monitoring Kishan Prudhvi Guddanti, Student Member , IEEE , Amarsagar Red dy Rama puram Matav a la m, Me mber , IEEE , Y ang W eng, Memb er , IEEE Abstract —The Phasor measure ment unit (PMU) measurem ents are mandatory to monitor the power system’ s voltag e stabil- ity marg in i n an online manner . Monitoring is key to the secure operation of the grid. T raditionally , onl ine monitoring of volta ge stability using synchrophasors r equ ired a centralized communication architectur e, which leads to the high in vestment cost and cyber -secu rit y concerns. The in creasing importance of cyber -security and l ow inv estment costs hav e recently led to the deve lopment of distributed algorithms for online monitoring of the grid that are inherently less prone to malicious attacks. In this wor k, we proposed a nov el distributed non-iterative voltage stability index (VSI) by recasting the power flow equations as circles. The processors embedded at each bus in the smart grid with t h e help of P MUs and communication of voltage phasors between neighboring b u ses perfo rm simultaneous onlin e computations of VSI. The distributed natur e of th e index enables the real-time i dentification of th e critical bus of the system with minimal communication infrastructure. The effectiveness of t he proposed d istributed index is demonstrated on IEEE test systems and contrasted with ex isting methods to show the benefits of the proposed method in speed, in terpreta bility , identi fi cation of outage location, and l ow sensit ivity to noisy measurements. Index T erms —voltage stability , wid e-area mo nitoring and con- trol, Phasor measurement u nits, voltage collapse. I . I N T RO D U C T I O N The advent of ph asor measureme nt units (PMUs) and their wide-spread acc e p tance has made it possible to obtain real- time and time- synchron ized information of voltage an d c urrent phasors for use in diversified ap plications [1], [2]. Con se- quently , the pro liferation of PMUs tran sf o rmed th e power grid into a tightly integrated cyber-physical system, wh ere local computatio n is viab le for distributed mon itoring and coordi- nated con tr ol actions in real-time for wide-ar ea mo nitoring, protection , and contro l (W AMP A C). Among W AMP A C a pplications, o nline monitoring o f long- term voltage instability (L T V I ) is an area of intere st for industry [3]. Specifically , L TVI is a q uasi-static bifurcatio n (nose point of the PV curve) [ 4], caused by th e in a bility o f the K. P . Guddanti and Y . W eng are with the School of Electri - cal, Computer and Ener gy Engine ering at Arizona State Uni versity , emails: { kguddant,ya ng.weng } @asu.edu; A. R. R. Matav alam is with Depart- ment of Electric al and Computer Engineeri ng at Iow a State Unive rsity , email: amar@iast ate.edu. ©2020 IEEE. Personal use of this m ateri al is permitted. Permission from IEEE must be obtained for all other uses, in any current or future media, includi ng reprinti ng/republ ishing this material for adverti sing or promotional purposes, creating new collecti ve works, for resale or redistri butio n to server s or lists, or reuse of any copyri ghted component of this work in other works. Full citation : Guddanti, Kishan Prudhvi, Amarsagar Reddy Ramapuram Mata valam, and Y ang W eng. ”PMU-Based Distribut ed Non-Iterat i ve Algo- rithm for Real-T ime V oltage Stability Monitoring. ” IEEE Transact ions on Smart Grid 11, no. 6 (2020): 5203-5215. DOI: 10.1109/TSG.2020.3007063 This is the first method in the literature that is NOT Thevenin and NOT sensitivi ty type of approach in the literature while retains the advantage s of both Theve nin and Sensitivity based m ethods together . generation and tr ansmission system to pr ovid e suf ficien t p ower to loads, e.g., due to increased deman d, gene ration ou tage, o r generato r s on V AR limits [5], [6]. If left unattend ed, L TVI results in a system-wid e voltage collapse a n d blackout [7] , [8]. Using PMU measur ements, we can co mpute the ma rgin (a measu re of distance) from the curren t oper ating condition to L TVI. T h is m easure of distance is quantified using metr ics known as voltage collapse pr oximity in dices (VCPIs). The accuracy o f VCPIs depen d s on th e theoretica l basis u sed to derive th em, e.g., Thevenin circuit, sensitivity metho ds [9] , [10]. These methods compute the VCPIs by either decentral- ized(local) o r centralized co mmunicatio n arc hitectures. Con ventional centra lized VCPIs typically use Jacobian - based sensitivity indice s. These m ethods use Jacobian to identify L TVI sinc e the Jaco b ian matrix beco mes singular at L TVI [11], [12]. Howe ver, the calculatio n of the Jacobian requires voltage phasor in formation at every bus in the power system, which is expensi ve [13]–[1 6]. In add ition to this, the inter p retability of sensitivity based VCPIs is hard er than decentralized (local) VCPIs. I t is h ard bec a use, when the oper- ating point is close to the limit, th e co rrespond ing cen tralized VCPI value sudden ly increases, becom in g unboun ded. The un - bound ed n ature an d non -linear behavior make the centralized VCPI hard to in terpret as a fair d istance to the critical loading. References [13], [14], [17] addr ess the non-in terpretability partially in a centralized mann er u sing measu r ements fr om all the nodes in th e sy stem. Specifically , the original n -bus system is simplified into a 2 -bus multi-port coup led network equiv a lents. Howe ver , th ere is no theoretical pr o of th at the L TVI o f the fu ll-system can always be id entified using these simplifications. T o overcome th e drawbacks of centralized metho d s, meth- ods (in d ices) that utilize only local PMU me a surements at a sub station are developed to mon itor the L TVI loc ally , a n d these in dices are r eferred to as decentr a lized V CPIs [ 18]. Such VCPIs emp loy Thevenin-based metho ds by utilizing the q uasi- steady-state behavior of the power system to calcu late a 2 -bus Thevenin equi valent at a bus [18]. I n such an equivalent model, one n ode repre sen ts the bus of interest wh ile the other acc o unts for the rest of the system. The equ ivalent circuit e stimation only require s local m easurements (i.e., requires only a single PMU) at a bus of interest over a tim e period, mak ing it a decentralized ar chitecture. Once th e eq uiv alent circuit is estimated, an in dex value is co mputed at the bus of interest using max imum p ower transfer theorem [1 8]. Therefo re, these Thevenin-based meth ods have a nice prop erty of decentr a lized computatio n of the index values [18]–[2 1]. I t is also shown that the lo cal index can theoretically (in th e presence of no measuremen t no ise) always id entify the L TVI of the fu ll sys- 2 tem by corr elating it with th e Jacobian [ 11]. Interp retability is an ad ditional ad vantage of d ecentralized VCPIs, as the values are usua lly b etween 0 and 1 . Unfortu nately , the dece n tralized method suffers fr om error s in pr actice, especially due to the presence of measu r ement n oise, e.g., the local VCPIs ca n be inaccurate with large error s [22]. As the centralized and decentralized methods have trade- offs betwee n accuracy , cost, and inter pretability , we are in- terested in an intermed iate scheme to include these ad van- tages w ith out min imal trade- offs. Specifically , the centralized method requ ires measurem ents f rom the entire system, while the decentralized metho d only requir es the PMU me asurement on the bus of interest. In this paper , we propose to use an intermediate appr o ach that r e quires PMU measuremen ts from the n eighbor ing buses of the intere sted bus to calculate the proposed VCPI. This set up is k n own a s a distributed monitorin g scheme , as shown in Fig . 1. In this scheme, PMUs commun icate their measur ements at a bus in the physical layer with its ad jacent buses via the cyber layer . The p rocessor embedd e d a t each bus o nly uses its adjacent buses’ voltage phasor m easurements to comp ute the propo sed VCPI referred to a s voltage stability index (VSI). Fig. 1 : Cyber-physical form of a f uturistic power system with commun ication links. The PMUs cover all n o des in this cyber layer an d on ly comm unicate between neigh bours. This is wh en VCPI of every no de need s to be compu ted. In a scenario where the o perator would like mon ito r o n ly a few critical node s that are importan t, only a few PMUs a re n eeded as shown in Fig. 2. The stru cture of the p ower sy stem in Fig. 1 is for a future grid com munication architectur e. Some o f these com- munication advantages a re robustness to cyber-attacks on the commu nication nod es, and imp roved reliab ility o f com- munication s due to sho rter co mmunicatio n link s [2 3], [24]. Hence it is high ly desired to hav e a distributed commu ni- cation architecture due to its various advantages in con trast to star/centr alized architectur e. Hence it has been o f interest in the commun ity recently for distributed implem entation of v arious applications. F or example, W AMP A C [25]–[27], load shedd ing [2 8], [29], optimal power flow [30], econom ic dispatch [31], transfer capability assessment [32], and contr ol technique s in microgrid s [33], [34]. Even for VCPI, [2 6] uses such a d istributed comm unication setup, wh ere th e Jacobian is used to calculate a sensiti vity index iteratively . Un fortun ately , the advantage of th e trade-o ff between c e ntralized metho d and the dec e ntralized method is n ot utilized fully , making [26] suffer from 1 ) necessity fo r PMUs to cover all buses, 2 ) increasing computation al time as the power system opera tin g point g ets closer to critical load in g, 3 ) n on-interp retable nature of the ind ex, 4 ) the o retical flaw o f a ssum ing eigenv alue s of the Jacobian to be non-negative (inv alid in the IE EE 300 -bus network). Contributions : In this paper, we prop ose a novel dis- tributed index that overcomes the drawback s of [26] men tioned above. Instead o f exploiting the pr operties of the Jaco bian, we analyzed the po wer flow equ a tions themselves with a new perspective as circ le s in a distributed framework. Th is leads to a new voltage stability ind ex (VSI) that 1 ) does n ot need PMUs at all buses 2 ) is non-itera ti ve lead ing to fast computatio n irrespective o f system load ing, 3 ) is interp retable (norm a lize d between 1 and 0 ), wher e 1 ind icates n o-load and 0 indicates max imum load, 4 ) is exact (assumption free) unlike other ind ic e s in literatur e [1 3], [14], [1 7], [18]. This is the first time that a non-itera ti ve, ap proxim ation free as well as distributed co mmunicatio n based method has bee n prop osed for m onitoring the L TVI. The paper is organ ized as follows: Section II explains the power flow eq uations as circles in a distributed framework. Section III qua ntifies the distanc e between the power flow circles as a measure o f margin to L TVI . Section I V sh ows the effi cacy o f th e p r oposed schem e an d VSI via simu lations on d ifferent IEE E systems. Sectio n V conclude s the pap er . I I . P O W E R F L O W E Q UA T I O N S A S I N T E R S E C T I O N O F C I R C L E S Let p d and q d be the active an d r e a cti ve power in jections at bus d . Le t g k,d + j · b k,d be th e ( k , d ) th element of the admit- tance m a trix Y . v d,r and v d,i be the r e al an d imag inary par t of the voltage phasor at bus d , respectively . W e represent bus d ’ s neig h boring bus set as N ( d ) . Th e power flow eq u ations used in this paper are in rectangu lar co ordinate fo rm. Th ey are given b y p d = t d, 1 · v 2 d,r + t d, 2 · v d,r + t d, 1 · v 2 d,i + t d, 3 · v d,i , (1a) q d = t d, 4 · v 2 d,r − t d, 3 · v d,r + t d, 4 · v 2 d,i + t d, 2 · v d,i . (1b ) The pa rameters t d, 1 , t d, 2 , t d, 3 and t d, 4 are giv en by t d, 1 = − X k ∈N ( d ) g k,d , t d, 2 = X k ∈N ( d ) ( v k,r g k,d − v k,i b k,d ) , (2a) t d, 3 = X k ∈N ( d ) ( v k,r b k,d + v k,i g k,d ) , t d, 4 = X k ∈N ( d ) b k,d . (2b ) A. Distrib uted Natur e of P ower F lo w Equ ations as Cir cles The advantage of using po wer flow e q uations (1) comes from their visualization as circles. Specifically , for fixed con - stants t d, 1 , t d, 2 , t d, 3 , t d, 4 , equa tions (1a) and (1b) rep resents two circles at bus d in v d,r and v d,i space [12]. The re al power equation ( 1 a) at bus d can be represente d as a circle with cen ter o p and radiu s r p . The rea cti ve power equ ation (1 b) at bus d 3 can be represented as a circle with cen ter o q and radius r q . These cen te r s and radii ar e given by o p = − t d, 2 2 t d, 1 , − t d, 3 2 t d, 1 , o q = t d, 3 2 t d, 4 , − t d, 2 2 t d, 4 , (3a) r p = s p d t d, 1 + ( t d, 2 ) 2 + ( t d, 3 ) 2 4 t 2 d, 1 , (3b) r q = s q d t d, 4 + ( t d, 3 ) 2 + ( t d, 2 ) 2 4 t 2 d, 4 . (3c) Using th e centers and radii (3); the in tersection po ints of real and reactive power circles a t bus d p rovides the voltage solution v d at bus d where v d = v d,r + j · v d,i . I t is importan t to note that the expressions for the centers and rad ii of the power flow circles at bus d con tain t d, 2 and t d, 3 which contain the neighbo ring bus voltages v k,r + j · v k,i where k ∈ N ( d ) . T o plot th e p ower flow circles at bus d , the centers and radii in (3) are calcu lated lo cally b y the em bedded pr ocessor at bus d using th e voltage phasor measu r ements from th e PMUs located at the immediate neighbo ring buses to bus d . For example , to plot th e p ower flow circles at bus 3 in Fig . 2 , we only need the voltage phasors fr om the PMUs at buses 2 and 4 ; b r anch admittance of lines joinin g bus 3 to 2 and 4 . Fortun ately , in th e propo sed d istributed scheme, we do n ot nee d the admittanc e matrix o f the entire sy stem. Fig. 2: Cybe r-phy sical form o f the power system to m onitor the VCPI of bus 3 in the network using propo sed meth od. T o monitor the margin at bus 3 in an on line fashion, we only n eed the PMU measurements from its a djacent buses i.e., buses 2 , 4 and bran ch adm ittan ce of line s jo ining bus 3 to 2 an d 4 . W e do n o t need the a dmittance matrix of en tire system. The discussion above is for PQ buses with co n stant r eal an d reactive power con straints. I n the ca se of PV buses, we get constant real power and voltage con straints, which a lso lead to two circles, namely the r eal power circle (1a) an d voltage circle centered at the origin with rad iu s | V specified | . W e will next discuss how the power flow circles are impacted due to load increase. B. Impact of Lo ad In cr ease on P ower Flow Cir cles The long -term voltage instability is caused when the gener- ation and transmission system ca nnot sup ply power dem anded by the loa d. This situation corresp o nds to the lack of a solu tion for the p ower flow equatio ns. This c a n be iden tified b y looking at the intersection of power flo w circles con structed u sing PMU m easurements at bus d . Geo metrically , two circles can have two, o ne or no points of intersections. Hence, the voltage solution at b us d r epresented as an intersection of p ower flow cir c les can have ( a) two common points to indicate multiple feasible voltage solutions, or (b) one com mon p oint to indicate a single feasible voltage solution corr e sp onding to the no se point (L TVI) of PV curve, or (c) no c ommon poin ts to repr esent the in-feasibility o f oper ating cond itions. Before we p rovide an example, her e we present a high- lev e l data-flow of any voltage stability monitor ing method and explain the overall pro c e dure for the calculation of a VCPI. Th e sequential steps for any on lin e stability mo n itoring method are: ( a ) Collectio n of real-time PMU m e asurements from the grid, (b ) E stimation of power system states fro m the PMU measur ements, and (c) Utilizing the estima ted states to calculate an in d ex that p r ovides a m etric of the system stability (VCPI). At a given time step o r “snapshot”, we are monitorin g the voltages in the power g rid direc tly from the PMUs. When there is a load ch ange in the power grid chan ges in the next sna pshot, th e PMU voltage mea surements in the next snapsho t ar e au tomatically updated since PMU device voltages ar e fun c tions of loadin g on the power grid. Using these real-time PMU m easurements dir ectly the pr oposed index is calculated. Alter natively , the input mea su rements to calculate the p roposed ind ex can also be o btained f rom the output of a p reproce ssor such as a state estimator . For illustration purpose, we use a comp lete ly connected 3 - bus system with th e same branch admittance value o f 1 − j · 0 . 5 p.u. T o showcase the beh avior of power flow circles d ue to the im pact of load change, we will increase the lo a ding on the p ower gr id u ntil ther e is a blackout a n d o bserve th e power flow circles’ behavior . W e also assume the same ap p arent lo a d at bus 2 an d 3 , e.g., S 2 = S 3 for sim p licity . The loads at bus 2 and 3 are increased in 5 different time instan ts with the following values (in p.u.) [ − 0 . 01 + j · 0 . 3 3 , − 0 . 04 + j · 0 . 40 , − 0 . 1 3 + j · 0 . 44 , − 0 . 28 + j · 0 . 45 , − 0 . 49 + j · 0 . 4 3] un til the power flow circles at bus 3 had o nly one comm on point. T o calculate the power flow circles’ radius and center corr e- sponding to the 5 different time instan ts in real-time, we u se the d istributed co mmunicatio n arch itec ture describ ed in Fig. 2 to d irectly collect the re al-time PMU voltage measuremen ts for th e 5 different time in stants. Using these neighbor ing bus PMU voltages and (3), th e cir cles can be drawn in r eal-time. The corr e sponding power flow circles’ intersection is plotted as shown in Fig. 3, where the solid an d d ashed circ les indicate the reactive and r eal power circles r espectiv ely . In Fig. 3, the com mon po ints “ A”, “B”, “C”, “D”, and “E ” indicate the hig h er magn itude voltage solutio ns correspo nding to an app arent power load of [ − 0 . 01 + j · 0 . 33 , − 0 . 04 + j · 0 . 40 , − 0 . 1 3 + j · 0 . 44 , − 0 . 28 + j · 0 . 45 , − 0 . 49 + j · 0 . 43] p.u. respectively a t the bus 3 . I t ca n be obser ved that the reactive power circle steadily becomes smaller, an d the r eal power circle stead ily becomes larger as the system lo a d in c r eases. This behavior of power flow circles shows th at the circles move furth e r away f rom each othe r until they have only one commo n point (no se point) as th e loa d in creases to the critical value. This occu rs in Fig. 3 at the intersection o f black power flow circles. It cor responds to th e critical loading in the system and has only on e inte r section point “E”. This point 4 -0.4 -0.2 0 0.2 0.4 0.6 0.8 1 1.2 V 3,r 0 0.2 0.4 0.6 0.8 V 3,i E D C B A Fig. 3: Power flow circ le s at bus 3 with the voltage solutions for in creasing loads. represents the nose poin t of the PV cur ve. It is to be noted that all the p ower flow circles a t every bus will not touch each other exter n ally at a given sn a pshot, but only the p ower flow circles at the bus that is critically lo aded will tou ch extern ally indicating th e L TVI. Thus, the d istance between the power flow circles at the critical bus decr e a ses to ze ro as the load increases to the critical value. Hen ce, this distan ce can b e u sed as an indicato r of L T VI. Qu antifying the distance b etween the circles f or der i ving a VSI is described in the next section. I I I . C H A R AC T E R I Z I N G T H E D I S TA N C E B E T W E E N P O W E R F L OW C I R C L E S F O R V S I The distance betwee n the power flow circles constru cted using the PMU m easurements indicates the margin to reach L TVI. Th ere are several ways to quantify th e distan ce b e tween two circles. One suc h in dicator may con sider the distance between th e circles u sing their center s and rad ii. This distance is positive, zer o an d negative when the circles in tersect, touch externally an d do n ot intersect with each othe r , respectively . Another indicato r is the Eu clidean distance between the two common poin ts when th e circles intersect each other . When the circles in te r sect, to u ch externally , an d do no t inter sect with each other, the Euc lid ean distance b etween the two voltage solutions is positiv e, zero, and does not exist, r espectively . W e o bserved that the proposed in d ex (VSI ) derived b e low in con trast to the above mentioned po ssible for m ulations of distributed indices has a relativ ely better be h avior with changin g load ing. Different than the ind icators mentioned above, the pr o posed index is de r i ved b y using the con cept of th e family of circles instead of directly u sing (1a) and (1b). In th is sectio n first, we introdu c e the con c ept of d eterminant to infer the intersection of any two circles. Seco n d, using the deter minant, we derive the expression for the prop osed d istributed voltage stability index. A. Identifying the Intersection of P ower Flow Cir cles Using Determinant Giv e n real a n d reactive p ower circles, two impo r tant aspects have to be inferred to derive th e propo sed indicator . They ar e 1) the existence of a feasible solution, i.e., d oes the power flow circles intersect? and 2) if there is a f easible solu tion, then what is the distance to voltage collapse point?. These two aspects are analyzed by repre sen ting the power flow circles as a family o f cir c les, and this an alysis is facilitated by using th e determinan t concept [35]. T o study (1) a n d (2) aspects men tio ned in the above paragra p h, we need to an alyze how the real and re a cti ve power T ABLE I: Properties of c ir cles an d family of circles. Fig. 4: Family o f circles correspon d ing to the power flow circles (a r bitrary lo ading cond ition) at bus 3 of the 3 -bus system d escribed in Section II- B. circles interact toge th er i. e . , family o f circles (p a rameter o f circles). Gi ven two circles C 1 and C 2 , th eir family of circles C f is r epresented by the equatio n C f = λ 1 · C 1 + λ 2 · C 2 ∀ λ 1 , λ 2 ∈ R . For a g iven ( λ 1 , λ 2 ) p a ir , C f represents a single circle th a t passes th r ough the c o mmon points of circles C 1 and C 2 . Fig. 4 shows a typical illustration o f family of circles C f with radical axis. In Fig. 4, the radical ax is is the line that passes throu gh the commo n p oints of c ircles C 1 and C 2 . T able I p resents som e imp ortant g e ometrical prop erties of C f . From T ab. I, [35] shows th a t the determ in ant can b e used to study th e pro p erty o f symmetry o f C f around the radical axis. W e ca n see from T ab. I that th e symmetry ar ound the radical axis can dir e c tly indicate the co mmon po ints between the two given circles. T h e following provide s the inferen ces for th e appr o ach selected in this paper . For example, when the power flow circles intersect, the n we have common points between them and vice versa. From T able I, the mir ror ima ge (symmetry ) arou nd the ra dical a xis is a good indicator to identify if the power flow circles inter sect. Mathematically , p roperty of symmetry aro u nd the radical axis in Fig. 4 is indicated b y the determ in ant value of C f [35]. For example, a non -negative determinant value of C f indicates the symmetry ar o und radical axis, i.e., power flow circles in tersect, and th ereby a feasible solu tion exists. Similarly , a n egati ve determinan t value of C f indicates that the power flow cir cles do n ot in tersect. In Section III-B, we show tha t family of circles C f correspo n ding to real an d reactive power circles can be represen ted in a squ are matrix f o rm. This square matr ix form enab les us to calcu late its d eterminan t. B. Pr o p osed V oltage Stab ility Indica tor In this subsection to derive the prop osed VSI u sing deter mi- nant, first at given a load ing con dition, the power flow circles are c o mputed loca lly at a bus usin g PMU voltage ph asor 5 measuremen ts f rom its adjacent buses a n d these cir c les are then repre sen ted as square matric e s to enable th e d eterminant calculation. Second, we derive the prop o sed VSI by utilizing the properties of determinan t infer red in Section II I -A. Equation ( 4) represen ts the standard homogen eous for m of a circle ( C k ) with locu s z = x + j · y and z ∗ is co m plex conjuga te of z . The cen ter and radius o f the circle C k are denoted by γ = α + j · β an d ρ respec tively . Reference [35] shows the idea of repre senting circle as a hermitian matrix as shown in (5). The deriv ation f r om (4) to (5) is provide d in Append ix A. C k ( z , z ∗ ) = A · z · z ∗ + B · z + C · z ∗ + D = 0 , (4) , A B C D , 1 − γ ∗ − γ ( γ · γ ∗ − ρ 2 ) , (5) where A 6 = 0 . A and D are always real, B an d C ar e always complex co n jugates for a circle. Since the power flow equation s are also circles, they can be represented as hermitian matrices and suc h matrix r epresentation of power flow eq uations en able the determ in ant calculation wh ich helps to d erive the p r oposed ind ex. Matrix Representation of Power Flow Equations and Proposed VSI: Once we obtain the m atrix form of power flow equations, its deter minant is useful to 1) identify the existence of power flow solution and 2) distance to voltage c ollapse point. Similar to the above calculations, the elem e nts of real power c ircle-matrix C p are c a lculated using its cen ter (3 a) and radius ( 3 b) as shown b elow . C p , A p B p C p D p , A p = 1 , B p = − ( o p ) ∗ = − − b p 2 ∗ = b p 2 ∗ , C p = − ( o p ) = − − b p 2 = b p 2 , D p = ( o p ) · ( o p ) ∗ − r 2 p = c p , (6) where b p = t d, 2 t d, 1 t d, 3 t d, 1 T , b q = − t d, 3 t d, 4 t d, 2 t d, 4 T , c p = − p d t d, 1 and c q = − q d t d, 4 . Similarly , the reacti ve power circle- matrix C q is also shown below . C p = 1 b p 2 ∗ b p 2 c p , C q = 1 b q 2 ∗ b q 2 c q . Finally , the power flow equatio ns are represen te d as m atrices C p and C q respectively . As discussed in Section II I -A, to study the voltage collapse phenom enon one m u st analyze th e real and reactiv e power circles tog ether i.e., family o f circ les ( λ 1 · C p + λ 2 · C q ). Using th e inferen ces and pro p erty of determin ant described in Section. III - A, at a given loading conditio n C f is giv en b y C p + C q and the expression for its determinant | C f | (say ∆ ∗ ) is given by (7). ∆ ∗ = ∆ p · ∆ q − ∆ 2 pq . (7) where ∆ p = c p − k b p k 2 4 ! , ∆ q = c q − k b q k 2 4 ! , ∆ pq = 1 8 · k b p − b q k 2 − 1 2 · k b p k 2 4 − c p ! − 1 2 · k b q k 2 4 − c q !! 2 . W e deter m ine ∆ ∗ by calcu lating ∆ p , ∆ q and ∆ pq at a given loading condition using the centers and radii. The p ower flow circles touch each other at the voltage co llapse point (no se point of the PV c urve). In such a scenario, T ab. I shows that the determinan t ∆ ∗ should become ze ro. Hen ce th e lower bo u nd of ∆ ∗ is zero, which o ccurs at the n ose point of the PV cur ve (externally tou ching circles). However , to inter pret the results of the proposed index, it shou ld r ange between 1 and 0 . In order to b ound the upper lim it of ∆ ∗ , we normalize it using the n o-load value of the index. The no rmalized form of ∆ ∗ is the pro posed VSI, as sh own below . Proposed VSI ≡ ∆ ∗ norm = ∆ ∗ ∆ ∗ no-load , (8) where ∆ ∗ no-load is the value of (7) with zero load. Appe n dix B provides an explanation o f the nea r-linear be haviour of the propo sed ind ex for a 2 -bus system. Remark 1. ( VSI for PV Buses ): (8) is the d istrib uted VS I for a P Q bus, and a similar VS I ca n b e derived for a PV bus. F o r PV buses, the vo ltage solution is determine d by the intersection of voltage and real power cir cles, and the distance between them indicates the V AR limit violation. These circles ar e again computed using the PMU voltage p hasor measur ements of adjacen t buses. I V . S I M U L A T I O N S A N D D I S C U S S I O N The proposed distributed non-iterative VSI is tested o n various test cases such as IEEE 3 0 , 300 an d 238 3 -bus systems [36]. T o obtain the voltage phasor measuremen ts and true voltage stab ility margin, we use an adap ti ve Newton-Raphson step si ze based power flow solver k nown as contin uation power flow (CPF) [37] fr om MA TPO WER [38]. CPF calcu- lates the voltage solution on the PV cu rve b y incr easing the load and generation along a load/gener ator increase direction parametrize d by continua tio n p arameter λ [37]. In this section, we sh ow that the pro p osed d istributed VSI is advantageous compared to bo th centra lized and d ecentralized VCPIs. W e also co mpare the proposed d istributed ind ex with the only o ther distributed method [26] in the literatu re to show its merits. Finally , we sh ow the beh avior of the pr o posed index for lin e & generator outag es. 6 A. Non-iterative Distrib u ted VSI V ersus Centralized VCPIs T ABLE I I : Comparison between centralized, propo sed d is- tributed VSI and decentra lize d VCPIs to monitor buses 1 4 , 29 and 3 0 in IEEE- 3 0 bus sy stem [36]. VCPI calcu lation method No. of PMUs require d Sensiti vity to noise Full admitta nce matrix Single point fail ure Central ized 30 Low Require d Y es Distrib uted : iterat ive inde x [26] 30 Low Not required No Distrib uted : proposed index 5 Lo w Not required No Decent ralize d 3 High Not require d No The power sy stem op erator gener ally mon itors the power system from a con trol ro om. I n practice, ther e are specific regions of the power system that are critical fo r L TVI an d can be identified by offline mean s. Thu s, the operator is interested in o nline L TVI monito ring in a few strategic loca tions/regions. For instance, in the IEEE- 3 0 bus system, the operato r would like to monitor th e buses 14 , 29 and 30 . T o calculate cen- tralized VCPIs at buses 1 4 , 29 and 30 , the voltage measure- ments at all the buses in the p ower system are requir ed, i.e., full observability . T o calculate the proposed d istributed index at buses 14 , 2 9 and 30 , the voltage measu r ements at on ly their imm ediate neighb oring buses a r e requ ired. The adjace n t nodes conn ected to buses 14 , 2 9 an d 30 are buses (12 , 15) , (27 , 30) and (27 , 2 9 ) respectively . Thus we only require 5 PMUs at buses 12 , 15 , 27 , 29 an d 3 0 to calculate th e prop o sed distributed VSI. Additionally , the p roposed VSI d oes not requir e th e com- plete knowledge of the system admittan ce matrix. Instead, it takes advantage of the sparse natur e of power sy stem graph b y using o nly branc h admittance values of br anches conn ecting to buses 14 , 29 and 30 to calculate the prop osed distributed index. T ab le II pr esents the requirem ents of centralized, de- centralized, an d distributed meth ods such a s pr oposed index, existing iterative index [2 6] to monito r buses 14 , 29 and 30 . It is impor tant to no te that ev en though the iterati ve distributed index p roposed in [ 26] uses comm unication links b etween the neighbo ring buses, [26] mandates re q uiremen t of PMUs at all buses in the grid for co n vergenc e of its itera ti ve a lgorithm. Whereas the propo sed metho d does no t req uire PMUs to cover all the buses. B. Non-iterative Distributed VS I V ersus Decentralized VCPIs In this subsection, w e co m pared the pr o posed VSI with other m e thods (decentr alized and distributed in dex [2 6]) when there is noise in th e PMU measurem ents, and we show that the propo sed VSI is less p rone to noisy measur ements. T o understan d the impact of noise o n the pro posed method ology , an additive Gaussian no ise with zero mean and standard devi- ation of 0 . 0 0 1 p.u. o n voltage magn itude ( σ V m = 0 . 001 p.u . ), 0 . 5 ◦ on phase angles ( σ V a = 0 . 5 ◦ ) are introd uced in th e measuremen ts ac c ording to the analysis of field-tested PMUs by New En gland ISO [39], [4 0] an d IEEE standard for acceptable PMU errors [4 1]. T o dem onstrate the robustness of the prop osed VSI with regard to n oise, it is comp ared to Fig. 5: Effect of noisy measu rements with different noise levels on d e centralized (L TI ) and propo sed distributed index. L TI is more sensitive to no ise du e to its appro ximation errors. the local Thevenin index ( L TI) i.e., a decen tralized VCPI [1 8], [21], [42] an d distributed sensitivity index [ 26]. The results are shown in T ab. III and Fig. 5 und er different noise levels. T ABLE III : The standa r d deviation ( σ ) for the propo sed VSI, L TI and distributed sensitivity ind ex [26] at bus 3 0 in IEEE- 30 bus system when Gaussian noise is introduced in the voltage phasor measu rements. Noise in voltage angle ( σV a ) and magnitude ( σV m ) Proposed inde x (VSI) Local The veni n inde x (L TI) Distrib uted iterat ive sensiti vity inde x [26] σV m = 0 . 001 p. u . σV a = 0 . 01 ◦ , [41] σ = 0 . 0043 σ = 0 . 0184 σ = 0 . 0057 when con ver gence tolera nce = 0 . 001 σV m = 0 . 001 p. u . σV a = 0 . 5 ◦ , [39] σ = 0 . 0058 σ = 0 . 1942 σ = 0 . 0084 when con ver gence tolera nce = 0 . 1 σV m = 0 . 001 p. u . σV a = 0 . 5 ◦ , [39] σ = 0 . 0058 σ = 0 . 1942 algorit hm di ver ges when con verge nce tolera nce = 0 . 001 From T ab. III, it c an be o bserved th at the propo sed VSI has a min imal standard deviation wh en compared to that of both L TI and distributed sensitivity index [2 6] f or dif- ferent noise levels. Additionally , the standard deviation o f L TI incr e ases con siderably when σ V a = 0 . 5 ◦ . However , the propo sed ind ex an d distributed iterative sen sitivity index [26] are not so imp acted by the increase in the noise of voltage angle measur ements. Despite the lower stand ard deviation of distributed iterative sen siti v ity index in T ab . I II, it is impo rtant to note that th e metho d [2 6] suffers from non -conv ergence as the noise inc reases. For example, whe n σ V m = 0 . 001 p .u. and σ V a = 0 . 5 ◦ , the d istributed sensitivity index [ 26] does not conv e rge whe n its c on vergence tolerance is 0 . 0 01 but conv erges for a lower level no ise of σV a = 0 . 01 ◦ with same toleran ce setting . This creates a challeng e in setting the threshold for con vergence [26] when deployed in the field since th e PMU measurem e n ts have variable noise levels. In contrast, the prop osed ind ex has no such drawback as it is a non-iter a ti ve index an d it is also least sensitive to the n oise in PMU m e asurements as shown in T ab. I I I. From Fig. 5, L TI is mo re sensitiv e to noise th an that of the pro p osed distributed ind ex d ue to its appro ximation erro rs [18]. Similarly , from T a b. III, the distributed iterative ind ex is 7 more sensitive to noise than th e p roposed distributed index due to its iterative natu re. Wh ile the propo sed distributed index is the least sensitive on e to noise. C. Effect of PMU V o ltage Pha so r Data: Measurement Noise V ariability , Lar ge Measurement Outliers, and Missing Data W e furthe r investigate the effect of bad qu ality ph asor mea- surements from PMUs on the p roposed index. T o ha n dle these bad quality ph asor measurem e nts, one must use a prep rocessor that takes bad q uality measurem e n ts like inpu t an d outpu ts the filtered/better measurem e nts. Th e se filtered m easurements are used to calcu la te the prop osed distributed in dex. D e p ending o n the quality of d ata, this prepr ocessor can b e a state estimator, bad data detector, low-rank matrix methods, etc. an d this prepro cessor is independent of the proposed metho d ology . V arious typ es of error s such as clock drift er rors, me a surement spikes, high amount of noise, and missing data can lo wer the quality of the PMU d a ta [ 43]. W e gen e rate PMU voltage phasor data th at is very close to the real-world using th e error statistics pr esented in [39], [43] a s shown in Fig. 6 . In th is subsection, we u se n oisy PMU measuremen ts to calculate the propo sed index at buses 28 , 29 , and 30 of IEEE - 30 bus system. Since th e se noisy measurem ents with d ifferent types of errors can d ir ectly impact the quality of the VCPIs, the pr oposed index is calculated b y using th e o utput measuremen ts of a prepro cessor that uses simple r obust statistic such as median of the PMU measur ements in the given time window (e. g ., 1 sec). Fig. 6 shows that the pro posed index is no t affected by any of the data dropou ts, me a surement spikes, and the device clock errors. In co ntrast to [2 6], d ue to the iterations in volved, it is un clear h ow th e d istributed iterative ind ex [ 26] handles the d ifferent kinds of no ise like missing data, time ske w , measuremen t spikes and large white noise. Dif f erent methodo logy b a sed prepr o cessors pr ovide d ifferent q uality of measuremen ts. Irresp e cti ve of the pr eprocessor, fo r a given same amou nt o f input noise signal, we show that th e prop o sed index is ro bust ( T ab . III, Fig. 5) an d fast (T ab. IV, T ab . V) when compare d to other methods [18], [21], [2 6], [4 2]. Thus, th e prop osed methodolo gy is robust to various kinds of no ise ty p es and le vels when co mpared to [18], [21], [26], [4 2], ensurin g that the alarms trig gered using this VSI will have fewer false-positive rates, provid ing a reliable grid monitorin g scheme. For an illustration o f the impac t of a prepro cessor on the p roposed ind ex, we presen t two cases i.e., 1) distributed state estimator that uses b oth curren t an d voltage measuremen ts, and 2) low-rank matrix m ethod. 1) Fig. 7 sh ows a p reproce ssor that uses th e same distributed comm u nication architecture requirem ent as that of the prop osed VSI can use redund ant local bran ch curren t measuremen ts to imp r ove the noisy d ata an d there b y increase th e acc u racy of the pro posed method. Gener ally , the p roposed ind ex is rob ust to noise. Howe ver, in cases when there is an imp act o f n oise, it is recommen ded to u se a distributed state estimation based pre- processor that u ses r edundan t b r anch cu rrent measu rements to further im p rove the pe r forman ce of the prop osed method ology . 2) Fig. 8 shows a p reproce ssor that can recover large chunks of missing data wher e a simple m edian statistic will fail. Specifically , we used the OLAP-t method [4 4] to r ecover th e missing data in a 2 second window frame fro m a PMU lo cated Fig. 6: Th e subp lots in this figu re present the different types of PMU error s obser ved in real-world [43]. These different noisy measurem e n ts are gene rated by using th e err or statistics from [43]. The last subplo t shows the performan ce o f the propo sed index that uses a simple median statistic on a one second window size to hand le various bad quality PMU data mentioned above. Fig. 7 : Preprocessor 1: Reduction of noise in PMU mea- surements using only voltage o r bo th voltage and curr ent measuremen ts (SE). Im provement in the a ccuracy of pro posed VSI d ue to better qu ality measure ments. at bus 8 . In th e IEE E-30 bus sy stem, buses 6 , 8 , 27 are the neighbo ring buses to bus 28 . It is impor tant to use data only from buses 6 , 8 , 27 to re c over th e missing data a t bus 8 due to the distributed commun ication ar chitecture (fr amew ork) used by the p roposed metho dology . W e used the re c overed data from [44] and a simple heuristic that uses last k nown n on-zer o values to calculate the p roposed ind ex at bus 28 . Fig. 8 shows that [ 44] is more ac c urate than th e simple heuristic m ethod especially wh en there is mo re missing data. D. No n -iterative Distrib u ted VSI V ersus Iterative Distributed Sensitivity In dex In this subsection , we com pare the interpretab ility of the propo sed ind ex an d iterative distributed sen sitivity index [26] and show that th e propo sed index can provide a measu r e of distance to system voltage c o llapse. W e also discuss the number of itera tio ns ta ken b y [26] in co ntrast with the non- iterativ e natur e of the prop osed index. 8 Fig. 8: Preproc e ssor 2: Recovery of large chunk s of missing data using [44] and a simple heu r istic that u ses the last known non-ze r o measur ement value. T he ou tput of the prep r ocessor with [ 44] im proves th e accu racy of the propo sed index when there are large chun ks of missing data from PMUs due to their CT/PT failures. (a) Proposed index values with increase in system l oading to a critical v alue ( λ = 2 . 8 ) from no load condition ( λ = 0 ). (b) Inde x v alues from [26] with increase in system loading to a critical v alue ( λ = 2 . 8 ) from no load condition ( λ = 0 ). Fig. 9: Index values of prop o sed VSI and [26] versus system load scaling factor . 1) Pr o portional Loa d & Generation Incr ease In this ca se, first, we verify the p roposed VSI co r rectly identifies the cr itical bus in the system th a t causes the L TVI by comp aring it with the only o th er distributed m ethod [26] in the literature. Seco nd, we show that the proposed V SI is easier to in ter pret compa r ed to [26]. λ (co ntinuation param eter from CPF) is d efined as the loa d scaling factor that scales the loads and g enerations in IEEE - 30 bus system and contin uation power flow (CPF) solver [37] from MA TPO WER [ 3 8] is used to generate voltage phasor measurements for eac h λ . The voltage measure m ents for each λ are used to calcu late the prop osed non- iter ativ e d istributed VSI. Fig. 9a shows the propo sed distributed ind ex values versus load scaling factor λ for IEEE- 3 0 bus system. Th e first observation is that at the critical lo ading ( c orrespon ding to λ = 2 . 8 ), bus 3 0 h as the lowest voltage ma g nitude of 0 . 51 p.u. in the entire network. The reason f or bus 30 to be critical is d u e to its location being electrically farthest away fr om the generato rs and synchro nous conden sers. When th e loa d scalin g factor λ is gr eater than 2 . 8 , there is no feasible o p erating solution id entified by CPF du e to the L TVI ph enomen on. Consequ ently , wh en λ = 2 . 8 , the propo sed distributed ind ex value c a lc u lated at bus 30 is the smallest amon g a ll buses, and it is very close to 0, im p lying that this is th e critical bus in the system that ca uses the L T VI. This fact is also verified by compa r ing it with a distributed iterativ e sensitivity meth od [26]. Fig. 9 b presents the index values of [26] versus lo ad scaling factor ( λ ) and it also shows that the critical bus is bus 30 i.e . , the b u s with maximum sensiti vity in dex value at λ = 2 . 8 . Th us the VSI cor rectly identifies th e critical bus in th e system. Howe ver, It can be seen that the sensitivity index varies in a n extremely non - linear manner with the load scaling (continu ation) par ameter ( λ ). Distributed itera tive sensitivity index in Fig. 9b is unbo unded at λ = 2 . 8 , makin g it hard to interpret the distance to voltage co llap se p oint. Whereas, the distributed non -iterative VSI in Fig. 9a is bo unded between 1 and 0 cor respondin g to no-loa d an d loadab ility limit, respectively . This makes the propo sed index a good ind ic a tor to interp r et th e distance to voltage collapse p o int. Hence the n o n-interp retability and non- linear n ature of the sensitivity metho ds makes it hard to set monitorin g thr esholds to reliably trigg er con trols while the propo sed in dex solves these problem s by effecti vely using the PMU measur ements. A similar study for larger test case systems such as IEEE- 3 00 and IEEE- 2 383 along with their critical buses are also pr e sented in Fig. 10a and Fig. 10b respectively . Even th ough the propo sed in dex value at th e critical bus (e.g., bus 30 ) is expected to be 0 at critical loading ( λ = 2 . 8 ), we observe that the index value is a very small non -zero value (VSI = 0 . 03 ) from Fig. 9a. This behavior is d ue to the numerical instability (ill-cond itioned Jaco bian) o f the power flow so lver (CPF) fr om MA TPO WER [38], wh ic h is used to generate the voltage ph asor measureme n ts. For examp le, when the load ing cond itio n λ is very clo se to the nose p oint of the PV curve, it is well- known that the power flow Jaco bian becomes ill-conditioned and power flow so lvers div e rge [4 5]. Due to this divergence behavior , it is not possible to accu rately generate the voltage phasor measur e ments correspo nding to the nose poin t of the PV curve, wh ere the prop osed index becomes ze ro. Henc e we see very small no n-zero values in Fig. 9a. Howe ver , this limitation is not present whe n the propo sed index is dep loyed on th e field becau se the voltage phasor measu rements are taken fro m the PMUs directly . 2) Comp utation P erforman ce of VSI In this case, we first com pare the p e rforman ce of the propo sed distributed non -iterative index with that of th e d is- tributed iterative index [26] und er two scen arios. Th ey are a) increase in system loading and b) the p resence of noise in voltage phasor measurements. a) In case of an increase in system loading λ , from T ab . IV, in the presence of both no ise and no no ise, the time is taken by th e d istributed iterative 9 0 0.5 1 1.5 , Continuation parameter 0 0.2 0.4 0.6 0.8 1 Distributed non-iterative VSI Bus = 282 Bus = 287 Bus = 291 Bus = 297 Bus = 268 Bus = 99 Bus = 138 Bus = 46 Bus = 136 (a) The distributed non-iterativ e voltage st abili ty index for IEEE- 300 bus systems. The weakest bus when the entire load in the system proportionally increases is bus 282 . 0 0.5 1 1.5 2 , Continuation parameter 0 0.2 0.4 0.6 0.8 1 1.2 Distributed non-iterative VSI Bus = 466 Bus = 230 Bus = 221 Bus = 57 Bus = 1907 Bus = 1906 Bus = 796 Bus = 880 (b) The distri buted non-iterativ e vo ltage stability index for IEEE- 2383 bus systems. The weakest bus when the entire load in the system proportionally increases is bus 466 . Fig. 1 0: Th e d istributed n on-iterative voltage stab ility ind ex for I EEE- 300 and IEEE- 2 3 83 bus systems. T ABLE IV: T otal time and iterations taken by the prop osed and existing m ethod [26] with different direction s of load increase at buses 1 − 16 and 1 7 − 30 for various system lo a d ing values ( λ ) an d noise. method [26] inc r eases with incr e ase in system load ing λ . This behavior is not desirab le since the u p dating frequ ency (calculation time) of the distrib ute d iterati ve index is not constant, and it is d ependen t on the load ing co ndition ( λ ). Fortunately , the time taken b y the prop osed in dex is constant and almo st n egligib le f or any loading λ du e to its time complexity being O (1 ) ( non-iter a ti ve index). b) In p resence of noise in voltage p hasor measu r ements, it can be seen from T ab . I V that for any system loading λ , the time taken b y the distributed iterative in dex [ 26] is higher than that of the n o noise scenar io. T o speed -up the distributed iterative index, its conv ergence tolerance has to be v a r ied based o n the noise lev e l in me a surements. Howe ver, it is no t practical to adjust the conv ergence tolerance depend ing on varying noise levels in an on line monito ring application. Fortunately , ag a in the time taken b y the propo sed metho d is no t affected b y the no ise level in measuremen ts due to its approx imation free formu lation and non-iter a ti ve natur e. T ABLE V: T o tal time, iter ations, Flop an d Flops (flop per second) taken by the pro posed and existing [26] m ethods to calculate the ir indices value fo r bus 30 . For a b etter comp arison of th e p roposed and e xisting iterativ e method [2 6], T ab. V presents the totals floating-po int operation s per secon d (Flops) taken by bo th the method s. T o c a lculate the flops, we use the inf ormation from [46] to determine the cou nt o f flop need e d for p erformin g m athemat- ical o perations such as addition , subtraction, multiplication , and division. The num ber of flops req uired to calculate th e propo sed in dex at bus n , which has “ M ” n eighbo r ing buses = 8 · M + 37 . While, th e total coun t of flop requ ired to ca lcu late the existing iterative m ethod = 16 · M + (16 · M + 360 ) · I , where “ I ” is the total iterations taken b y the iterative method to converge. In case o f the proposed meth od, sin ce it is a non-iter a ti ve approach the r e q uired numbe r of flops expression does no t have “ I ” ( n umber of iteration) in it. E. Behavior o f P r oposed VSI after Line & Generator Ou tage Network reconfigu ration due to line ou tage (either d ue to faults or f or main tenance) is a frequen t occurrenc e in the power system. On e key in put to the p roposed metho d is the admittance of lines co nnecting neighb oring buses. In case of a line outag e, this in formation is outdated and so it is importan t to in vestigate the behavior of the index in this scenario. W e identified that the p roposed in dex accurately tracks the system stress in real-time even wh e n using the ou tdated line admittances. In o rder to study th e e ffect of topo logy change on the VSI, the line between buses 15 a n d 23 in th e IEEE 30 -bus system is taken o ut of serv ic e at time t = 138 secs as the load is incr e asing. Fig. 11 plo ts the V SI at buses 1 4 , 15 , 18 & 19 and it is o bserved that V SI dro ps the momen t th e line outage occu r s a t time t = 138 secs, indicating that the system is stressed and ma rgin to voltage collapse poin t has red uced. It is also observed fro m Fig. 11 that the values of the VSI at various buses are very similar when using u n-upd ated and updated connectivity infor mation. Thu s the distributed VSI calculation metho dology p rovides a reasonab le estimate of the VSI f or the op erator/relay to trigg er controls/alarm s in the time it ta kes to c orrect the ad mittance information , th u s im proving the situational awareness of the grid. I n addition, it can also be o bserved that the index a t bus 15 that is clo sest to the line outage red uces the most and this fact can be used to id e ntify the fault location in an u n supervised m a nner . Another distur bance that is c o mmon is the outage of a generato r . W e in vestigated this scena rio an d observed that the pr o posed VSI accura tely tracks the system stress after a generato r outa g e and can identify the cr itical buses. Consider the IEE E- 30 bus system, generato r two located a t bus 2 is outaged at 5 0 secs and gen erator five loca ted at bus 23 is outaged at 93 secs. W e can observe from Fig. 12 that at time t= 50 secs an d t=93 secs, VSI at all the b uses dro p , 10 Fig. 1 1: Line outag e be twe en buses 15 an d 2 3 in IEEE-3 0 bus system. E ffect of updating Ybus (new Ybus) and not upd ating Ybus (old Ybus) o n pr o posed index. 0 20 40 60 80 100 Time in seconds 0 0.2 0.4 0.6 0.8 1 Distributed non-iterative VSI Bus 5 Bus 15 Bus 24 Bus 30 Gen-2 out of service Gen-5 out of service Fig. 1 2: Behavior of VSI for g en-2 (bus 2) and gen-5 (bus 23) outages in IEEE-3 0 bus system. indicating rising overall sy stem stress. Fu r ther , the dro p is more at locatio ns closer to the ge nerator w ith larger p ower output (g en-2), quan tifying the se verity o f th e outag e. Thus, these results validate the pr o posed VSI’ s ability to identify L TVI and demo nstrate it’ s u tility to mon itor voltage stability using measur e ments in a distributed m anner un der various d istur bances such as network r e configura tion and generato r outage. V . C O N C L U S I O N This p aper prop o ses a PMU measur ement-based voltage stability index tha t can accur ately iden tify lo n g term voltage instability of the system. The key novelty o f th is work is the mathematical deriv atio n of the index to reflect voltage security a n d its d istributed nature. Th e index is d eriv ed by analyzing the power flow equatio ns in th e rec ta n gular f orm as circles, a n d at the n ose poin t, the value o f the index at th e critical bus is zer o. In add itio n, the d istributed co mmunicatio n framework between neigh boring buses ma kes the calculation of index scalab le a nd secu r e f or the grid. In the various test scenarios such as no isy measuremen ts, different lo a d incr ease directions, line ou tage and gen erator outage, the ind ex detected the c r itical bus and q uantified th e stress in the system. T he propo sed index behavior is also co mpared with distributed and decentralized m ethods and is shown to have a sup erior & reliable pe rforman ce, particular ly for noisy measurem e nts and large grids. The wide area nature of th e p roposed in - dex makes it robust to measur e ment and system noise that adversely affects similar techniques such as lo cal T hevenin methods, etc. Fu rthermor e, th e p roposed index can lo calize the line/g e n ou tag e locations in an unsu pervised manner p urely using PMU measurem ents, ma k ing it a promising metho d for ev ent detection and loc a lization of other events. Finally , the distributed nature of th e in dex makes it po ssible to utilize cloud compu ting infrastru cture an d oth er r ecent trends in the big data analy tics field fo r efficient compu ta tio n a n d storage . R E F E R E N C E S [1] A. G. Phadke, “Synchron ized phasor measurements in power systems, ” IEEE Comp. App. in P ower , 1993. [2] Q. Cui and Y . W eng, “Enhance high impedance faul t detect ion and locat ion accura cy via µ -pmus, ” IEEE Tr ansactions on Smart Grid , 20 19. [3] D. N ovosel, V . Madani, B. Bhar gav e, K . V u, and J. Cole, “Dawn of the grid synchroniz ation, ” IEEE P ower and Energy Magazi ne , 2008. [4] I. Dobson, “Observat ions on th e ge ometry of saddle node bifurc ation and volt age colla pse in elect rical po wer systems, ” IEEE T rans. on Cir cuits and Systems I , 1992. [5] T . V an Cutsem and C. V ournas, “V olta ge stability analysis of electri c po wer systems, ” 1998. [6] V . Ajjarapu, Computationa l tech niques for voltag e stabilit y assessment and contr ol . Springer Science & Business Media, 2007. [7] M. H. Bollen, “V oltage recov ery after unbalan ced and balanc ed voltage dips in three-phase systems, ” IE EE T rans. on P ower Delivery , 2003. [8] L. Y . T aylor and S.-M. Hsu, “Transmission volt age recove ry follo wing a faul t ev ent in the metro Atlant a area, ” IEEE P ower Eng. Soci ety Summer Meeti ng , 2000. [9] A. Chebbo, M. Irving, and M. Sterling, “V oltage collapse proximity indica tor: behavio ur and implicati ons, ” IEE Proc. C-Generati on, T rans- mission and Distributi on , 1992. [10] M. Haque, “ A fast method for determining the volt age stabilit y limit of a power system, ” E lectric power systems resear ch , 1995. [11] A . R. R. Mata va lam and V . Ajjarapu, “Sensiti vity based Theve nin index with systematic inclusion of react i ve power limits, ” IEE E Tr ans. on P ower Systems , 2018. [12] Y . W eng, R. Rajagopa l, and B. Z hang, “Geometric understanding of the stabili ty of power flo w solutions, ” IEEE T rans. on Smart Grid , 2019. [13] Y . W ang, I. R. Pordanjani, W . Li, W . Xu, T . Chen, E. V aahedi, and J. Gurne y , “V oltag e stabili ty monitoring based on the conc ept of couple d single-po rt circuit, ” IEEE T rans. on P ower Systems , 2011. [14] J .-H. Liu and C.-C. Chu, “W ide-area measurement-base d voltage stabil- ity indicators by m odified coupled single-po rt m odels, ” IEEE T rans. on P ower Systems , 2014. [15] M. Gla vic and T . V an Cut s em, “Wid e-area det ection of volta ge insta bility from synchronize d phasor m easurement s . part i: Principle, ” IEEE T rans. on P ower Systems , 2009. [16] M. Gla vic and T . V an Cut s em, “Wid e-area det ection of volta ge insta bility from synchronize d phasor measurements. part ii: Simulation results, ” IEEE T rans. on P ower Systems , 2009. [17] P . Kessel and H. Glavitsch, “Estimating the volta ge stabili ty of a powe r system, ” IEEE T rans. on power delive ry , 1986. [18] K . V u, M. M. Be govic , D. Novosel, and M. M. Saha, “Use of local measurement s to estimate voltage- stabilit y margin, ” IEEE T rans. on P ower Systems , 1999. [19] F . Gubina and B. Strmcnik, “V oltage collapse proximity index determi- nation using volta ge phasors approach, ” IEEE Tr ans. on P ower Systems , 1995. [20] B. Milose vic and M. Bego vic, “V oltage-stab ility protectio n and control using a wide-area network of phasor measurements, ” IEE E T rans. on P ower Systems , 2003. [21] G . V erbic and F . Gubina, “ A new concept of volta ge-coll apse protection based on local phasors, ” IEEE T rans. on P ower Delivery , 2004. [22] M. Zima, M. Larsson, P . Korba , C. Rehtanz, and G. Andersson, “Design aspects for wide-are a monitoring and control systems, ” Proc. of the IEEE , 2005. [23] P . Baran, “On distrib uted communicat ions netw orks, ” IEEE T rans. on Communicat ions Systems , 1964. [24] Y . W ang, P . Y emula, and A. Bose, “Decentral ized communica tion and control systems for power system operatio n, ” IEEE Tr ans. on Smart Grid , 2014. [25] A . D. Dominguez-Ga rcia and C. N. Hadjicostis, “Distrib uted algorit hm s for control of demand response and distribut ed energy resources, ” IE EE Decision and Contr ol Confer ence , 2011. [26] J . W . Simpson-Porco and F . Bullo, “Distribute d monitoring of voltage colla pse sensiti vity indice s, ” IEEE T rans. on Smart Grid , 2016. [27] Y . W eng, M. D. Ili ´ c, Q. Li, and R. Negi, “Distribute d algorithms for con vex ified bad data and topology error detec tion and identificat ion problems, ” Internati onal Jo urnal of Electrical P ower & Ener gy Systems , 2016. 11 [28] Y . Xu, W . Liu, and J. Gong, “Stabl e multi-a gent-base d load shedding algorit hm for power systems, ” IEEE T rans. on P ower Systems , 2011. [29] Q . Xu, B. Y ang, C. Chen, F . Lin, and X. Guan, “Distrib uted load shed- ding for m icrogri d with compensation support via wireless network, ” IET Generati on, T ransmission & Distribution , 2018. [30] S . Magn ´ usson, P . C. W eeradda na, and C. Fischione, “ A distribute d approac h for the optimal po wer-flo w problem based on ADMM and sequenti al con vex approximations, ” IEE E Tr ans. on Contr ol of Network Systems , 2015. [31] F . D ¨ orfler , J. W . Simpson-Porco, and F . Bullo, “Breaking the hierarchy: Distrib uted control and economic optimal ity in micro grids, ” IE E E Tr ans. on Contr ol of Network Systems , 2016. [32] J .-H. L iu and C.-C. Chu, “Iterati ve distrib uted algorithms for real-time av ailable transfer capabil ity assessment of multiarea po wer systems, ” IEEE T rans. on Smart Grid , 2015. [33] J . W . Simpson-Porco, Q. Shafiee, F . D ¨ orfler , J. C. V asquez, J. M. Guerrero, and F . Bullo, “Seconda ry frequency and volt age control of islande d microgrid s via distribute d av eraging . ” IEEE T rans. on Industrial Electr onics , 2015. [34] Z . W ang, W . Wu, and B. Zhang, “Distribut ed ne wton method for primary volt age control in islanded dc microgrid, ” IEE E P ower & Ener gy Society Genera l Meeti ng , 2017. [35] H . Schwerdtf eger , Geometry of comple x numbers: circle geomet ry , Moebius tr ansformation , non-euclide an geomet r y . Cour ier Corporat ion, 1979. [36] R. D. Christie, IEEE-30 Bus system descript ion , 1993. [Online]. A vaila ble: labs.ece.uw .edu/pstca/ pf30/pg tca30b us.htm [37] V . Ajjarapu, P . L. L au, and S . Battula, “An optimal reacti ve power plannin g strate gy aga inst voltag e collapse, ” IEEE Tr ans. on P ower Systems , 1994. [38] R. D. Zimmerman, C. E . Murillo-S ´ anchez, R. J. Thomas et al. , “Mat- po wer: Steady -state operations, planning, and analysis tools for power systems research and education, ” IEE E T rans. on power systems , 2011. [39] Q . Zhang, X. Luo, D. Bertagnolli , S. Maslenniko v , and B. Nubile, “PMU data val idatio n at ISO New England, ” in IEEE P ower & Energy Society Genera l Meeti ng , 2013. [40] M. Brown , M. Biswal, S. Brahma, S. J. Ranade, and H. Cao, “Charac - terizi ng and qua ntifying noise in PMU dat a, ” in IEEE P ower and Ener gy Societ y General Meeting , 2016. [41] K . E. Martin, “Synchrophasor measurement s under the ieee standard c37. 118.1-2011 with amendment c37. 118.1 a, ” IEEE T rans. on P ower Delive ry , 2015. [42] S . Corsi and G. N. T aranto, “ A real-time volt age instabili ty identifica tion algorit hm based on local phasor measurements, ” IEEE T rans. on P ower Systems , 2008. [43] I. Idehen, W . Jan g, a nd T . Ov erbye, “PMU Dat a Feature Co n- siderati ons for Reali stic, Synthetic Data Generat ion, ” arX iv pre print arXiv:1908.05244 , 2019. [44] G . M. D. Mijoll a, S. Ko nstantin opoulos, P . Gao, J . H. Chow , and M. W ang, “ An e valuat ion of algorithms for synchrophasor missing data reco very , ” in IEEE P ower Systems Computation Confere nce , 2018. [45] S . Iwamoto and Y . T amura, “ A load flow calcu lation m ethod for ill- conditi oned power s ystems, ” IEEE T rans. on P ower Apparatus and Systems , no. 4, pp. 1736–1743, 1981. [46] H . A. Thant, Khaing Moe San, Khin Mar Lar T un, T . T . Naing, and N. Thein, “Mobile Agents Based L oad Balancin g Metho d for Paral lel Applicat ions, ” in Asia-P acific Symposium on Informati on and T elecommunic ation T echnolo gies , 2005. [47] S . -C. Moon, H.-S. Park, and K.-J. Kim, “Effect s revie w on transformer and line impedance by X/R ratio in power system. ” IE E E T encon- Spring, 2013. [48] “IEE E Appli cation Guide for A C High-V oltage Circuit Breake rs > 1000 V ac Rated on a Symmetrical Current Basis, ” IEEE Std C37.010-2016 (Revi sion of IEEE Std C37.010-1999) , 2017. A P P E N D I X A. Matrix Representation o f Stan d ar d Circle: First, the matr ix f orm of a standa rd circle is derived. Let z = x + j · y in comp lex plane be set of all the po ints in a circle C k ( z , z ∗ ) with radius ρ and cen ter γ = α + j · β . Then, the equ ation of this c ir cle is g iv e n by (9) ( x − α ) 2 + ( y − β ) 2 = ρ 2 , (9) | z − γ | 2 = ρ 2 , ( z − γ ) · ( z ∗ − γ ∗ ) = ρ 2 , z · z ∗ − γ ∗ · z − γ · z ∗ + γ · γ ∗ − ρ 2 = 0 , (10 ) , A B C D , 1 − γ ∗ − γ ( γ · γ ∗ − ρ 2 ) , where A = 1 , B = − γ ∗ , C = − γ and D = γ · γ ∗ − ρ 2 . B. Pr o o f fo r linear behavior of pr o posed in dex in case of transmission networks: Fig. 13: 2 -bus system with load conne c te d to an infinite bus. Fig. 1 3 shows a simple 2 -bus system which co nsists o f one load f e d b y an infinite bus thro u gh a transmission line. The infinite b us is repr esented by an ideal v o ltage sour ce with constant voltage gi ven by E = E r + j · E i = 1 + j · 0 . T he transmission lin e is rep resented by its admittance Y = g + j · b . The load con sumes an ap parent power of S = P + j · Q with a con stant power factor cos ( φ ) an d it is represen ted by a co nstant equiv alent impeda n ce Z L = R L + j · X L . The pr oposed distributed non -iterative ind ex is given by ∆ ∗ norm = ∆ ∗ ∆ ∗ no-load , (11) where ∆ ∗ is given by (12), ∆ ∗ no-load is the value o f ∆ ∗ with zero lo ad and voltage of 1 p.u. at all buses of th e n e twork . ∆ ∗ = c p − k b p k 2 4 ! · c q − k b q k 2 4 ! − 1 8 · k b p − b q k 2 − 1 2 · k b p k 2 4 − c p ! − 1 2 · k b q k 2 4 − c q !! 2 , (12) where b p = t d, 2 t d, 1 t d, 3 t d, 1 T , b q = − t d, 3 t d, 4 t d, 2 t d, 4 T , c p = − p d t d, 1 , c q = − q d t d, 4 . Let lo ad p ower factor be unity ( cos ( φ ) = 1 ). Now , calcu late the terms b p , b q , c p and c q as shown below for the 2 -bus example that is describ ed above. b p = − 1 − b g T , b q = h − 1 g b i T , c p = P g , c q = 0 (since unity p ower factor) . 12 Substitute above terms ( b p , b q , c p , and c q ) in (11) and upon further simp lification, (1 1) is g i ven by ∆ ∗ nor m = b 4 + 2 b 2 g 2 − 4 b 2 g P − 4 b 2 P 2 + g 4 − 4 g 3 P ( b 2 + g 2 ) 2 , (13) Bounds of proposed index : First, we will show that th e propo sed index is boun ded between 1 and 0 at no load ( P = 0 ) and n ose point of the PV cu rve ( P = P max ) respectively . The maxim u m transferable power ( P = P max ) fo r the 2 -bus system from Fig. 13 when the load power factor is unity is giv en by P max = − ( b 2 + g 2 ) g + ( b 2 + g 2 ) 3 2 (2 b 2 ) , No load c ondition: ∆ ∗ nor m = b 4 + 2 b 2 g 2 + g 4 ( b 2 + g 2 ) 2 = 1 , Full load co nditio n ( P = P max ): ∆ ∗ nor m = 0 . Linear behavior o f proposed index f o r tr ansmission networks : Second , we show that even tho ugh the prop o sed index (13) is a quadr atic equation in real power ( P ), the equation b ehaves lin e arly fo r various practical power system operation ranges since the coefficient of ( P 2 ) term is n egligi- ble. Specifically , we showcase that th e prop osed ind ex beh av es linearly und er various r /x ratios of the transmission line and various lo ad power factors. 1) Effect of x/r r a tio on the linear behavior of the index: The x/r ratio is a critical p ower system parameter that effects the maximu m power tr ansfer cap a b ility of th e grid. For exam ple, a low x/r ratio e n ables m ore maximu m power tran sfer when compared to that of a high r/ x ratio power line. Fig. 14 shows that the prop o sed index (1 3) beh av es linearly fo r various values of x/r ratios corr espondin g to different levels of voltage ( 22 k V to 765 kV) [ 4 7], [48]. Fig. 14 shows that the propo sed index behaves linear ly for h igh x/r values (tran sm ission networks) and behaves in a sligh tly curved fashion for low x/r values (d istribution network s). For example, when x/r = 5 and x/r = 10 then (13) can be further simplified to ( 14) a n d (1 5) respectively . From ( 14) and (15), we can see that the high values of x/r makes the coefficient of “ P 2 ” te r m negligible and h ence the linear part of the equation i.e., “ P ” ter m domin ates resu ltin g in the linear behavior of the pro posed index. (13) (wh en x/r = 5 ) = − P 2 169 − 10 P 13 + 1 ≈ − 10 P 13 + 1 . (14) (13) (wh en x/r = 1 0 ) = − 4 P 2 10201 − 40 P 101 + 1 ≈ − 40 P 101 + 1 . (15) Additionally , the prop osed ind ex do e s no t deviate a lot from its origin a l slo p e and hence it tends to stay fairly lin ear . For example, we k now th at the first o rder differentiation of (13) gives the slop e o f the proposed in dex. The secon d ord er differentiation of the (13) g i ves the inform ation about the 0 0.1 0.2 0.3 0.4 0.5 0.6 0.7 Real power 0 0.2 0.4 0.6 0.8 1 Proposed distributed non-iterative index x/r = 0.6 x/r = 1.19 x/r = 8.51 x/r = 18.99 x/r = 30 Fig. 1 4: Pro p osed index for various values o f x/r ratio o f the 2 -bus system from Fig. 13. Low x/r ratio s such as 0 . 6 , 1 . 19 represent distribution n etworks wh ile h ig h x/r ratios such as 8 . 51 , 18 . 9 9 , 30 represent the transmission networks. 0 0.5 1 1.5 2 2.5 3 Real power 0 0.2 0.4 0.6 0.8 1 Proposed distributed non-iterative index power factor = 0.6 power factor = 0.7 power factor = 0.8 power factor = 0.9 power factor = 1 Fig. 15: Prop o sed index fo r various values of the lo ad power factor when the x/r ratio of the transmitting b r anch is 10 . change of the slop e of th e propo sed in dex. Fro m (1 6), when x/r = 10 , th is rate of the chang e of slope of th e prop osed index is bo unded b y the co efficient of “ P 2 ” an d it is negligible ( − 7 . 84 24 e − 4 ≈ 0 ) f o r tr a nsmission n etwork lin es d ue to high x/r ra tio as d iscussed. In othe r words, as the x/r ratio increases, the co e fficient of P 2 becomes negligibly small. Hence the p roposed index tends to behave linearly fo r all th e transmission n etwork case stud ies pr esented in this paper . d 2 (∆ ∗ nor m ) dP 2 = d 2 − 4 P 2 10201 − 40 P 101 + 1 dP 2 = − 7 . 8424 e − 4 . (16) 2) Effect of loa d power fact or on the proposed index : For a given x/r ratio of 10 , Fig. 15 shows the p roposed index (1 3) f or various values of load power factor . Th e propo sed index’ s lin e a r b ehavior is n ot e ffected unless the power factor decreases to as low as 0 . 6 which is no t realistic for tr a nsmission networks.
Original Paper
Loading high-quality paper...
Comments & Academic Discussion
Loading comments...
Leave a Comment