Uneven illumination surface defects inspection based on convolutional neural network
Surface defect inspection based on machine vision is often affected by uneven illumination. In order to improve the inspection rate of surface defects inspection under uneven illumination condition, this paper proposes a method for detecting surface …
Authors: Hao Wu, Yulong Liu, Wenbin Gao
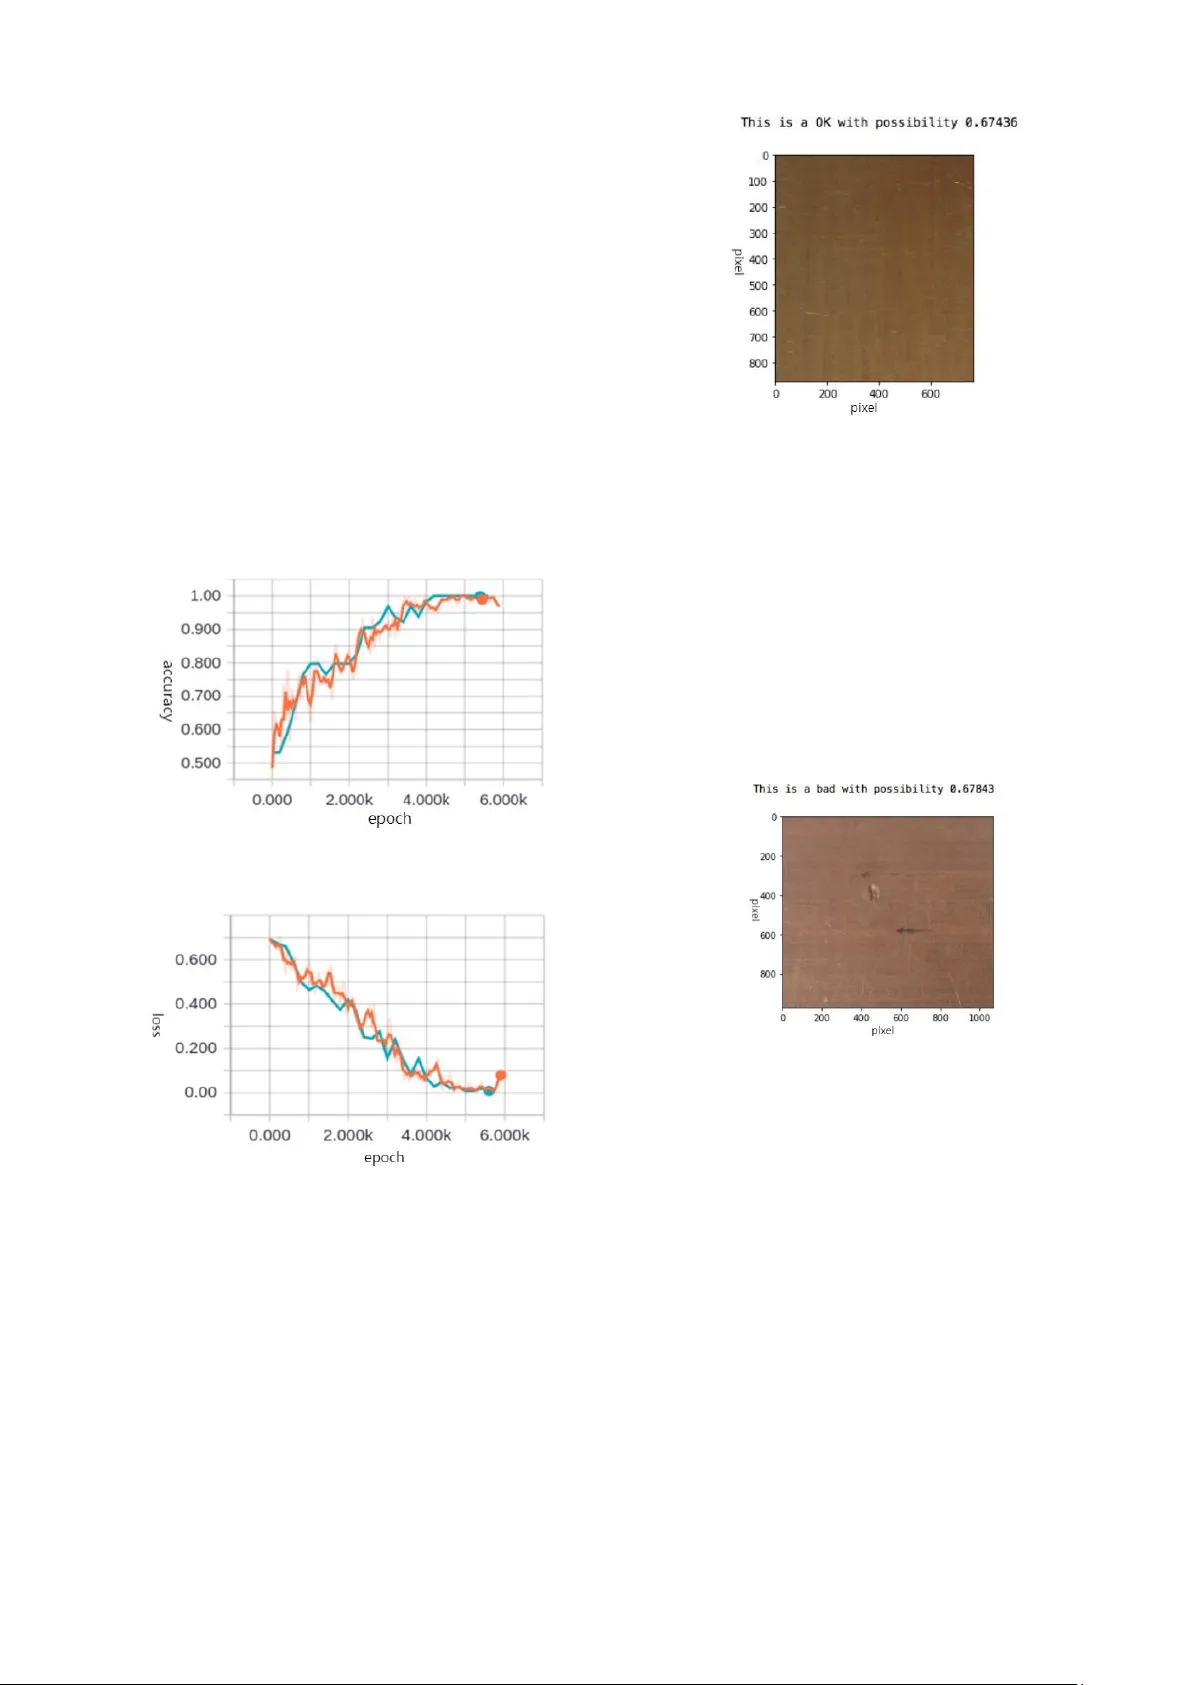
Uneven illumination surface defects inspection based on convolutional neural network Hao Wu School of Mechanical Engineering, Anhui University of Technology Maanshan, China wuhaomoses@q q.com Wenbin Gao School of Mechanical Engineering, Anhui University of Technology Maanshan, China 349282565@qq. com Yulong Liu School of Mechanical Engineering, Anhui University of Technology Maanshan, China dulyam@163.com Xiangrong Xu School of Mechanical Engineering, Anhui University of Technology Maanshan, China xuxr88@qq.com Abstract —The Surface defe ct inspection based on m achine vision is affected by uneven illumination. In order to improve the inspection rate of surface defects inspection under uneven illumination condition, this paper proposes a method f or detecting surface image defects based on co nvolutional neural network, which is based on t he adjustment of convolution al neural networks, training para meters, changing t he structure of the network, to achieve the purpose of a ccurately identifying various defects. Experimental on defect inspection of copper strip and steel images shows that the convolutional neura l network can automatically le arn features without preprocessin g the image, and correct identification of various ty pes of image defects affected by uneven illumination, thu s overcoming the drawbacks of traditional machine vision inspection methods under uneven illumination. Keywords—defect inspection, uneven il lumination surface , machine vision , Deep learning, Convolutional neural network I. I NTRODUCTION During insp ection of the produ ct, the surface def ect inspection is a v ery im portant p art, the surface area of the defect is localized damage to the surface when the object is inconsistent with the perip heral p ortion, or deface the surface means, for examp le: hole, dust, scratches, abrasion s, den ts, etc. there are defects on the surface in the o bject, in the course of manufacture can cause s erious prob lems, in addition to the economic value of the product affects its appearance is more likely to affec t th e internal fun ctionality of th e product, reduce. The surface defect inspection tech nology based on machine v ision has gradually become a r esearch hot spot recently, and there have been many researches and applications [1-3].It can replace the h uman eye to make more accurate measurements an d judgm ents [4 -5].It is based imaging, image processing and analysis of the automatic inspection and a nalysis equipm ent, has made the developm ent of a p lurality o f field [6 ], such as the strip an d electronics . Machine vision based surface defects inspection method can be div ided into the fo llowing categories [ 7]: statistica l - based methods, structure-b ased m ethods, spec trum-based methods, and sub space-based m ethods, of which th e latter two are used the most. Statistical-based methods include optimal threshold method [8], gray level co-occurrence matrix m ethod [9] and LBP (Local Binary Patterns) [10 ], etc., mainly by measuring the statistical ch aracteristics of pixel spatial distribution. However, the main disadvantage of this type of method is that it perfo rms poorly on tex tures compo sed of larger -sized primitives and requires high co mputational performance because a large nu mber of adjacent pixels are calculated. This type of m ethod canno t hand le the problem o f un even gray scale caused by uneven illumination. The structure-based method mainly uses the feature o f similarity repeated texture in texture image [11], using a primitive texture as the b asis, and then com bining the primitives according to certain rules to obtain a defective free texture imag e. The difficulty is that m any textures v ary widely, and are no t simple sim ilar rep etitions. It is impossible to adju st the algorithm to match the spec ific geo metry o f the defect, no r to the structure without reg ularity. The uneven illumination caused in th e gray value of the imag e is less suitable to be m atched by the structural meth od. The spec trum method is transform ed i nto th e frequency domain by time-fr equency conver sion, mainly including Fourier transform m ethod [12 ], Gabo r tran sform met hod [ 13] and wavelet transform method [14]. The Fourier transform method is a g lobal transform th at only contains frequen cy domain information and does not contain time information. The shor t-time Fo urier tran sform, named as Gabo r transform, as a substitute for the Fourier transform, can extract image texture featu res and can well simulate the v isual perception of the human visual system , sensitive to the edges of the image. Howev er, when such methods are ap plied to textu re image inspection, it is o ften n ecessary to have strong empirical p arameters in o rder to make the extracted features meet the req uirements. The b asic concept of the su bspace-based approac h is to model and determine the corr elation between lear ning samples to represent more sam ples. Af ter simp le re - projection processing, r edundant inf ormation and noise are reduced, and hidden inf ormation is Ex cavation. Common methods bas ed on eigenvalues, such as Principal Componen t Analysis (P CA) [15 ], Lin ear Discrimin ant An alysis (LDA) and Independ ent Component Analysis (ICA) [16] Is a meth od widely used to estimate sample projection . T he subspace transform method avoids complex fea ture design, and measures the similarity b y using simple rules in the transform space. The simple matrix calculation m akes the inspection process simple an d fast, but also is affected by illumination unevenness. Conventio nal defect classification methods base d on the feature extraction, th e sample’s consistency is required highly, and when illum ination unevenness occurs, it can’t cope well with the u neven illumination and noise , and it is a supervised learning method that requires a priori knowledg e , and ho w to con struct an unsupervised way for automatically learn how to c onstruct the best features th at can characterize the nature of the im age through the sample learning is current research h otspot , deep learning (deep learning) [17] can au tomatically learn the b est features by building a multi-layered network, and m ake the learned features have better g eneralization performance. Convolution al neural networks ar e the most representative type of d eep learning ap plications in the field of image recognition. Th erefore, we propose a m ethod for automatic identification of surface defects b ased on co nvolutional neural network s. II. T HE P ROPOSED METHOD OF C ON VOLUTION AL NEURAL NETWORK STRU CTURE Convolution al neural n etwork is a feed forward artific ial neural network, w hich has become a ho tspot in the field of speech analy sis an d imag e recogn ition . Its weigh t shar e structure is more similar to biolog ical n eural netwo rk, it reduces the complexity of the network model, and reduce the n umber of weights . when the netwo rk input is multi- dimensional im ages, the advantages ar e more obvious. Images can be dir ectly as a network input, avoiding the traditional recognition algorithm in complex feature extraction and d ata rec onstruction p rocesses . Con volutional neural networks are multi-layered sensors that are specifically designed to recognize two -dim ensional shapes that are h ighly invariant to translation, scaling, and ro tation. LeNet-5 is one of the convolution al neural networks [18] , and its structu re is shown in Figure 1 : LeNet-5 structure were seven lay er structure . First as the inpu t lay er of input, then C1 is the co nvolution layer, which contains a Four featur e map, the convolution kernel size is na × na , and the f eature map size af ter the convolution o perat ion is m2 × m2 . S2 Samplin g is the n ext layer, co mprising feature image with number o f a , each f eature in C1 neurons corresponding featu res of nb × nb local neighborhood as input . C3 is also a convolution layer, a feature map s has the size of m4 × m4 . S4 is the downsampling layer, including b feature m aps, each o f the neurons in each featur e map of S4 corresponds to C3 fea ture map. Subsequent to S4 is a fully connected layer containing neuro ns . The final ou tput layer consists of radial b asis f unctions used to identify defects. Fig. 1. Convolutional neural networ k struct ure . III. E XPERIMENTAL P ROCESS AND R ESULTS A. Train ing process Firstly, collect a set of surface imag es such as copper strip image imag e samples, in cluding 30 training images, where the n ormal number is 15, th e defective number is 15 . And 30 test images, 15 of which are normal and others defective . For simple d efects such as inclusions, pits, and flaking, the defect images are shown in Fi gure 2 : where these defects are obv ious, the r ight par t ar ea is d arker than the left area , that is, th ey are affected by uneven illumination . (a) (b) Fig. 2. Defect copper image sampl es. (a): inclusi ons; (b): pits . The exper iment platform is run on Ma cBook air notebook with 8GB of memory computer, this paper build the convolutional neural n etwork, which is similar to convolutional n eural network LeNet- 5 , this convolutional neural networks h as two convolution layers and two pooled Layer . An d it is trained in t he number of d ifferent numbers . Then test it. The input image height and width are 400 × 40 0 (ie, image pixel 400 400 ), and the first lay er of convolution kernel is 3 × 3 , convolution layer c1 , g et 6 feature maps of size 398 × 398 , the downsampling coefficient is 2 , the downsamplin g layer S2 g ets 6 sizes of 199 × Feature map of 199 , the secon d lay er of convolution kernel size is 3 × 3 , convolutional layer C3 gets 12 sizes of 100 × 100 feature map, the downsamp ling coefficient is 2 , t he downsamp ling layer S4 , get 12 sizes of 50 × 50 feature map . The output layer is 2 due to classification and def ect . Because the s ize of th e training copper images is inconsistent, there are dif ferent big and small size samples, the pix els are ab out 800 × 90 0 , and the images are input in to the convolutional neural network model and learn and train . The first step is to enter the image into th e model , so the first step is to input the image. In put the image direc tly using the function . Name the non-d efective cop per strip im age " OK " (that is, pass), and make a label with its label set to 1 and the defective copper strip image image " bad " (ie defect). Make the label set it s label to 0 . Obviously, our ex periment is a two-catego ry, and the experimental o utput only needs to classify the co pper image recognition as " 1" or " 0 " . The second step is to build a co nvolutional neural n etwork. The convolutional neural network we built is two convolutional layers an d two pooling layers, which are relative ly simp le . The third step calls the first two steps, th en trains the CNN , and saves the train ing results in th e relevan t folder, which can be directly applied after the test. Since the two -layer convolution is relatively simple, we set the number of tra ining steps to 5000 for the first time . Based on the comp uter configuration, and th ere is no GPU bu ilt , the trainin g is cost fo r 2 hours, and the correct rate an d loss du ring the training. The functio n changes are shown in Figure 3 and Figure 4 below. The orange and blue curves represent changes in the training set and the validation set, respectively. It can be clearly seen from Fig. 3 and Fig. 4 that at the beginning of training, the loss function is about 0.6 and the correct rate is abou t 0.5 . As the n umber of training steps increases, th e loss f unction gradually decr eases, and the correct rate gradually incr eases. When it reaches 2000 , the loss function is about 0.5 , and the co rrect rate is abo ut 0.8 . When the number of tr aining steps reach es 5000 , the loss function has been reduced to abo ut 0 , a nd the correct rate is close to 1 . Th erefore, accord ing to the displayed results, the model f or classifying the copper strip image defect inspection and identification is satisfacto ry . Therefore, the train ed model is saved, and then the selected m odel is tested on the trained model. Fig. 3. Co rrect ra t e chan ge curve : training s et ( orange ) and v erification s e t ( blue ) Fig. 4. Lo ss function curve: training set (orange ) and verification set ( blue ) B. Test process The training of th e convo lutional n eural netwo rk has been completed above , and t h e training results ar e saved. The trained mo del will be directly tested . Prepared 15 defective and 15 non -defectiv e copper b ar images for testing in adv ance. Apply relevant read and write functions to read the trained model and test it. Here input a image each time to test. The test results of some samp les ar e as follows: Fig. 5. Qualified sample test res ults It can be seen from Figure 5 that there is n o defect in the image o f the copper strip image tested, it is a complete good co pper strip image, and th e result o f the experimental model output " this is OK with possibility 0.67436 ", it is also a co rrect determined for the co pper strip imag e . The probability of judgment is appr oximately 0.67 4 . The judgment is corr ect. Fu rthermore, there are obvious defec ts in Figu re 6. The test r esults show that the possibility of the copper strip image being def ective is 0.678 . Thus, the ju dgment result is correct . After sever al consecutive tests, the experimental results were the same as above, and no judgmen t errors occurred. Fig. 6. Defective sample test resu lt IV. D ISCUSSION AN D A NALYSIS According to the experimental results obtained above , we carry out corresponding analysis. It can be seen f rom the test images that th e defec t characteristics of the images to b e tested are still ob vious, but the discrimin ation rate is only about 0.6 to 0 .7 . Consider to Impr ove it by: ( 1 ) In the above experim ent, we have 5000 steps for the model . Consid er the model structu re to train mor e steps to improve the rec ognition rate. ( 2 ) The convolutional neural network model we used above is too simple, so the identification of defects is no t particularly obv ious . Consider building a deeper convolutional neu ral network m odel to improve recognition accuracy. A. I ncrease the nu mber of training steps For the above analy sis, we first improve the number of training steps and perform 10,000 steps of training. The experimen tal steps ar e the sa me as above, and so it will not be described detail here again . We d irectly tested the defect samples . Th e test results are as follows: The pr obability of judgmen t is 0.764 . Compared with the above test, the recognition ra te of the model is improved . I n order to verify the reliab ility of the conclusion, we test the q ualified samples again . The test results are as follows: The probability of judgment is 0. 7 74 . Compar ed with the discriminating rate of 0.67 in Figure 5 an d Figure 6 , t h ere is a higher improvement. Therefore, it can be c oncluded that the number of training steps has a certain inf luence o n the identification of the model we built . Nex t, we performed 15000 steps and 20000 step s o f training. After the training, the sam e test step was p erformed. The test results are shown in Table 1 : As the number of tr aining steps increases, the mo del has better training , so the defects are discriminated. At the time, the discrimin ating r ate has also been significantly imp roved . Therefore, it can be seen that as the number of training steps increa ses, the model discriminating r ate rises steadily. TABLE I. T HE INFLUENCE OF THE NUMBER OF TRAINING STEPS ON THE RECOGNITION ACCURACY Number of train ing steps qualified defect 5000 0. 674 0.678 10000 0. 764 0.774 15000 0 . 874 0.884 20000 0.987 0.986 B. Ch ange convolu tional neural network structure Next, we also co nsider the use of a deeper conv olutional neural n etworks, build three convolution al layers, three pooled layer of convolutional neural networks, perform the same oper ation, because th e use of deeper network stru cture will increase training time, So here, only 5000 steps of training are perform ed , and the same test step is perfor med at the en d of the training, and the results o f the deep convolutional neu ral network for the image will b e compared . When applying a three - layer convolutional neural network, the discriminant rate ob tained by the exp eriment is 0. 98 . Compared with the convolution of t he two layer s, the number of trainin g steps is 5000 , whic h impr oves the recognition rate of about 0.3 , which is significantly improved. All th e images were tested later, and the model showed no errors, and the discriminant rate was constant at ar ound 0.97. This exp eriment finally d etermined th e application of convolutional neural network ( CNN ) model to identify copper strip image defects, and m ade ap propriate comparison s for different training steps . The corresponding conclusion is obtain ed: the number of training steps o f the convolutional n eural network model will aff ect its judgment . Under ce rtain conditions, the more tr aining steps, the more accurate the jud gment . In additio n, on the basis of simple CNN , a deeper convolutional neural network structure is built, and the results show that the recognition accuracy is sign ificantly improved. C. Experimental Validation on NEU surface defect dataset In order to further verify our proposed method , th e NEU surface d efect database[19] is used, th is dataset contain several ty pes o f steel defect, here two typical surface defects of hot -rolled steel strips are used f or our proposed method in this pap er, i.e. p atches (Pa) , scratches (Sc). There are 300 samples fo r each type o f defect, we u se 250 samples for training(80%) and v alidation (randomly ch oose 20% of the whole 250 samples as validation data set), and 50 samples for testing , when the training epoch is 7, the trainin g accuracy is o ver 90%, and the training ac curacy arrived 100% when the train ing epoch is 13;wh en the training epoch is 44,the validation accurac y is 100%; when the training epoch is 146, the validation loss is 0.001,after 220 epoch of training, the validation lo ss is zero. For testing results, the inspection accu racy of patches is varied f rom 99.0539% to 99. 9998 %, the average accu racy for all the testing set o f patches defect is about 99.8805%. The inspection accur acy o f scratches is varied from 98.2197% to 99.99999 %, the averag e accuracy for all the testing set o f scratches is 99.7 739%. V. C ONCLUSION In this p aper, exp erimental results i s obtained through inspection meth ods based on conv olutional neural n etwork to identify d efects on the surface, as followin g: ( 1 ) The essence of the convolutional neu ral n etwork is to let the com puter learn autonomo usly in input da ta. After obtaining th e "experience", it makes jud gments on the same object , and no long er req uires artificially specified rules . In g eneral, it is similar to the process of lear ning n ew knowledg e by human . Compared with the simple neural network structure, the deep convolutional network structure has more p owerful learning ability and is better at extracting complex features . Th is is why the discriminant rate incr eases significan tly w hen a layer of convolution is added to the e xperiment . At the same time, the time required for the deep stru cture to train will increase significan tly . ( 2 ) T he pro posed meth od in th is paper can detect defects on the surfac e of copp er strip images under the influence o f uneven illumination , it overcomes th e limitations of trad itional machin e vision inspectio n method s, and adjust the structure of convolutional n eural network to change the structu re of the network and im prove the identification r ate . ( 3 ) T he images u sed in the tests in this paper are generally common defects such as scratches and p its . It is worthwhile to conduct fur ther research for more def ective samples, especially those with difficult to recognition for other traditional v isual methods and human eyes. A CKNOWLEDGMENT This rese arch was s upporte d in part by the Ch ina Nati onal Key Research and Development project (2017YFE011 3 200), National Natural Scienc e Foundation of C h ina ( No.5160 5 004) ,A nhui Provi n cial Natural Science Foundati on(18080 85QE162 ; 2108085ME1 66 ), Natural Science Research Project of Universities in Anhui Province(KJ 2021A0408) ,Open Pr o ject of Anhui Province Key Labora tory of Speci al and Heav y Load Robot (TZJQR007-2 021).Th e auth ors also would like to thank Dr Jan Paul Siebert, School of Comput ing Science Universit y of Glasgow, for his friendly host and instru ction duri ng the author visitin g resea rch in UK. This sup port is greatl y acknowle dged. R EFERENCES [1] Zhang Jing , Y e Yu tang ,& Xie Wei (2014). Photoelectr i c i nspection o f defects in metal cylindrical workpieces [J] .Optical Precision Engineering , 22( 7): 1871-1876. [2] Chu, Weishen, et al. " Effects o f W i ring D ensity and Pillar S tructure on Chip Package Interaction for Advanc ed Cu Low -k Chips." 2020 IEEE International R eliability Physi cs Symposi um (IRPS). I EEE, 202.. [3] Chu, Weishen, Tengfei J iang, and Paul S. H o. "Effect of Wir ing Density and Pill ar Structure on Chip Packagi ng Interaction for Mixed- Signal Cu Low k Chips." IEEE Transactions on Device and M aterials Reliability (20 21). [4] Wang, F. L., &Zuo, B. (2016). Inspection of surface cutting defect on magnet using Fourier image reco n struction. J ournal of Central S outh University, 2 3(5), 1123-1131. [5] Xuezhi, Y., Haiqin, Z., Yuan, C., Kewei, W., & Zhao, X. (2013). Fabri c defect i nspection based on PCA-NLM . Journa l of Image and Graphics, (12), 4. [6] Yishu, S. K. Y. Y. P., &Dewei, D. O. N. G. (2012). Convex active contour se g mentation m odel of strip steel d efects image b ased on local information. J ournal of Mec hanical Engineer ing, 48(20), 2 0. [7] Xie, X. (2008). A re view of recent advances in surfa c e defect inspection u sing te x ture analysis techniques. ELCVIA: electronic letters on comp u ter vision an d image analysis , 7(3), 1-22. [8] Truong, M. T. N., & Kim, S. (2018). Automatic image thresholdi ng using Otsu’s method and entropy weightin g scheme for surface defect inspection. Soft Computing, 2 2 (13), 4197-4203. [9] Chondronasios, A., Popov, I ., & Jo rdan ov, I. (2016). Feature selection for surface defect classificatio n of extr uded aluminum profiles. The International Journal o f Advanced Manufac t uring Technol ogy, 83(1- 4), 33-41. [10] K o, J., & Rhee m, J. (2016). Defect inspectio n of polycrystalline solar wafers using local b inary mean. The I n ternationa l J ournal of Advan ced Manufacturing T e chnology, 82(9-12), 1753-1764. [11] Soi lle, P. (2013). Morphological image analysis: princip les and applications. Spri nger Science & Business Media .. [12] Tsai , D. M., Wu, S. C., & Li, W. C . (2012). Defect inspection of solar cells in electroluminescence images using Fourier image reconstructio n. Solar Ener gy Materials and S ola r Cells, 99, 250-262. [13] To ng, L., W o ng, W. K ., &Kwong, C. K . (2016). Differential evolution- based optima l Gabor filter model f o r fabric inspection. Neurocomputi ng, 173, 1386-1401. [14] Jeon, Y. J., Choi, D. C., Lee, S. J., Yun, J. P., & K im, S. W. (2014). Defect inspection for corner cracks i n steel billets using a wavelet reconstructio n method. JOSA A, 31(2), 227-237. [15] Liu, H. W., Che n, S. H., &Perng, D. B. (2016). Defect inspecti on of patterned thin-film ceramic l ight-emitting diode subs t rate using a fast randomized principal component analysis. IEEE Transactions on Semiconductor M anufacturing, 2 9(3), 248-256. [16] Tsai , D. M., Wu, S. C., & Chiu, W. Y. (2013). Defect inspection in solar modules using ICA basis images. IEEE Transactions on Industrial Informatics, 9(1) , 122-131. [17] H inton, G. E. , Osin dero, S., &Teh, Y. W. ( 2006). A fast learning algorithm for d eep belief nets . Neuralcomputati on, 18(7), 15 27-1554. [18] LeC un, Y., Bottou, L., Bengio, Y., &Haffner, P. (199 8). G radient- based learning applied to document recognition. Procee dings of the IEEE, 86(11), 2 2 78-2324. [19] Song, K ., & Yan, Y. (2013). A noise robust method based on complet e d local b inary patterns for hot-rolled steel strip surfa ce defects. Applied Surface Science , 285, 858-864.
Original Paper
Loading high-quality paper...
Comments & Academic Discussion
Loading comments...
Leave a Comment