Optimal charging guidance strategies for electric vehicles by considering dynamic charging requests in a time-varying road network
Electric vehicles (EVs) have enjoyed increasing adoption because of the global concerns about the petroleum dependence and greenhouse gas emissions. However, their limited driving range fosters the occurrence of charging requests deriving from EV dri…
Authors: : Wang, J., Li
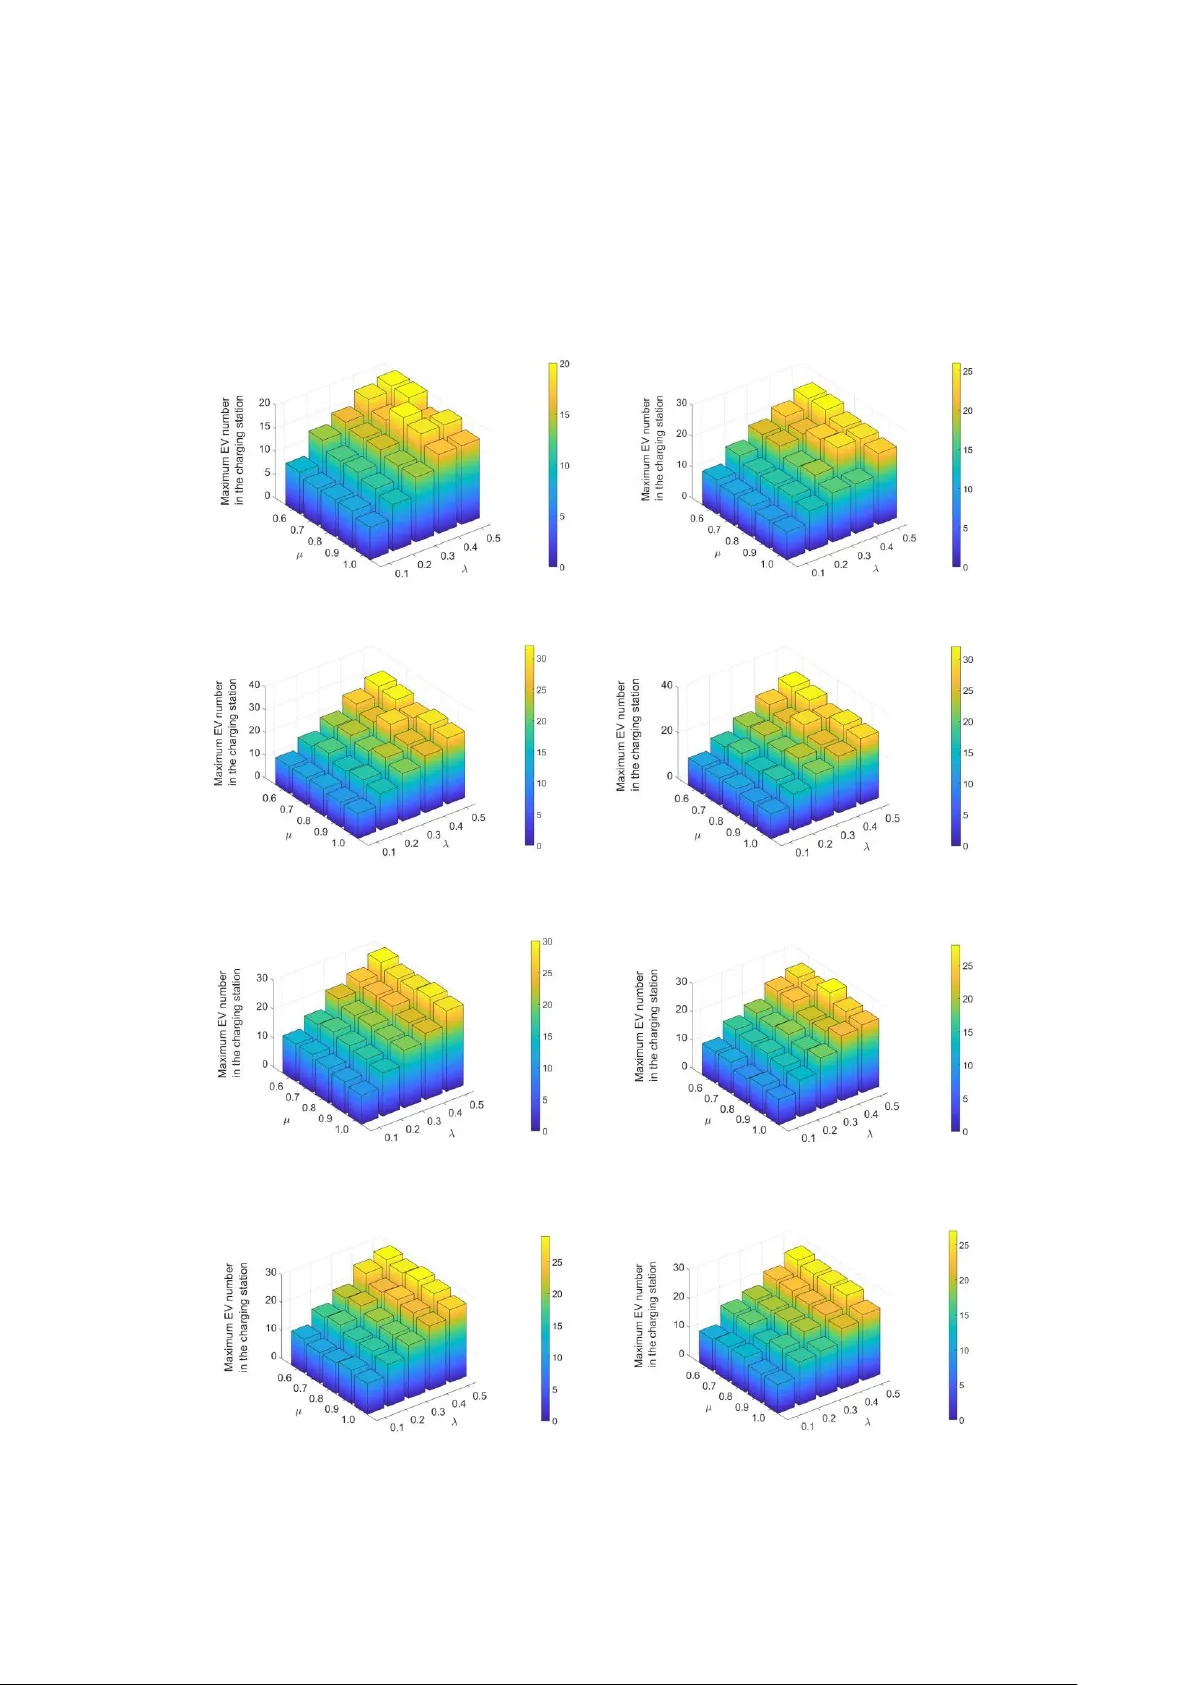
1 Optimal charging guidance strategies for electric vehicles by con sidering dynamic charging r equests in a time-varying road network Y ongxing W ang , Jun Bi * School of T raffic and T ransportation, Beijing Jiao tong University , B eijing 10004 4, China A B S T R A C T Electric vehicles (EVs) have enjoyed increasing adoption because of the global concerns about the petroleum dependence and greenhouse gas emissions. However, their li mited driving ran ge fosters t he occurrence of char ging requests deriving from EV drivers in urban road networks, which have significant uncertain characteristic from time dimension in the real-world situation. T o tackle the challenge bro ught b y the d ynamic charging req uests, this study is devoted to proposing optimal strategies to provide guidanc e for EV charging. The time-varyi ng characteristic of road network is further involved in the prob lem formulation. B ased on the charging request information , we propose two charging guidance strate gies from d ifferent perspective s. One of the strate gies co nsiders the travel demands o f EV drivers and uses the driving distance as the optimization criterion. In contr ast, the o ther strategy focuses on the impacts of EV number on the charg ing statio n operatio n and service satisfaction . The reachable charging stations w ith minimum vehicle num ber are selected as the optimal one s. More importantly , both the strategies have the ability to ensure the reachability of selec ted charging stations in a time- varying road network. In addition, we co nduct simulation examples to investigate the performance of the proposed charg ing guidance strategies. Besides, the insights and recommendations on application scenarios of the strategies are introduced according to the si mulation results u nder various parameter scenarios. Keywor ds: Electric vehicle Charging guidance strategies Dynamic charging requests Tim e-varying road network * Correspon ding author . A ddre ss: Beijin g Jiaotong U niversity , School of T raffic and T rans portation, NO .3 Shangy uancun S treet, Be ijing 100044, Ch ina. T el.:+86 134 8881 2 321 Fax: +86 0105168 414 E-mail addr esses : bilinghc@1 63.com ( J. Bi), yx_w ang@bj tu.edu.cn (Y . W ang) 2 1. Introduction The dependence of human so ciety on petroleum has contribute d to serious environmental and energy problems. The transp ortatio n sector is one of the major economic industries that contribute to energy consumption a nd greenhouse gas e missions. According to the investigation co nducted by the International Energy Agency , th e ener gy co nsumption of the transportation sector accounts for 28% of the global energy consu mption and is r esponsible for 23 % o f t he global greenhouse gas e missions (International Energy Agenc y , 2017) . Given the public co ncern o n climate cha nge a nd advance s in battery tec hnologies, electric vehicles (EVs) have been introduced as a prom ising solution for the problem of d ependenc y o n fossil f uels and increasi ng greenhouse gas e missions (Rezva ni et al., 2015) . However , unlike conventional internal combustion e ngine vehicles, EVs ha ve the relativel y short driving range due to the limited capacity of batteries. The drivers often need to rechar ge their vehicles during trips to s uccess fully rea ch the desti nations. Mo reover, the charging stations for EVs are considerably less popular than gas stations . These disadvantages increase driver range a nxiety , that is, the fear of depleting batter y e nergy en route (Melliger et al., 201 8 ). In ord er to help drivers to select suitable charging statio ns a nd alleviate t heir r ange anx iety , a smart cha rging ser vice would be developed to provide guidance for E V charging. Thro ugh such a service, E V d rivers s end charging requests to t he cha rging oper ating centre when the battery energy of their vehicle s is insu ff icient to reach the destinations, and the centre pro vides feedback to the dr ivers, which is the opti mal c harging station selection according to the information from t he driv ers’ charging requests (W ang et al., 2018b). T o realize the smart c harging service, the c harging guidance strategies based on cha rging reque st information need to be developed. Furthermore , in the real-world travel situation, the traff ic condition on a ro ad network often has the ti me-varying characteri stics, which w ould influence the r oute and charging station selection for EVs (Gendr eau et al., 2 015) . T hus, b es ides the charging req uests, t he time-varying characteristics of road network should be considered in the charging guidance strategi es . More importantly , the d ynamic characteristic intrinsic to the charging r equests has substantial impacts on the strategies , which would further increase the d iff iculties to d eal with the charg ing requests. Note that, large-scale charging b ehav io urs with dynamic character istic would e xert significant impacts o n the oper ation e f ficiency of charging stations . T herefore, given th e widespread ado ption o f EVs i n the current and future global transportation system, special attention must be given to solve the d ynamic charging requests under the re al-world co mplicated situation . EVs are taking shape as the potential solution for the environ mental and energy pro blems . However , since the limited driving ran ge and insufficient charging infrastruct ure cau se tro uble for the EV drivers ’ trave l, it calls for the effective methods to guide EV d rivers to select suitable char ging 3 stations and routes. For this reason, EVs have received increased interest fro m the scientific community . In co nsideration of the limite d driving ran ge, several st udies have atte mpted to find the optimal routes for EVs based on the framewor k of constrained shortest path pro blem ( Artmeier et al., 20 10; S torandt, 2012; Nea imeh et al., 2013 ). Ho wever , the charging be haviour was not involved in the m odel s. Kobayashi et al. (2011) further considered the impacts of charging behaviour and established a route search method for EVs. I n this method, the location o f charging station is a n influenci ng factor to select the travel routes, besides the driving rang e. W ang et al. (20 18b) designed a geometry-based algorith m for charging guidance based on the charging request in formation. T he algorithm considered the consistency o f d irection tre nd bet ween charging routes and destinat ion. Sweda et al. (201 7) proposed tw o heuri stic met hods to find the adaptive r outing and recharging decisio ns for EVs. The charging costs were in volved in the so lution. Besides charging processes, Qin and Zhang (2011) and Said et al. (2013) considered the impacts o f queuing t ime on the c harging station selectio n. The queuing t heory was u sed to optimize the c harging guidance. Se veral studies combined the driving ti me, charg ing ti me and queuing time to discuss the charging and r oute optimization for EVs (Y ang et al., 2013; De W eerdt et al., 201 6; Zhang et al., 2018 ). Furthermore, W ang et al. ( 2014) incorporated the energy co nstraints in the travel a nd proposed the energy-aware ro uting model for EVs. Cao et al. (20 12) and Liu et al. (201 4) considered the i mpacts of charging costs on th e chargin g station selection to investigate the EV charging pr oblems. Y agcitekin and Uzunogl u (2016 ) developed a smart charging guidance strategy based on the double -layer opti mization theory . Sun and Zhou (2016 ) compared the impacts of di fferent factors on EV charging guidance by using a cost-opti mal algorithm. The trad e-of f between traveling cost and ti me co nsumed was obtained to g uide drivers for traveling and charging. W a ng et al. (2018a) integrated drivers ’ intention of the choice s for tra veling and ch arging. A m ul ti -objective model was established to p rovide guidance f or EV charging. The objectives include the mi nimization of travelin g time, charging costs and energy consumption. Mo reover, in view of t he environmental effects for EV adoption, many studies focused on the charg ing g uidance methods fro m the perspecti ve of energy consumption, which aim to determine the e nergy-efficient routes for EVs under diff erent situations (W ang et al., 2013; Abousleiman and R awashdeh, 2015; Strehler et al., 2017; Fiori et al., 201 8; Ferná ndez, 2018) . However , the previous m ethods f or charging guidance are mainly based on the problems in a static road network. In such a road network, the ti me o r energy co nsumed i n each link is constant. Thus, the impacts of traffic conditio n on driving state are ignored in the solution. In order to improve the accu racy of c harging schemes, Alizadeh et al. (2014) incor porated the time-varying traffic conditions in the traveling and ch arging proble m for EVs. An extended transportation grap h was used to find the o ptimal routes. Y i and Bauer (201 8) introduced a stochastic decision making framework to investigate the stocha stic e ffects of traffic conditio n o n en ergy cost. T he 4 primal-dual interior point al gorithm was us ed to co nstruct th e op timal paths. Zhang et al. (2016) considered the impacts o f traffic co ndition o n driving distanc e, tr avel time and energy cons umption and pr oposed a multi-obj ective r outing model. The ant colony o ptimization algorithm was employed to search the optimal routes. Jafar i and Boyles (2017) furth er incor porated the reliability of routes in the solution for an E V travel pr oblem under th e road ne twork with stocha stic traffic co ndition. Daina et al. (2017) explored the EV charging pro blem by considering t he uncertai n tr a ffic condition based on the random utility theory . T he trade-off among driving distance, char ging time and costs for charg ing selection was anal ysed. Huber and Bo genberg er (20 15) utilized the real-time tra f fic information to investigate the time-var ying character istics of the traffic co ndition and their i mpacts o n the E V dr iving state. In ad dition, se veral w orks introduced the network eq uilibrium theory to explore the o ptimization models for EV charging and traveli ng ( Jiang et al., 2014; He et al. , 2014 ; X ie and Jiang, 201 6; Xu et al. , 2017 ). In such models, the traffic condition would b e changed with the number of vehicles in each link. However , most of t he exist ing met hods ass ume tha t t he charging requests of EV drivers ar e predetermined and overlook their dynamic characteristics. I n the real-world situatio n, the charging request s with variable i nfor mation may o ccur at different p eriod s. T he charging oper ating ce ntre could not kno w the i nformation be fore receiving the charging requests . Therefore, t he previou s m ethods do not have the abilit y to solve the d ynamic charging request s in the real- world complicated situation. Aiming at the d ynamic charging r equests , Hung and Michailidis (2015) proposed a charg ing guidance strategy based on the queuing modeli ng framewo rk , where the charging requests occurred according to a general process during a time p eriod. Ho wever , the study did not con sider the ti me-varying characteristics of road network. It assume d that EVs oper ate with a constan t sp eed in the road net work. Moreover, the ener gy consumption w as ignored in the method, which has significant influence on the reachability of charging statio ns in a road network. As the number of EVs increases in the transportation s ystem, it is obvious that la rge-scale EVs will operate on urban road networks in t he foreseeab le future, which would contribute to multiple charging requests during d ifferent peri ods. In this stud y , we aim to d evelop charging g uidance strategies for large-scale dynamic charging r equests in a ti me-var ying road network. Based on the charging request infor mation, the c harging guidance stra tegies are estab lished from two different perspectives. The E V drivers ’ travel demands and vehicle balance in charging stations are respectively considered in the proposed strategies . Both th e strate gies could h elp EV d rivers to selec t optimal reachable charging stations by consider ing the time -varyin g traffic condition o n the routes. The performance of the charging guida nce strategie s in vario us scenarios is explo red by consider ing t heir impacts on the oper ation efficiency of charging stations. The proposed m ethods may be used by the operators of charging o perating centres to provide EV 5 drivers with optimal selectio ns of charging stat ions under different situation s o r b y individual d rivers to select optimal charging stations during trips. The co ntributions of this st ud y are as follows. Firstly , give n the large-scale EV operation situation, the d ynamic characteristic of charging requests is investigated . By co mbining t he time-var ying r oad network, a cha rging guida nce problem with dynamic charging requests is formulated. Further more, a dynamic recursive e quation is developed to explor e the change trend o f EV number in charging statio ns. Secondly , based on the charging r equ est informatio n, two charging guidance strategies are established from the perspecti ve of travel de mands of EV driver s and oper ation efficiency of charging statio ns, respectively . Both the strategies h ave the ability to ensure the reachability o f selected charg ing station s in a ti me-varying road network. Lastl y , si mulation examples are presented to demonstrate the p roposed strategies. The performance of the two strate gies is co mpared in d iff erent simulation scenarios . T he application reco mmendations in ter ms of the strategies are discussed b ased on the simulati on results. The remaining portions o f this paper a re organised as follows. Sectio n 2 describes the dynamic charging guidance proble m and introduces the conside ratio ns for charging station selection. Sectio n 3 analyses t he selection basis for optimal charging station from two di fferent perspectives and presents the charging guidance strategi es. In Section 4, t he si mulation e xamples are designed to demonstrate the proposed strategies and further co mpare their performance. Lastl y , Section 5 provides the conclusions and the directions for fut ure research . 2. Problem description During tr ips, EV drivers often need to recharge their vehicles to reach destinations. When drivers notice that the remaining energy of the ir vehicle s m ay be i nsufficient to reach their destinations, they would send charging req uests to the charging operating centre. The information of charging r equests includes drivers ’ travel destin ations and remaining energy of vehicles. T he ch arging o per ating centre would help driver s to select suitable charging stations accor ding to the charging request information. However , in the real-world situation, c harging requests have significant uncertain characteristic fro m time dimension. As a matter of fact, t he charging requests rec eived in di fferent perio ds may have different infor mation based o n the i ndividual demands of d rivers . The char ging operating centre could not p redict the detailed information o f charging requests in adva nce. Given the situation wit h large-scale charging req uests, the multiple charging requ ests at the identical period s o ften have different information, incl uding travel destinatio ns and r emaining energy . Notably , in the actual situation, the charging operating centre can ob tain the i nfor mation regarding to the locations of EV s and charging station s by using positioning devices. Therefore , EV drivers do not nee d to send t he 6 location information to the c harging oper ating ce ntre. Mean while, in the sa me position, whether the charging requests occur or their detailed inf ormation are no t predetermined at d iff erent p eriod s. Thus, the ch arging requests in a ro ad network have significa nt dynamic characteri stic. T o represent th e dynamic character istic of charging requests, time is slott ed with slots nor malized to integral units . Let 1 , ..., , ..., tT denotes t he set of ti me slots, where T is the total number of the time slots. With the identical duration for ea ch time slot, the time horizon increases as T increases. Let t i C denotes the charging req uest that occurs i n the nod e i and at time slot t . For each c harging request t i C , l et t i d and t i e denote the travel destination and re maining energy , respecti vely . The travel destination t i d and remaining energy t i e from d ifferent charging requests t i C may vary . T he charg ing operating centre could not u nderstand or predict t i C before time slots t . T he decision-making for all the charging requests needs to be determined b ased on the traffic conditi on at correspo nding time slot s. In the situation with large -scale EVs, the dyn amic c haracteristic of charging req uests is one of th e challenges for d ealing with th e char ging req uests. Besides, the tra ffic condition in a road network al so aff ects the EV tra veling and charging, because it has sig nificant e f fects on the driving spe ed and ener gy consumption for EVs (Bi et a l., 2019). More importantly , the traf fic condition in a road n etwork often has ti me-var ying character istic in the real -world s ituation d ue to the in fluence of e nvironmental f actor s (Huang et al., 2 017 ). Therefore, the ener gy and time consumed to traverse the sa me links may vary at different t ime slots. T o i mprove the effectiveness of the charging guidance scheme, the time -var ying characteristic o f a r oad netw ork should b e co nsidered. Com bining the road netw ork structure a nd E V operating characteristics, the time -varying r oad network is defined as ( , , , ) tt aa G V A E = , wh ere V and A denote the set of nodes and links, respectively . Notably , in the set V , there exist two types of nodes, including normal nodes and charging statio n nodes. The latter have the ab ility to charge EVs. For problem formulation, we assume the existence of m nor mal nodes and n charging station nodes in the set V . Mo reover, t a and t a E in the G denote the driving time and energy co nsumption on the link a at time slot t , where aA . In every ti me slot, the values of t a and t a E randomly change within a reasonable range, which ref lects the time-varyi ng c haracteristic of the road net work. Note that, the conventional optimization problems with time-varying net work often ass ume that the links hold thei r state for the duration of a time slot ( Neely et al., 2005). Fo r th e problem o f EV cha rging guidance, the assumption si gnifies t he co nstant driving time and e nergy consumption duri ng a separate ti me slot. The assumption conforms to the traf fic co ndition characteristic in a real-word road network i f the duration for each time s lot is relatively short. Therefor e, we follow s uch an ass umptio n in t he cha rging guidance problem for EVs. Combining the dynamic charging r equests and time-varying road network, the c harging guidance problem for EVs is for mulated. According to the definition of set V , there exist m normal nodes and n 7 charging statio n nodes in a road network. Further more, t he pro blem ass umes that the c harging req uests occur in the normal nodes o nly . The charging station nodes co ul dn’t generate charg ing requests . Such an ass umption is reasonable, because onl y when d rivers hard to search nearby charging stations would they se nd charging reque sts t o the charging oper ating ce ntre . Otherwise, they have no need to send charging requests. The purpose o f charging guidance strategies is to help EV drivers fro m normal nodes to select suitable charging statio n nodes based on specific objec tives. Let t ij x denotes the binary d ecision variable in the proble m for mu lation, which is equal to 1 if the charging request generated in normal node i ( 1 , ..., ) im = at time slot t i s ass igned to charging station node j ( 1 , ..., ) jn = ; otherwise, this variabl e is 0. For the normal nodes in a road net work, in ever y time slot, all of them ha ve the possibility to generate charging requests. T o reflect the dynamic characteri st ic of charging r equest occurrence, the pos sibility o f the charging reque st occ urring in node i at each ti me slot is defined , which is denoted as i (0 1 ) i . T he i values d o not have time -varying characteristic, which are influenced by the node location. Notably , although the node i have a constant possibility i for every time slot, the travel destination and remaining energy fro m the charg ing r equests may var y at different time slot. Moreo ver , suppose t hat eac h nor mal node can gener ate at most o ne charging request d uring a time slot. The assumptio n c onforms to the characteristic of charging request occurrence in ac tual situation if the duration for each time slot is r elati vely short. When solvi ng the charg ing req uests at each time slot, the first step is to ensure that the remaining energy can support the EVs in reaching the target charging statio ns. In a time -v arying road network, the energy consumption bet ween nor mal nodes and charging stations nodes may var y at different ti me slots. Thus, before selecting charging station s, the ene rgy co nsumption on the ro utes should be observed and only the reachable cha rging stations can be considered as th e candidate o nes, as sho wn in Fig.1. 1 CS 1 Time slot t 1 1 ( 1 ,CS 1 ) t E m CS n 1 CS 1 Time slot t 2 m CS n 2 ( 1 ,CS 1 ) t E Reachable charging station Unreachable charging station Fig.1 Reachable charging stati on and unreachable cha rging station In Fig.1, the energy con sump tion b etween node 1 and CS 1 at tim e slot t 1 and ti me slot t 2 is different. T he green c heck mark represents that the EV have ab ility to traverse th e route. On the 8 contrary , the red cro ss presents that the EV is un able to traverse the route due to the insuf ficient remaining energy . The figure indicates t hat the reachability of the same charging statio n may vary at different time slo ts because of the ti me-var ying characteri stic of the road network, which i s the pre mise to determine the opti mal charging station for each charging request. F urther more, the driving ti me on the routes may also change at different t ime slots, wh ich deter mines the time slots as the EVs reach charging statio ns. Assume that the charging oper ating centre know the infor mation regardi ng to the traffic condition on all the links at the beginnin g of ea ch time slot. Such information ca n be obtained either through re al -time tra ffic information from t ransport sector or through short -term traffic flow prediction (Po lson and Sokolov , 2017). The basic framework for the d ynamic charging guidance problem in a time- varying roa d network is presented in Fig. 2 . 1 2 CS 2 m 3 CS n CS 1 1 t C 3 t C t m C 2 CS 1 ner gy cons um pti on t E ( , ) E 1 CS 1 riving time t ( , ) D 1 , 1 1 t x = 3,2 1 t x = , 1 t mn x = Fig.2 Dynamic charging guidance p roblem i n a time-var ying road net work In Fig.2 , 1 CS 1 t ( , ) is the driving time fr om node 1 to charging station node CS 1 under the traffic condition at ti me slot t . 2 C S 1 t E ( , ) is the energy consumption between node 2 and char ging station node CS 1 at time slot t . Obviously , the charging requests occur in node 1, node 3 a nd node m at time slot t , that of 1 t C , 3 t C and t m C . T he objective of the problem is to provide guidance for every char ging req uest by considering the traffi c conditi on at time slot t . The optim al char ging station nodes would be selected for t he charging requests based on specific charging guidance strategies. In the figure, the decision for char ging station selection is denoted as ( 1 , 1) 1 t x = , (3, 2) 1 t x = and ( , n ) 1 t m x = . F or instance, ( 1 , 1) 1 t x = indicates that the chargi ng req uest occurs in node 1 is assigned to the charging station node CS 1. How to determine the value of t ij x at each time slot t is the critical issue to solve the char ging guidance problem in a time-varying road network. This issue should be considered from two aspects. On the one hand, the char ging guidance str ategies satisfy the 9 char ging demands of EV drivers. That is, an EV can rea ch the select ed chargi ng station under the current remaining energy . For this reason, the relat ionship between rem aining energy and traf fic condition needs to be consid ered. On the other hand, the char ging behav ior has significant im pact s on the operat ing state of char ging stat ions, especially in a lar ge- scale EV situati on. In ev ery tim e slot, m ultiple char ging reque sts m ay occur in a road network and t he char ging st ations m ay have to accept m ultiple EV s. Given the limit ed char ging rate, the num ber of EVs in a charging station increases as the time slots pass. However , m ass EV charging has signi ficant impacts on the operating state of chargi ng s tations, which may prolong queuing time and even present a potential burden on local po wer syste ms (Putrus et al. , 2009; Fernandez and Roman, 20 1 1; Qian et al., 201 1) . Therefore, besides drivers ’ charging d emands, the number of EVs in each c harging stat ion is a lso an important factor that need s to be considered in charging guidance strategies. In o rder to explore the change trend of EV num ber in charging statio ns under the situatio n w ith large-scale dynamic charging r equests, we attempt to develo p a dynamic recursive eq uation based on the operati on characteristics of charging stations in a ti me-varying road net work. Let t j S denote the number of EVs th at com plete charging and leave chargi ng stat ion j at time slot t . W ithout loss of generality , the problem assumes that at most one EV can leave a chargi ng station at each time slot . The assum ption conforms to the act ual operat ing si tuation of charging stations if the duration for each time slot is relatively short. Moreover , to rep resent the d ynamic characteri stic for the EVs leaving charging stations, the pos sibility of tha t in charging station nod e j at each ti me slot is defined and denoted as j (0 1 ) j . It can be used to reflect the charging le vels of the charging sta tions in a road network. D uring th e actual charg ing p rocesses, the cha rg ers with d ifferent charging levels lead to different c harging rates of EVs ( Gnann et al., 2018 ). No tably , under the definition of t j S and j , the duration between two adjacent events of an EV leaving char ging station j follows a geometric distribut ion ( Li and Eryilm az, 2014). Let t j U denote the number of EVs in charging stat ion j at time slot t . The dy namic r ecursive equation for t j U is 1 11 =1 1 = 1 , { 1 , } max{ 0} { 2, } , { 1 , } j t mt j t t t j ij j it t j n U U x S t T j n − −− = = + − , , , , , (1) Where j is t he initial n umber o f EVs i n charging station j within t he time horizon; t is t he tim e slot when the charging request from node i occurs. In the equation, the time slots t and t satisfi es the follow ing relati onship. ( , ) t ij tt =+ (2) Eq. (2) indicates that the EV wit h char ging request t i C can re ach char ging station j after the driv ing time ( , ) t ij . 10 Notably , for the proble m formulation, t he probability var iables i and j are introduced t o sim ulate the events of charging request occurrence and EV leaving charging stat ions during the time h orizon . However , in the real-word situation, the ch arging op erating centr e could re ceive th e charging request information and kno w the n umber of v ehicles leaving char ging stations at the beginnin g of e ach ti me slot. Therefore, the probability variables i and j do not appear in the dy nami c recursive equation. Moreover , without loss of generality , the problem assumes that the routes with m inimum energy consum ption are selected as the travel routes between departure points and charging stat ion nodes. Furtherm ore, assume that EV drivers can reach their destinations by char ging their vehicles only once , because trips with more than one char ging are generally uncomm on in urban road network (F ranke and K rems, 2013). 3. Charging guidance strategies for dynamic charging requests in a time-varying road netwo rk T o solv e the dynamic c harging req uests i n a time-varying road network, t he charging sta tion selection d ecisions at each ti me slot should be made on the basis of specific strategies. In t his section, we attempt to develop the charging g uidance strategies fro m two di ff erent perspectives. Firstly , t he travel d emands o f EV drivers are considered in the strategy . Secondly , the o ther strategy focus es on the impacts of large-scale charging requests on charging station s. The ef fectiveness and compariso n of the two strate gies will be discussed in Section 4. Notably , to g uarantee the existence of solution, ass ume that every c harging request has at least one reachable charging station in a road network. For the special situation t hat no r eachable charging station e xists, the e xtra cost may occur to transport the vehicles, such as the trailer service, which is not disc ussed in the charging guidance strategies . 3.1 The char ging guidan ce strategy based on travel demands of EV drivers EV drivers are the decision makers for travel activities and also the service ob jectives of smart charging service. T herefore, it is necessary to consider the travel de mands of EV drivers when p lanning the selectio n strateg y of charging stations . As expected, th e r eachability i s the m ost critical factor for charging station selection in an EV trip. On the premise o f charging statio n re achability , EV drivers often desire to reduce their travel cost as much as possible. I n ge neral, the travel co st is regard ed as the optimization criterion to choose the travel routes (Gao et al., 2010; Brae kers et al., 2015). The travel cost m inimization i s one of the critical factors for travel de mands. For an EV trip, the travel cost ha s multi-dimensional component s, suc h as tra vel time, energy co nsumption and charging co st ( W ang et al., 2018a). Specifically , both the driving time and energy consumptio n have close correlation to the 11 driving distance. Generally , t he driving ti me is typically pr oportional to the driving dist ance with a constant driving speed . Further more, the energy consumption also has the significant linear relationship with driving distance (Bi et al., 20 18b ). Since the energy consumption has significant influence on charging cost, the charg ing co st w ould b e affected b y the dr iving distance. Thus, t he driving distance can b e used to reflect the integratio n o f travel cost co mponents . For t his reason, the d riving d istance minimization is e mployed to establish the charging guidance strategy based on drivers ’ tra vel deman ds . Note that, diff erent from the driving ti me and energy co nsumption, the drivi ng dista nce is a static factor in a time-var ying ro ad net work. Adopting drivin g distance as selection criter ion can utilize such an advantage an d avoid the complicat ed dy namic prediction. Moreover, in the charging guidance strategy , the drivi ng distance fro m charging stations to destination s is co nsidered. For the routes from origins to charging stations, EV drivers prefer to focus on the reachability rather than distance. Thus , the driving distance b etween origins and c harging stations is not involved in the strategy . T o simplify the description, th e charg ing guidance strateg y based on tra vel de mands of EV drivers i s represented by SDD ( shortest d riving distance) strategy . By using a toy road network with four nodes , Fig. 3 presents the selection basis for o ptimal charging station under SDD strategy . O CS 1 D CS 2 Optimal c harging s tation O CS 1 D CS 2 Optimal c harging s tation CS1 CS2 ll ( , D ) ( , D ) (1 ) On e reachable char ging station (2 ) T wo reachable charging stations Fig.3 Selection basis for optimal charging station under SD D strategy As sho wn in F ig.3, ther e e xist t wo charging statio ns i n the to y r oad n etwork, t hat o f CS 1 and CS 2. The node O and D r epresent the origin a nd d estination for the EV with charging reque st, r espectively . Furthermore, the figure is divided into t wo cases according to the number of reachable char ging stations. In the ca se (1 ), CS 1 is the reachable charging stati on but C S 2 is the unreachable one. In thi s cas e, CS 1 is the optimal charging station bec ause only CS 1 ca n be selected to charge the EV . In the case (2), both CS 1 and CS 2 are reachable for the E V . In such a case, the d riving distance between node D and charging stations should be further considered. Let CS 2, D l ( ) denote the distance between CS 2 and node D. In the case (2), supp ose CS 2, D l ( ) is shorter than CS1,D l ( ) . Therefore, CS 2 is select ed as the optim al char ging st ation because the s horter driv ing dist ance contributes t o less trav el cost. As mentioned in Section 2, in the dynami c charging guidance problem , the charging 12 operating centre would recei ve chargi ng requests in every time s lot, that of , t t t i i i C d e . The ener gy and time consumed to traverse each link are kno wn at the beginning of each time slot, that of t a E and t a . The SDD strategy aims to determine optim al charging stations, driving time and corresponding routes for all the char ging requests at every tim e slot. Based on the select ion basi s as shown in F ig.3, t he operating steps of SDD strat egy are detailed as foll ows: S tep 1 : At the beginning of time slot t , based on the inform ation of t a E , ca lculat e the minim um ener gy consum ption between all the nodes w ith t i C and char ging st ation nodes by using the shortest path algorithms (Fu et al., 2006). The minimum energy consumption between char ging request node i and char ging stati on node j is denoted as ( , ) t ij E . Record ( , ) t ij E and corresponding routes. S tep 2 : F or each t i C at time slot t , compare ( , ) t ij E with t i e . If ( , ) tt i i j eE , the char ging station j is denoted as reachable char ging station j . Otherwise, the char ging station j is r egarded as unreachable one a nd deleted from the candidate char ging stat ions. S tep 3 : For all the reachable char ging station j of t i C , calculat e the shortest dri ving distance betw een t i d and the node w ith char ging station j . The res ults are denot ed as , t i jd l ( ) . S tep 4 : F or each t i C , compare the shor test driving distance between t i d and re achable charging station j . Let * j denote the node with optimal charging station. The minim um driving distance between t i d and optim al char ging stat ion j needs to satisf y the following condi tion: ( *, ) ( , ) min tt ii j d j d j ll = (3) For the deci sion vari able t ij x , its v alues can be determ ined as follows : * * 1 , 0, t ij jj x jj = = (4) Moreover , if there exist mult iple char ging stations with same and mi nimum driving distance betw een them and t i d , randomly select one as the opt imal char ging station for t i C . S te p 5 : Calculate and record the driving time on the m inim um ener gy routes betw een nodes with t i C and correspondin g opti mal ch ar ging stati on node s j* . The result s are denot ed as , *) t ij ( . S tep 6 : Before t he end of time slot t , output the opt imal char ging stations j* , driving time , *) t ij ( and correspondi ng route s for each ch ar ging request t i C . Fig. 4 present s the flow chart of SDD strat egy . 13 Start Input: Calculate t = t +1 No Yes t =1 t i C t a E t a ( , ) t ij E ( , ) ? tt i i j eE jj = jj Calculate ( , ) t i l j d Yes ( , ) = min ( , ) ? tt ii j l j d l j d * * = , 1 t ij j j x = No * jj t=T ? Yes End No Output: 、 routes 、 * j * ( , ) t ij Fig.4 F lowchart of SDD strategy . 3.2 The char ging guidan ce strategy based on vehicle balance in char ging stations In the real-world traveling situation , esp ecially with large-scale EVs, a lot of charging r equests may occ ur in the road network. In every time slot, t he o ptimal charging stations need to be selec ted for all the charging requests. Ho wever , as compared to the increasing number of EVs , the number o f charging infrastructure is often insuff icient in t he transportatio n system. Given the limited charging technology in current and foreseea ble future perio ds (Raslavičius et al., 2015; Bi et al., 2018a) , the large-scale charging r equests and insuff icient charging infrastruct ure may lead to queuing process es in charging stations . It is noted that, the increa sing number o f EVs in charging stations ha s signi ficant impacts on the char ging station operation. On th e one han d, m ass EV c harging may in crea se the operating burd en of charging stations and p ower syste ms. On the o ther hand, the queuing time in charging s tations may increase as vehicle number increases , which si gnificantly affects the service level of c harging guidance. Therefore, to ensure the operatio n efficiency of char ging station s and service satisfaction of dr ivers, the n umber o f ve hicles in e ach cha rging station should b e considered when solving the large-scale charging requests. Facing large-scale charg ing re quests, in order to ensure all c harging stations with stable operation state, it is use ful to select c harging stations with relati vely small nu mber of EV s for each charging request. Ho wever , in the actual sit uation, the chance o f b eing selected for charging stations has significant d iff erenc e i f the E V number in charging stations is overlooked . For example, the char ging 14 stations located in centre area s may accept more EVs with c harging requests than ot her ones. Thus, neglecting the number of EVs in charging s tation s would e nlarge th e number o f EVs i n the charging stations that ar e located in centre areas. For a transpo rtation syste m, the charging ser vice i s stable if the state of all charging stations is stable. T herefore, balancing the vehicle number in di ff erent charging stations is an effective method to alleviate the negative influence of large-scale EVs with dynamic charging reque sts. Fo r this reaso n, t he charging guida nce strategy based on ve hicle balanc e in c harging stations is establi shed. O n the premise o f charging statio n r eachabilit y , t he strategy aims to select the charging stations with minimum vehicle numb er as the optimal ones for the charging requests at each time slot. T o simplify th e description, the charging guidance strategy based on vehicle balance in charging stations is rep resented by CSB ( charging station balance) strate gy . T he selec tion basis for optimal charging station under CSB strategy is pr esented in Fig. 5. O CS 1 D CS 2 Optimal c harging station 1 t U 2 t U O CS 1 D CS 2 Optimal c harging s tation 1 t U 2 t U (1 ) One reachable charging statio n (2 ) T wo reachable charging stations Fig.5 Selection basis for optimal charging station under CSB strategy Fig.5 is divid ed into tw o case s based on the number of r eachable charging statio ns. Mo reover, the number of EVs in CS 1 is larger than that in CS2. In the case (1), CS 1 is the op timal charging statio n because only CS 1 is the reach able charging station for the EV . In the case (2), the vehicle number in the charging stations should be considered bec ause both the char ging stations are reachable. A s s hown in the f igure, in s uch a case, CS 2 is sel ected as the optimal charging station because the number of EVs in CS 2 i s less than that of CS 1. Similar with the SDD strat egy , the CSB strategy also aims to determine optimal char ging stations, driving time and c orres ponding routes at ev ery tim e slot, based on the information from each char ging reques t. The operat ing steps of C SB strateg y are det ailed as foll ow s: S tep 1 : At the beginning of time slot t , based on the inform ation of t a E , calcul ate th e minim um energy consumption between all the nodes with t i C and chargi ng station node s. The minim um energy consumption between char ging request node i and chargi ng station node j is denoted as ( , ) t ij E . Record ( , ) t ij E and correspondi ng routes . 15 S tep 2 : F or each t i C at time slot t , compare ( , ) t ij E with t i e . If ( , ) tt i i j eE , the char ging station j is denoted as reachable char ging station j . Otherwise, the char ging station j is r egarded as unreachable one and deleted from the candidate char ging stat ions. S tep 3 : For all the reachable char ging station j of t i C , check the EV number in charging station j at time s lot t . The results a re denoted as t j U . S tep 4 : For each t i C , compare the EV numb er t j U in all the reachable chargi ng stations j at time slot t . Let * j denote the node wi th opti mal charging station. The opt imal char ging station * j needs to sati sfy the f ollowing condition: * arg min { } t j j jU = (5) For the decisi on variable t ij x , its values can be determined on the basis of Eq. (4). Moreover , if there exist multi ple charging stations with same and mini mum EV number , randomly select one as the optim al char ging stat ion for t i C . S te p 5 : Calculate and record the driving time on the minimum energy routes between nodes with t i C and correspondin g opti mal cha r ging station node s j* . The result s are denot ed as , *) t ij ( . S tep 6 : Before t he end of time slot t , output the opt imal char ging stations j* , driving time , *) t ij ( and correspondi ng route s for each ch ar ging reque st t i C . Fig. 6 present s the flow chart of CSB str ategy . Start Input: Calculate t = t +1 No Yes t =1 t i C t a E t a ( , ) t ij E ( , ) ? tt i i j eE jj = jj Check t j U Yes = min ? tt jj j UU * * = , 1 t ij j j x = No * jj t=T ? Yes End No Output: 、 routes 、 * j * ( , ) t ij Fig.6 F lowchart of CSB strategy . 4. Simulation exa mp le 16 4.1 Exa mple scenario description In this section, we present a simulation example to d emonstrate the proposed char ging guida nce strategies. A time-varying road network is in troduced to implement b oth the SDD and C SB strategies . The struct ure of the r oad networ k is d esigned based on the Sioux Falls network, which i s o ften ad opted to simulate travel optimization prob lems (Meng and Y ang, 2002; Chow and Regan, 20 1 1; B ell et al., 2017 ). The net work consists of 24 nodes and 76 links, a s s hown in Fig. 7. The road network has eight char ging stations, and the no des with char ging stati ons (yellow) are m arked as CS 1 to CS 8. The other nodes, numbered as 1 to 16, are the normal ones without chargi ng station, which may generate cha r ging re quests in every time slot . CS 1 1 2 3 4 CS 2 5 6 CS 6 7 8 CS 3 CS 4 9 CS 5 11 CS 7 10 12 13 16 15 14 CS 8 Fig.7 Sioux Falls road network for sim ulation exampl e. In the ro ad net work, each c harging statio n node has the parameter j to reflect the c harging levels of the charging statio n , where j ={1,2,…,7 ,8}. For the normal nodes, each one has the param eter i to reflect the dy namic characteristic of charg ing request generation, where i ={1,2,…,15,16} . T able 1 and T able 2 list t he value of j and i , respectively . Additionally , the simulation exam ple assumes that the initial number of EV s in each char ging stati on equals to zero, that of 0 j = for all the char ging stati ons j in the roa d network. 17 T able 1 V alue of par ameter j for each char ging station node. Charging stati on j Charging station j Charging station j CS 1 0.74 CS 4 0.90 CS 7 0.94 CS 2 0.84 CS 5 0.78 CS 8 0.90 CS 3 0.94 CS 6 0.87 T able 2 V alue of par amet er i for each n ormal node. Normal node i Normal node i Normal node i Normal node i 1 0.31 5 0.20 9 0.18 13 0.57 2 0.62 6 0.13 10 0.27 14 0.35 3 0.32 7 0.50 11 0.15 15 0.52 4 0.69 8 0.25 12 0.26 16 0.67 For each charging request t i C , its information include s the travel destination t i d and remaining energy t i e , which is randomly generated in the simulation ex ample. In every time slot, if a charging request occurs in a specific nor mal node , the travel destination t i d is r andomly selected f rom other normal nodes in the road network. The remaining energy t i e is randomly obtained f rom a giv en interval, which ranges from 7.2 kWh to 16.8 kWh in the simulation example. In a tim e-var ying ro ad net work, the e nergy co nsumption on each li nk varies a s time slot passes. T o refle ct such a c haracteristic , at time slot t , the simulation example randomly determines the parameter t a E from given intervals for link a . The value int ervals of the ener gy cons umpti on t a E on each li nk a are listed i n T able 3. T able 3 V alue intervals o f energy consumption t a E for the link a at ti me slot t Link a t a E (k Wh) Link a t a E (kWh) Link a t a E (kWh) 1 – CS1 [2.64,5.76] 9 – 7 [2.16,4.8] CS1 – 2 [1.68,4.08] 1 – 4 [3.6,5.04] 9 – 11 [2.16,5.04] CS2 – 3 [3.6,6.96] 2 – CS1 [2.4,4.8] 10 – CS4 [2.64,5.52] CS2 – 4 [2.88,6.48] 2 – 3 [1.92,4.56] 10 – 12 [1.44,4.08] CS2 – 5 [3.6,4.8] 3 – 2 [3.12,4.32] 10 – CS7 [2.64,4.56] CS3 – 2 [2.88,6] 3 – CS4 [1.44,3.84] 11 – 9 [2.16,3.6] CS3 – CS4 [2.88,5.28] 18 3 – CS2 [1.2,4.32] 11 – CS7 [1.2,4.56] CS3 – 14 [2.16,4.8] 4 – 1 [2.16,3.6] 11 – 16 [1.44,3.36] CS4 – 3 [1.2,4.8] 4 – CS2 [2.4,5.28] 12 – 10 [2.16,4.8] CS4 – 7 [2.64,6] 4 – 6 [3.12,6.48] 12 – 13 [2.4,4.8] CS4 – 10 [3.12,6.72] 5 – CS2 [2.88,5.28] 12 – CS8 [1.92,4.8] CS4 – CS3 [2.88,4.8] 5 – 6 [2.4,3.6] 13 – CS7 [3.36,5.04] C S5 – 6 [1.2,3.12] 5 – 7 [1.68,3.6] 13 – 12 [2.64,4.56] CS5 – 7 [1.44,3.36] 6 – 4 [1.44.5.04] 13 – 15 [1.68,4.56] CS5 – 8 [3.12,5.04] 6 – 5 [2.16,3.6] 13 – 16 [1.44,5.04] CS5 – 9 [2.4,5.04] 6 – CS5 [2.16,5.28] 14 – CS3 [3.12,5.04] CS6 – 6 [2.16,4.08] 6 – CS6 [3.6,5.52] 14 – CS8 [2.88,6.24] CS6 – 8 [1.92,5.52] 7 – 5 [3.6,5.52] 15 – 13 [1.92,5.28] CS7 – 7 [1.68,4.56] 7 – CS4 [1.92,4.32] 15 – CS8 [1.2,4.56] CS7 – 10 [3 .6,6.72] 7 – CS7 [3.36,5.52] 15 – 16 [2.16,5.28] CS7 – 11 [2.16,3.84] 7 – 9 [2.64,6.24] 16 – 8 [2.4,4.08] CS7 – 13 [1.44,2.88] 7 – C S5 [2.4,4.32] 16 – 11 [2.4,6] CS8 – 12 [2.4,3.6] 8 – CS6 [3.36,4.8] 16 – 13 [3.36,6.72] CS8 – 14 [1.2,3.84] 8 – CS5 [3.12,4.8] 16 – 15 [3.6,6.96] C S8 – 15 [2.64,5.28] 8 – 16 [2.4,3.84] CS1 – 1 [2.16,5.28] 2 – CS3 [2.16,4.32] 9 – CS5 [1.2,4.32] Besides the energy co nsump tion t a E , the d riving ti me on ea ch lin k a also has ti me-varying characteristic. Like the parameter t a E , in every time slot, the v alues of par a meter t a are ran domly determ ined based on giv en interv als for each link a . The value interv als of the driv ing time t a on each link a are listed in T able 4. Notably , since the tim e is slotted into the time slots with ident ical duration, the number of time slots is used to rep resent the driving time on each link. W ithout loss of generality , the duration for each time slot is not constrained in the simul ation exampl e. In the real- world situati on, the duration f or time sl ots could be v alued accordin g to actual req uirem ent. T able 4 V alue intervals o f driving time t a for the link a at ti me slot t Link a t a Link a t a Link a t a 1 – CS1 [2,5] 9 – 7 [1,2] CS1 – 2 [1,3] 1 – 4 [1,4] 9 – 11 [1,2] CS2 – 3 [1,2] 19 2 – CS1 [2,3] 10 – CS4 [1,2] CS2 – 4 [2,4] 2 – 3 [1,2] 10 – 12 [1,2] CS2 – 5 [1,3] 3 – 2 [2,3] 10 – CS7 [2,4] CS3 – 2 [1,2] 3 – CS4 [2,3] 11 – 9 [1 ,2] CS3 – CS4 [1,3] 3 – CS2 [1,4] 11 – CS 7 [2,4] CS3 – 14 [1,2] 4 – 1 [1,2] 11 – 16 [1,2] CS4 – 3 [1,2] 4 – CS2 [2,4] 12 – 10 [2,3] CS4 – 7 [1 ,3] 4 – 6 [1,2] 12 – 13 [1,2] CS4 – 10 [1,3] 5 – CS2 [1,2] 12 – CS8 [1,4] CS4 – CS3 [1,2] 5 – 6 [1,2] 13 – CS 7 [1,3] CS5 – 6 [1,2] 5 – 7 [2,3] 13 – 12 [1,2] CS5 – 7 [1,2] 6 – 4 [1,2] 13 – 15 [2,3] CS5 – 8 [1,2] 6 – 5 [1,2] 13 – 16 [1,2] CS5 – 9 [1,2] 6 – CS5 [1,3] 14 – CS3 [2,4] CS6 – 6 [1, 3] 6 – CS6 [1,2] 14 – CS8 [2,3] CS6 – 8 [2,3] 7 – 5 [1,2] 15 – 13 [2,3] CS7 – 7 [1,3] 7 – CS4 [2,5] 15 – CS8 [2,5] CS7 – 10 [1,3] 7 – CS7 [2,4] 15 – 16 [1,2] CS7 – 11 [1,2] 7 – 9 [1,2] 16 – 8 [1,3] CS7 – 13 [1,2] 7 – C S5 [1,3] 16 – 11 [1,2] CS8 – 12 [2,3] 8 – CS6 [2,5] 16 – 13 [1,3] CS8 – 14 [1,2] 8 – CS5 [2,4] 16 – 15 [2,3] CS8 – 15 [1,2] 8 – 16 [1,2] CS1 – 1 [1,2] 2 – CS3 [1,3] 9 – CS5 [2,3] Furthermore, T able 5 lists the length of each link a in the ro ad net work. In the table, the leng th o f link a is d enoted as l a (km). N otably , co nsidering th e s tructure characteristic of road networ k, the li nks with symmetric relation have the sa me length. T able 5 Length a l of link a in the road network Link a l a (km) Link a l a (km) Link a l a (km) 1 – CS1 23 9 – 7 15 CS1 – 2 11 1 – 4 12 9 – 11 10 CS2 – 3 10 20 2 – CS1 11 10 – CS4 14 CS2 – 4 10 2 – 3 10 10 – 12 11 CS2 – 5 11 3 – 2 10 10 – CS7 12 CS3 – 2 17 3 – CS4 20 11 – 9 10 CS3 – CS4 12 3 – CS2 10 11 – CS 7 12 CS 3 – 14 22 4 – 1 12 11 – 16 16 CS4 – 3 20 4 – CS2 10 12 – 10 11 CS4 – 7 10 4 – 6 12 12 – 13 12 CS4 – 10 14 5 – CS2 11 12 – CS8 10 CS4 – CS3 12 5 – 6 10 13 – CS 7 11 CS5 – 6 11 5 – 7 12 13 – 12 12 CS5 – 7 11 6 – 4 12 13 – 15 10 CS5 – 8 10 6 – 5 10 13 – 16 16 CS5 – 9 11 6 – CS5 11 14 – CS3 22 CS6 – 6 12 6 – CS6 12 14 – CS8 12 CS6 – 8 12 7 – 5 12 15 – 13 10 CS7 – 7 18 7 – CS4 10 15 – CS8 11 CS7 – 10 12 7 – CS7 18 15 – 16 10 CS7 – 11 12 7 – 9 15 16 – 8 30 CS7 – 13 11 7 – C S5 11 16 – 11 16 CS8 – 12 10 8 – CS6 12 16 – 13 16 CS8 – 14 12 8 – CS5 10 16 – 15 10 CS8 – 15 11 8 – 16 30 CS1 – 1 23 2 – CS3 17 9 – C S5 11 4.2 Simu lation r esults and analysis On the b asis o f the example scenario , the SDD s trategy and CSB strate gy are applied in the dynamic charging guidance pr oblem with the time-var ying road network. Mor eover , in o rder to analyse the per formance during different ti me horizon, the total number of time slots is respectivel y set as T =10 2 , T =10 3 , T =10 4 , T =10 5 and T =10 6 . Note that, both SDD and CSB strategies could ensure the reachability of selected charging stations for the charging r equests in ever y time slot, as mentioned in Section 3. That i s to say , t he charg ing de mands o f EV d rivers can be satisfied by both t he str ategies. Therefore, the simulation example focuse s on the impac ts of the propo sed strategies on ch arging station operation. T he number of EVs in a charging station is a cr itical factor to r eflect the operation state of 21 the charging station. Fig.8 presents the a verage n u mber of EVs i n each charging s tation d uring different time horizon T un der the proposed strategies. (1) CS 1 (2 ) CS 2 (3) CS 3 (4) CS 4 (5) CS 5 (6 ) CS 6 22 (7) CS 7 (8) CS 8 Fig . 8 A vera ge EV number in each charging station during d ifferent time horizon T . In Fig.8, the case (1) -case (8 ) respectively sh ow the average n umber of EVs in C S 1-CS 8 during different time horizon. The change trends of the average EV number du ring different time horizo n co uld r eflect the stability o f charging stations under specific scenarios. The stability is an i mportant cr iterion to guarantee the operatio n eff iciency of charging stations. If the average number of EVs in a charging station has a flat change trend as time horizon i ncreases, the charging station would have a stable operation state for the given scenarios (Hung and Michailidis, 2012); otherwise, the average number of EVs in the charging station would have a sig nificant increasing trend as time horizon increases. As can be seen in the figure, bo th S DD and CSB strategies have ability to stabilise the operation states for C S 1-CS 8 under the e xample scenar io, because the number o f E Vs in al l the charging stations has flat c hange trends as time horizon T varies. Note tha t, although the fluctuation trends exist when the time horizon ranging fro m T =10 2 to T =1 0 4 for some cha rging stations under specific strate gies, such as the CS 2 under SDD strategy , CS 3 under CSB strategy and CS 5 unde r both strategies, all the charging stat ions could reach the stable state after the tim e horizon T =10 4 . Mor eover , by co mparing the a verage EV number in CS 1- CS 8 with stab le state , a significa nt d iff erence ca n be observed fro m t he S DD and C SB strategies . For the SDD str ategy , the a verage number of EVs in CS 5 is significant greater than tha t in other charging stations due to the lack of considerati on in vehicle balance of charging statio ns . On the contrary , the average EV number under the CSB st rategy has a similar trend in all the cha rging stations. Notably , although the average EV number is a critical refle ction of the stability for eac h charging station, it cannot perfectly represent t he actual number of EVs in ever y time slot. As a matter of facts, the E V number in charging stations at di f ferent time sl ots may varies during the time horizo n. Moreover, as time slots pass, the difference between ma ximum a nd minimum nu mber of EVs in a charging statio n may b e increasingly significa nt. If the E V number in a selected charging station is relatively large, dr ivers would b e reluctant to charg e their vehicles b y usin g it at corresponding time slot, which would exert ne gative influences on the implementatio n e fficiency o f charging g uidance service . T herefore, duri ng the time horizo n T , t he maximum n umber o f EVs i n ea ch c hargin g station is often regarded as the bo ttleneck in th e ap plication o f charging guidance strategies under the r eal-world situation. T o further co mpare the performance of SDD and CSB strategies, based on the simulation example, we present the maximum number of EVs in each charging station during dif ferent time horizon T , as sho wn in Fig. 9. 23 (1) Tim e horizon T =10 2 (2) T im e horizon T =10 3 (3) T im e horizon T =10 4 (4) T ime horizon T =10 5 (5) T im e horizon T = 10 6 Fig.9 Maximum EV number in each c harging station duri ng different t im e horizon T The maximum n umber of EVs in ea ch charging station under both SDD and CSB strategies are depicted in Fig.9, where the case (1) -case (5 ) resp ectively illustrate the results d uring diff erent ti me horizon, r anging from T =10 2 to T =10 6 . As ca n be seen, in th e cas e (1 ), the maximu m num ber of EVs i n CS 1 -CS8 under the SDD str ategy is less t han that under t he CSB strateg y . However , when the time horizon T =10 3 as shown in th e case (2), the EV n umber in CS 5 u nder the SDD strategy is larger than that under the CSB strategy . In the case (3), the SDD str ategy significantly enlarges the maximu m number of EVs i n most of c harging stations, especially in C S 5, as co mpared to the case (2). The extreme gap of maximum EV number among t he charging stations is equal to 32. On the contrary , the 24 maximum number of EVs under the CSB strateg y ha s a mode rate d egree of change for all the charging stations. Especially , the maxi mum number of EV s in CS 3 and CS 5 has a d ecrea sing trend as compared to the case (2). T he extreme gap of maximum EV number a mong the charging stations is equal to 7. When the ti me ho rizon T =1 0 4 as shown in t he case (4 ), the maximum number of EVs under the SDD strateg y increases for all the char ging statio ns, and the maximu m EV nu mber in CS 5 and CS 7 is significantl y larger than that u nder the CSB strategy . Moreo ver , the extreme gap of maximum E V number amon g the c harging station s under SDD and CSB strategies r espectively eq ual to 41 and 7, which presents a significa nt difference in vehicle bala nce among different cha rging stations between the two strategies. I n the case ( 5), the maxim um EV numb er in CS 5, CS 6 and CS 7 under the SD D strategy is larger than that under the CSB strategy . Further more, the extreme gap of maximum EV number a mong the charging stations reaches 4 8 under the SDD strategy . O n the contrary , under the CSB strategy , the maximum number of EVs pr esents a balanced state for diff erent charging statio ns . The extreme gap of maximum EV number among the ch arging stations is eq ual to 7. Through comparing the performance o f SDD and CSB strategies ba sed on the simulatio n example , it is observed that the C SB strategy has a significant advantage in ter ms o f the vehicle ba lance among different charging stations , especially in the situatio n w ith long time horizon. Given s uch a performance, the ne gative infl uence resultin g from the large number of EVs in a charging station would be avoided by using the CSB strategy . Unlike the CSB strategy , the SDD strategy w ould enlarg e the gap of EV number in different c harging station s as time horizon increases, which wo uld a ffect the operation efficiency of the c harging stations that have relatively more vehicles . Ho wever , when i n the situation with sh or t time horizo n, the SDD strategy could b e used to deal w ith the dynamic charging requests, because the difference in perfor mance of the two s trategies is not significant in such a situation. More i mportantly , the travel de mands of EV drivers are consider ed in the SDD strategy . 4. 3 Parameter analysis When d iscussin g t he dynami c charging guida nce proble m, besides time hor izon, the scenario characteristics also ha ve sig nificant e ffects on the per formance of pr oposed strategies . For pr oblem formulation, t he para meters i and j are respec tively used to present the dynamic characteristics of charging req uests and charging processes , as mentio ned in Section 2 . Note t hat, such the parameters also h ave ab ility to reflect the scenario characteristi cs in terms of the EV scale and char ging le vel. For instance, a larger para meter i represents a larger E V scale in node i . Mean while, a larger parameter j illustrates a higher charging level of the char ging statio n in nod e j . In order to e xplore the performance of charging guidance strategies und er diff erent sce nario parameters, t he par ameters i and j are set as different values. Moreover , to highlight the eff ects of parameter values on 25 sim ulation results, for each parameter scenario , the values of the param eter i for all normal nodes i are set as the identical value . Similarly , the values of parameter j for all char ging station nodes j are set as the i dentical v alue . F urtherm ore, the time horizon is set as T =10 6 f or all the parameter scenarios . F ig. 10 presents the m aximum number of EVs in each ch ar ging station under the SDD st rategy , as the param eters and vary . As can be seen, the value of is set as 0. 1, 0.2, 0.3, 0.4 and 0.5. The value o f is set as 0.6, 0.7, 0.8 , 0.9 and 1.0. A param eter scenario consists of a pair of param eters and . Thus, totally 25 param eter scenarios are consi dered. (1) CS 1 (2 ) CS 2 (3) CS 3 (4) CS 4 (5) CS 5 (6) CS 6 26 (7) CS 7 (8) CS 8 Fig.10 Change trends o f the m aximum EV number in each charging station under the SDD strateg y In Fig.10, the case (1)-case (8 ) r espectively illustrate the maxi mum EV number in CS 1-CS 8 under the SDD strateg y for the d if ferent p arameter scenario s. No tably , in some par ameter scenario s, the maximum E V number in a sp ecific c harging station may re ach infinity , w hich ind icates that t he state o f the c harging station is u nstable. For suc h a scenario , we let the ma ximum EV number eq uals to zero in the fig ure. Obviously , in the case (1 ), as the parameter increases, the m aximum E V number in CS 1 presents a decrea sing trend. This phe nomenon indicates t hat the maximum EV number reduces as the charging level of the charging station increases. In contrast , as the parameter increases, the maximum number of EVs in CS 1 has an increasing tren d, which indicates that the maximum EV n umber increases a s the EV scale increases in the road netw ork. Moreover, among all the para meter scenarios , the p eak and lowest values of the maximum EV n u mber are equal to 2 and 29, respectively . In the cas e (2), as the scenario p arameters change, the maximum E V number in CS 2 presents a similar change trend with that in CS 1. However, unlike the ca se (1) , t he unstable pa ra meter scenarios exist in t he cas e (2). Among all the stable parameter scenarios, the p eak and lo west values of the m aximum E V number respectively equal to 3 and 82 . Furth ermore, in the case (3) -case (8), it is observed that the ma ximum number of EVs in C S 3-CS 8 also has the si milar change trend with that in CS 1. M eanwhile, like CS 2, the unstable state would exist in CS 3 -CS 8 under spec ific parameter scenarios. Among all the stable parameter scenarios, the lo west values o f the maximum E V number in CS 3 - CS 8 are all equal to 4. Comparatively , the pea k val ues o f the maximum EV number in CS 3 -CS8 are respectively equal to 103, 41, 95, 58 , 69 and 67. Note that, for a tran sportation system, the charging service is un stable un t il all the charging stations can reach stabilit y . T herefore, if at least one unstable c harging statio n exist s in the road network under a parameter scenario, the SDD strategy cannot be applied in the parameter scenario . Based on suc h a criter ion, the parameter scenarios that cannot suppo rt the SDD stra tegy could be determined. The parameter pairs of the unstable scenarios include ( = 0.3 , =0. 6) , ( = 0.3 , =0. 7) , ( = 0.4 , =0.6) , ( = 0.4 , =0.7 ) , ( = 0.4 , =0.8) , ( = 0.4 , =0.9) , ( = 0.5 , = 0.6) , ( = 0.5 , = 0.7 ) , ( = 0.5 , = 0.8) , ( = 0.5 , = 0.9) and ( = 0.5 , = 1.0) . Furthermore, for all the stab le parameter scenarios in each case, a significant change trend ca n be ob served as the p arameters var y , which indicat es that the 27 SDD strategy is sensitive to th e change of sce narios. Similarly , based on the parameter scenarios and time horizon as mentioned above, the CSB strategy is furth er applied in the dynamic charging guidance problem. As the para meters and vary , the max imum EV number i n each char ging stati on is obtai ned, as show n in F ig. 1 1. (1) CS 1 (2) CS 2 (3) CS 3 (4) CS 4 (5) CS 5 (6) CS 6 (7) CS 7 (8) CS 8 Fig.1 1 Change trends of the m aximum EV number in each charging station un d er the CS B strateg y 28 As ca n be seen in Fig.1 1, the case (1)-case (8) respectively present t he maximum n umber of EVs in CS 1-CS 8 under the CSB strategies for the d ifferent parameter scenarios. In the case (1), the maximum number of EVs in CS 1 broad ly pre sents a flat incr easing trend as the para meter decreases and parameter increases. Ho wever , for some individual sce narios, the m oderate fluct uation exists as the parameters vary . The results indicate that t he change of scenarios has the relativel y limited eff ects on the CSB strategy as compared to that on the SDD strategy . Among all the parameter scenarios , the peak and lo west values of the maximum EV n umber in CS 1 resp ectively equal to 7 and 20 . Furthermore, in the ca se (2) -case (8), the maximum num ber of EVs in C S 2 -CS 8 shows a similar change tre nd with that in CS 1. Among all t he para meter scenarios, the lowest value s o f t he maximu m EV number in CS 2-CS 8 are respectively equal to 9, 10 , 1 1, 10, 9, 11 a nd 10. Comparatively , t he peak values of the maximum EV number in CS 2-CS8 equal to 26, 30, 32, 30, 28, 29 and 27, respectively . Moreover, in contrast to the SDD strate gy , the CSB strate gy has ability to stabilize the state o f CS 1-CS8 for all the para meter scenarios, wh ich e mbodies the advantage of the CSB strate gy in terms of the charging station stability . Through co mparing the simulation resul ts in Fig 10 and Fig. 11, it is observed th at, for both SDD and CSB strategies, the maxi mum EV number incre a ses as the p arameter decreases and parameter increases, ba sically . Give n the i mplication o f par ameters and , the simulation re sults co nform to t he ope ration state of charging statio ns in the rea l-world situa tion. T o simplify the descriptio n, w e denote the parameter scenario s w ith rela tively small values and large values as the “ tense charging state ” ; otherwise , the parameter scenarios ar e d enoted as “ relaxed charging state ” . A s can be seen in t he figures, alt hough the SDD and CSB strategies have the si milar change trends i n ter ms of the maximu m EV number in each char ging station, the cha nge degree has the sig nificant difference. When the parameter scenarios v ary f rom “relaxed char ging state” to “tense charging state” , under the SDD strategy , a significant change tr end of maximum EV number ca n b e ob served for each charging statio n. The maximum nu mber of E Vs in each c harging station has a significa nt gap bet ween the adjacent parameter scenarios. As the pa rameter scenario s further var y , the SD D strate gy may have a n inabilit y to stabilise the charging ser vice. In contrast, the max imum EV number in each c harging stati on, under the CSB strategy , exhibits a moderate d egree of change. For the adjacent parameter scenarios, the maximum EV number has a flat change trend and occasionally prese nts a moderate fluctuation. Meanwhile, the CSB strategy can stabilise the charging ser vice for all the p arameter scenarios. Furthermore, in the “ relaxed charging state” , the maximum number of EVs under SDD strate g y is close to that under the CSB strateg y . However, when the par ameter scenarios bec ome the “ tense c harging state” , a significa nt gap would exist i n the maximum EV number under SDD and CSB strategies. Specifically , for the CSB strategy , the maximum EV number in each char ging station is less than 3 2 29 and most of the charging stations ha ve the maximum EV number that ra nges fro m 25 to 30. T he distribution of t he m aximum EV number among different charging stations is relatively balanced . On the contrar y , for the SDD strategy , the maximu m EV number in di fferent c harging st ations has the significant gap. On the premise of charging s tation stability , the maximum E V number in d if ferent charging stations ranges fro m 30 to 100, approximately . Therefore, based on the co mparing analysis above, it is reco mmend t hat, if the c harging service has the “tense charging state” , the CSB strategy ca n be adopt ed to ensure t he oper ation efficiency o f charging st ations a nd service sati sfaction of drivers . I n contrast, if charging ser vi ce has the “relaxed charging state” , the SDD strategy would be e mployed to solve the dynamic cha rging requests due to its si milar e ffects on c harging stations with CSB strategy and consideration of the trave l demands of E V drivers. 5. Conclusions T o realize the smart charging service for the rea l-world complicated situation , we propo se two optimal strategies to p rovide gu idance for EV charging b y considering t he dynamic charging requests in a tim e-varying road network. Based on the analysis in terms of the dynamic character istic of charging req uests, a charging guida nce problem is for mulated b y combining the ti me -varying ro ad network. Specifically , the dynamic characteristic of charging requests co nsists in the u ncertain aspects regarding time dime nsion for whet her the c harging requests occur and their detailed in formation. T he information of charging requests refers to t he drivers ’ travel d estination and re maining ener gy of EVs. Aiming at the dynamic charging guidance pr oblem, the op timal strate gies are established from two different per spectives, including t he SDD an d C SB strat egies. T he SDD strateg y uses the d riving distance from charging stati ons to destinations as the optimization cr iterion, b ased o n the travel demands of EV driver s. In c ontrast, consider ing the i mpacts of E V n umber on the ch arging stat ion operation and service satisfaction o f d rive rs , the CSB strategy selects the reac hable charging stations with minimum vehicle number as the optimal ones, based on the vehicle balance in charging stat ions . More importantly , despite of the existence of di fferences bet ween t he t wo strategies, b oth SDD and CSB strategies have the ability to en sure the reachabilit y of selected charging stations in a time - varying road network. Mor eover , the si mulation experiments are presented to in vestigate the perfo rmance of the proposed char ging guidance strategies. T he results of the experiments i ndicate that, under the identical example scenario, the CSB strategy has a significa nt advantage to b alanc e the ve hicle number among different char ging stations as compared to the SDD strategy , especiall y in the situation with r elativel y long time horizon. Furthermor e, the per formance of the t wo strategies under dif ferent scenarios is explored by changing the scenario parameters in the simula tion experi ments. For the situation with “ tense char ging state ” , the CSB strategy ha s a better performance than the SDD strateg y to ensure the 30 operation efficiency of charging stations and service satisfa ction of drivers. T hus, the CSB strategy is suggested to be used in such a situation. On the contrar y , the SDD strategy is reco mmend t o be adopted in the situation w ith “ relaxed charging state ” , because it has si milar effects on the charging station w ith CSB strategy and fur ther consid ers the travel demands of EV drivers. Notably , to simplify the pro blem for mulation, it is assumed that, in e very time slot, each normal node can generate at most o ne charging request. S uch an assumption has the certain reasonability if each time slot has the relativel y short duration. However , as the scale of EVs increases in the urban transportation syste m, multiple charging r equests ma y simultaneousl y occur in the sa me location of road network, which would significant ly co mplicate the so lving pr ocesses for the d ynamic cha rging requests. Therefore, b uilt upon the pro posed strategies, the distribution rule regarding to the number of charging request occurrence will be further investigated in the future work and considered in extending the charging guidan ce strategies. Acknowledge ments This research is s uppor ted by t he National Key R&D P rogra m of China (2018YFC0 706005, 2018YFC07060 00) and National Natural Science Foundati on of China (71961137008). The authors also gratefully ackno wledge fr uitful discussions with Dr . B in Li in the Universit y of Rhod e Island , as well as financial suppo rt fro m the China Scholar ship Council . References Abousleiman, R., Ra washdeh, O. , 2015 . A Bellman-Ford ap proach to ener gy efficient ro uting o f electric vehicles. In 2015 IEEE T ranspo rtation Electrification Conference and Expo (ITE C) , 1-4 . IEEE. Alizadeh, M., W ai, H., Scaglione, A., Goldsmith, A., Fan, Y . , Javidi, T ., 2014. Opt imized path planning for electric vehicle routing an d charging. In 20 14 52nd Annual Allerton Conference on Communication, Contro l, and Computing (Allerton) , 25-32. IEE E. Artmeier , A., Haselmayr , J., Leucker , M., Sachenb acher , M., 2010. The shortest path pr oblem revisited: Optimal routing for electric vehicles. In Annual con ference on artificial in telligence , 309-316. Springer , Berlin , Heidelberg. Bi, J., W ang, Y ., Sai, Q., Ding, C., 2019. Estimating remaining driving range of battery electric vehicles based on real-world data: A case study of Beijing, China. Energ y , 169, 833 -843. Bi, J., W ang, Y ., Sun, S. , Guan, W ., 2018a. Predicting Chargin g T ime of Batter y Ele ctric V ehicles Based o n Regression and T ime-Series Metho ds: A Case Study of Beijing. Energ ies, 1 1(5), 1040. Bi, J., W ang, Y . , Z hang, J., 201 8b. A data-based model f or driving d istance estimation of battery e lectric lo gistics vehicles. EURASIP Journal on W i reless Communications and Networking, 2018(1), 251. Bell, M., Kurauchi, F ., Perera, S. , W ong, W ., 2017. Investigating transport network vulnerability b y capacity weighted spectral analysis. T ransp ortation Research Part B: Methodological, 99, 251-266. Braekers, K., Ram aekers, K., V an Nieuwenhuyse , I., 2016. The vehicle routing problem : State of the art classification and review . Computers & Indu strial Engineering, 99, 30 0- 31 3. 31 Cao, Y ., T ang, S. , Li, C., Zh ang, P ., T an, Y ., Zh ang, Z., Li, J., 201 1. An optimized EV charging model considering TOU price and SOC curve. IEEE T rans actions on Smart Grid, 3(1), 3 88 -393. Chow , J., Regan, A., 201 1. Network-based real option models. T ran sportation Resea rch Part B: Methodological, 45(4), 682-695. Daina, N., Sivakumar , A ., Polak, J., 2017. Electric vehicle charging choices: Modelling and implications for smart charging service s. T ransportation Resea rch Part C : Emerg ing T echnologies, 81, 36 -56. De W eerdt, M., Stein, S ., Gerding, E., Robu, V ., Jennings, N., 2015. Intention- aw are routing of electric vehicles. IEEE T ran sactions on Intelligent T ranspo rtation Systems, 17(5), 1472-1482. Fernandez, L., San Romá n, T ., Cossent, R., Domingo, C., Fr ias, P ., 2010. Assessment of the impact of p lug-in electric vehicles on distribution networks. IEEE transactions on power systems, 26(1), 206-213. Ferná ndez, R., 2018. A more real istic ap proach to electric vehicle co ntribution to gree nhouse gas emissions in th e city . Journal of Cleaner Production, 172, 949-959. Fiori, C., Ahn, K., Rakha, H., 2018. Optimum routing of battery electric vehicles: Insights using empirical data and microsimulation. T ransp ortation Resea rch Part D: T ransport and Environment, 64, 26 2- 27 2. Franke, T ., Krems, J.F . , 2013. Understanding charging b ehaviour of electric vehicl e users. T ransportation Research Part F: T raf fic Psychology and Behaviour , 21, 75 -89. Fu, L., Sun, D. , Rilett, L.R., 2006. Heuristic shortest path algorithms for trans portation applications: state of the art. Computers & Op erations Research, 33(1 1), 3324-3343. Gao, S., Frejinge r , E., Ben-Ak iva, M ., 2010. Adaptive rou te choices in risky traffic networks: A pro spect theory approach. T ranspo rtation research part C: emerging technologies, 18(5), 727-740. Gendreau, M ., Ghiani, G ., Guerriero, E., 2015. T ime-dependent ro uting problems: A review . Com puters & operations research, 64, 189-197. Gnann, T ., F unke, S ., Jakobsson, N., Plö tz, P . , Sprei, F . , Benne hag, A., 20 18. Fast charging infrastructure for electric vehicles: T oda y’ s situa tion and future needs. T ransportation Research Part D: Transport an d Environment, 62, 314-329. He, F ., Y in, Y ., Lawphongpanich, S., 2014. Network eq uilibrium models with battery electric vehicles. T ransportation Research Part B: Methodological, 67, 306-319. Huang, Y ., Zhao, L., V an W oensel, T . Gro ss, J. , 20 17. T ime-dependent vehicle routing problem with path flexibility . T ransportation Research Part B: Methodological, 95, 169-195. Huber , G ., Bogenber ger , K., 2 015. Long-T rip Optimization of Charging Strateg ies for Battery Electric V ehicles. T ransportation Research Record, 2497(1), 45 - 53. Hung, Y ., Michailidis, G ., 2012. Sta bility and contr ol of a cyclic stochastic process ing networks w ith shared resources. IEEE T ransactions on Automatic Control, 57(2), 489 -494. Hung, Y ., Michaili dis, G ., 2015. Optimal routing for electric vehicle serv ice s ystems. Eu ropean Journal of Operational Research, 247(2), 515-524. International Energy A gency , 2 017. Global EV Outlook 2017; IEA: Paris, France. Jafari, E. , Boyles, S., 2017. Multicriteria stochastic shortest path prob lem for electric vehicles. Networks a nd Spatial Economics, 17(3), 1043-1070. Jiang, N., Xie, C., Duthie, J. , W aller , S., 2014. A netw ork equilibrium analysis on destination, route and parking choices with mixed gasoline and electric vehicular flows. EURO Journal on T ransportation and Logistics, 3(1), 55 -92. Kobayashi, Y ., Ki yama, N., Aoshima, H., Kashi yama, M ., 2011. A route search method for electric vehicles in consideration o f range and locations of charging st ations. In 2 01 1 IEEE Intelligent V ehicles Symposium (IV) , 920 -925. IEEE. 32 Li, B., Eryilmaz, A., 2014. Non-derivative algorithm d esign for ef f icient routin g over unreliable sto chastic networks. Performance Evaluation, 71, 44-60. Liu, C., W u, J., Long, C., 2014. Join t charging and routing optimization for electric vehicle navig ation sy stems. IF AC Proceedings V o lumes, 47(3), 2106-21 1 1. Me ll iger , M ., V an Vliet, O. , Liimatainen, H., 2018. Anxiety vs reality – Sufficiency of b attery electric vehicle range in Switzerland and Finland. T ransp ortation Research Pa rt D: T ran sport and Environment. 65, 101-115. Meng, Q., Y ang, H., 20 02. Benefit d istribution and equity in road network design. T ransportation Research P a rt B: Methodological, 36(1), 19 -35. Neaimeh, M., Hill, G ., Hü bner , Y . , Blythe, P . , 2013. Routing systems to extend the driving range of electric vehicles. IET Intelligent T ransport Sy stems, 7(3 ), 327-336. Neely , M., Mo diano, E., Rohrs, C. , 2005. Dynamic power allo cation and routing for ti me -varying wireless networks. IEEE Journal on Selected A reas in Communications, 23(1): 89- 103. Polson, N., Sokolov , V ., 2017. Deep learning for short-term traff ic flow prediction. T ransportation Research Part C : Emerging T ec hnol ogies, 79, 1-17. Putrus, G ., Suwanapingkarl, P ., Johnston, D., Bentley , E., Nara yana, M., 2009. Impact of electric vehicles on po wer distribution networks. In 2009 IEEE V ehicle Pow e r and P ropulsion Conference, 827-831. IEEE. Qian, K., Zhou, C. , Allan, M. , Y uan, Y ., 2010. Modeling of lo ad dema nd du e to EV bat tery charging in distribution sy stems. IEEE T ransactions on Power Systems, 26(2), 802-810. Qin, H. , Zhang, W ., 201 1. Cha rging scheduling with minimal waiting in a n etwork o f electri c v ehicles and charging station s. In Proceedings of th e Eighth ACM intern ati onal w orkshop on V ehicular in ter-ne tworking , 51 - 60 . ACM. Raslavičius, L., Azzopardi, B., Keršys, A ., Starevičius, M., Bazaras, Ž. , Makaras, R., 2015. Electric vehicles challenges and opportunities: Lithuanian review . Renewable and Sustainable Energy Re views, 42, 786-800 . Rezvani, Z., Ja nsson, J., Bodin, J., 2015. Advances in consum er electric v ehicle adoption resea rch: A review and research agenda. T ranspo rtation research part D: transport and environment. 34, 122-136. Said, D., Cherkaoui, S., Khoukhi, L., 2013. Queuing model for EVs charging at public supply stations. In 2013 9th International W ireless Communications and Mobile C omputing Conference (IWCMC), 65 - 70 . IEEE. Storandt, S., 2012. November . Quick and energy-efficie nt routes: computing constrained shortest paths for electric vehicles. In P roceedings of th e 5th ACM SIGSP A TIAL in ternational workshop on computatio nal transportation science, 20 - 25 . ACM. Strehler , M., Merting, S., Schw an, C., 2017. Energy -efficient sho rtest routes for electric and hy brid vehicles. T ransportation Research Part B: Methodological, 103, 1 1 1-135. Sun, Z., Zhou, X., 2016. T o save money or to save ti me: In telligent ro uting d esign for plug - in hybrid electric vehicle. T ransportatio n Research Part D: T ran sport and Environment, 43, 238-250. Sweda, T ., Dolinskaya, I. , Klabjan, D., 2017. Adaptive routing and recharging policies for electric vehicles. Tr ansp ortation Science, 51(4), 1326-1348. W ang, T ., Cassandras, C. , Pourazarm, S., 2014. Energy-aware vehicle routing in networks with charging nodes. IF AC Proceedings V o lumes, 47(3), 961 1-9616. W ang, Y ., Bi, J., Guan W ., Zhao X., 2 01 8a. Optimising ro ute choices for the travelling and char ging of battery electric vehicles by considering multiple o bjectives. T ransportation Research P art D: T ransport and Environment. 64, 246-261. W ang, Y ., Bi, J., Zhao, X. G uan, W ., 2018b. A geome try-based algorithm to provide guidance f or elec tric v ehicle charging. T ransportation Research Part D: T ransport and Environment, 63, 890-906. W ang, Y ., Jiang, J. , Mu, T ., 2 013. Context -aware and energy -driven ro ute optimization for fully electric vehicles 33 via crowdsourcing. IEEE T ransaction s on Intelligent T ransp ortation Systems, 14(3), 1331-1345. Xie, C. , Jiang, N., 2016. Relay requ irement and traffic assignment o f electric vehicles. Co mputer- Aided Civil and Infrastructure Engineering, 31(8), 580-598. Xu, M., Meng, Q., Liu, K., 2017. Network user eq uilibrium problems f or the mixed battery electric vehicles and gasoline vehicles subject to battery swapping stations and road grade con straints. T ransportation Research Part B: Methodological, 99, 138-166. Y agcitekin, B., Uzunoglu, M. , 2016. A do uble-layer s mart ch arging strategy o f electric vehicles taking rou ting and charge sc heduling into accoun t. Applied energy , 167, 407-419. Y ang, S., Cheng, W ., Hsu, Y ., Gan, C., Lin, Y ., 2013. Char ge scheduling of electric vehicles in highways. Mathematical and Computer Modelling, 57(11-12), 2873-2882. Y i, Z., Bauer, P . , 2 018. O ptimal stochastic eco -routing solution s f or elec tric vehicles. IEEE T ransactions on Intelligent T ran sportation Systems, 19(12), 3807-3817. Zhang, S., Luo, Y ., Li, K., 2016. Multi-objective route search for electric vehicles using ant colony optimization. In 2016 Am erican Control Conference (ACC), 637 -642. IEEE. Zhang, Y ., A liya, B., Zho u, Y ., Y ou, I. , Zhang, X ., Pa u, G ., Collotta, M., 2 018. Shortest feasible pat hs with partial charging f or battery-powered electric vehicles in smart cities. Pervasive and Mobile Computing, 50, 82 - 93.
Original Paper
Loading high-quality paper...
Comments & Academic Discussion
Loading comments...
Leave a Comment