Comparing time and frequency domain estimation of neonatal respiratory rate using pressure-sensitive mats
Pressure-sensitive mats (PSM) have proved to be useful in the estimation of respiratory rates (RR) in adult patients. However, PSM technology has not been extensively applied to derive physiologic parameters in infant and neonatal patients. This rese…
Authors: : John Doe, Jane Smith, Michael Johnson
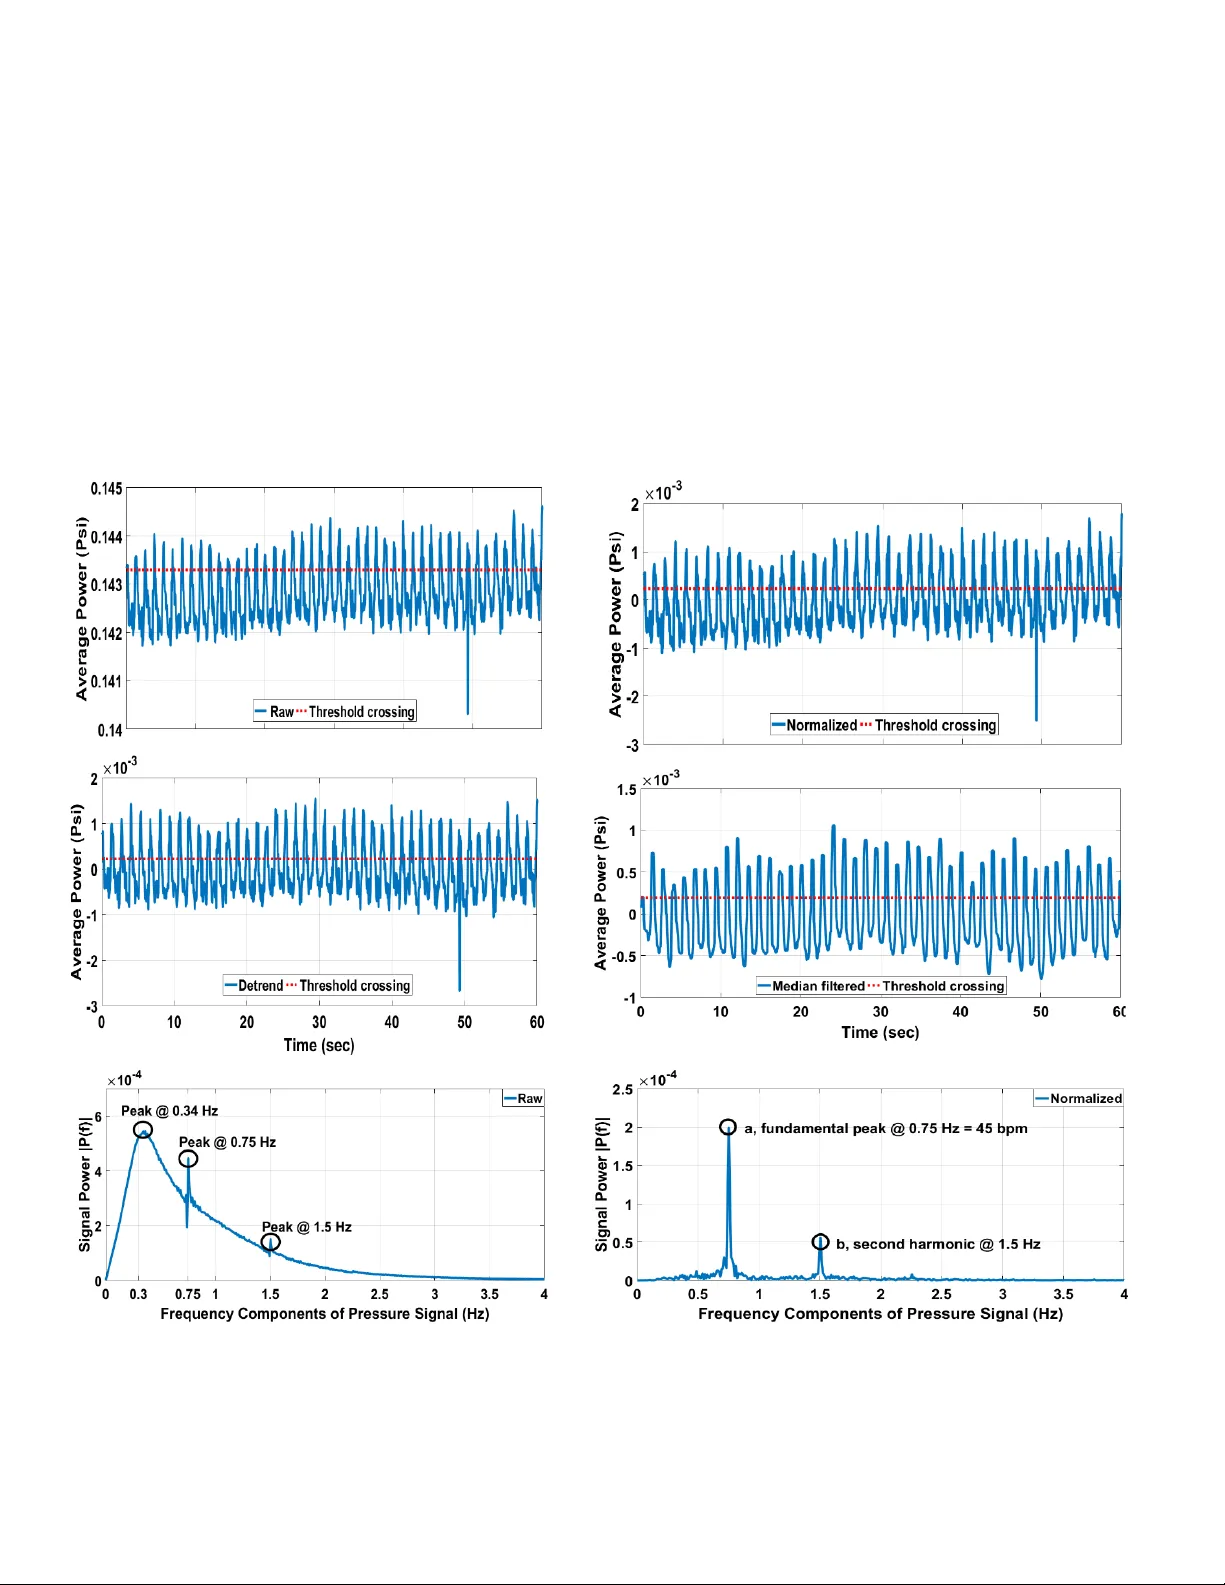
Comparing time and frequency domain estimation of neonatal respiratory rate using pressure-sensitive mats Shermeen Nizam i 1 , Amente Bekele 1 , Moham ed Hozayen 1 , Kim Greenwood 2 , JoA nn Harrold 3 , Jam es R. Green 1 1 Systems and Computer E ngineering , Carleto n University , Otta wa, Canada 2 Clinical Engineering, 3 Neonatolog y, Children’s Hospital of Eastern O ntario, Ottawa, Cana da shermeen@sce.carleto n.ca, jrgreen@sce.carleton.ca Abstract — Pressure-sensitive mats (PSM) have p roved to be useful in the estimation of respiratory rates (RR) in adult patients. However, PSM technology has not been extensively applied to derive physiologic parameters in infant and neonatal patients . This rese arch evaluates the applicability of the capacitive XSensor PSM technology to estimate a range of RR in neonatal patient simulator trials conducted under several experimental conditions . PSM data are analyzed in both the time and frequency domain and comparative results are presen ted. For the fr equency-d omain approach, in ad dition to estimating RR, a measure of confidence is also derived from the relative height of peaks in the periodogram. The study de monstrates t hat frequency doma i n analysis of mean-shifted PSM data achieves the best possible RR estimation, with zero perc ent error , as compared to the lowest achievable RMS error of 1.57 p ercent in the time d omain. The f requency do ma in approach outperforms the time do main analysis w hethe r examining raw data or those preprocessed by norm alizi ng, detrending and m edian filtering. Keywords — pressure sensitive m at ; neonatal intensive care unit; neonate; respiration rate; simulator I. I NTRODUCTI ON There is increasi ng evidence t hat t he respirator y rate (RR) of a perso n lying on a p ressure- sensitive mat (P SM) can be estimated by analyzing the measured contact pressure d ata . Past research t hat demonstrates the utility o f PSM data for the estimation of R R has been mainly focused on the adult population, su c h as [ 1] – [12] . T wo systematic revie ws of no n- invasive respirator y monitoring in clinical care , conduct ed almost a decade ap art [13], [14 ], were similarly focused on adult studies. T he most recent review, in 2015, concludes that such monitoring has the po tential for i mproved early diagnosis of patient deterio ration and the reductio n of critical eve nts for patients on the general wards [14] . PSM technology is well- suited to long-term patient monitoring bo th at ho me a nd in hospitals due to it b eing non-invasi ve, contactless, a nd unobtrusive. However, when it com e s to the infant and neonatal population, there is a scarcit y o f r esearch within the field. In 1976, Fra nks et al. pioneered the idea to m easure pressure cha nges i n the t horax region during the resp iratory cycle in overnig ht reco rdings in infants at ho me who were up to six months old [15]. They recommended that an under- mattress pressure se nsor w as the m ost s imple and satis factory amongst five contactles s devices tested, especiall y in cases where there could be considerable p arental apprehension . However, the use of P SM has not yet been evaluated on criti cally ill term a nd p reterm babies within a hospital’s neonatal intensive care unit (NICU). Previously, the u se of mechanical sensors s uch as single-poi nt load cells [16] , pressure senso rs [1 7], [18] , and piezoceramic sensors [19 ] has been research ed for the extrac tion of neonatal and infantile RR . T he key disad vantage with all the se methods is the loss of spatial resolution when compared to PSM technolog y, wh ere an array of p ressure transducers provides a time-varying high- density 2D map of contact pressure. Secondly , sensors that attach to the patient’s bed are relatively d ifficult to transfer should the patient need s to be transfer red to another bed . A number of infant br ea thing monitors that use mechanical sensors are available in t he market including wearables such as Snuza Hero, Leva na O ma, Mimo and Bab ySense [20] . However, these systems ar e neither licensed as m edi cal devices f or use in hospitals in North America nor do th e y provide applicatio n program i nterfaces for secondary a nalyses of their datasets. As we beg in to explor e the use of P SM as a long-ter m continuous patient m o nitoring m odalit y in the NICU, there exist a number of challenges . A major d ifference tha t exists in using PSM w ith t he neonata l population , as opposed to ad ults or older children, is the much smaller mass and pressure ranges [16]. It m ay be necessary to place th e PSM above the mattress but belo w a crib sheet, since output signals b elow a mattress can be heavily mute d and may feature less distinct localized load ing thus reducin g the signal - to -noise ratio (SN R) [4]. Thereby, ad herence to medical device standards and testing for electrical safety become o f utm ost importance. In addition, electrical, mechanical, and environmental artifac ts decrease the ab ility to e stimate t he RR accurately. These include power line inter ference, electrical noise, patie nt movements, and vibrations fr om p eople walking around t he This research is sponsored by Centre for Adv anced Studies, IBM C anada Lab and the Natur al Sciences and Engine ering Research Council . bed, possible air currents fr om heating, ventilatio n and air conditioning . Physiolo gic artifacts are an ot her po tentially confounding factor in the detection of the RR signal from PSM data. For exa mple, expirato ry gru nting distorts t he breathing si gnal a nd p roduces an unclear noisy expiratio n wave [21], [22] . Gr unting is a co mpensatory breathing ef fort made by a neonate to overcome some lung abnormality. Grunting is prod uced by the expiration of air through partiall y closed vocal cords, either intermittent ly or co ntinuous ly depending o n the severity o f th e lung disea se [ 23] . Clin icia ns typically hear the grunting sound prod uced by a patient. Grunting is o ne of the sy mptoms of neonatal respiratory distress syndrome (NRD) a nd is typically recognized by clinicians when liste ning to a patient b reath [24] . Term a nd preterm infa nts presenting with NRD are admitted to the NICU and treated w i th ox ygen supp ly [25 ], [26] . NRD accounts for significant morbidity and mortality [27]. In this p roof- of -concept study, we collect a co mprehensive dataset from a capacitive PSM LX100:36.36.02 ( XSensor Technology Corp. C algary, Canada, XSensor .com) to show that it i s possible to extract simulated neo natal RR from P SM data . I n our pr evious work, the XSensor P SM technolo gy h as shown a superior dynamic response as co mpared to the metrological properties of re sistive T ekscan an d optical S4 PSM technologie s [2 8] . This stu d y co mpares time and frequency d omain app roach es for RR est imation with results presented in ter ms of estimation er ror and co nfidence. A breathing patter n is a ti me series si gnal do minated by respiratory modulation [29] . To compare RR esti mation results in the time and frequency do mains, this stud y categorizes the dataset based on three experi mental conditions: (i) breathing patterns (normal vs. grunting); (ii) position of the simulator (supine vs. pro ne); and (iii) type of mattress ( overhead w ar mer vs. cr ib). These data are then pre- processed as follows to mitigate signal art ifacts: nor malizing by subtr action o f average pr essure measured across the analysis window width to remove DC co mponents e xtraneous to the breathing pattern; detrending to remove lo w-frequenc y metrological d rift; and median filtering for recovery o f a smooth breathing patter n. Eac h stage of pre -processing ai ms at improving the signal - to -noise ratio (SNR) of the breathing pattern, which is ot herwise obscured b y noise in the PSM data. The time do main analysis does not require kno wledge of t he expected RR range. RR estimation in the time domain is based on calculating the n umber of times the breathing pattern crosses a given threshold. In ad dition to the time do main, this study a nalyzes PSM data in the freq uency do main to estimate RR. The breathing patt ern is anal yzed in the frequency do main by fast Fourier transfor mation ( FFT ) and subsequ ent identification of t he frequency co mponent that is co ntributing the largest signal po wer. There is value in having indep endent esti mates of RR from multiple p atient monitoring modalities, including PSM, for greater data integ rit y. Ho wever, the esti mate produced by PSM data may be co nfounded b y several factor s that could be electrical, mechanical, environmental a nd p hysiologic in nature. This research f oc uses on the impact of p hysiologic grunting on the R R esti mate b y a nalyzing P SM data acquired during bench testing with neonatal patient simulators . This bench testi ng con stitutes phas e one of a larger projec t that will assess the applicab ility of PSM technolog y to patient monitoring in the NICU . Phase two shall include soft ware and systems develop ment guided by real p atient data acquired from the NICU. The following section o utlines the data collection and acquisitio n methods. Section III pr esents results and data analys is . Section IV discusses the r esearch findings followed by co nclusions with d irections for future work. II. M ETHODS The bench testing was conducted at the Children’s Hospital of Easter n Ontario (CHEO), Ottawa, Canada. The bench testing equipment incl uded a ne o natal p atient simula tor “SimNewB” (Laerdal Medical Canada, Ltd., Toronto, Canada), a Giraf fe overhea d warmer neonatal bed (GE Healthcare, USA), an open crib, and a capacitive PSM LX100:36.36 .02 (XSensor Technolog y Corp. Calgary, Canada, XSensor.com). The bench testing was conducted by placing “SimNe wB” o n two different mattresses. One mattress comes with the Giraf fe overhead warmer in the size of 65x48x4 cm (25.5L x 19W x 1.5D in), and a crib mattress that is approximately do uble the size and depth, and is significantly firmer. Fig. 1 shows “ SimNewB ” lying in the supine position on the P SM in the crib . The “ SimNewB ” simulator represents a neonate weighing approximately 2790g (6.2 lbs) with a le ngth o f 51 cm (21 in). The PSM senso r was placed o n top of the bed mattress and co vered with a s heet that is normall y used in the NICU . T he PSM sensor has a density of 1 sensel/0.5 in 2 with a n o verall sensing ar ea o f 18 x 18 in 2 . The PSM connects to an X3 Pro Sensor Pack that feeds into an X3 Pro Electronic Platform that i s connected via USB to a laptop running the X3 Pro so ftw are. The X3 Pro software was used to record PSM d ata and video simultaneously. F ig. 1 also shows the contact pressure image produced by the X3 Pro software in one fra me during the acq uisition of a s upine dataset in the crib. The labels indicate the bo dy parts of the simulator on the P SM. The shaded thorax area marks the Fig. 1: SimNewB lying supine on XSensor PSM over a crib mattress, with the pressure image shown on the right region of interest for which the data were analyzed. A. Da ta Acquisition and Validation A total of t wenty trials were co nducted, of which, 12 were on an overhead war mer while 8 were measured on the cr ib mattress, 12 represented normal breathing patterns while 8 represented brea thing with g runting, and in 10 exp eriments, the simulator was lying in the supine position with the remaining 10 in t he prone position. The trials were 30 - 80 seconds long and contact pressure data were acquired at a sampling rate of 2 0 frames/sec. Breathing i s a mechani cal function of the s imulator, where air fro m an e xternal compressor is used to cyclically infl ate an air sac simulating both lungs. The simulator was set to breathe nor mally, or with grunting, at three different RR of 45, 60 and 75 br eaths per minute ( bpm) . These RR fall within the ra nges observed in neonates, whether p reterm or term born, as speci fied in [2 2], [30]. Average contact pressur e data acquired from the thorax region were analyzed to extract breathing patterns. The X3 Pro calibrates the lo west noise floor (NF) based o n the pressure val ues induced by the load placed on the mat. Based on the n eonatal simulator load the NF is 0.0773 psi in these e xperiments. It implies that press ure values below 0.0773 psi are excluded from the average pressure ca lculations produced by the PSM technology. As shown in Table I, the RR estimation results in t he time and freque ncy domains are compared acr oss three e xperi mental conditions with t he following characteristics: (i) nor m al breathing patterns v er sus breathing patterns that incl ude grunting; (ii) whether the simulator is lying in a supine or a pro ne position on the PSM; and (iii) the type o f mattress un dernea th t he P SM (overhead warmer or crib mattress) . B. S ignal Pre-p rocessing Signal p re-processing was applied across the entire recording length in each trial . The acquired PSM d ata wer e pre-processed to suppress signal artifacts and isolate the breathing pattern. Normalization is carried out to remove the DC bias similar to the method in [ 31] . The DC bias i s caused by static forces fro m the l oad place d on the PSM. T o normalize, the average of all data points in the analysis window i s ca lculated and sub tracted from each data point in th e windo w. T he DC signal causes a ver y large p eak at zero in the perio dogram, th us overshado wing the power o f the fundamental freque ncy of the r espiratory cycle. T herefore, it is necessary to normalize the a verage contact pr essure data. The normalized signal is detren d ed using M ATLAB’s detrend function to re move the slow signal fluctuation s due to sensor drift . We have defined and evaluated drift and other metrological pro perties of P SM in our past researc h [28] . Detrending re moves the low-freq uency noi se i n the frequenc y domain, hence rendering a cleaner perio dogram. Finally, the data ar e median filter ed to smooth the signal, remove hi gher frequency noise co mponents a nd recover the brea thing pattern. The three stages of signal p re-processi ng, namel y normalization, detrending an d median filtering a ll aim to improve the overall SNR. C. Time Domain Analysis The time-domain a nalysis i s applied to the raw average pressure signal acquired from the P SM prior to pre - processing, as well as to the normalized, detr ended, and the median filter ed datasets. The ti me domain signal is a nalyzed for the number o f times it cr osses a set threshold . The threshold is set to the 75th percentile value o f the ra w data and to half the va lue of the 75 th percentile o f the pre -processed time series data. The method us ed to coun t the respiratory peaks is similar to that o f [32] . The RR is estimated by dividing the n umber of threshold crossings b y twice t he number of samples or fra mes in the analysis window and multiplying it by sixty times the frame r ate to get a value in bpm. Fi nally, the per centage error o f the RR e stimate i n t he time domain (RR - TD E) is ca lculated by co mparing it with the RR value set on the si mulator. The root mean sq uare (RMS) of RR - TD E for the r aw and pre -processed datasets for various experimental conditio ns are repor ted in Table I. D. Frequ ency domain analysis For infants with a co rrected age in the ran ge of 1 to 79 weeks, the respirator y signal lies in the low-frequenc y band [30] . In this re search the neonatal simulator’s R R was set to 45, 60 and 75 bp m , correspo nding to freque ncies o f 0.75 -1.25 Hz. Following the methods in [31] , [32], the time-series data are filtered using a second-order B utterworth f ilter with a passband o f 0.3 to 1.5 Hz. MATLAB’s fft function is applied to the bandp ass signal from which the funda mental freque ncy, i.e., the frequency with the highest power contribution, a , is selected and then multiplied by 60 to estimate the R R i n bpm . The second largest peak, b, w ithin the p assband is also determined. The percentage er ror ( RR - FD E ) is comput ed Table I : Aggregate re sults of time and frequency domain analyse s Experimental Condition Number of experiments Raw Data Normalized Data Detrended Data Median Filtered D ata RR - FF E RR - TD E L C RR - TD E L C RR - TD E L C RR - TD E Position Supine 10 64.31 122.82 1.69 133.42 1.69 131.98 1.69 13.23 Prone 10 0.53 9.35 1.57 0.70 1.57 0.70 1.56 1.57 Breathing Pattern No Grunting 12 39.34 59.59 1.56 68.11 1.56 64.94 1.57 4.45 With Grunti ng 8 45. 39 108.18 1.69 114.51 1.69 113.56 1.66 12.17 Mattress Type Overhe ad Warmer 12 38.86 83.57 1.69 99.42 1.69 97.01 1.68 10.91 Crib 8 1.21 86.09 1.53 80.97 1.53 80.03 1.51 4.92 identically t o RR - TD E . A confidence measure (L C ) is computed as the ratio o f the highest and the second hi ghest peaks in the periodogra m, i.e ., L C = a/b . Larger values o f L C indicate greater RR estimation co nfidence. This frequen cy- domain anal ysis is applied to t he r aw a verage pressure prior to pre-processing, as well as to the nor malized, d etrended, and the median filtered data sets . Table I lists the RMS of RR - FD E and L C . III. R ESULTS A. Da ta Acquisition and Validation T he “ SimNe w B ” simulator model’s weight and len gth are representative of those of newbo rn babies [22][33 ] . Fig. 1 is a pressure im a ge f ro m one frame o f PSM data of the simulator lying in the cr ib in the supine position. Fig. 2 shows resu lts from a trial in which SimNe wB is l ying in a supine positio n on the crib mattress and breathing normally at 4 5 bpm that corresponds to a fundamental frequency o f 0. 75 Hz . Th e breathing cycle is visible in the raw PSM tim e series data acquired from the t horax region as sho wn in Fig. 2a. B. S ignal Pre-p rocessing Fig. 2 also shows time series plots at each s tage of p re- processing. It is interesti ng to note the cyclical fluctuat ion in the si gnal ar ound the nor malized mean value of zero in Fig. 2b. These fluctu a tions illustrate drift, wh ich is a metrological property of the PSM’s capac itive technology. Drift is reduc ed by d etrending (Fig. 2 c) . Fig. 2d shows the s moothing effect of the median filter, r esulting in a cleaner breathing pattern. Fig. 2: For Sim NewB lying supin e o n crib, normal RR at 45 bp m, time series of average p ower (psi) are sh own (a) raw, (b) no rmalized, (c) det rended , and (d) median filtered data; s ignal power in the frequ ency domain is sho wn after apply ing a bandpass filter to (e) raw and (f) n ormalized data. 2a 2c 2e 2b 2a 2c 2d 2e 2f C. Data Analysis In all four tim e series plots in Fig. 2, there is a horizo ntal line that represents t he threshold cr ossing that is used to count the num ber of RR peaks. Fig. 2e- f illustrate th e frequency domain representatio ns showing t he periodogra m of the ra w and normalized PSM datasets, following ba nd-pass filtering. In Fig. 2e, there is a low-f req uency peak app arent at 0.34 Hz that overp owers the two peaks at 0 .75 and 1.5 Hz that represent the R R at 45 bpm and its first har monic . T he effects of the Butterworth filter ar e visib le b y the roll-offs on b oth sides of the passband of 0 .3-1 .5 Hz and b y the r emoval of t he DC component in Fig. 2e . As sho wn in Fig. 2f, normalization cleans the low er frequency data, such that peak a , at the fundamental frequency, and peak b , at the second harmonic, are m arkedl y visible . The fundamental freque ncy is th en correctly recovered during frequency do main analysis. The 20 trials were organized into three experi mental conditions as sho wn in T able I. Each trial falls into one of the two classes wit hin each co ndition. For example, in Tr ial 1 the simulator was l ying supine o n the overhead w ar mer mattress and breathing normally at 60 bpm . So , the result s from Trial 1 contribute to wards t he aggregated results for supi ne, no - grunting, an d overhead warmer. Table I lists the agg re gate results of both time and frequency-do main a nalyses in terms of the RMS of RR - FD E and RR - TD E , . The RMS of RR - FD E is tabulated only for the raw d ataset because, for each of three preprocessed datasets, the frequency do main a nal ysis a lways estimated the correct RR pr oducing an error of zero . Rather than reporting the zero error, T able I presents the RM S of L C for these three dataset s . The values o f L c provide a measure of estimation confidence (see Methods) and ar e informative wh e n comparing exper imental conditions in which the RR estimation errors ar e uniformly zero. IV. D IS CUSSION The pressure images obtained in this researc h us ing the simulator are comparable to those taken from real infants in [34] . The p ressure image in Fig.1 shows regions of higher pressure in red which includ e the head, the thorax, and t he pelvis . These results coincid e with the regions of higher pressure shown in Fig. 9 of [34]. Br eathing patterns in Fig. 2 are in agreeme nt with the results obtained fro m real p atient data in [22] in which Fig. 6 shows a nor mal or regular breathing pattern. The follow i ng observations can be made from Table I . The error in both time and fr equenc y domains is highest across all the columns for the raw dataset as can be expected. With regards to p osition, the error for the raw dataset in both frequency and time do mains i s much hi gher for the supi ne po sition th a n for the prone position. This could be due to the location of the mechanical ventilat or inside the simulator’s bod y. Once the d ata are n or malized, the results in the frequency domain for the supine position i m pr ove significantly; t he error dr ops to zero with the RMS of L C being almost con sistent acros s the t hree pre -processed datasets. The time domain re sults do not sho w a significant i mprovement in the supine position when the d ata are norm alized and detrended. The highest improvement is seen when the data are median filtered. In the prone p osition, both do mains perform well for normalized and detrended, however, the time domain worsens for the median filtered dataset whereas t he frequency domain m aintains a zero percent error and a stead y Lc. In terms of b reathing patter n, the RMS values of RR- TD E are much better for normal breathi ng as opposed to the noi sy grunting patter n. S urprisingly, for the frequenc y doma in approach, higher estimation co nfidence ( Lc ) is observed for breathing with grunting. I n terms o f mattress type, the fir mer and thicker crib mattress results in b etter R R estimation across all three pre-processed datasets with lower RMS values of RR - TD E as co mpared to the overhead w armer m attress. Lc values r emain stead y across both mattress es in the pre - processed datasets indicati ng t hat the frequenc y do main approach is rob ust to mattress type . One limitation of the present study is that it excluded an analysis of data in the pr esence of artifacts generated b y patient motion a nd o ther electrical, mechanical, environ mental and clinical variables. While this will be explored in future work, as sho wn here, pre-processing has played an i mportant role in mitigating t he i m pac t of si gnal artifacts and improving the RR estimation rates for both domains . This study pro duced results in the t ime domain t hat were comparable to the m ore co mplex compound time-frequenc y domain analyses d eveloped in [16], [29] . The frequency domain results of this study are in agreement with past work done on ad ults i n [10], an d exceed the results prod uced in [16], [29] . In summary, the freque ncy do main analysi s outperformed the ti me do m a in a nalysis i n all three experimental co nditions and acro ss all neonatal RR evaluated here. V. C ONCL US IO N This stu d y co mpares time and frequency domain approaches to estimate RR fr om PSM data acquired during bench testing fro m neonatal patient simulators. The r esu lts clearly indicate that the frequenc y-domain appro ach is superior to the time d omain approach. This research f or ms part of a larger n ovel project to assess th e applicability of PSM technolog y i n t he NI CU. In the future, we aim to asse ss RR esti mation from rea l patient data. In addition, the fact that the estimation error is significantly higher durin g breathing with grunting may actually suggest a novel method for detecting grunting . A lar ge difference ob served betwee n time - and frequency-do main RR estimates may indicate grunting. This can be further tested using model-based time -domain approaches that may show superior performance as co mpared to the time-do main methods applied in this pap er. It is expected that se nsor fusion bet w ee n audio and PSM data m a y lead to a robust system for accuratel y identifying grunting during breathing, which is an important clinical i ndicator . A CKNOWL EDGEMENT The authors would like to acknowledge the ass istance of CHEO NICU n urse Cheryl Aubertin during data collectio n . 2e 2c R EFERENCES [1] G. Guerrero Mora, J. M. Kortelainen, E. R. Palacios Hern andez, M. Tenhunen, A. M . Bianchi, and M. O. M endez , “Ev aluation of Pressure Bed Sensor for Automatic SA HS Screening,” IEEE Trans. Instrum. Meas. , vo l. 64, no. 7, pp. 193 5 – 1943, Jul. 2015. [2] J. J. L iu et al. , “BreathSens: A Co ntinuous O n -Bed Re spiratory Monitoring Syste m W ith Torso Localization Using an Unobtrusive Pressure Sensing A rray,” IEEE J. Biome d. Heal. Informatics , vol. 19, no. 5, pp. 1 682 – 1688, Sep. 2015. [3] E. J. Pino, A. Dorner de la Paz, P. Aqueveque, J. A. P. Chavez, an d A. A . Moran, “Conta ct pressure monit oring device for sleep studies,” in 2 013 35th Annual Interna tional Conference o f the IEEE Engineering in Medicine and Biolo gy Society (EMBC) , 2013, pp. 4160 – 4163. [4] D. Townsend, R. Goubran, F. Knoefel, and J. Leech, “Validation of Unobtrusive Pressure Sensor Array for Central Sleep Apnea Screening,” IEEE Trans. Instrum. Meas. , vol . 61, no. 7, pp. 18 57 – 1865, Jul. 2012. [5] D. Tow nsend, M. Holtzman, R. Goubr an, M. Frize, and F. Knoef el, “Relative Threshol ding W ith Under -Mattress Pressure Sensors to Detect Central A pnea,” IEEE Trans. Instrum. Me as. , vol. 60, no. 10, pp. 3281 – 3289, O ct. 2011. [6] M. Nishyama, M. Miyamo to, and K. W atanabe, “Resp iration a nd body movement analy sis during sleep in b ed using hetero-core fib er optic pressure sensors without constraint t o human activity,” J. Biomed. Opt. , vol . 16, no. 1, p. 17002, 2011. [7] Y. -W. L iu, Y.-L. Hsu, and W.- Y. Chang , “Deve lopment of a b ed - centered telehealth system based on a motion- sensing mattre ss,” J. Clin. Gerontol. G eriatr. , vol. 6, no. 1, pp. 1 – 8, 2015. [8] K. Watanabe, T . Watanabe, H. W atanabe, H. Ando, T. I shika wa, and K. Kobay ashi, “Noninvasive Measureme nt of Heartbeat, Respiration, Sno ring and Body Moveme n ts of a Subject i n Bed via a Pneumatic Method,” IEEE Trans. Biom ed. Eng. , vol. 5 2, no. 12, pp. 2100 – 2107, De c. 2005. [9] Y. Hat a, S. Ko bashi, K . Kuramo to, and H. Nakaj ima, “Ho me care system for aging p eople confined to b ed by detached sensor networ k,” i n 2011 IEEE Wor kshop on Robotic Intelligence In Informationally S tructured Space , 2011, pp. 1 – 6. [10] T. Mukai, K. Matsuo, Y. Kato, A. Shimizu, and Shi jie Guo, “Determination of locations on a tactile sensor suitable for respiration and heart beat measurement of a person on a bed,” in 2014 36th Annual Internat ional Conference of the IEEE Engineering in Medicine and Biology Society , 2014, pp. 66 – 69. [11] S. Matsuo, K., Mukai, T., Kato, Y., Guo, “Unconstrained measureme nt of r espiration a nd he artbeat using a fle xi ble tactile sensor sheet on a bed,” Trans. JSME (in Japanes e) , vol. 81, no. 826, pp. 14-642- 14 – 00642, 2015. [12] J. M. Kortelainen and J. Virkkala, “FFT averaging of mu ltichannel BCG signals from bed m attress sensor to improve estimatio n of heart beat int erval,” in 2007 29th Annual International Conference of the IEEE Engineering in Medicine and Biology Society , 2007, pp. 6685 – 6688. [13] M. Folke, L. Cernerud, M. Ekströ m, and B. Hök, “Critical review of non- invasive re spiratory m onitoring in me dical care,” Med. Bi ol. Eng. Comput. , vol . 41, no. 4, pp. 377 – 383, Jul. 2003. [14] K. van Loon, B. van Zaane, E. J. Bosch, C. J. Kalkman, and L. M. Peele n, “Non -I n vasive Continuous Respiratory Monitoring on General Hospital Wards: A Systematic Review ,” PLoS One , vol. 10, no. 12, p. e0144 626, Dec. 2015. [15] C. I. Franks, B. H. Brow n, and D. M. Johnston, “Contactless respiration monitoring of infants,” Med. Biol. Eng. , vol. 14, no. 3, pp. 306 – 312, May 1976. [16] W. L ee, H . Yoon, C. H an, K . Joo, and K. Park, “P hysiologic al Signal Monito ring Bed for I nfant s Ba sed on L oad- Cell Sensors,” Sensors , vol. 16, no. 3, p. 409, Mar. 2016. [17] F. Wang, Y. Zou, M. Tanaka, T . Mats uda, and S. Chon an, “Unconstraine d ca rdiore spiratory monitor for premature infants,” Int. J. Appl. Electromagn. Mech. , v ol. 25, no. 1 – 4, pp. 4 69 – 475, 2007. [18] S. Sato et al. , “Asse ssment of a new piezoele ctric transducer sensor for noninvasive cardiorespiratory monitor ing of n ew born infants in the NI CU.,” N eonatol ogy , vol. 98, no. 2, pp. 17 9 – 90, 2010. [19] S. Nukay a, T. Shi no, Y. Kuri hara, K. Watanabe, and H. Tanaka, “Noninvasive Bed Sensing of Human Biosignals Via Piezoceramic Devices Sandw ich ed Betw een the Floor and Bed,” IEE E Sens. J. , vol. 12, no. 3, pp. 431 – 438, Mar. 2012. [20] G. Weinberg, R. Fletcher, and S.- L . Gan, “The baby sense environment,” in Conference on Human factors i n com puting systems - CHI ’ 98 , 1998, pp. 325 – 326. [21] J. Nicoll et al. , “Exhaled Carbon D ioxide and Neo natal Breathing Patterns in Preterm Infants after Birth,” J. Pediatr. , vol. 167, no. 4, p. 829 – 833.e1, 2015. [22] A. B. te Pas, C. W ong, C. O. F. Kaml in, J. A. Dawson, C. J. Mor ley, and P. G . Davis, “ Breathing Pa tterns in Pre term and T erm Infants Immediately After Birth,” Pediatr. Res. , vol. 65, no. 3, pp. 352 – 356, Mar. 2009. [23] A. K. Praman ik, N. R angasw amy, and T. Gates, “Ne onatal Respiratory Distress: A Practical A pproach to I ts Diagnosis a nd Management,” Pediatr. Clin. Nor th Am. , vol . 62, no. 2 , pp. 453 – 469, 2015. [24] J. N. Tochie , S.-P. Choukem, R. N. Langmia, E. Barla, and P. Koki- Ndombo, “Neo nat al respiratory distress in a reference neonatal unit in Cameroo n: an analysis of prev alen ce, predi ctors, etiologies and outcomes,” Pan Afr . Med. J. , vol. 24, no. 1. [25] F. Raimondi et al. , “Use of Neonatal Chest Ultraso und t o Pred ict Noninvasive V entilation Failure,” Pediatr ics , vol. 134, no. 4, 2 014. [26] A. Gil, S. Morais, and D. Faria, “Neonatal Appendicitis – an Uncommon Diag nosis, not to be F orgotten,” 2014. [27] N. Kaundal, S. Mittal, A . Bajaj, B. Thapar, and K. Mahajan, “T o Compare the Effect of C hest Physiotherapy and Chest Physiotherapy along with Refle x Rollin g on Sat uration of Peripheral Oxygen and Respiratory R ate in Pre term with Respiratory Dist ress Syndrome ,” In dian J. Physiother. Occup. Ther . - An Int. J. , vol. 10, no . 4, p. 1 37, 2016. [28] S. Nizami, M. Cohen-McFarl ane, J. R. G reen, and R. G oubran, “Comparing metrolo gical p roperties o f pressure -se nsitive mats for continuous patient mo nitoring,” in Proc. of IEEE Sensors Applications Sym p. (SAS) , 2017. [29] P. H. Charlt on, M. Villarro el, and F. Salguier o, “Waveform Analysis to Estimate Respiratory Rate,” in Secondary Analysis of Electronic He alth Records , Cham: Springe r I nternational Publishing, 201 6, pp. 377 – 390. [30] C. Kirjavainen, T., Cooper, D., Polo, O., Sullivan, “Respiratory and body move ments as indicators of slee p st age and w akefulness in infants and young children,” J. S leep Re s. , vol . 5, no. 3 , pp. 186 – 194, Sep. 1996. [31] P. Pierle oni, L . Pernini, A. Bell i, and L . Palma, “Real -time apnea detection using pressure sensor and tri - axial accelerome ter,” in IEEE-EMBS Internatio nal C onference on Biomedical and Health Informatics (BHI) , 2014, pp. 513 – 516. [32] A. Schäfer and K . W . K ratky, “Estimation of Bre athing Rate from Respiratory Sinus Arr hythmia: Com parison of V arious M ethods, ” Ann. Biomed. En g. , vol. 36, no. 3, pp. 476 – 485, Mar. 2008. [33] C. S. Grijalva-Eternod e t al. , “Midupper arm circumference and weight-for- length z scores have diffe rent associations with body composition: Evidence from a cohort of Ethi opi a n infants1- 3,” Am. J. Clin. Nutr. , vo l. 102, no. 3, pp. 593 – 599, Sep . 2015. [34] M. Donati, F. Cecchi, F. Bonaccorso, M . Branciforte, P. Dario, and N. Vitiello, “A m odular sensorized mat for monitoring infant posture.,” Sens ors (Basel). , vol. 14, no . 1, pp. 510 – 31, Jan. 2013.
Original Paper
Loading high-quality paper...
Comments & Academic Discussion
Loading comments...
Leave a Comment