Targeted Event Detection
We consider the problem of event detection based upon a (typically multivariate) data stream characterizing some system. Most of the time the system is quiescent - nothing of interest is happening - but occasionally events of interest occur. The goal…
Authors: : John Doe, Jane Smith, Michael Johnson
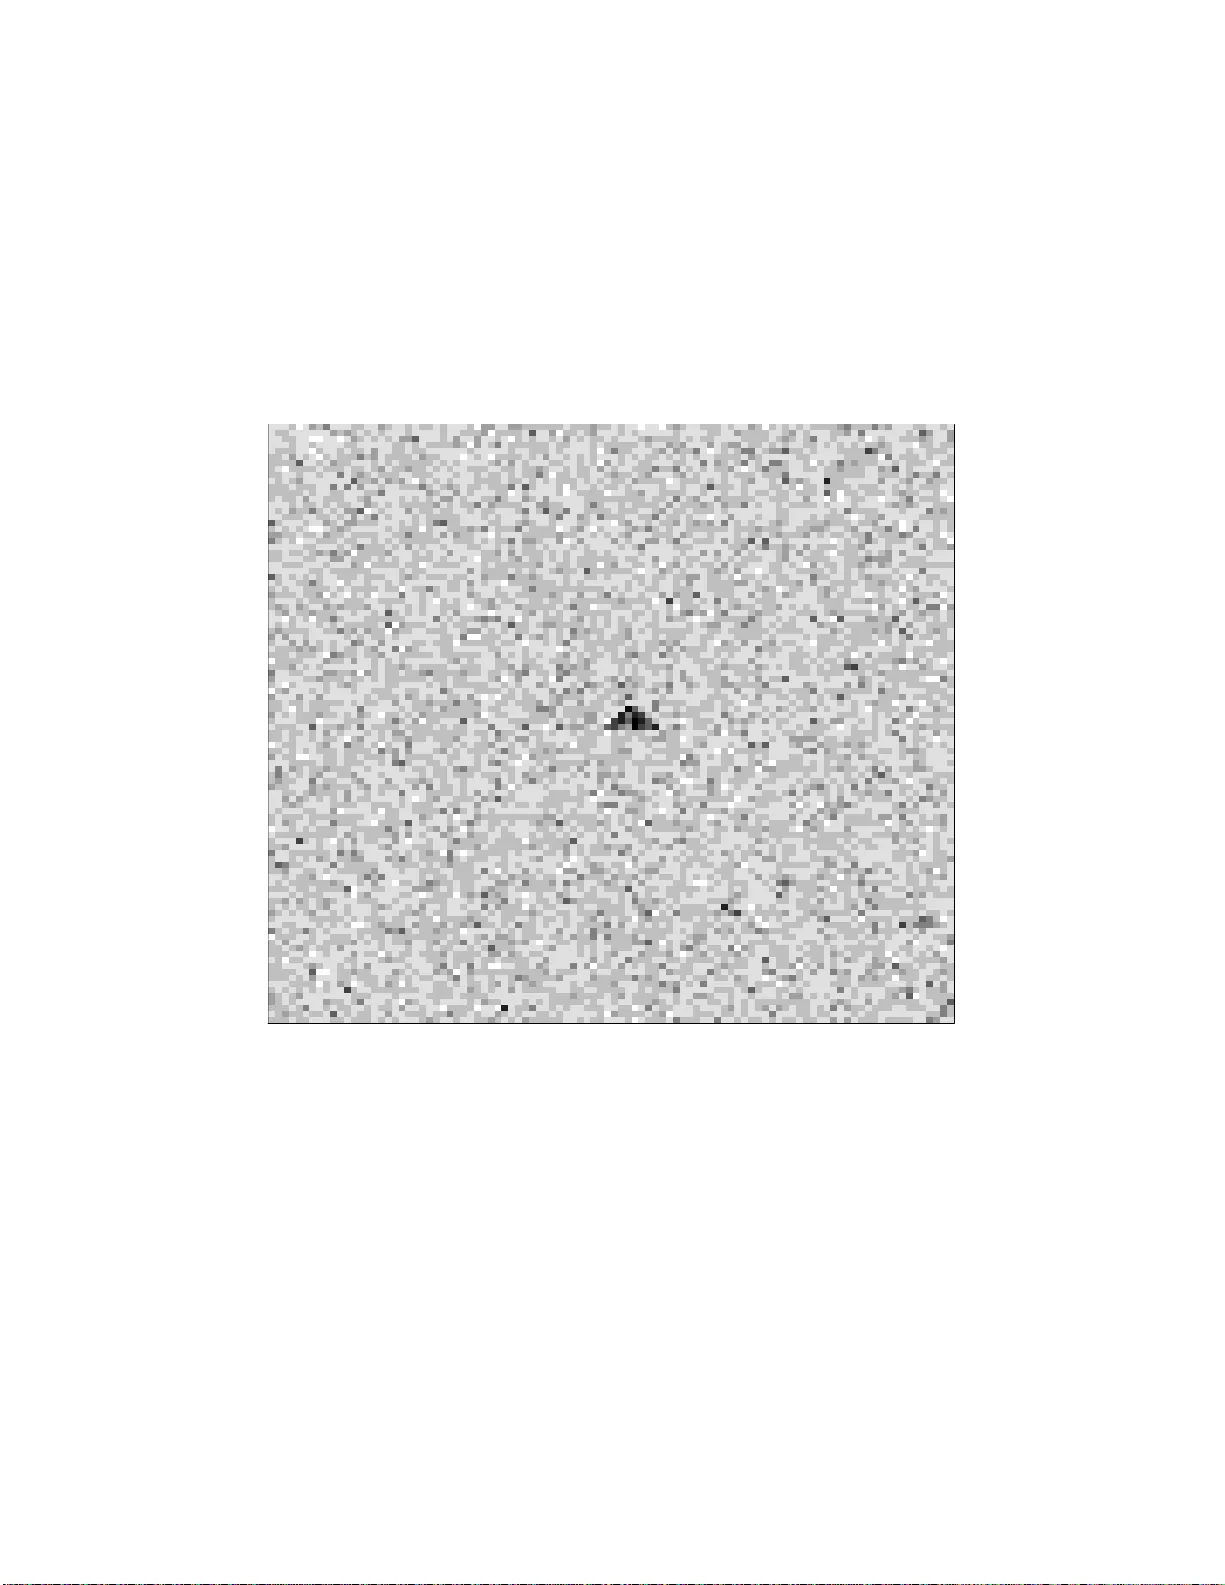
T argeted Ev en t Detection W erner Stuetzle a Donald B. P erciv al b , a , ∗ Caren Marzban a , b a Dep artm ent of Statistics, Box 3543 22, University of Washington, Se attle, W A 9819 5–4322, USA b Applie d Physics L ab or atory, Box 35 5640, University of Washington, Se attle, W A 9819 5–5640, USA Abstract W e consider the problem of ev ent detection based up on a (t ypically m ultiv ariate) data stream charac terizing some sys tem. Most of the time the system is qu iescen t – nothing of in terest is h app ening – but occasionally eve nts of in terest o ccur. The goa l of ev ent detection is to raise an alarm as so on as p ossible after the onset of an eve nt. A simple w a y of addressing the ev en t detection problem is to look for c hanges in the data stream and equate “change ” with “onset of ev ent ”. Ho wev er, there migh t b e man y kind s of c h anges in th e stream that are u nin teresting. W e assume that w e are giv en a segmen t of the stream where inte resting even ts ha ve b een mark ed. W e prop ose a method f or usin g these training data to constru ct a “targeted” d etector that is sp ecifically sensitiv e to c hanges signaling the onset of int eresting ev ents. Key wor ds: Change p oint detecti on, Eve nt detection, Image analysis, Surveil lance, Time series an alysis 20.020 , 20.040, 20.0 60, 80.020 1 In tro duction W e consider the problem of ev ent detection based up on a (t ypically m ultiv a r i- ate) data stream c haracterizing some system. Examples include sensor read- ings for a patient in an in tensiv e care unit, video images of a scene, and sales ∗ Corresp ond ing Author Email addr esses: wxs@uw. edu (W erner Stuetzle), dbp@ apl.wash ington.e du (Donald B. Perciv al), marzban@s tat.wash ington.edu (Caren Marzban). URLs: ht tp://www. stat.was hington.edu/wxs (W erner Stu etzle), http://f aculty.w ashington.edu/dbp (Donald B. Pe rciv al), http://f aculty.w ashington.edu/marzban (Caren Marzban). Preprint s ubmitted to E lsevier Science 8 Marc h 2022 records of pharmacies. Most of the time the syste m is quie scen t – nothing of in terest is happ ening – but o ccasionally ev ents of in terest o ccur: a patien t go es in to sho c k, an intrude r app ears, or pharmacies in some geographic area exp e- rience increased demand for some medications. The goal of eve nt detection is to raise an alarm as so on as p ossible after the onset of an ev en t. A simple w a y of addressing t he ev en t detection problem is to lo ok for c hanges in the data stream a nd equate “c hange” with “onset o f ev en t”. The a ssumption is that, once an a la rm rings, a h uman will en ter the lo op a nd decide whether an ev en t of in terest did in fact o ccur. If not, then the sys tem issued a f a lse alarm. If an ev en t is in prog ress, then the h uman will monitor the system till the ev ent ends. Under this assumption the second alarm caused b y the change from “ev en t” to “quiesc ent p erio d” would no t coun t as a false alarm. Changes in the da t a stream can b e detected b y comparing t he distribution of the most recen t observ a t ions (the curren t set) with the distribution of previous observ ations (the referen ce set). Let T denote the curren t time. A simple approac h is to ch o ose windo w sizes C and R , and use a tw o-sample test S to compare the observ a tions in the curren t set C T = { x T − C +1 , . . . , x T } with the observ ations in the reference set R T = { x T − C − R +1 , . . . , x T − C } . When t he test statistic S ( R T , C T ) excee ds a chosen threshold τ , w e ring the alarm. The threshold controls the tradeoff b et we en fa lse a larms and missed detections. Abstracting a w a y details, a c hange de tector can b e defined as a com bination of a detection algorithm mapping the m ultiv ariate input stream x T in to a univ aria t e dete ction str e am d T , and an alarm threshold τ . The only restriction is that d T can dep end only on input observ ed up to time T . A w eakness of the approac h to ev en t detection outlined ab o v e is the equating of “onset of ev ent” with “c hange”: there might be man y kinds of changes in the stream that do not signal the onset of an ev en t of interest. If w e detect c hanges b y running t w o-sample tests, the w eakness can b e expres sed in terms of the p ow er c haracteristics of the test S . W e wan t S to hav e high p o w er for discriminating b etw een da t a observ ed during quies cen t p erio ds and data observ ed at the onset of an interesting eve nt, and lo w p o we r against all other alternativ es. The difficult y is that it can b e hard to “man ually” design suc h a test, especially in a m ultiv aria te setting. In a previous pap er [6] w e argued that realistically assess ing the p erformance of a c hange detector and c ho osing the threshold τ for a desired false alarm rate requires labeled data. By this w e mean a segmen t x 1 , . . . , x n of the data stream with lab els y 1 , . . . , y n , where y i = 1 if x i is observ ed during an ev en t and y i = 0 if x i is observ ed during a quiesc ent p erio d. The assumption that w e ha ve lab eled training data b egs a question: shouldn’t w e use these data for designing rather than merely ev aluating a detector? In this pap er w e prop ose a w ay of injecting lab eled data in to the design phase of an ev en t detector. W e 2 refer to this pro cess as training or “targ eting” the detector. The remainder of this pap er is organized as follo ws: In Section 2 w e describ e the basic idea b ehind ta rgeted ev en t detection and con trast it with untar- geted ev en t detection. T a rgeting conv erts the problem o f detecting a c hange in the data stream signaling the onset of an ev en t to the pro blem of detecting a p ositiv e lev el shift in a univ ariate stream; w e address this problem in Sec- tion 3. In Section 4 w e briefly ske tch an adaptat ion of R OC curv es to ev ent detection prop o sed in [6]. In Section 5 we illustrate the effect of targeting in a simple situation where the data stream is univ aria t e and the observ ations are indep enden t. A more realistic multiv ariate example is presen ted in Section 6 . Section 7 concludes the pap er with a summary and discussion. 2 T argeting an Ev en t Detector W e assume w e are g iv en a segmen t x 1 , . . . , x n of a ( p ossibly mu ltiv ariate) data stream together with class lab els y 1 , . . . , y n , where y = 1 if x i w as observ ed during an eve nt o f in terest, and y i = 0 otherwise. W e use these training data to target the ev en t detec to r . The k ey step in our targeting metho d is to train a classifier o n the lab eled data. The classifier pro duces a classification score s i for eac h x i , with large v alues indic at ing y i = 1 ; i.e., x i w as observ ed during an ev en t. By construction, onset of an eve nt is signaled by a po sitive shift in the sc ore stream. W e are now left with the simpler problem of detecting a p ositiv e lev el shift in a univ ariate stream; t w o univ ariate c hange detectors mapping scores in to a detection stream d T are described in Section 3. W e raise an alarm whenev er the detection stream pro duced by the univ aria t e detection algo rithm exceeds a c hosen threshold τ . The c hoice of τ con trols the tradeoff betw een false alarms and missed ev en ts. Note t ha t lab eled data are neede d only for the training phase and not during the op eratio n of the c hange detector. It is useful to con trast ta rgeted and un targeted ev en t detection. Figure 1 sho ws a flo wc ha r t con trasting the t w o approac hes. In targeted ev en t detection, the detection algorithm tra nsforming the data s tr eam in to a univ ariate detection stream is based on a scoring pro cedure deriv ed from previously observ ed la- b eled training data. In un ta rgeted ev en t detection it is up to the designer of the detector to choose a t w o- sample test sensitiv e against c hanges signaling the onset of an ev en t. The standard c hoices lik e the m ultiv aria t e T -test and the F -test ha ve p ow er only against lo cation a nd scale c hanges, respectiv ely , whereas the c hang e in the data stream signaling the onset of ev en ts might b e of a more complex nature. There are omnibus tw o sample t ests, lik e Szek ely’s 3 test [1,7,8,9,10], that are consisten t against all alternativ es; ho we ve r, their p ow er c haracteristics migh t no t b e w ell matche d t o the pro blem at hand. 3 Detecting a Level Shift in the Score Stream T a r g eting tra nsfor ms the problem of detecting a change in a (ty pically multi- v aria te) data stream signalling the onset of an eve nt into the simpler problem of detecting a p ositive lev el shift in the univ ariate score stream gene ra t ed b y the classifier. An obvious approach is t o compare the a verage scores in the curren t and reference w indows , leading to the detection stream d dif T = 1 C X x i ∈C T s i − 1 R X x i ∈R T s i . (1) An alternativ e approac h is motiv ated b y lik eliho o d ratio tests . Supp ose, for the momen t, that o bserv ations in the dat a stream we re indep enden t and t ha t w e knew the class conditional densities p 0 ( x ) = p ( x | y = 0) and p 1 ( x ). The lik eliho o d ratio statistic f o r testing the n ull hy p othesis that a ll of the o bserv a- tions in C T and R T come from p 0 against the alternativ e h yp o t hesis that all of the observ ations in R T come from p 0 and all of those in C T come from p 1 is λ = Q x i ∈R T p 0 ( x i ) Q x i ∈C T p 1 ( x i ) Q x i ∈R T ∪C T p 0 ( x i ) = Y x i ∈C T p 1 ( x i ) p 0 ( x i ) . W e reject the nu ll h yp othesis for larg e v alues of λ . The log lik eliho o d ratio can b e written as a function of p ( y = 1 | x ): log λ = X x i ∈C T log p 1 ( x i ) p 0 ( x i ) ! = X x i ∈C T " log p ( y = 1 | x i ) p ( y = 0 | x i ) ! + log p ( y = 0) p ( y = 1) !# . Regarding s i as an estimate for to b e p ( y = 1 | x i ), this argumen t motiv ates the detection stream d lik T = X x i ∈C T log s i 1 − s i , (2) whic h is indep enden t o f the reference set. (W e can drop the term in v olving p ( y = 0 ) /p ( y = 1) since it do es not dep end on the data stream.) 4 4 Ev aluation of Ev en t D etectors An ev en t detector can mak e tw o kinds of errors: it can issue false alarms, or it can signal eve nts with undue dela y or not at all. Raising an alarm so on after the start of an ev ent is crucial f or eve nt detection: if the alarm o ccurs to o long aft er the start, the horse will hav e left the barn, and t he alarm is useless . Also, ch a ng es within ev en ts or tr a nsitions from ev en ts to quiescen t p erio ds are not of interest. F ollo wing Kim et al. [6], w e define an ev en t to b e success fully dete cted if the detection stream exceed s the alarm threshold τ a t least once within a t olerance windo w of siz e W after the onset of the ev ent. W e define the hit rate h ( τ ) as the prop ortio n of successfully dete cted ev en ts. The false alar m rate f ( τ ) is simply the pro p ortion of times in the quiescen t p erio ds during whic h the detection stream exceeds the alarm threshold. There is no p enalty for raising mu ltiple alarms during an ev en t. Our definitions for h ( τ ) and f ( τ ) are admittedly simple, and others might b e b etter in scenarios not in v olving ev en t detection. W e can summarize the p erfo r mance of a change detection algo rithm b y plo t- ting t he hit rate h ( τ ) vers us the false alarm rate f ( τ ) as w e increase the alarm threshold τ . Both h ( τ ) and f ( τ ) are monotonically non-increasing functions o f τ . The graph of the curv e τ − → ( f ( τ ) , h ( τ )) is a monoto nically non-decreasing function of f ( τ ). W e call this curv e the R OC curv e for the algorithm since it is similar to the standard ROC curv e use d to ev aluate binary classifiers [5]. It is useful to compare the p erformance of a detection algorithm with the p erformance of the prov erbial monk ey who ignores the dat a and signals a n alarm with probability α ∈ [0 , 1] indep endently a t each time T . Clearly the false alarm rate for the monk ey is α . The rate at whic h the monk ey will success fully fla g an ev en t is giv en b y the pro babilit y that an alarm is raised at least once within the t o lerance windo w of size W , whic h is gov erned b y a binomial distribution with para meters W and α . The R OC curv e of the monk ey is thus α − → ( α, 1 − (1 − α ) W ). 5 Illustration: T argeted Ev en t Detection in a Univ ariate Stream T o illustrate the b enefits of ta r g eted eve nt detection w e consider a simple sim ulated example whe re the data stream consists of inde p enden t univ ariate observ ations. The densit y p 0 of observ ations during quiescen t p erio ds is ta k en to b e standard G aussian. The density p 1 of observ ations during ev en ts is ta k en to b e a mixture of t w o symme tric comp onen ts designed to also hav e zero mean 5 and unit v ariance: p 1 ( x ) = 1 2 σ p 0 x − µ σ + p 0 x + µ σ , with µ = 0 . 9 and σ 2 = 0 . 1 9 (see Figure 2). Standard tw o-sample tests for c hanges in lo cation or scale will hav e p o or pow er here since p 0 and p 1 ha v e the same mean and v aria nce. Giv en sufficien t tra ining data lab eled a s coming from ev en ts ( p 1 ) and quiescen t p erio ds ( p 0 ), we can estimate b oth p 0 and p 1 to an y desired degree of accuracy . Assuming for simplicity that both de nsities are know n p erfectly , w e can tak e the score stream to b e s i = p ( y = 1 | x i ) = p ( y = 1 , x i ) p ( x i ) = π 1 p 1 ( x i ) (1 − π 1 ) p 0 ( x i ) + π 1 p 1 ( x i ) , where π 1 = p ( y = 1). The detection stream defined in Equation (2) then b ecomes d lik T = X x i ∈C T log s i 1 − s i = C log π 1 1 − π 1 + X x i ∈C T log p 1 ( x i ) p 0 ( x i ) ! . Because c hanging π 1 results in a lev el shift o f d lik T , the graph of the ROC curv e for the detector do es not dep end o n π 1 . Setting π 1 = 1 / 2 for conv enience yields d lik T = X x i ∈C T log p 1 ( x i ) p 0 ( x i ) ! , whic h can b e in terpreted as a log lik eliho o d ratio test statistic. Figure 3 sho ws examples of the streams x i , s i and d lik T with C = 20. In the follo wing w e assume for simplicit y that the length of ev en ts is larg e rel- ativ e to the size W of the tolerance windo w, and the spacing b etw een ev ents is large relative to the com bined size C + R of the curren t and reference windo ws. F or giv en W and alarm threshold τ w e can estimate the false alarm rate f ( τ ) and the hit rate h ( τ ) a sso ciated with d lik T using Mon te Carlo exp erimen ts. W e estimate f ( τ ) b y c omputing d lik T for a stream of data dra wn exclusiv ely from p 0 and b y determining the prop ortion of time tha t d lik T exceeds τ . T o deter- mine the hit rate, supp ose that an ev en t starts at time T and has a duration at least as long as the tolerance windo w; i.e., x i for i = T , T + 1 , . . . , T + W − 1 are dra wn from p 1 . Suppose also that x i for i = T − C, . . . , T − 1 are dra wn from p 0 . Sinc e we declare an e ven t to b e successfully detected if d lik T exceeds 6 τ at least once within the tolerance windo w, w e c a n estimate the hit rate b y rep etition of the followin g four steps: (1) sample x T − C , . . . , x T − 1 from p 0 ; (2) sample x T , x T +1 , . . . , x T + W − 1 from p 1 ; (3) form the detection stream d lik T , d lik T +1 , . . . d lik T + W − 1 ; and (4) see if an y of these W v alues exceed the thr eshold τ . The solid black c urve in Fig ur e 4 is the R OC curv e for the detection stream d lik T with W = C = 20. T o illustrate the b enefit o f targeting w e also consider a detection stream based on a tw o-sample Smirno v test [4]. This nonparametric test is designed to test for distributional differenc es b etw een t w o indep endent random sample s, whic h in our case would consist of the observ a t io ns in the curren t set C T and reference set R T . Since d lik T dep ends only on C T , it is con v enien t to remov e the dep endence of the Smirno v test on R T b y presuming that R is sufficien tly large so that p 0 is kno wn to arbitrary precision. T his allows us to r eplace the t w o- sample Smirnov test with a one-sample Kolmogoro v go o dness-of-fit test against t he n ull h yp othesis p 0 [4]. The solid gra y curv e in Figure 4 is the ROC curv e of t he untargeted detector based on the Kolmogorov test. The dashed curv e is the ROC curv e for the monk ey ignoring the da ta and signa ling an alarm with probability α ∈ [0 , 1] independently at the eac h time t . W e see that the targeted detector p erforms muc h b etter than the monk ey and the un targeted detector. The un targ eted detector p erforms only marg ina lly b etter than the monke y for ve ry small false alarm rates and is actually w orse for mo derate false ala rm rates! This might seem surprising — af ter all the Kolmogorov test do es hav e some p ow er to distinguish p 0 from p 1 . The reason is that the stream d lik T is correlated, while the monk ey’s coin tosses are not. Here is a heuristic argumen t: Supp ose an e ven t starts a t time t and d lik t << τ . Because of p o sitiv e auto-corr elat io n d lik t +1 , . . . , d lik t + W will lik ely b e also less than τ , and the detector will miss the ev en t. Now supp o se on the other hand that d lik t >> τ . Then d lik t +1 , . . . , d lik t + W will like ly b e also greater than τ , but w e will not get credit for ra ising the alarm m ultiple times. T o v erify that correlation causes the p o or p erformance of the Kolmo g oro v test, w e can change the pro cedure for estimating the hit rate: W e generate new samples in steps (1) and (2) eac h time w e compute a v alue of t he detection stream. The resulting R OC curv e (dotted) indeed is uniformly b etter than the monkey . 7 6 Illustration: T argeted Ev en t Detection in an Image Stream Supp ose we observ e an imag e stream in whic h ob jects app ear and mov e a b out. Certain kinds of ob j ects are in teresting. T he presence of these ob jects consti- tutes a n in teresting ev ent. F ollowing our basic approach to targeted ev ent detection, w e w an t to construct a classifier assigning a score to each imag e. This score should tend to b e lar ge if an image sho ws an o b ject of in terest and small if it do es not. Image streams hav e sev eral c haracteristics that w e need to take into accoun t. (1) They tend t o b e high-dimensional. If the imag e resolution is 1024 × 1024, w e are in effect observing more that 1 0 6 v aria bles. Ev en f or small 100 × 100 images, the dimension of the data stream is 10000. (2) Due to the high dimensionalit y , each individual v ariable (pixe l) con vey s relativ ely little informa t ion. (3) W e often do not care where an ob ject of in terest app ears in the image, and o b jects can mov e from one image to the next. During the op era t io nal use of the ev en t detector, ob jects of in terest migh t app ear in lo cations where they were nev er s een in the training images. Therefore the design of the ev en t detector ha s to incorp orate some kind of spatial in v a r ia nce. T o accommo date these c haracteristics, we assume that, during the training pro cess, w e visually iden tify images showing an ob ject of in terest and mark these ob jects by , e.g., placing a b ounding b o x. The insp ection pro cess pro duces a collection of b o xes sho wing ob jects of in terest; w e will call these “ev en t b ox es”. Ass ume for simplicit y that all ev ent b o xes are of the same size, sa y , m × m . Next w e extract a sample of m × m “quiescen t” b oxes from imag es take n during quiescen t p erio ds. Using the training sample of boxes w e construct a classifier for boxes assigning a large score to ev en t b o xes and a small score to quiescen t b oxe s. T o decide whether an image is tak en during a q uiescen t perio d or during a n ev en we apply the b o x classifier to a ll the b oxes in the image. If the image is n × n this results in ( n − m + 1) 2 b ox scores. F rom these b ox scores we need to deriv e a score for the en tire image; an ob vious c hoice is the maxim um of the b ox scores [6]. The problem of ob ject detection in images has b een extensiv ely studied in computer vision and image pro cessing; the approach sk etc hed ab o v e go es under the name “template matc hing” [2]. T a r g eted eve nt detection based on template ma t ching can b e v ery effectiv e. W e no w illustrate the approac h using tw o simple scenarios. In the first scenario there is one kind o f in teresting ob ject and no uninte resting ob jects. In second there is one kind of in teresting and one kind of unin teresting ob ject. 8 6.1 First sc enario: Inter esting obje c ts only Consider a stream o f 100 × 1 00 grey lev el images contaminated b y indep enden t standard Gaussian noise. An ob ject of in terest manifests itself b y a p yramid of bright pixels with a v erage in tensit y µ = 3 . Figure 5 sho ws a sample image with an in teresting ob ject. Ob jects can mo v e from image to image once they ha v e app eared. W e gather a t r a ining sample of N e = 10 ev en t b oxe s of size 10 × 10 and N q = 10000 quiescen t b oxes . In practice, ev en t b oxe s w ould b e collected “manually” as described ab o v e. F or our illustratio n we automate this pro cess and mak e it repro ducible by template matc hing a pyramid a g ainst N e ev en t images and selecting f rom eac h image the b ox that matc hes b est. W e then use the training sample of ev en t b oxe s and quiescen t b ox es to train a Fisher discriminan t rule. Assuming that ev en ts are far apart relativ e to the com bined size R + W o f the reference and tolerance windo ws, we can determine the R OC curv e through sim ulation, a s in our univ ar ia te example in Section 5. The result for R = 10 and W = C = 1 is the solid blac k line in Figure 6 (see Section 7 for a discussion of this choice for W a nd C ). The targ eted detector p erforms p erfectly (up t o the precision imp osed b y the finite sample size of the sim ulation). As a comparison, consider an untargeted detector that lo oks for change o ne pixel at a time b y comparing the pixel v alues in the curren t and reference windo ws, and then rings an alarm if the maxim um v alue of the test statistic o v er pixels ex ceeds the alarm threshold. The solid grey curv e in Figure 6 s hows the ROC curv e of the un targeted detector if w e use a bsolute difference in means as the test statistic. This first scenario suggests that, ev en in a simple situation where there are no unin teresting ob jects, ta rgeted ev en t detec tio n can b e adv antageous because it us es informatio n on what w e are lo oking for. T he ma jor adv a n tage of tar- geted eve nt detec tion, how ev er, is t he ability to distinguish interes ting fr o m unin teresting ev ents, as the second scenario illustrates. 6.2 Se c ond sc en ario: I nter e sting and uninter esting obje cts T o simplify analysis and understanding, w e assume that at an y given time w e can either see noise, or a single interes ting ob ject, o r a single unin teresting ob ject. W e call the presenc e of an in teresting ob ject an in teresting ev ent, a nd the presence of an uninte resting o b ject an unin teresting eve nt. W e wan t to raise an alarm a t the onset of inte resting eve nts. W e a lso assume that the durations of ev ents and the lengths of time b etw een ev en ts are b o th greater than or equal to R + C . The probabilit y of a false alarm at some time T dep ends on the time interv al 9 [( T − R − C + 1) , . . . T ]. W e can b e in one of the follow ing f our situations. A 1 : all images in the interv al sho w noise ; A 2 : an uninteres ting ob ject is presen t at the b eginning but not at the end (an unin teresting even t ends during the in terv al); A 3 : an uninteres ting ob ject is presen t at the end but not at the b eginning (an unin teresting even t starts during the in terv al); A 4 : an unin teresting ob j ect is presen t during the en tire in terv al. The simplifying assumptions ab ov e rule out an y other pat t erns. The proba bility of r aising an a larm a t time T (for a giv en alarm threshold) is P ( F ) = 4 X i =1 P ( F | A i ) P ( A i ) . The conditional pro babilities P ( F | A 1 ) and P ( F | A 4 ) are easy to obtain using sim ulation. Estimating the other conditional probabilities requires a little more though t. Conside r P ( F | A 2 ). If an uninte resting ob ject is visible at time 1 but not at time R + T this means an unin teresting ev en t is ending at time 1, or at time 2, . . . , or at time ( R + C − 1). Le t E i stand for “an uninteres ting ev en t ends a time i ”. A simple calculation sho ws tha t P ( F | A 2 ) = X P ( F | E i ) P ( E i | A 2 ) . F or symm etry reasons, P ( E i | A 2 ) = 1 / ( R + C − 1). The conditional proba- bilities P ( F | E i ) can b e es timat ed b y Mon te Carlo in the obvious w ay . The term P ( F | A 3 ) is treated analogously . The pro babilities P ( A 1 ) , . . . , P ( A 4 ) dep end on the lengths of the noise p erio ds and of the unin teresting ev ents. There are only tw o independen t parameters b ecause fo r symm etry reasons P ( A 2 ) = P ( A 3 ). T o get some in tuition ab out the meaning of the P ( A i ) consider a simple situation where noise in terv als are of fixed length N and unintere sting ev en ts are of length U , with N , U > R + C . Then P ( A 1 ) = N − ( R + C ) + 1 N + U P ( A 4 ) = U − ( R + C ) + 1 N + U P ( A 2 ) = P ( A 3 ) = R + C − 1 N + U . The b enefits of targeting become most apparent if unintere sting ev en ts o ccur 10 frequen tly . In the examples b elo w w e c ho ose the extreme case N = U = R + C + 1 , leading to P ( A 1 ) = P ( A 4 ) ≈ 0 . 04 and P ( A 2 ) = P ( A 3 ) ≈ 0 . 46. Supp ose that a n unin t eresting ob ject manifests itself b y an in verted p yramid with av erage intensit y µ = 3. The solid black curv e in Figure 7 is the R OC curv e for the targeted detector whic h is close to p erfect. The solid grey curve is the R OC curv e fo r the untargeted detector. The targeted detector app ears to b e la rgely imm une to the o ccurrence of unin teresting ev en ts, while comparison of t he grey curv es in F igures 6 and 7 show s that unin teresting ev en ts w or sen the perfo rmance of the untargeted detector. Fig ure 8 show s the ROC curve s of the targeted detector (solid line) and the un targeted detector (solid grey curv e) for µ = 5. Increasing the signal- to-noise ratio do es not alleviate the p erformance problem of the un targeted detector ex cept for large false alarm rates. 7 Summary and Discussion W e hav e considered the problem of ev en t detection based up on a (t ypically m ultiv ariate) data stream c haracterizing some system. One of the k ey c hal- lenges in a utomated ev en t detection is to design an algorithm that is sensitiv e to c hanges in the data stream signalling the onset of interesting ev en ts but insensitiv e to other kinds of v a riabilit y . W e hav e prop osed a metho d f o r au- tomating the design pro cess. W e assume that w e are giv en a segmen t of the data stream where interesting ev en ts ha v e b een lab eled. W e use a (t ypically nonparametric) class ifier trained on the lab eled data to gene ra te a classifica- tion rule. The classific at io n rule maps the data stream into a univ ariate score stream, where high scores indicate the o ccurrence of an in teresting ev en t. W e hav e thereb y transfor med the c hallenging problem of detecting interes ting c hanges in the data stream to the m uch simpler problem of detecting p ositive lev el shifts in t he univ ariate score stream. W e ha v e illustrated our idea on a simple univ ariate example with a sim ulated data stream and a m o r e realistic m ultiv ariate example. Both example s demonstrate that targeting can indeed impro v e performance. This pap er suggests some a ven ues fo r future researc h. F or example, the choices for the sizes R , C and W of the referenc e, curren t and tolera nce windo ws we made in Sections 5 and 6 w ere dictated mainly b y the desire to illustrate our main p oin ts as easily as p ossible. The c hoice W = C = 1 in Section 6 is ob viously unrealistic in practical situations, but was conv enien t to ass ume since it av oided the need to decide how in teresting or unintere sting ob jects mo v e from one image to the next during an ev ent. In general, the c hoice W = C seems natural, but, while it is p ossible to analytically demonstrate that the ROC for W = C dominates the o ne for W < C in a simple scen a r io 11 (namely , a stream of standard Ga ussian white noise sub ject to a shift in its mean when an ev en t occurs), the c hoice W > C is harder to rule out (limited computer experimen ts suggest it migh t b e a reasonable c hoice). How t o b est c ho ose R , C and W in situations where targeted ev en t detection is the main fo cus is not ob vious. Another in teresting a ve nue fo r researc h w ould be to conside r the p ossibilit y of op erator f eedback . Supp ose, for example, that an ev en t detector is tuned to certain in teresting ev ents, but, with the passage of time, new in teresting ev en ts can arise that are unlike ly to raise an ala rm. Supp ose also that an op erator only responds to alarms ra ised by the ev en t detector and hence w ould b e unlik ely to see a false alarm raised b y new in teresting ev en ts. By raising false alarms at random times, w e can increase the probabilit y that the op erat or will see new in teresting ev en ts. Assuming that there is a cost asso ciated with resp onding to alarms and a cost asso ciat ed with ig noring the new inte resting ev en ts, researc h would b e needed to determine the b est strategy fo r getting op erator f eedback that w ould result in new tr a ining data for use in up dating the existing ev en t dete ctor. Finally , more rese arch is nee ded on how best to handle m ultiv ar ia te streams with high dimension, but with less structure than image streams. The spa- tial structure in images simplifies the iden tification of eve nts. The lac k of a corresp onding structure in other m ultiv ariate streams can ma ke it difficult for op erat o rs to prov ide feed back that could be used for retarg eting an eve nt detector. Eve n the basic question of how to create a reasonable score stream b ecomes muc h more difficult when we cannot rely on preconceiv ed notions ab out the relationships b etw een the v ariables in the stream. Ac knowled gments This w o r k w as funded by the U.S. Office of Nav al Researc h under grant n um b er N00014–05 – 1–0843. The authors thank Albert Kim f o r his w ork o n this grant. References [1] B. Aslan, G. Z ec h, New test for th e m ultiv ariate tw o-sample pr oblem based on the concept of min imum energy , Journ al of S tatistical Computation and Sim u lation 75 (2005) 109–119 . [2] R . Brun elli, T emplate Matc hing T ec hn iques in Computer Vision: Th eory a n d Practice, J ohn Wiley & Sons, Chic h ester, UK, 2009. 12 [3] W.S. Clevela nd , Robust lo cally w eigh ted regression and smo othing scatterplots, Journal of the American Statistical Association 74 (1979) 829–836. [4] W.J. Cono ver, Practical Nonparametric Statistics th ir d ed., John Wiley & Sons, New Y ork, 1999. [5] T . F a w cett, An introd u ction to R OC analysis, Pat tern Rec ognition Letters 27 (2006 ) 861–874. [6] A.Y. Kim, C. Marzban, D.B. Perciv al, W. Stuetzle, Using lab eled data to ev aluate c han ge detectors in a m ultiv ariate streaming en vir on m en t, Signal Pro cessing 89 (200 9) 2529–253 6. [7] R . Ru binfeld, R. Serv edio, T esting m onotone high-dimensional d istr ibutions, in : Pro ceedings of the 37th Ann u al S ymp osiu m on Theory of Computing (STOC), 2005, pp . 147– 156. [8] G.J. Sz ´ ek ely , P oten tial and kinetic energy in statistics, in: Lecture Notes, Budap est In stitute of T ec hnology , T ec hnical Universit y , 1989. [9] G.J. Sz ´ ek ely , E-statistics: energy of statistical samples, T ec hnical Rep ort No. 03–05, Bo wling Green State Univ ersit y , Departmen t of Mathematics and Statistics, 200 0. [10] G.J. S z ´ ek ely , M.L. Rizzo, T esting for equal d istributions in high dim en sion, In terStat, 2004. 13 Figure Captions Figure 1. Flow chart sho wing the general structure of a c hange detector (left) and t w o ve rsions of detection algorit hms — targeted and un targeted (righ t) . Figure 2. Standard Gaussian densit y p 0 (dashed curv e) and Gaussian mixture PDF p 1 (solid), also with zero mean and unit v ariance. Figure 3. Dat a stream x i dra wn from a standard Gaussian densit y p 0 for indices i = 1 , . . . , 500 and from the Gaussian mixture p 1 of Fig. 2 f or i = 501 , . . . , 1000 (top); corresp onding score stream s i (middle); and corresp onding detection stream d lik T with C = 20 (b o t tom). The bla c k curv e in the middle plot is a smo oth of s i obtained b y lo cally w eigh ted regression [3]. The dashed line in t he bo t t o m plot indicates the natural break betw een fav o r ing p 0 or p 1 in a log lik eliho o d ratio test. Figure 4. R OC curv es for a tar geted detector based on d lik T (solid dark curv e), for an un targeted detector base d o n the Kolmogorov test statistic (solid gray curv e), and for the monk ey (da shed curv e). The dot ted curv e is the R OC curv e of an unrealizable pro cedure that uses a Kolmogoro v test statistic with a new set of independen t data for each recalculation of the statistic within the tolerance windo w. The size s of the curren t set C and of the tolerance windo w are tak en to b e 20. Figure 5. Grey lev el image o f size 10 0 × 100 sho wing uncorrelated standard Gaussian noise, to whic h has been added an in teresting ob ject (the p yramid in the middle, corrupted b y noise ). Figure 6. R OC curv es for targeted (solid line) and un targeted (gray curv e) detectors under the scenario that images con tain either just Gaussian noise or an in teresting ob ject in the presence of noise (Fig. 5 is an example of the latter case). The dashed curv e is for the monk ey de tector. Figure 7. As in Fig. 6, but now under the sce nario that some of the images ha v e an uninte resting ob ject (an in v erted p yramid). Figure 8. As in Fig. 7, but no w with a higher signal-to - noise ratio. 14 U ni v a r i a t e o r M ul t i v a r i a t e D a t a St r ea m D et ect i o n A l go r i t hm U ni v a r i a t e D et ect i o n St r ea m T hr es ho l di ng A l a r m N o n t a r g et ed 2 -s a m pl e Szek el y 2 -s a m pl e t -t es t 2 -s a m pl e Sm i r no v T a r g et ed C l a ss i fier T r a i ned o n L a b el ed D a t a Sco r e St r ea m U ni v a r i a t e C hang e D et ect o r Fig. 1. Flo w c hart sho wing th e general structur e of a c han ge detector (left) and tw o v ersions of detection algorithms — targeted and u n targeted (righ t). −4 −2 0 2 4 x 0.0 0.1 0.2 0.3 0.4 density functions Fig. 2. Standard Gaussian densit y p 0 (dashed curve) and Gaussian mixture PDF p 1 (solid), also with zero mean and unit v ariance. −3 −2 −1 0 1 2 3 data 0.0 0.1 0.2 0.3 0.4 0.5 0.6 score 0 250 500 750 1000 index −15 −10 −5 0 5 detection Fig. 3. Data stream x i dra wn from a standard Gaussian densit y p 0 for indices i = 1 , . . . , 500 an d from the Gauss ian mixture p 1 of Fig . 2 for i = 501 , . . . , 1000 (top); corresp onding score stream s i (middle); and corresp onding detection str eam d lik T with C = 20 (b ottom). The b lac k cu rv e in the middle p lot is a sm o oth of s i obtained by lo cally weig hted regression [3]. The d ashed line in the b otto m plot indicates the natural break b et w een fa v oring p 0 or p 1 in a log lik elihoo d ratio test. 0.0001 0.001 0.01 0.1 1 f alse alar m rate 0 0.2 0.4 0.6 0.8 1 hit rate Fig. 4. R OC curv es for a targete d detec tor based on d lik T (solid dark curv e), for an unt argeted detector based on the Kolmogoro v test statistic (solid gra y curv e), and for the monk ey (dashed curv e). The dotted curve is the R OC curve o f an unrealizable pro cedur e that uses a Kolmogoro v test statistic with a new s et of ind ep endent data for eac h recalculat ion of the statistic within the tolerance w in do w. The sizes of th e current set C and of the tolerance window are tak en to b e 20. Fig. 5. Grey lev el image of size 100 × 1 00 sho win g uncorrelated standard Gauss ian noise, to wh ic h has b een added an in teresting ob ject (the pyramid in the middle, corrupted by noise). 0.0001 0.001 0.01 0.1 1 f alse alar m rate 0 0.2 0.4 0.6 0.8 1 hit rate Fig. 6. R O C curv es for targeted (solid lin e) and u n targeted (gray curv e) detectors under the scenario that images con tain either just Gaussian noise or an in teresting ob ject in the p resence of noise (Fig. 5 is an example of the latter case). The dashed curv e is for the monk ey d etector. 0.0001 0.001 0.01 0.1 1 f alse alar m rate 0 0.2 0.4 0.6 0.8 1 hit rate Fig. 7 . As in Fig. 6, bu t no w under the scenario that some of the image s ha ve an uninte r esting ob ject (an in v erted p yr amid ). 0.0001 0.001 0.01 0.1 1 f alse alar m rate 0 0.2 0.4 0.6 0.8 1 hit rate Fig. 8. As in Fig. 7, bu t no w with a higher signal-t o-noise ratio.
Original Paper
Loading high-quality paper...
Comments & Academic Discussion
Loading comments...
Leave a Comment