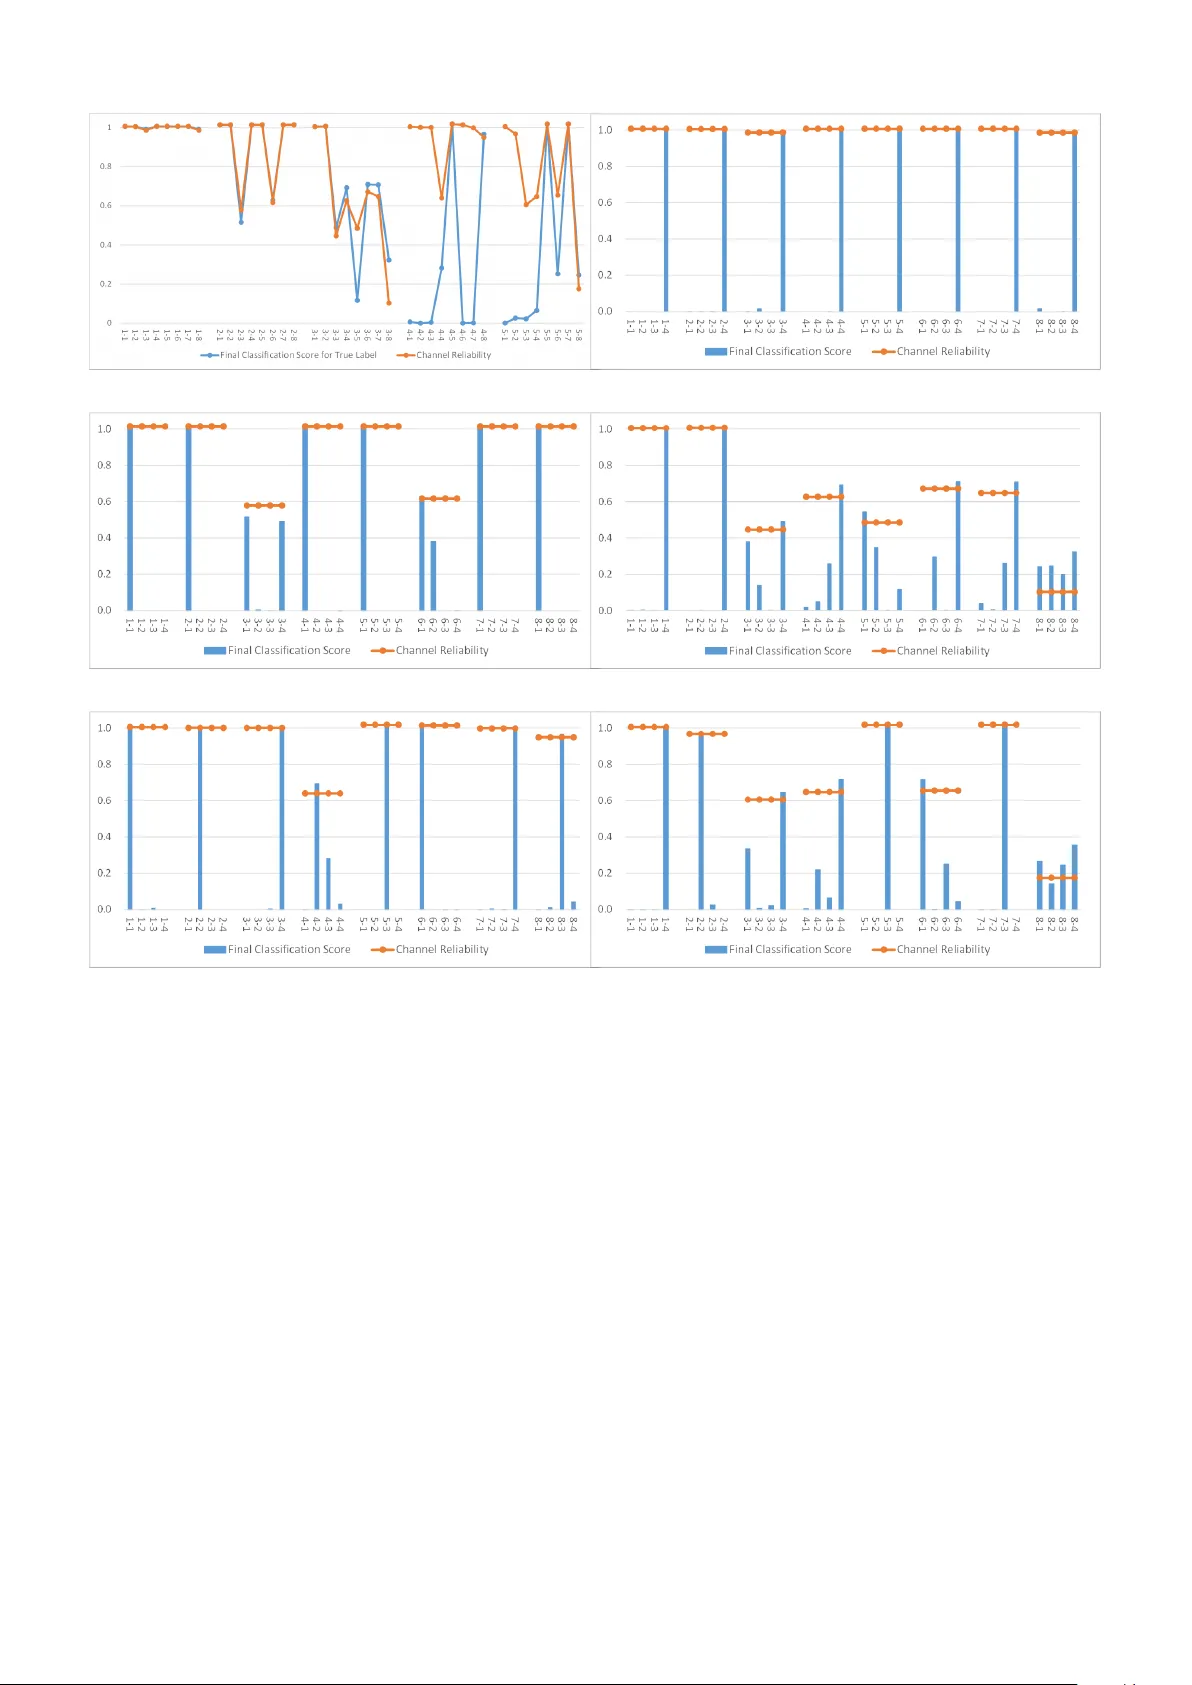
Multimodal Affective States Recognition Based on Multiscale CNNs and Biologically Inspired Decision Fusion Model
There has been an encouraging progress in the affective states recognition models based on the single-modality signals as electroencephalogram (EEG) signals or peripheral physiological signals in recent years. However, multimodal physiological signal…
Authors: Yuxuan Zhao, Xinyan Cao, Jinlong Lin
Multimo dal Affectiv e States Recognition Based on Multiscale CNNs and Biologically Inspired Decision F usion Mo del Y uxuan Zhao 1 , 2 , Xin yan Cao 1 , Jinlong Lin 1 , Dunshan Y u 1 , Xixin Cao 1 ? 1 Sc ho ol of Soft ware and Microelectronics, Peking Univ ersity . 2 Institute of Automation, Chinese Academ y of Sciences. T o whom corresp ondence should b e addressed; E-mail: cxx@ss.pku.edu.cn. Abstract There has b een an encouraging progress in the affective states recognition models based on the single- mo dalit y signals as electroencephalogram (EEG) signals or p eripheral ph ysiological signals in recent years. Ho wev er, multimodal physiological signals-based affective states recognition metho ds hav e not b een thor- oughly exploited y et. Here we prop ose Multiscale Con volutional Neural Netw orks (Multiscale CNNs) and a biologically inspired decision fusion mo del for m ultimo dal affective states recognition. Firstly , the raw signals are pre-pro cessed with baseline signals. Then, the High Scale CNN and Low Scale CNN in Multiscale CNNs are utilized to predict the probability of affective states output for EEG and each p eripheral physiological signal respectively . Finally , the fusion mo del calculates the reliability of eac h single-mo dalit y signals by the Euclidean distance b etw een v arious class lab els and the classification probabilit y from Multiscale CNNs, and the decision is made by the more reliable mo dalit y information while other mo dalities information is retained. W e use this mo del to classify four affective states from the arousal v alence plane in the DEAP and AMIGOS dataset. The results show that the fusion mo del improv es the accuracy of affective states recognition significantly compared with the result on single-mo dalit y signals, and the recognition accuracy of the fusion result achiev e 98.52% and 99.89% in the DEAP and AMIGOS dataset resp ectiv ely . 1 In tro duction Affectiv e states recognition pla ys a crucial role in human-mac hine interaction and health care. The recognition metho d based on physiological signals has become a researc h hotsp ot b ecause the signals could represen t the affectiv e states and cannot b e controlled sub jectiv ely compared with other signals such as facial expressions [1], gesture or sp eec h. The physiological signals are comp osed of electro encephalogram (EEG) signals and p eriph- eral ph ysiological signals, and the p eripheral ph ysiological signals include electro cardiogram (ECG) signals, electrom yogram (EMG) signals, galv anic skin resistance (GSR) signals, etc. Most of the studies of affectiv e states recognition based on ph ysiological signals only fo cus on either EEG signals or peripheral physiological signals, and they ignore the correlation b et ween these tw o signals. T o solve this problem and further improv e the accuracy , some researc hers in tegrate the EEG signals and p eripheral physiological signals to predict affectiv e states. The research on affective states recognition from multimodal ph ysiological signals can be categorized in to feature level fusion [2–5], intermediate level fusion [6, 7], and decision level fusion [8 – 10]. Although these studies hav e b een achiev ed, there still exist some challenging problems. Firstly , few studies hav e fo cused on the decision level fusion, and most of the decision level fusion metho ds are the voting methods. Secondly , other studies [3 – 15] ha ve failed to ac hieve a high recognition accuracy whic h is not enough for implemen ting real-w orld applications. T o address these issues, in this pap er, we prop ose a Multiscale Conv olutional Neural Net works (Multiscale CNNs) and a biologically inspired decision fusion mo del for affectiv e states recognition based on multimodal ph ysiological signals. The High Scale CNN and Low Scale CNN in the Multiscale CNNs are utilized to EEG- and p eripheral physiological-based affective states recognition resp ectiv ely . The main con tributions of the prop osed w ork are summarized as follows: (1) The proposed Multiscale CNNs could predict affective states effectiv ely from v arious ph ysiological signals. 1 (2) The prop osed w ork introduces a simple and effectiv e decision level fusion metho d which improv es the accuracy of affectiv e states recognition significantly compared with the result on single-mo dalit y signals. (3) The prop osed fusion model is inspired by the multisensory integration studies from neuroscience and psyc hophysiology , and the decision is made b y the more reliable modality information while other mo dali- ties information is retained. Therefore, it is more effective than other decision level fusion methods such as nondiscriminatory pluralit y voting, and it could b e applied to other m ultimo dal recognition tasks. The remainder of this pap er is organized as follows: Section 2 provides a review of researc h ab out the m ultimo dal information fusion techn iques used in multimodal physiological signals-based affective states recog- nition tasks and the multisensory integration studies in neuroscience and psychoph ysiology . Section 3 describ es the metho d of data pre-pro cessing, the multiscale conv olutional neural netw orks, and the biologically inspired decision fusion mo del. Section 4 presents the description of the DEAP and AMIGOS dataset which are used in the exp erimen t, the fusion p erformance analysis of the biologically inspired decision fusion mo del, and the comparison with existing mo dels. In Section 5, w e conclude our work. 2 Related w orks 2.1 Multimo dal information fusion tec hniques Multimo dal information fusion tec hniques are used to improv e the p erformance of the system b y integrating differen t information at the feature level, intermediate level and decision level [16, 17]. The feature level fusion techniques are widely used in multimodal affective states recognition tasks [2 – 5, 11]. V erma et al. [2] prop osed a multimodal fusion approac h at the feature lev el, they extracted 25 features from EEG and p eripheral signals by Discrete W av elet T ransform, then used the Supp ort V ector Machine (SVM) classifier for thirteen affectiv e states classification. Kwon et al. [3] prop osed a preprocessing method of EEG signals in which they used a w av elet transform while considering time and frequency simultaneously , then extracted the EEG feature con volution neural netw orks (CNN) mo del and combined them with the features extracted from galv anic skin response (GSR) signals for affective states recognition. Hassan et al. [4] applied unsup ervised deep b elief netw ork (DBN) for depth level feature extraction from partial p eripheral signals and com bined them in a feature fusion vector, then used the Fine Gaussian Supp ort V ector Mac hine (FGSVM) to classification. Zhou et al. [5] used conv olutional auto-enco der (CAE) to obtain the fusion features of v arious signals, then used a fully connected neural netw ork classifier for affective states recognition. Ma et al. [11] prop osed a multimodal residual LSTM (MM-ResLSTM) netw ork for affective states recognition. This netw ork could learn the correlation b etw een the EEG and other ph ysiological signals by sharing the weigh ts across the mo dalities in each LSTM lay er. The intermediate level fusion [6, 7] can cop e with the imp erfect data reliably [17]. Shu et al. [6] prop osed a fusion metho d to mo del the high-order dep endencies among m ultiple physiological signals b y Restricted Boltzmann Machine (RBM). The new feature representation is generated from the features of EEG signals and p eripheral physiological signals by RBM. Then they used the Supp ort V ector Mac hine (SVM) classifier for affectiv e states recognition. Yin et al. [7] prop osed a multiple-fusion-la yer based ensemble classifier of stack ed auto-enco der (MESAE) for affective states recognition. They extracted 425 salien t ph ysiological features from EEG signals and p eripheral physiological signals. The features are split into non-ov erlapp ed physiological feature subsets, then got the abstraction fusion features b y the SAE, and used the Bay esian mo del to classification. Compared with the feature level fusion and intermediate level, the research on decision level fusion [8 – 10] is less and simpler. Bagherzadeh et al. [8] extracted sp ectral and time features from p eripheral and EEG signals, and non-linear features from EEG signals, then used m ultiple stack ed auto encoders in a parallel form (PSAE) to primary classification, the final decision ab out classification w as p erformed using the ma jorit y voting metho d. Huang et al. [9] prop osed an Ensemble Conv olutional Neural Netw ork (ECNN) which could automatically mine the correlation betw een v arious signals, then used the plurality v oting strategy for affectiv e states recognition. Li et al. [10] used an Atten tion-based Bidirectional Long Short-T erm Memory Recurrent Neural Net works (LSTM- 2 Figure 1: Bay es-optimal combination of multiple sensory cues [18, 23]. RNNs) to automatically learn the b est temp oral features, then used a deep neural netw ork (DNN) to predict the probability of affective states output for each mo dalit y , finally fused these result on decision level to get the result. Compared with the feature lev el fusion and intermediate level, the dec ision lev el fusion is more easily b ecause the decisions resulting from multiple modalities usually hav e the same form of data and every mo dalit y can utilize its b est suitable classifier or mo del to learn its features [16]. 2.2 Ba y es-optimal cue in tegration mo del The multisensory in tegration has b een widely studied in neuroscience and psychoph ysiology [18]. A Ba yes- optimal cue integration mo del has b een prop osed and has prov ed to b e successful in visual and haptic informa- tion integration [19], visual and proprio ceptiv e information integration [20], visual and v estibular information in tegration [21, 22], visual and auditory information in tegration [23, 24], stereo and texture or texture and motion information in tegration in vision research [25, 26]. The cue is a terminology for neuroscience. And this terminol- ogy is defined as ”Any signal or piece of information b earing on the state of some prop ert y of the environmen t. Examples include bino cular disparity in the visual system, interaural time or level differences in audition and proprio ceptiv e signals (for example, from muscle spindles) con v eying the p osition of the arm in space [18].” This mo del estimates the result by weigh ting the cues in prop ortion to their relative reliability which is prop ortional to the inv erse v ariance. T ake a spatial lo calization estimate by visual and auditory information integration as an example as sho wn in Fig.1, this mo del could b e describ ed as follows: The direction of an ev ent is s, the estimated spatial location b y visual ( x v ) and auditory ( x a ) will inconsisten t with the true location b ecause of the noise in transmission and pro cessing. According to Bay es’ theorem and the conditionally indep enden t sources of visual and auditory , is can b e describ ed as Equation 1. p ( s | x v , x a ) ∝ p ( x v | s ) ∗ p ( x a | s ) ∗ p ( s ) (1) If assumes that the p(s) is uniform prior distribution and the additional simplifying assumption of Gaussian lik eliho o d function, the av erage estimate derived from an optimal Bay esian integrator is a weigh ted av erage of the a verage estimates that would b e derived from each cue alone, it could b e describ ed as Equation 2. s ∗ = ω v × x v + ω a × x a (2) where ω v = 1 /σ 2 v 1 /σ 2 v + 1 /σ 2 a and ω a = 1 /σ 2 a 1 /σ 2 v + 1 /σ 2 a (3) The sigma in Equation 3 is the parameter of the fitted Gaussian distribution function, and the inv erse of sigma squared means the cue’s reliability . In the field of neuroscience, the terminology reliabilit y can b e used as a synonym for the precision of a measurement, which is defined mathematically as its inv erse v ariance [18]. The greater a cue’s reliabilit y , the more it contributes to the final estimate. 3 Figure 2: The framework of our mo del. 3 Metho ds Here we prop ose a Multiscale Conv olutional Neural Netw orks (Multiscale CNNs) for affective states recognition based on v arious physiological signals, and a biologically inspired decision fusion mo del that could integrate the result from Multiscale CNNs for multimodal affectiv e states recognition. The details of the mo del are sho wn in Fig.2. 3.1 Pre-pro cessing A pre-pro cessing method with baseline signals - the signals are recorded when the participant under no stim ulus - which is first elab orated by Y ang [27] is an effective w ay to improv e recognition accuracy . They rep orted that the pre-pro cessing metho d could increase recognition accuracy by 32% approximately in the affectiv e states recognition task. The pre-pro cessing metho d contains: extracting the baseline signals from all channels C and cut it in N segmen ts with fixed length L, getting N segments C x L matrixes; calculating the mean v alue of the baseline signals with segmented data, getting the baseline signals mean v alue M, a C x L matrixes; cutting the EEG and Physiological signals which without baseline signals with length L and minus the baseline signals mean v alue M, getting the prepro cessed signals. The raw EEG signals in the dataset lost the top ological p osition information of the electro des. T o solve this problem, the electro des used in the dataset are relo cated to the 2D e lectrode top ological structure based on the 10-20 system p ositioning. F or each time sample p oin t, the EEG signals are mapp ed into a 9x9 matrixes. The un used electro des are filled with zero. Z-score normalization is used in each transformation. 3.2 Multiscale Conv olutional Neural Net w orks The details of the High Scale CNN and the Low Scale CNN in the Multiscale CNNs are shown in T able 1. The High Scale CNN whic h w e prop osed in [28] is used for EEG-based affectiv e states recog nition. The arc hitecture of the High Scale CNN con tains tw o conv olution lay ers. Each of them is follow ed by a max-p ooling la yer, and a fully-connected lay er. The input size is 128x9x9, the 9x9 is the 2D electro de top ological structure and the 128 is the num b er of the consecutive time sample p oin t pro cessed at once. The kernel size of the con volution la yer is 4x3x3, which means the spatial-temp oral features are generated based on a lo cal top ology of 3x3 and a time p erio d of 4-time sample p oin ts. The RELU activ ation function is used after the conv olution op eration. The p ooling size of a max-p ooling la yer is 2x1x1 whic h is used to reduce the data size in the temporal dimension and improv e the robustness of extracted features. T o prev ent missing information of input data, the zero-padding is used in eac h conv olutional and p ooling lay ers. The n umbers of feature maps in the first and second conv olutional lay ers are 32 and 64 respectively . Before passing the 64 resulting feature maps to the 4 T able 1: The details of the multiscale con volutional neural netw ork mo del High Scale CNN Lo w Scale CNN La yer Type Output Size Kernel,Units, Stride Output Size Kernel,Units, Stride Input 128x9x9 \ 128x1 \ Con volutional 128x9x9 (4x3x3), 32, (1,1,1) 128x1 (3), 16, (1) P o oling 64x9x9 (2x1x1), (2,1,1) 128x1 (2), (1) Con volutional 64x9x9 (4x3x3), 64, (1,1,1) 128x1 (3), 32, (1) P o oling 32x9x9 (2x1x1), (2,1,1) 128x1 (2), (1) Flatten 165888 \ 4096 \ F ully Connected 1024 \ 256 \ Drop out 1024 \ 256 \ Softmax 4 \ 4 \ fully-connected la yer, the output feature maps are reshap ed in a vector. The fully-connected lay er maps the feature maps into a final feature vector of 1024. And a drop out regularization after fully connected lay ers used to a void ov erfitting. The output size is 4, which is equal to the num b er of lab els in the task. The Low Scale CNN is used for p eripheral physiological-based affective states recognition. The architecture of the Low Scale CNN con tains t wo conv olution lay ers. Eac h of them is follow ed by a max-p o oling lay er, and a fully-connected lay er. The input size is 128x1 whic h represen ts a 128 consecutiv e time sample point of p eripheral physiological signals in each mo dalit y . The kernel size of the con volution la yer is 3. The RELU activ ation function is used after the con volution op eration. The p ooling size of a max-p ooling la yer is 2 which is used to reduce the data size in the temp oral dimension and improv e the robustness of extracted features. T o prev ent missing information of input data, the zero-padding is used in each conv olutional and p o oling lay ers. The num b ers of feature maps in the first and second con volutional lay ers are 16 and 32 resp ectiv ely . Before passing the 32 resulting feature maps to the fully-connected lay er, the output feature maps are reshap ed in a vector. The fully-connected lay er maps the feature maps into a final feature vector of 256. And a drop out regularization after fully connected lay ers used to a void ov erfitting. The output size is 4, which is equal to the n umber of lab els in the task. 3.3 Biologically Inspired Decision F usion Mo del In the biological example of spatial lo calization estimate b y visual and auditory information in tegration, eac h cue ev aluates the p osition of the ob ject in a series of consecutive angles, and the resp onse of sensory neurons to stim uli such as visual cue and auditory cue ob ey the Gaussian distribution. But in the traditional classification mo del, there is no relationship b et ween differen t lab els, and the classification scores of different lab els do not obey the Gaussian distribution. Because the prop osed fusion mo del is inspired by the Bay es-optimal cue integration mo del, whic h has b een widely studied in neuroscience and psyc hophysiology , w e ensure the biological rationalit y of the prop osed fusion mo del in the following wa ys: (1) Build relationships b et ween v arious class lab els. In the research of affective states mo dels, Russell’s v alence-arousal scale [29] has b een widely used to quantitativ ely describ e affectiv e states. After watc hing a 5 video that could induce the participant’s affective states, the participant rated a self-assessmen t of arousal and v alence on a scale from 1 to 9. In the affective states recognition task [3 – 15], the researc hers often divided the dataset into v arious classes based on the threshold of arousal and v alence. So the class lab els could b e mapp ed in the t wo-dimensional space b y calculating the mean v alue of the corresponding class lab els on Arousal-V alence data. W e use the participants’ rating scores of arousal and v alence to represent the four class lab els. Then we build the relationships b et w een v arious class lab els with the Euclidean distance of these rating scores. (2) Calculate the classification score reliability b et ween lab el i and label j , as shown in Equation 4. The f ( d ij ) is the classification score reliability b etw een lab el i and lab el j . If the lab el is i , we take the Euclidean distance b et ween lab el i and other lab els as the v ariable to construct a standard normal distribution, and calculate the classification score reliability of each lab el when the lab el is i . F or example, the dataset is divided in to 4 classes based on the threshold of arousal and v alence: LAL V (e.g., sad), HAL V (e.g., stressed), LAHV (e.g., re laxed), HAHV (e.g., happy). W e can get a 4x4 classification score reliability matrix. If the current lab el is HAHV, according to the standard normal distribution, the classification score reliability is the highest when the classification probability is HAHV, and the low est when the classification probability is LAL V b ecause the distance b et w een lab el HAHV and lab el LAL V is the farthest. f ( d ij ) = 1 √ 2 π e − d 2 ij 2 (4) (3) In each mo dality , the final classification score of eac h lab el is calculated based on the classification probabilit y from the CNN mo del and classification score reliability , as sho wn in Equation 5. The GauP R m,j is the final classification score of lab el j in mo dalit y m , the N L is the num b er of lab els, and the P R m,j represen ts the classification probability of lab el j in mo dalit y m . T ake the final classification score of lab el HAHV as an example. The final classification score of HAHV is the sum of the pro duct of classification probability of HAHV that output by the CNN mo del and the classification score reliability that b et ween lab el HAHV and lab el LAL V, HAL V, LAHV and HAHV. GauP R m,j = N L X i =1 P R m,j × f ( d ij ) (5) Considering the difference b etw een the biological system and the mac hine systems, here w e use the disp ersion of final classification score to represent the corresp onding mo dalit y reliability . The disp ersion calculated b y the standard deviation as shown in Equation 6, the S m represen ts the mo dalit y reliability of mo dalit y m . The more a verage the final classification scores are, the smaller of the disp ersion is, the low er the corresp onding mo dality reliabilit y is. If one of the final classification scores in a mo dality is high, the corresp onding mo dalit y reliabilit y is high b ecause of the greater disp ersion. S m = v u u t 1 N L − 1 N L X j =1 ( GauP R m,j − GauP R m ) 2 (6) where GauP R m = 1 N L N L X j =1 GauP R m,j (7) Then w e calculate the fusion result of lab el j as sho wn in Equation 8. The N M represents the num b er of the mo dalities. Then we use ar g max to select the final result. The argmax is a function that returns the v alue of v ariable j when F j reac hes the maximum v alue. F or example, F j reac hes the maximum v alue when the lab el j is HAHV, and the v alue of v ariable j returned b y argmax is HAHV, that is, Rlab el = HAHV. F j = N M X m =1 GauP R c,j × S m (8) 6 T able 2: Classification accuracies with different length time windo ws Length (s) 0.5 1 2 3 Accuracy (%) 83.36 93.53 90.51 90.67 R label = arg max j ( F j ) (9) 4 Result W e test this metho d in public database DEAP [30] and AMIGOS [31]. The prop osed mo del is implemented b y using the T ensorflow framew ork [32] and deploy ed on NVIDIA T esla K40c. The learning rate is set to 1E-3 with Adam Optimizer, and the keep probability of drop out op eration is 0.5. The batch size for training and testing is set to 240. W e use 10-fold cross-v alidation to ev aluate the p erformance of our mo del. The av erage accuracy of the 10-fold v alidation pro cesses is taken as the final result. 4.1 Datasets and Pre-pro cessing The DEAP [30] is an op en dataset for researchers to v alidate their mo del. This dataset contains 32 channels EEG signals and 8 c hannels p eripheral physiological signals whic h are collected when 32 participants watc hed 40 videos each with one- minute duration. The EEG channels con tain Fp1, AF3, F3, F7, F C5, FC1, C3, T7, CP5, CP1, P3, P7, PO3, O1, Oz, Pz, Fp2, AF4, Fz, F4, F8, FC6, FC2, Cz, C4, T8, CP6, CP2, P4, P8, PO4 and O2. The p eripheral physiological channels contain hEOG, vEOG, zEMG, tEMG, GSR, Respiration b elt (RB), Pleth ysmograph (Plethy), and skin temp erature (T emp). Each trial contains 63s signals and the first 3s are the baseline signals. The baseline signals are recorded when the participants were under no stimulus. After w atching a minute video, the participants rated a self-assessment of arousal, v alence, liking, and dominance on a scale from 1 to 9. A prepro cessed version had b een pro vided: The data was down-sampled from 512Hz to 128Hz, and a bandpass frequency filter from 4.0-45.0Hz was applied. In the pro cess of data pre-pro cessing for one trial signals (a 40x8064 matrix, the row of the matrix con tains 32 channels EEG signals and 8 channels p eripheral ph ysiological signals, and the column of the matrix con tains 3s baseline and 60s stim ulation signals with 128Hz) in DEAP dataset, the baseline signals (a 40x384 matrix) ha ve b een cut into 3 segments (each segment is a 40x128 matrix), and the mean v alue (a 40x128 matrix) of the baseline signals are calculated. And the data without baseline signals are cut in to 60 segmen ts (each segment is a 40x128 matrix) then minus the baseline signals mean v alue to get the prepro cessed signals (a 40x7680 matrix, and the column of the matrix con tains 60s signals with 128Hz). F or each time sampling p oin t, the 32 channels EEG signals are mapp ed into a 9x9 matrix (as shown in Fig.3), getting the 2D electro de top ological structure (a 9x9x7680 matrix) with Z-score normalization. Finally , the signals are cut in to 60 segments with 1s length (eac h segment is a 9x9x128 m atrix), and the 1s length w as rep orted as the most suitable time window length in [33]. In addition, we compare the High Scale CNN’s p erformance with four different length time windows of 0.5s, 1s, 2s, 3s, and the result is shown in T able 2. It is easy to see, the High Scale CNN mo del achiev es the highest accuracy with the 1s length time windows. So we set the length of the segment to 1 second based on the mo del’s performance. The final data size of EEG signals after pro cessing is 76800 instances (the 76800 is calculated by 32 participan ts × 40 trails × 60s), and the dimension of eac h instance is 9x9x128. The 8 channels p eripheral physiological signals are cut into 60 segments with 1s length in each mo dalit y , and the final data size of p eripheral physiological signals in eac h mo dality after pro cessing is 76800 instances, and the dimension of eac h instance is 128x1. In the DEAP dataset, the prepro cessed data is randomly partitioned into 10 equal-size subsamples, and each subsample contains 7680 instances. So, there are 69120 instances in the training set, and 7680 instances in the test set in each fold of v alidation pro cesses. The AMIGOS [31] is a new op en dataset. This dataset contains 14 c hannels EEG signals and 3 channels 7 (a) 10-20 System (b) 2D Electro de T op ological Structure Figure 3: (a) The international 10-20 system describ es the lo cation of scalp electro des, and the red no des show the 32 electro des used in DEAP dataset. (b) The 32 channels EEG signals are mapp ed into a 9x9 matrixes. (a) 10-20 System (b) 2D Electro de T op ological Structure Figure 4: (a) The international 10-20 system describ es the lo cation of scalp electro des, and the red no des show the 14 electro des used in AMIGOS dataset. (b) The 14 channels EEG signals are m apped into a 9x9 matrixes. p eripheral physiological signals which are collected when 40 participants watc hed 20 videos (16 short videos + 4 long videos). The EEG c hannels contain AF3, F7, F3, FC5, T7, P7, O1, O2, P8, T8, FC6, F4, F8, and AF4. The p eripheral ph ysiological c hannels con tain ECG Right, ECG Left, and GSR. Each trial contains 5s baseline signals in first and the signals depend on the duration of the video. The baseline signals are recorded when the participants were under no stimulus. After watc hing the video, the participants rated a self-assessment of arousal, v alence, liking, and dominance on a scale from 1 to 9. A prepro cessed version had b een provided: The data w as down-sampled to 128Hz, and a bandpass frequency filter from 4.0-45.0Hz was applied. Here we use the signals which w ere recorded in short videos exp eriment. The participan t ID of 9, 12, 21, 22, 23, 24 and 33 has b een remov ed b ecause there are some inv alid data in the prepro cessed version. The data pre-pro cessing in the AMIGOS dataset is the same as in the DEAP dataset, and the signals also are segm en ted with 1s length. The 14 channels EEG signals are mapp ed into a 9x9 matrix (as sho wn in Fig.4). The final data size of EEG signals after pro cessing is 45474 9x9x128 matrices. The 3 channels p eripheral physiological signals cut into 60 segments with 1s length in eac h mo dalit y , and the final data size of p eripheral physiological signals in eac h mo dalit y after pro cessing is 45474 128x1 matrices. In the AMIGOS dataset, the prepro cessed data is randomly partitioned into 10 subsamples. One of the subsamples contains 4434 instances, and each of the remaining nine subsamples con tains 4560 instances. So, there are 40914 instances in the training set and 4560 instances in the test set for the first nine rounds of v alidation pro cesses, and there are 41040 instances in the training set and 4434 instances in the test set for the last round of v alidation pro cess. Both datasets could b e segmen ted in four classes: low arousal low v alence (LAL V), high arousal low v alence (HAL V), lo w arousal high v alence (LAHV), high arousal high v alence (HAHV) based on the arousal and v alence v alue with the threshold of 5 resp ectiv ely , and the corresp onding instance num b ers are shown in Figure 5. Fig.6 and Fig.7 show the distribution of affective states categories in DEAP and AMIGOS datasets resp ec- tiv ely . The red p oin ts are calculated by the mean v alue of the corresp onding category lab els on Arousal-V alence 8 Figure 5: Corresp onding instance n umbers in DEAP and AMIGOS Datasets. Figure 6: Distribution of affective states categories in DEAP , and the red p oin ts are the mean v alue of the corresp onding lab els on Arousal-V alence data, such as LAL V (2.95, 3.51), HAL V (6.64, 3.07), LAHV (3.44, 6.42), HAHV (6.58, 7.11). data. It could represent the categories in tw o-dimensional space such as the LAL V (2.95, 3.51), HAL V (6.64, 3.07), LAHV (3.44, 6.42), HAHV (6.58, 7.11) in DEAP dataset, and LAL V (3.86, 3.52), HAL V (6.69, 2.95), LAHV (3.35, 7.18), HAHV (6.42, 7.17) in AMIGOS dataset. Then we calculate the Euclidean distance b etw een v arious category lab els and using the standard normal distribution to calculate the classification score reliabil- it y . In eac h mo dalit y , we calculate the final classification score through classification score from C NN mo del and classification score reliability , and use the standard deviation of final classification score to represent the corresp onding mo dalit y reliability , then calculate the result of multimodal information integration. 4.2 F usion Result W e use 2 tasks to v erify the fusion p erformance of the biologically inspired decision fusion model: the comparison of single-mo dality results with the primary fusion results (T ask 1) and the comparison of primary fusion results with the final fusion result (T ask 2) as shown in Fig.8. The primary fusion results are the fusion results of EEG signals and p eripheral physiological signals resp ectiv ely , and the final fusion result is the result that combines all the EEG signals and p eripheral physiological signals. In addition, to verify the multimodal fusion mo del of EEG signals, the signals are decomp osed in to four parts according to the four frequency bands of theta (4-7 Hz), alpha (8-13 Hz), b eta (14-30 Hz) and gamma (31-45 Hz). Besides, considering that voting metho ds are widely used in other decision fusion studies [8, 9], here we compare the p erformance of the pluralit y voting metho d and the biologically inspired decision fusion mo del on the p eripheral physiological signals in DEAP dataset (T ask 3). T able 3 shows the mean accuracy rate and the standard deviations of 10 folds cross-v alidation of each single- mo dalit y and the incremen t in primary fusion result (T ask 1). It is easy to see, there is a significant increase 9 Figure 7: Distribution of affective states categories in AMIGOS, and the red p oin ts are the mean v alue of the corresp onding lab els on Arousal-V alence data, such as as LAL V (3.86, 3.52), HAL V (6.69, 2.95), LAHV (3.35, 7.18), HAHV (6.42, 7.17). Figure 8: Two tasks in the fusion p erformance analysis. in the accuracy rate in the primary fusion result compared with the single-modality results. In the DEAP dataset, compared with the result in single-mo dalit y , the fusion mo del improv es the accuracy by 6-22% in EEG signals, and 10-45% in p eripheral physiological signals. In the AMIGOS dataset, the fusion mo del improv es the accuracy by 4-15% in EEG signals, and 0.03-15% in p eripheral physiological signals. And in ECG signals, the impro vemen t of accuracy is not significant due to the high recognition accuracy in single-mo dalit y . T able 4 shows the comparison of primary fusion results with the final fusion result (T ask 2). It is easy to see, the accuracy rate will rise further with the fusion b etw een EEG signals and p eripheral physiological signals. W e also use the original EEG signals to verify the metho d’s p erformance in the final fusion. Compared with the primary fusion results of EEG signals and the original EEG signals, the final fusion result shows a 3-8% impro vemen t in DEAP and AMIGOS datasets. Compared with the primary fusion results of p eripheral ph ysiological signals, the improv ement of accuracy in final fusion result is not significant. The comparison of single-mo dalit y with primary fusion res ults and the final fusion result could b e found in s upplemen tal material T able S1 and T able S2. W e calculate the precision, sensitivit y , sp ecificit y and f-measure b y the Equation 10 - 13, where TP , TN, FP , and FN refer resp ectiv ely to “T rue Positiv es”, “T rue Negatives”, “F alse P ositives” and “F alse Negativ es” resp ectiv ely . And the result of Final F usion ## whic h represen ts the final fusion result of p eripheral ph ysiological signals and original EEG signal in DEAP and AMIGOS dataset is shown in T able 5. It can b e seen that the prop osed mo del mak es a go o d p erformance in p er v alence-arousal quadrant. The p erformance metrics for single-mo dalit y could b e found in supplemental material T able S3 - S6. P r ecision = T P T P + F P (10) S ensitiv ity = T P T P + F N (11) 10 T able 3: Accuracy improv ement in primary fusion result of EEG signals and p eripheral ph ysiological signals compared with the single-mo dalit y result (T ask 1) Mo dalit y Single-mo dalit y Result (%) Impro vemen t in F usion Result (%) EEG Signals (DEAP) Alpha 89.01 ± 0.22 6.76 Beta 89.69 ± 1.01 6.08 Gamma 73.09 ± 1.12 22.68 Theta 81.97 ± 0.27 13.80 Primary F usion * 95.77 ± 0.4 P eripheral Ph ysiological Signals (DEAP) hEOG 72.57 ± 1.28 24.70 vEOG 86.45 ± 0.81 10.82 zEMG 73.66 ± 0.61 23.61 tEMG 83.74 ± 1.53 13.53 GSR 74.60 ± 0.35 22.67 Respiration b elt 66.33 ± 2.48 30.94 Pleth ysmograph 72.94 ± 2.23 24.33 T emp erature 51.43 ± 0.46 45.84 Primary F usion ** 97.27 ± 0.27 EEG Signals (AMIGOS) Alpha 79.54 ± 0.91 11.53 Beta 86.80 ± 0.16 4.27 Gamma 85.39 ± 0.21 5.68 Theta 75.88 ± 0.24 15.19 Primary F usion * 91.07 ± 0.66 P eripheral Ph ysiological Signals (AMIGOS) ECG Righ t 99.71 ± 0.08 0.03 ECG Left 99.30 ± 0.17 0.44 GSR 84.69 ± 1.18 15.05 Primary F usion ** 99.74 ± 0.12 * The fusion result of four frequency bands EEG signals ** The fusion result of 8 multimodal p eripheral physiological signals 11 T able 4: Accuracy impro vemen t in final fusion result compared with the primary fusion result (T ask 2) Mo dalit y Result Impro vemen t in Final F usion Final F usion Final F usion ## DEAP EEG # 93.53 ± 0.36 5.64 4.99 Primary F usion EEG 95.77 ± 0.4 3.4 2.75 Primary F usion Peripheral 97.27 ± 0.27 1.9 1.25 Final F usion 99.17 ± 0.03 Final F usion ## 98.52 ± 0.09 AMIGOS EEG # 95.86 ± 0.34 3.18 4.03 Primary F usion EEG 91.07 ± 0.66 7.97 8.82 Primary F usion Peripheral 99.74 ± 0.12 -0.7 0.15 Final F usion 99.04 ± 0.09 Final F usion ## 99.89 ± 0.05 # The result in original EEG signals ## The final fusion result of p eripheral physiological signals and original EEG signals S pecif icity = T N T N + F P (12) F 1 = 2 ∗ P r ecision ∗ S ensitiv ity P r ecision + S ensitiv ity (13) W e use lo c k b o x approach [34] to determine whether o verh yping has o ccurred in the Multiscale CNNs mo dels. The lo c k b o x approach is a new technique that could b e used to determine whether ov erhyping has o ccurred. The data is first divided into a h yp erparameter optimization set and a lo c k b ox. And the lo c k b o x only b e accessed just one time to generate an unbiased estimate of the mo del’s p erformance. In the DEAP and AMIGOS datasets, 90% of the data are set aside in hyperparameter optimization set and the remaining 10% of the data set aside in a lo ck b o x. With the 10-fold cross-v alidation approach, the hyperparameters in Multiscale CNNs mo dels can b e iteratively mo dified on the h yp erparameter optimization set. When the av erage accuracy in the mo del is go od enough, the mo del b e tested on the lo c k b o x data. Compared with the training result on the h yp erparameter optimization set, the testing result on the lo c k b o x data did not decrease significan tly . It can pro ve that the ov erhyping has not o ccurred in the Multiscale CNNs. The result is sho wn in T able 6. 4.3 F usion Performance Analysis There are 8 mo dalities p eripheral ph ysiological signals in the DEAP dataset which could b e used to verify the p erformance of the fusion mo del. The comparison of the plurality voting metho d with the biologically inspired decision fusion mo del (T ask 3) is shown in Fig.9 and T able 7. The plurality voting metho d tak es the class lab el whic h receives the largest num b er of votes as the final result. In Fig.9, the red and blue dots resp en t the results based on biologically inspired decision fusion mo del and plurality v oting metho d resp ectiv ely . There are 247 results in different combinations of v arious mo dalities in each metho d. The red ♦ and the blue ∗ represen t the av erage accuracy for different num b ers of mo dalities in eac h metho d. It is easy to see, the accuracy rate can b e impro ved more effectiv ely by the biologically inspired decision fusion model than by using pluralit y v oting, esp ecially when the num b er of mo dalities is small. Compared with the nondiscriminatory pluralit y v oting metho d, the biologically inspired decision fusion mo del considers the correlation b et ween v arious class 12 T able 5: P erformance metrics for Final F usion ## in DEAP and AMIGOS dataset Lab el Precision Sensitivit y Sp ecificit y F1 DEAP Dataset LAL V 99.44 97.93 99.85 98.68 HAL V 99.10 98.23 99.73 98.66 LAHV 99.49 97.36 99.87 98.41 HAHV 97.02 99.77 98.39 98.38 Mean 98.76 98.32 99.46 98.53 AMIGOS Dataset LAL V 99.91 99.83 99.97 99.87 HAL V 99.68 99.84 99.88 99.76 LAHV 99.91 99.78 99.97 99.84 HAHV 99.81 99.86 99.94 99.84 Mean 99.83 99.83 99.94 99.83 Figure 9: The comparison of the plurality voting metho d with the biologically inspired decision fusion mo del (T ask 3). The red ♦ and the blue ∗ represent the av erage accuracy for different num b ers of modalities in the biologically inspired decision fusion mo del and plurality voting metho d resp ectiv ely . lab els. Then the reliability of each single-mo dalit y signal is calculated by this correlation and the classification probabilit y from physiological signals. Finally , the decision is made by the more reliable mo dalit y information while it retains other mo dalities information. The b est mo dality combination in differen t modality num b ers could be found in supplemen tal material T able S7. And w e use a sample of p eripheral physiological signals fusion in the DEAP dataset to show the details of how to calculate the d ij , f ( d ij ), GauP R m,j , S m , and F j in the supplemen tal material. T able 7 shows the maxim um, minimum, mean v alues and the standard deviation of fusion results with differen t mo dalit y n umbers in the biologically inspired decision fusion mo del and pluralit y voting metho d re- sp ectiv ely . With the increase of the mo dalit y n umbers, the accuracy of the proposed fusion mo del increases and ac hieves the highest accuracy when the mo dalit y num b er is 8, and the accuracy of the plurality voting metho d achiev es the highest accuracy when the mo dalit y num b er is 7. Compared with the plurality voting metho d, the prop osed fusion mo del can improv e the minimu m accuracy more effectively - ab out 4% increment in different mo dalit y n umbers. In other words, the prop osed fusion mo del can effectively utilize mo dalities with p oor classification p erformance. F or example, without the vEOG and tEMG which achiev e the high accuracies in single-mo dalit y result, the prop osed fusion model achiev es the accuracy of 92.29%. Without the vEOG whic h ac hieves the highest accuracies in single-mo dalit y result, the prop osed fusion mo del achiev es the accuracy of 13 T able 6: The result of lo c k b o x approach. The training result on the hyperparameter optimization set and the testing result on the lo c k b o x set. Mo dalit y T rain (%) T est (%) EEG Signals (DEAP) Alpha 89.70 89.18 Beta 89.92 90.41 Gamma 73.94 73.83 Theta 81.15 81.03 EEG# 93.82 93.96 P eripheral Physiological Signals (DEAP) hEOG 73.26 73.03 vEOG 85.92 85.73 zEMG 73.50 72.54 tEMG 84.87 84.27 GSR 73.15 71.39 Respiration b elt 69.23 68.45 Pleth ysmograph 74.03 74.08 T emp erature 51.98 52.04 EEG Signals (AMIGOS) Alpha 81.21 81.46 Beta 87.32 87.62 Gamma 85.64 84.79 Theta 77.35 76.87 EEG# 96.50 96.14 P eripheral Physiological Signals (AMIGOS) ECG Righ t 99.67 99.75 ECG Left 99.48 99.31 GSR 85.64 86.82 14 T able 7: The fusion result of different mo dalit y n umbers in p eripheral ph ysiological signals (%) M Prop osed F usion Mo del Pluralit y V oting Metho d Max Min Mean SD Max Min Mean SD 2 93.74 70.99 84.13 5.34 86.26 66.87 75.79 4.48 3 94.35 77.84 88.01 3.77 90.61 69.66 81.98 5.20 4 95.73 85.87 91.67 2.49 92.87 80.92 88.09 2.97 5 96.51 89.75 93.85 1.73 94.02 85.07 90.08 2.35 6 96.90 92.29 95.39 1.10 95.02 88.60 92.10 1.62 7 97.08 95.16 96.39 0.66 95.35 91.75 93.40 1.05 8 97.27 \ \ \ 94.65 \ \ \ M is the num b ers of modalities used in the biologically inspired decision fusion model 95.16% - ab out 2% b elo w the maximum v alue of 97.08%. The mean v alues and the standard deviation of b oth metho ds indicate that the increase of the mo dalit y num b ers help to impro ve the recognition accuracy and the robustness. In the prop osed fusion mo del, w e assume that: (1) for the samples which predicted fusion results are true, there is a strong correlation b et ween final classification score of the true lab el and the mo dalit y reliability; (2) for the samples which predicted fusion results are false, there is a weak correlation b et ween final classification score of the true lab el and the mo dalit y reliability . So W e use the cosine similarity to calculate the correlation b et w een the final classification score and the mo dalit y reliability in one sample as shown in Equation 14. In Equation 14, the GauP R m,true is the final classification score of the true lab el in mo dalit y m , and the S m represen ts the mo dalit y reliability of mo dalit y m . cos( θ GauP R,S ) = P 8 m =1 GauP R m,true × S m q P 8 m =1 GauP R 2 m,true × q P 8 m =1 S 2 m (14) The result of the test samples’ cosine similarity is shown in Fig.10. There are 7680 test samples in each round of 10-fold v alidation. The cosine similarity of more than 84% samples are greater than 0.8, and more than 91% samples are greater than 0.75. There are three cases when calculating the cosine similarity: (1) if the final classification score of the true lab el in one mo dalit y is high, the mo dalit y reliability of the correlation mo dalit y is high, so the cosine s imilarit y is high which means the correlation is strong. (2) if the final classification scores of all lab els in one mo dality are low, the mo dalit y reliability of the correlation mo dalit y is low, so the cosine similarit y is high which means the correlation is strong. (3) if the final classification score of the true lab el in one mo dality is low while the score of one false lab el is high, the mo dalit y reliability of the correlation mo dality is high, so the cosine similarit y is low which means the correlation is weak. In addition, we select 5 samples to sho w the details in the pro cess of the prop osed fusion mo del, as shown in Fig.11. T o make the final classification score and mo dalit y reliability on the same scale, we double the v alue of mo dalit y reliabilit y . Fig. 11 could prov e that the prop osed fusion mo del makes the decision b y the more reliable mo dalit y information while other mo dalities information is retained. 4.4 Comparison with Existing Mo dels The compared metho ds used a v ariet y of approac hes. The affective states recognition metho ds could b e simply divided into traditional machine learning approaches and deep learning approaches, and the fusion tec hnologies mainly con tain feature level fusion and decision level fusion. The traditional m ac hine learning approaches [6 – 8] use well-designed classifiers with hand-crafted features whic h may b e limited to domain knowledge. Motiv ated by the outstanding p erformance of deep learning ap- 15 Figure 10: The result of the test samples’ cosine similarity in primary fusion. The red dots represent the predicted results whic h are true, and the blue ∗ represent the predicted results which are false. proac hes in pattern recognition tasks, more and more studies use deep learning approac hes for deep feature extraction [3 – 5] or affective states recognition directly [9–11, 13]. Compared with these affective states recog- nition metho ds, the Multiscale CNNs can b etter handle data from differen t dimensions: the High Scale CNN is used to process high-dimensional EEG signals, which retains the spatial and temp oral information of the signals; the Low Scale CNN is used to process low-dimensional p eripheral physiological signals, which retains more useful temp oral information in the signals. Most of the fusion tec hnologies in these metho ds are feature level fusion. The disadv antage of feature level fusion is that it can not directly distinguish which type of mo dalities classification is the best, and can not directly obtain the fusion results of different mo dalities com binations. The fusion tec hnologies in [8 – 10] are decision level fusion, but most of them are simple v oting metho ds. The disadv antage of the v oting metho d is that only when the num b er of mo dalities is large, the fusion result is go o d. When the num b er of mo dalities is lo w, the fusion result is not improv ed significantly . The Biologically Inspired Decision F usion Mo del mak es decisions b y the more reliable mo dalit y information while other mo dalities information is retained. Compared with the feature level fusion tec hnologies, the proposed mo del is more explanatory and can directly obtain the fusion results of differen t mo dalities combinations. Compared with the v oting metho ds, the prop osed model has a b etter impro vemen t effect, and has achiev ed b etter fusion results when the num b er of mo dalities is low. The existing multimodal affective states recognition studies used v arious EEG channels, p eripheral physio- logical signals and lab els. In the DEAP dataset, the signals data used in Shu et al. [6], Yin et al. [7], Ma et al. [11] and Bagherzadeh et al. [8] are consis ten t with us. In the AMIGOS dataset, the signals data used in Y ang et al. [12] and Li et al. [10] are consistent with us. As a new dataset AMIGOS, the mo del whic h prop osed in Shukla et al. [14] and Harp er et al. [15] used single-mo de signals, and other mo dels used multimodal signals. It easy to see, the prop osed mo del outp erformed these other methods in terms of accuracy in the DEAP and AMIGOS datasets - the accuracy rate increase 4.92% in the DEAP dataset and 9.89% in the AMIGOS dataset. 5 Conclusions In this paper, w e ha ve prop osed a Multiscale Conv olutional Neural Netw ork Mo del (Multiscale CNNs) and a Biologically Inspired Decision F usion Mo del for affective states recognition from multimodal ph ysiological signals. The High Scale CNN and Lo w Scale CNN in the Multiscale CNNs are utilized to predict affective states based on EEG signals and p eripheral physiological signals resp ectively . Then the biologically inspired decision fusion mo del integrates the results from Multiscale CNNs to get the final result. The fusion mo del improv es the accuracy of affective states recognition significantly compared with the result on single-mo dalit y signals, and it could b e applied to other similar problems. W e also compared the p erformance of the decision fusion mo del and the pluralit y voting metho d which widely used in other decision fusion studies. Compared with it, 16 (a) Fiv e samples (b) Sample 1 (c) Sample 2 (d) Sample 3 (e) Sample 4 (f ) Sample 5 Figure 11: (a) Five samples. The blue line represents the result of the final classification score of the true lab el, and the orange line represents the correlation mo dality reliability . The horizontal axis is the sample’s ID and it’s mo dalit y , such as ‘1-8’ means that the sample’s ID is 1 and the mo dalit y is T emp erature. There is a strong correlation b etw een the final classification score of the true lab el and the mo dalit y reliability when the sample’s ID is 1, 2, 3, and the cosine similarity is 1, 1, 0.97 resp ectiv ely . The correlation is weak when the sample’s ID is 4, 5, and the cosine similarit y is 0.56, 0.69 resp ectiv ely . In the rest of the figures, the horizontal axis is the mo dalit y ID and the label, suc h as ‘2-4’ means that the mo dalit y is vEOG and the label is HAHV. (b) Sample 1. Sample 1 represents the case that all mo dalities predicted the true results and the final classification scores are high. F or sample 1, the true lab el is 4 (HAHV). All mo dalities contribute strongly to the decision making. (c) Sample 2. Sample 2 represents the case that all mo dalities predicted the true results but the final classification scores the partial mo dalities are lo w. F or sample 2, the true lab el is 1 (LAL V). All modalities predicted the true results, but the final classification scores are low in mo dalit y 3 (zEMG) and 6 (Respiration b elt), so the mo dalit y reliability of these mo dalities is low. Compared with others mo dalit y , these tw o mo dalities contribute w eakly to decision making. (d) Sample 3. Sample 3 represents the case that most of the mo dalities predicted the true results, and few mo dalities predicted the false results. F or sample 3, the true lab el is 4 (HAHV). Only mo dalit y 5 (GSR) predicted the false result. (e) Sample 4. Sample 4 represen ts the case that the n umbers of mo dalities whic h predicted the true results are equal to the num b ers of mo dalities which predicted the false results. F or sample 4, the true lab el is 3 (LAHV). The n umber of mo dalities predicted as 1 (LAL V), 2 (HAL V), 3 (LAHV), 4 (HAHV) is equal. With the con tribution of mo dalit y 4 (tEMG) which predicted LAHV with a lo w final classification score and medium mo dality reliability , the prop osed fusion mo del could predict the true results. (f ) Sample 5. Sample 5 represents the case that few mo dalities predicted the true results, and most of the mo dalities predicted the false results. F or sample 5, the true lab el is 3 (LAHV). Only t wo mo dalities 5 (GSR) and 7 (Plethysmograph) predicted as 3 (LAHV), and the four modalities 1 (hEOG), 3 (zEMG), 4 (tEMG), 8 (T emp erature) predicted as 4 (HAHV). With the contribution of the modalities which predicted LAHV with a low or medium final classification score and the mo dalit y reliability , the prop osed fusion mo del could predict the true results. 17 T able 8: The comparison of our mo del with previous multimodal affective states recognition studies Research Y ear Methods and Signals Labels Accuracy(%) DEAP Dataset Shu et al. [6] 2017 R estricte d Boltzmann Machine (RESPIRA TION BEL TM) + SVM EEG(32), EOG, EMG, GSR, R espiration b elt, T emp er atur e, Plethysmo gr aph 2 62.65 Yin et al. [7] 2017 Multiple-fusion-layer base d Ensemble classfier of Stacked Auto enc o der (MESAE) EEG(32), EOG, EMG, GSR, R espiration b elt, T emp er atur e, Plethysmo gr aph 2 83.61 Kwon et al. [3] 2018 F usion CNN EEG(32), GSR 4 73.43 Hassan et al. [4] 2019 DBN+Fine Gaussian Supp ort V ector Machine (FGSVM) EMG, GSR, Plethysmograph 5 84.44 Ma et al. [11] 2019 Multimo dal Residual LSTM EEG(32), EOG, EMG, GSR, R espiration b elt, T emp er atur e, Plethysmo gr aph 2 92.59 Huang et al. [9] 2019 Ensemble CNN EEG(32), EOG, GSR, Respiration b elt 4 82.92 Zhou et al. [5] 2019 Conv olutional Auto-Enco der (CAE) + FCNN EEG(14), GSR, T emp erature, Respiration b elt 4 92.07 Bagherzadeh et al. [8] 2019 Par al lel Stacked A utoenc o ders (PSAE) EEG(32), EOG, EMG, GSR, R espiration b elt, T emp er atur e, Plethysmo gr aph 4 93.60 Our Mo del Multiscale CNNs + Biologically Inspired Decision F usion Mo del EEG(32), EOG, EMG, GSR, Respiration b elt, T emp erature, Plethysmograph 4 98.52 ± 0.09 AMIGOS Dataset Y ang et al. [12] 2019 Attribute-invarianc e loss embe dde d V ariational Auto enc oder (AI-V AE) EEG(14), ECG, GSR 2 64.65 Granados et al. [13] 2019 1D CNN + FCNN ECG, GSR 4 65.25 Shukla et al. [14] 2019 Hand-crafted F eatures + SVM GSR 2 84.83 Harper et al. [15] 2019 Bay esian Deep Learning F ramework ECG 2 90 Li et al. [10] 2020 Attention-b ase d Bidir e ctional L ong LSTM-RNNs + DNN EEG(14), ECG, GSR 2 81.35 Our Mo del Multiscale CNNs + Biologically Inspired Decision F usion Mo del EEG(14), ECG, GSR 4 99.89 ± 0.05 The EEG (32) means 32 channels EEG signals b e used. Italics indicate that the signals used in the previous studies are consistent with ours. 18 the biologically inspired decision fusion mo del considers the correlation b et w een v arious class lab els. Then the reliabilit y of eac h single-mo dalit y signals is calculated by this correlation and the classification probability from ph ysiological signals. Finally , the decision is made by the more reliable mo dality information while it retains other mo dalities information. In addition, the results demonstrate that the Multiscale CNNs are effectiv e for affectiv e states recognition using single-mo dality signals, esp ecially the EEG-based High Scale CNN affective states recognition netw ork. The primary fusion results based on four frequency bands EEG signals prov es that the original EEG signals contain enough information and could b e used directly for affectiv e states classification. The primary fusion result of peripheral ph ysiological signals sho ws that a robust classification of h uman affective states using p eripheral physiological signals without EEG signals is p ossible. The prop osed metho d could predict affective states with high accuracy in the public database DEAP and AMIGOS. Although this method can not predict the complex construct of emotions [35 – 37], it la ys a foundation for real-world applications based on physiological-based affective states recognition. With the help of wearable devices and edge computing, it is exp ected to b e applied in the real-world, such as monitoring negative affectiv e states, iden tifying autism sp ectrum disorders, etc. Compared with other signals such as facial expression, gestures or speech, the ph ysiological signals are not easy to b e con trolled sub jectively and camouflaged. And the physiological-based affective states recognition metho d pays more atten tion to priv acy and the application scenario is more flexible. This metho d do es not need to use camera to collect p eople’s facial expressions or gesture, or use a tap e-recorder to record p eople’s voice, which can minimize the impact on p eople’s priv acy . Besides, this metho d do es not need to deploy cameras or tape-rec orders in the scene in adv ance, nor do es it need to make people alwa ys in the recording angle range of cameras or tap e-recorders. P eople only need to wear wearable devices that can collect ph ysiological signals, such as W earable EEG Sensor, ECG Sensor, Skin T emp erature Sensor and Bloo d Pressure Sensor, etc., so they can mov e freely and not being limited to sp ecific scenes. Finally , compared with facial expression, gesture or sp eec h, physiological signal data has low er dimensions and requires less computational resources. There are still many challenges in this metho d. In the future, we will reduce the computing resources by optimizing the netw ork structure, and design more reliable and comfortable w earable physiological signal acquisition devices to promote the application of this metho d in the real-w orld. References [1] Lisa F eldman Barrett, Ralph Adolphs, Stacy Marsella, Aleix M. Martinez, and Seth D. Pollak. Corrigen- dum: Emotional expressions reconsidered: Challenges to inferring emotion from human facial mov ements. Psycholo gic al Scienc e in the Public Inter est , 20(3):165–166, 2019. [2] G. K. V erma and U. S. Tiwary . Multimo dal fusion framework: a multiresolution approach for emotion classification and recognition from ph ysiological signals. Neur oimage , 102 Pt 1:162–72, 2014. [3] Y. H. Kwon, S. B. Shin, and S. D. Kim. Electro encephalograph y based fusion tw o-dimensional (2d)- con volution neural netw orks (cnn) mo del for emotion recognition system. Sensors (Basel) , 18(5), 2018. [4] Mohammad Mehedi Hassan, Md Golam Rabiul Alam, Md Zia Uddin, Shamsul Huda, Ahmad Almogren, and Giancarlo F ortino. Human emotion recognition using deep b elief netw ork architecture. Information F usion , 51:10–18, 2019. [5] Jian Zhou, Xian wei W ei, Chunling Cheng, Qidong Y ang, and Qun Li. Multimo dal emotion recognition metho d based on con volutional auto-enco der. International Journal of Computational Intel ligenc e Systems , 12(1), 2019. [6] Y angy ang Shu and Shangfei W ang. Emotion recognition through integrating eeg and p eripheral signals. In IEEE International Confer enc e on A c oustics, Sp e e ch and Signal Pr o c essing (ICASSP) , pages 2871–2875, 2017. 19 [7] Z. Yin, M. Zhao, Y. W ang, J. Y ang, and J. Zhang. Recognition of emotions using multimodal ph ysiological signals and an ensem ble deep learning mo del. Computer Metho ds and Pr o gr ams in Biome dicine , 140:93–110, 2017. [8] S. Bagherzadeh, K. Magho oli, J. F arhadi, and M. Zangeneh Soroush. Emotion recognition from physiolog- ical signals using parallel stac ked auto enco ders. Neur ophysiolo gy , 50(6):428–435, 2019. [9] Haiping Huang, Zhenchao Hu, W enming W ang, and Min W u. Multimo dal emotion recognition based on ensem ble conv olutional neural netw ork. IEEE A c c ess , 2019. [10] Chao Li, Zhongtian Bao, Linhao Li, and Ziping Zhao. Exploring temp oral representations by leveraging atten tion-based bidirectional lstm-rnns for multi-modal emotion recognition. Information Pr o c essing & Management , 57(3):102185, 2020. [11] Jiaxin Ma, Hao T ang, W ei-Long Zheng, and Bao-Liang Lu. Emotion recognition using multimodal residual lstm net work. In Pr o c e e dings of the 27th ACM International Confer enc e on Multime dia , pages 176–183, 2019. [12] Hao-Chun Y ang and Chi-Chun Lee. An attribute-in v ariant v ariational learning for emotion recognition using physiology . In ICASSP 2019-2019 IEEE International Confer enc e on A c oustics, Sp e e ch and Signal Pr o c essing (ICASSP) , pages 1184–1188. IEEE, 2019. [13] Luz Santamaria-Granados, Mario Munoz-Organero, Gusta vo Ramirez-Gonzalez, Enas Ab dulhay , and N. Arunkumar. Using deep conv olutional neural netw ork for emotion detection on a physiological sig- nals dataset (amigos). IEEE A c c ess , 7:57–67, 2019. [14] Jainendra Shukla, Miguel Barreda-Angeles, Joan Oliv er, GC Nandi, and Domenec Puig. F eature extrac- tion and selection for emotion recognition from electro dermal activity . IEEE T r ansactions on Affe ctive Computing , 2019. [15] Ross Harper and Josh ua Southern. A ba yesian deep learning framework for end-to-end prediction of emotion from heartb eat. arXiv pr eprint arXiv:1902.03043 , 2019. [16] Soujany a Poria, Erik Cambria, Ra jiv Ba jpai, and Amir Hussain. A review of affective computing: F rom unimo dal analysis to multimodal fusion. Information F usion , 37:98–125, 2017. [17] L. Shu, J. Xie, M. Y ang, Z. Li, Z. Li, D. Liao, X. Xu, and X. Y ang. A review of emotion recognition using ph ysiological signals. Sensors (Basel) , 18(7), 2018. [18] C. R. F etsch, G. C. DeAngelis, and D. E. Angelaki. Bridging the gap b et ween theories of sensory cue in tegration and the physiology of multisensory neurons. Natur e R eviews Neur oscienc e , 14(6):429–42, 2013. [19] M. O. Ernst and M. S. Banks. Humans integrate visual and haptic information in a statistically optimal fashion. Natur e , 415(6870):429–33, 2002. [20] S. J. Sob er and P . N. Sabes. Flexible strategies for sensory integration during motor planning. Natur e Neur oscienc e , 8(4):490–7, 2005. [21] C. R. F etsch, A. H. T urner, G. C. DeAngelis, and D. E. Angelaki. Dynamic rew eighting of visual and v estibular cues during self-motion p erception. Journal Of Neur oscienc e , 29(49):15601–12, 2009. [22] Y. Gu, D. E. Angelaki, and G. C. Deangelis. Neural correlates of multisensory cue integration in macaque mstd. Natur e Neur oscienc e , 11(10):1201–10, 2008. [23] D. C. Knill and A. Pouget. The bay esian brain: the role of uncertaint y in neural co ding and computation. T r ends In Neur oscienc es , 27(12):712–9, 2004. 20 [24] P . W. Battaglia, R. A. Jacobs, and R. N. Aslin. Bay esian integration of visual and auditory signals for spatial lo calization. Journal of the Optic al So ciety of Americ a A , 20(7):1391–7, 2003. [25] David C. Knill and Jeffrey A. Saunders. Do humans optimally integrate stereo and texture information for judgmen ts of surface slant? Vision R ese ar ch , 43(24):2539–2558, 2003. [26] Rob ert A. Jacobs. Optimal integration of texture and motion cues to depth. Vision R ese ar ch , 39(21):3621– 3629, 1999. [27] Yilong Y ang, Qingfeng W u, Ming Qiu, Yingdong W ang, and Xiaow ei Chen. Emotion recognition from m ulti-channel eeg through parallel conv olutional recurrent neural netw ork. In 2018 International Joint Confer enc e on Neur al Networks (IJCNN) , pages 1–7. IEEE, 2018. [28] Y uxuan Zhao, Jin Y ang, Jinlong Lin, Dunshan Y u, and Xixin Cao. A 3d conv olutional neural netw ork for emotion recognition based on eeg signals. In 2020 International Joint Confer enc e on Neur al Networks (IJCNN) , pages 1–6. IEEE, 2020. [29] James A Russell. A circumplex mo del of affect. Journal of p ersonality and so cial psycholo gy , 39(6):1161, 1980. [30] S. Ko elstra, C. Muhl, M. Soleymani, Lee Jong-Seok, A. Y azdani, T. Ebrahimi, T. Pun, A. Nijholt, and I. Patras. Deap: A database for emotion analysis using ph ysiological signals. IEEE T r ansactions on Affe ctive Computing , 3(1):18–31, 2012. [31] Juan Ab don Miranda Correa, Mo jtaba Khomami Abadi, Niculae Seb e, and Ioannis P atras. Amigos: A dataset for affect, personality and mo od researc h on individuals and groups. IEEE T r ansactions on Affe ctive Computing , pages 1–1, 2018. [32] Mart ´ ın Abadi, P aul Barham, Jianmin Chen, Zhifeng Chen, Andy Davis, Jeffrey Dean, Matthieu Devin, Sanja y Ghema wat, Geoffrey Irving, and Michael Isard. T ensorflow: A system for large-scale machine learning. In 12th USENIX Symp osium on Op er ating Systems Design and Implementation (OSDI 16) , pages 265–283, 2016. [33] Xiao-W ei W ang, Dan Nie, and Bao-Liang Lu. Emotional state classification from eeg data using mac hine learning approac h. Neur o c omputing , 129:94–106, 2014. [34] Mahan Hosseini, Michael Po w ell, John Collins, Chlo e Callahan-Flintoft, William Jones, How ard Bo wman, and Brad Wyble. I tried a bunch of things: The dangers of unexp ected ov erfitting in classification of brain data. Neur oscienc e & Biob ehavior al R eviews , 119:456–467, 2020. [35] M. Munezero, C. S. Montero, E. Sutinen, and J. Pa junen. Are they differen t? affect, feeling, emotion, sen timent, and opinion detection in text. IEEE T r ansactions on Affe ctive Computing , 5(2):101–111, April 2014. [36] Paul R Kleinginna and Anne M Kleinginna. A categorized list of emotion definitions, with suggestions for a consensual definition. Motivation and Emotion , 5(4):345–379, 1981. [37] Klaus R Scherer et al. Psyc hological mo dels of emotion. The neur opsycholo gy of emotion , 137(3):137–162, 2000. 21
Original Paper
Loading high-quality paper...
Comments & Academic Discussion
Loading comments...
Leave a Comment