Method to Annotate Arrhythmias by Deep Network
This study targets to automatically annotate on arrhythmia by deep network. The investigated types include sinus rhythm, asystole (Asys), supraventricular tachycardia (Tachy), ventricular flutter or fibrillation (VF/VFL), ventricular tachycardia (VT)…
Authors: Weijia Lu, Jie Shuai, Shuyan Gu
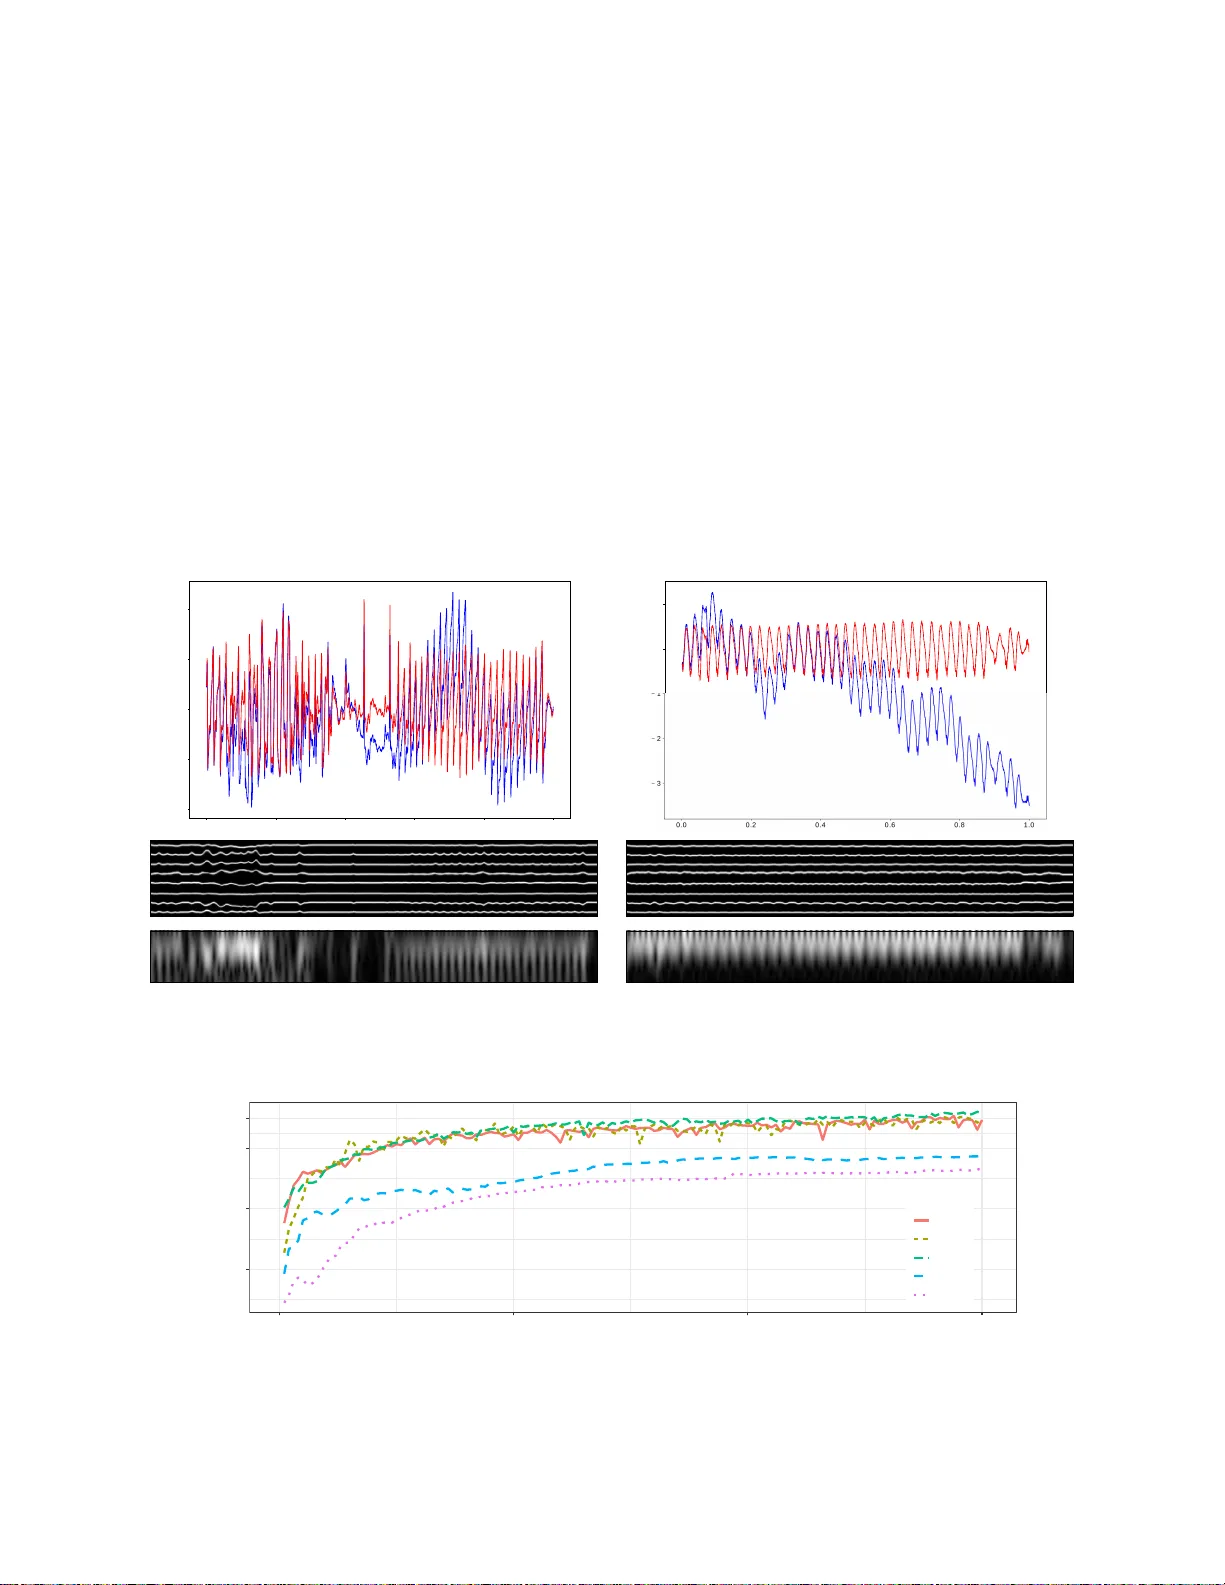
Method to Anno tate Arrhythmias by Deep Network W eijia Lu ∗ ∗ Digital, General Electric Shanghai, China Email: AlfredWJLu@gmail.co m Jie Shuai † Shuyan Gu † † Healthcare, General Electric Shanghai, China Joel Xue ‡ ‡ Healthcare, General Electric W auwatosa, WI, US Abstract —This study targets to automatically annotate on arrhythmia by deep network. Th e in vestigated types include sinus rhythm, asy stole (Asys); sup ra ventricular tach ycardia (T achy); ventricular flutter or fibrillation (VF/VFL); ventricular tachycardia (VT ). Methods: 13s l i mb lead ECG chu nks from MIT malignant ventricular arrhythmia database (VFDB) and MIT normal si nus rhythm database were p artitioned into subsets for 5-fold cross validation. T h ese signals were resampled to 200Hz, filtered to remo v e baseline wandering, p rojected to 2D gray sp ectrum and then fed into a d eep network wi th brand-new structure. In this network, a feature vector for a single time point was retriev ed by residual layers, from which latent re presentation was extracted by variational autoencoder (V AE). These front portions were trained to meet a certain threshold i n loss function, then fixed while trainin g pr ocedure switched to r emaining bidirectional recurr ent neu ral netwo rk (RNN), the very portions to p redict an arrhythmia category . Attention wind ows were polynomial lumped on RNN outp u ts for learning from details to outlin es. And ov er sampling was employed for imbalanced data. The trained model was wrapped into docker image for deployment in edge or cloud. Conclusion: Promising se nsitivities wer e ac hieved in f o ur arrhythmias and good pr ecision rates in two ventricular arrhythmias were also observed. M oreo v er , it was prov en that latent repre sentation by V AE, can signifi cantly b oost the speed of con ver gence and accuracy . I . I N T R O D U C T I O N Automatically an notate arrhy thmia with deep learning net- work has been emerging along with the bo ost of di verse frameworks. Back to 2 015, 1D conv olutio nal neu ral network s (CNN) were proposed by Kiranyaz to classify ECG beats [1 ]. In the same year, a stacked denoising auto encoder s (D AE) combined with supervised classification w as p roposed by Rahhal fo r active learn in g the b eat ann otation [2]. I n past 2017, Ng and his g roup trained a CNN classifier as deep as 34 layers to predict 14 outputs [3]. All th e se studies claimed a better p erform ance co mpared with han dcrafted feature, and ev e n better than card iologists annotation. This study targets o n the same prob le m , in which a brand - new de e p network is pr oposed. Data introdu ced in section II-A is partitioned into two parts for training and tes ting separately , pr eprocessed by ty pical filtering, tr ansferred into 2D spectrum, and fe d directly into this network. The network is trained b y two steps, firstly featu re vector in each time spot is summarized into laten t repre sen tation b y un supervised learning, which acting as a warm initializatio n for fu rther classifier train in g; secondly a classifier is retr iev e d b y su- pervised lear ning from these latent representation. In th e last part of this study , p erforma nce o n test set is reported, and a comp arative experiment is introd uced to pr ove the pr os of latent representation . I I . M E T H O D A. Data ECG records are mainly from MIT Physionet d atabase [4 ], including malignant ventricular a rrhythm ia database (VFDB) [5] and inbuilt n ormal sinus rhythm database. T ABLE I R H Y T H M O F I N T E R E S T A N D T H E I R D E F I N I T I O N T ype Definitio n Normal sinus normal heart rhythm Asys no rate at least 4s T achy rate > 140bpm for 17 beats VF/VFL F-wav e VT rate in 100-250bpm, QRS span larger than 0.1s The r hythm of interest includ es asystole (Asys), supraven- tricular tach ycardia (T achy ), ventricular flu tter o r fibrillation (VF/VFL) and ventricular tach y cardia (VT) ; the corr espondin g definition can be found in table I. B. Pr ep r ocessing A pro per chu nk of limb lead signal is firstly selected (e.g. 13s) an d re-sampled (e.g 2 00Hz); the chunk sp an shou ld be set based on th e d e fin ition of a r rhythm ia in section I I-A, and en close segmentation arou nd anno tation label indicatin g rhythm change. Then a high passed FIR filter is em ployed to remove baseline wand ering (e.g . - 24dB at 0.05Hz); Finally 2D spectrum is compu ted based o n welch’ s method (e. g . 1024 points o f fast Fourier transform operated on 9 1% overlapped moving win dow with span o f 60 samples). C. Network to learn the cate g ory T o an n otate prepro cessed signal, a network in Fig. 1 is propo sed. This novel net stru cture, to our b est k nowledge, is never found in relative literatu re before. Therefor e it requires an end-to -end tr a ining instead of transfer learning for most of image AI ta sk . The whole n etwork inc lu des two par ts, which n eed to be trained separately . The first one is a deep representatio n n et (14 25 floats), trained by cost fun ction Eq.1 . l oss 1 = E z ∼ q θ ( z | x i ) [ | x i − p φ ( e x i ) | 2 | z ] + K L ( q θ ( z | x i ) || p ( z | x )) (1) This part gets a feature vector (20 floats) from frequ ency vector ( 60 freque n cy b ins) by residual unit ( ResUnit) [6] and pooling , then tries to find a co ncise a n d robust repr e sen tation of feature, dr awn from Gaussian distribution in dense spac e (dimension = 8). The projection to dense space is re tr iev e d by a variational a u toencod er (V AE) [7], namely a pair of en c o der- decoder highligh ted in g r ay box in Fig.1. Back to mathematics in E q.1, encoder is d enoted by q θ ( z | x i ) and decoder is represented as p φ ( e x i | z ) , similar to the definition in Kingma et al’ s work [7]. Therefor e the first term in Eq.1 is normally referred as reconstru c tion loss, for a la ten t representation z is d rawn and used to reconstruct original input x i . The second term in Eq .1 is Kullback-Leible r div ergence when approximate the posterior p ( z | x ) with a family of distributions q θ , and it acts as a r egularizer penalty to maintain latent distribution in to sufficiently diverse clusters [7]. Theref o re this term is n ormally referred as latent loss. The second portion, denoted by pink box in Fig.1, is a deep classification net (11790 floats), trained by cross entropy loss function Eq.2. l oss 2 = − E ( M X y =1 I y = y 0 l og ( p y | x 0 )) (2) where y and y 0 is predic te d an d true label re spectiv ely , M is total category of labels, I ( • ) is indicator function and p y | x 0 is predicted d istribution. This part is comp ound e d b y a multilayer bi-directio n al RNN structure along with multiple dense layers. The attention window , intro duced by Bahdanau et al [8 ], is polyno mial lumped on RNN cell outputs except last lay er , namely the span of a tten tion window is incre a sing from bo ttom to top layer . Th erefore , the mo del is learning fro m details to overall p icture. This po rtion reuses the outp u t from first portion , and gives a pred iction on each sample. In mo st cases, V AE serves as a trad itio nal generative modeling . In our case, it’ s used to ge n erate a robust latent representatio n and decrease noise in each sample, since as denoted in Kingma et al’ s study [7], V AE brings a constrain on the d istribution of each latent cluster, and learns the distri- bution instead of a deterministic rep resentation over tr aining set. I n later section a compar ativ e test is presente d to prove the effecti veness of V AE rep resentation in this study . Fig.1 sho ws a ’base’ network configur ation, in cluding : kernel and stride size of filtering marked on both sides o f operator arrow; numb er of residual un its (=1); dimen sion of laten t repre sentation (=8); h idden unit size in RNN cell (=10); numb er of layers in b idrectional RNN network (=4) and smallest attention window size lump on RNN o utput (=3). Later on, th is ’base’ setu p will be modified in the very same compara tive test. D. Method to train the network The orig inal dataset after p repro c essing, namely gray im - ages indicating 2D spectrum of sign al are rand omly divided into s ev e r al sub sets ( e.g. 5-fold) in each arr hythmia typ e. Network are tested on a certain sub set after aggr egating those samples from d ifferent arrhy thmia typ es. On the oth er han d the remain ing d ata are o rganized into mini b atch and f ed directly into mode l f or training pur pose, after over sampling in un der-represented arrhythm ia ca tegories. Such design o f data prep a ration are specific for imbalanced set in this study , namely the big difference of total samples falling in each arrhyth mia catego r ies. The min i batch size is equal to 140 in this study . As mentioned in section I I-C, the whole net is trained separately . The training of first part is fulfilled after a certain threshold of cost is met, then the first part is fixed and model start to be train ed on second p a rt. In V AE, the cost function is c ombined b y two m athematics terms as in Eq .1. Fro m these two p arts, a f raction η can be calculated to represent the portion of latent loss in total loss in each iter ation. This fraction is coup le d into the m o del training p rocedu re in this study to do minate sampling in latent G a u ssian distribution. In the very beginn ing, the reconstruc tion lo ss takes a large portion in to tal lo ss, ther e fore the fractio n is sm all an d latent variable z is drawn f r om no rmal distribution N ( Z Mean , η · Z Std ) durin g sampling instead of N ( Z Mean , Z Std ) . By this man ner, mo del conv e rgen ces faster to a po tential cluster cen ter in se veral epochs and total lo ss decr eases rapidly . Later on, laten t loss gradua lly takes a domin ant portion, and r egularizer effect starts working. E. Method to deploy this model The trained model is encapsulate d into docker image, and deployed to either edge comp uter server or virtua l pr i vate cloud (VPC). During the initialization o f do cker containe r in edge server, local working directo r y c a n be moun ted, and data can be fed into model by loca l file I/O. As for the case in VPC, web RESTfu l API can b e provided by flask or likely python compon ent as majo r data I/O. I I I . E X P E R I M E N T A N D R E S U LT T ABLE II C O N F U S I O N M A T R I X O N # 0 V F D B T E S T S E T I N 5 F O L D C V D E S I G N ( A C C U R AC Y = 9 0 % ) T ype Asys T achy VF/VFL VT # PP/T ot 48/52 19/20 398/444 335/372 Sensiti vity 0.92 0.95 0.89 0.90 Precision 0.74 0.70 0.96 0.90 T ABLE III C O N F U S I O N M A T R I X O N # 1 V F D B T E S T S E T I N 5 F O L D C V D E S I G N ( A C C U R AC Y = 9 0 % ) T ype Asys T achy VF/VFL VT # PP/T ot 46/52 16/20 399/444 345/372 Sensiti vity 0.88 0.80 0.89 0.93 Precision 0.82 0.72 0.94 0.89 The m odel is trained an d tested in 5-fo ld cross validation. Fig.2 sh ows the inter mediate plo tting o n a VT sample and a T ach y samp le, inclu ding: waveform before an d after prefiltering, re la tive 2D spectrum and relative latent representatio n. T ab le II and III gi ve the perfor m ance rates on test sets using a so- c alled ’base’ setup in section II-C. From these tables, it’ s proven that proposed network h a s prom ising sensiti vity in detectio n these arrhythm ias, and goo d precision in two ventricular ar rhythm ias. Moreover , a comp arative experiment is condu cted, and accuracy of mo del on test set is record ed for comp arative plotting. Dur in g this experim ent, d ifferent setup on network parameter, e.g. the number of hidde n u nits in RNN cell or span of attention windo w are tested; in addition to these superpar a meters, two methods to get latent r e presentation are compare d too : using V AE to learn a statistic distribution or retrieving a deterministic latent v ariable from a simple dense projection . The r e sults can be fou n d in Fig.3. From this figure, it’ s proven that to learn a laten t distribution by V AE can significantly boost the spe e d of convergence an d accuracy . Meanwhile, other config uration in setup h as no significant difference on the mo del performance . LeakRelu 2DConv Kernel HxW stride HxW Pass through Gain Kernel HxW stride HxW MaxPool HxW C Data (NHWC) Flatten Sample Norm Batch Norm Expand Dense Mathmatic add Statistic sample Reshape 2DConv trans Kernel HxW stride HxW Meaning Notation Transpose Meaning Notation Meaning Notation 60x521 1 5x5 60x521 1 1x1 3x3 1x1 60x521 8 3x3 1x1 60x521 1 -1 ResUnit x1 4x2 3x1 20x521 1 521x20 0 1x3 1x2 521x10 2 1x3 1x2 521x5 8 521x40 0 521x8 0 521x8 0 Cost func Eq.1 Input 521x8 0 521x40 0 521x5 8 1x3 1x2 521x10 8 1x3 1x2 521x20 2 521x20 1 521x20 0 Bi-dir RNN with attention train portion 2 521x20 0 521x1 0 6x1 0 Label y0 Cost func Eq.2 Z_Mean Z_Std Z_Std Z_Mean train portion 1 Predict y VAE-encoder VAE-decoder xi p(xi) p(y|x0) Fig. 1. Structure of proposed deep network. The highest dim of each data block represents size of batch (N), which is hidden in this diagram. The other three dimensions are height (H), width (W) and feature channels (C), the size of which can be read from footnote on each data box. For instanc e, first block sho ws a data batch with shape equal to N (= 140) × 60 × 521 × 1 , each sample is a 2D spectrum, with 1 gray channel, 60 frequenc y bins and 512 sampling points. I V . C O N C L U S I O N In this study , a brand-n ew deep n e twork stru cture is pro- posed to annotate arrhyth mia in E CG signal. This network in- cludes two parts, o ne for extracting latent re p resentation from feature vector in each tim e spot, and th e othe r for predictin g arrhyth mia categories of interest. Th is n etwork achieve a r ound 90% sensitivity in asystole, ventricular flutter /fibrillation or ventricular tachycardia, and over 8 0% sensiti v ity in all 4 arrhyth mias in c luding supraventricular tachyc a r dia. Mo reover the test results show good precision rates in two ventr ic u lar arrhyth mias. This network uses V AE to extract latent rep re- sentation, which works as a warm initialization for classifier . This meth o d is p roven to significantly im prove th e speed of conv e rgen ce and accuracy . R E F E R E N C E S [1] S. Kiranyaz, T . Ince, and M. Gabbo uj, “Real-time patie nt-speci fi c ecg classifica tion by 1-d con volutiona l neural networks, ” IEEE T ransactions on B iomedic al Engineeri ng , vol. 63, no. 3, pp. 664–675, 2016. [2] M. M. Al Rahhal, Y . Bazi, H. AlHichri, N. Alajlan, F . Melga ni, and R. R. Y ager , “Deep learning approach for activ e classification of electrocardi o- gram signals, ” Information Scien ces , vol. 345, pp. 340–354, 2016. [3] P . Rajpurkar , A. Y . Hannun, M. Haghpanahi , C. Bourn, and A. Y . Ng, “Ca rdiologist-le vel arrhythmia detectio n with conv olutional neural netw orks, ” arXiv preprint arX iv:1707.018 36 , 2017. [4] A. L. Goldberger , L . A. Amaral, L. Glass, J. M. Hausdorff, P . C. Ivano v , R. G. Mark, J. E. Mietus, G. B. Moody , C.-K. Peng, and H. E. Stanley , “Physioban k, physiotool kit, and physionet, ” Circul ation , vol. 101, no. 23, pp. e215–e2 20, 2000. [5] S. D. Greenwa ld, “The de vel opment and analysis of a ventric ular fibrilla- tion detector , ” Ph.D. dissertatio n, Massachusett s Institute of T echnolo gy , 1986. [6] K. He, X. Zhang, S. Ren, and J. Sun, “Deep residual learni ng for image recogni tion, ” in Pro ceedi ngs of the IEE E confere nce on computer vision and pattern rec ognition , 2016, pp. 770–778. [7] D. P . Kingma and M. W elli ng, “ Auto-en coding vari ational bayes, ” arXiv pre print arXiv:1312.6114 , 2013. [8] D. Bahdana u, K. Cho, an d Y . Bengio, “Neura l machine translation by jointl y learning to align and translate, ” arXiv pre print arXiv:1409.0473 , 2014. 0 .0 0 .2 0 .4 0 .6 0 .8 1 .0 − 2 − 1 0 1 2 A 0 . 0 0 . 2 0 . 4 0 . 6 0 . 8 1 . 0 3 2 1 0 1 D B C E F Fig. 2. Original and preprocessed ECG wav eform along with its 2D spectrum and latent representati on. (a-c) A VT sample #421 .a 865 , its 2D spectrum and its late nt representat ion correspondingly; (d-f) a suprav entricular tachycardia sample #426 .a 080 , its 2D spectrum and latent represent ation. The dimension of latent s pace equal to 8 in this setup. In the latent representati on, each line represents an coordinat e of latent space. Its amplitude giv es the mean, and its width giv es the standard de viation of a Gaussian distribut ion. Thus the whole picture gi ves the propagati on of latent representation on time. 40 60 80 90 0 50 100 150 epoch accuracy conds Base #1 #2 #3 #4 Fig. 3. Accurac y on test s et under diffe rent s etup during training. Comparing with setup termed as base, #1 increase s hidden units size in each RNN cell from 10 to 15; #2 increases smallest attention windo w from 3 to 5, whistle decreases number of directi onal layers from 4 to 3; #3 and #4 has the s ame configuration comparing with #1 and #2 correspondi ngly , but use a dense projectio n inst ead of varia tional auto-enco der to get the latent representat ions. Therefore in #3 and #4, netw ork is trained as a whole set.
Original Paper
Loading high-quality paper...
Comments & Academic Discussion
Loading comments...
Leave a Comment