A Method of EV Detour-to-Recharge Behavior Modeling and Charging Station Deployment
Electric vehicles (EVs) are increasingly used in transportation. Worldwide use of EVs, for their limited battery capacity, calls for effective planning of EVs charging stations to enhance the efficiency of using EVs. This paper provides a methodology…
Authors: Tianshu Ouyang, Jiahong Cai, Yuxuan Gao
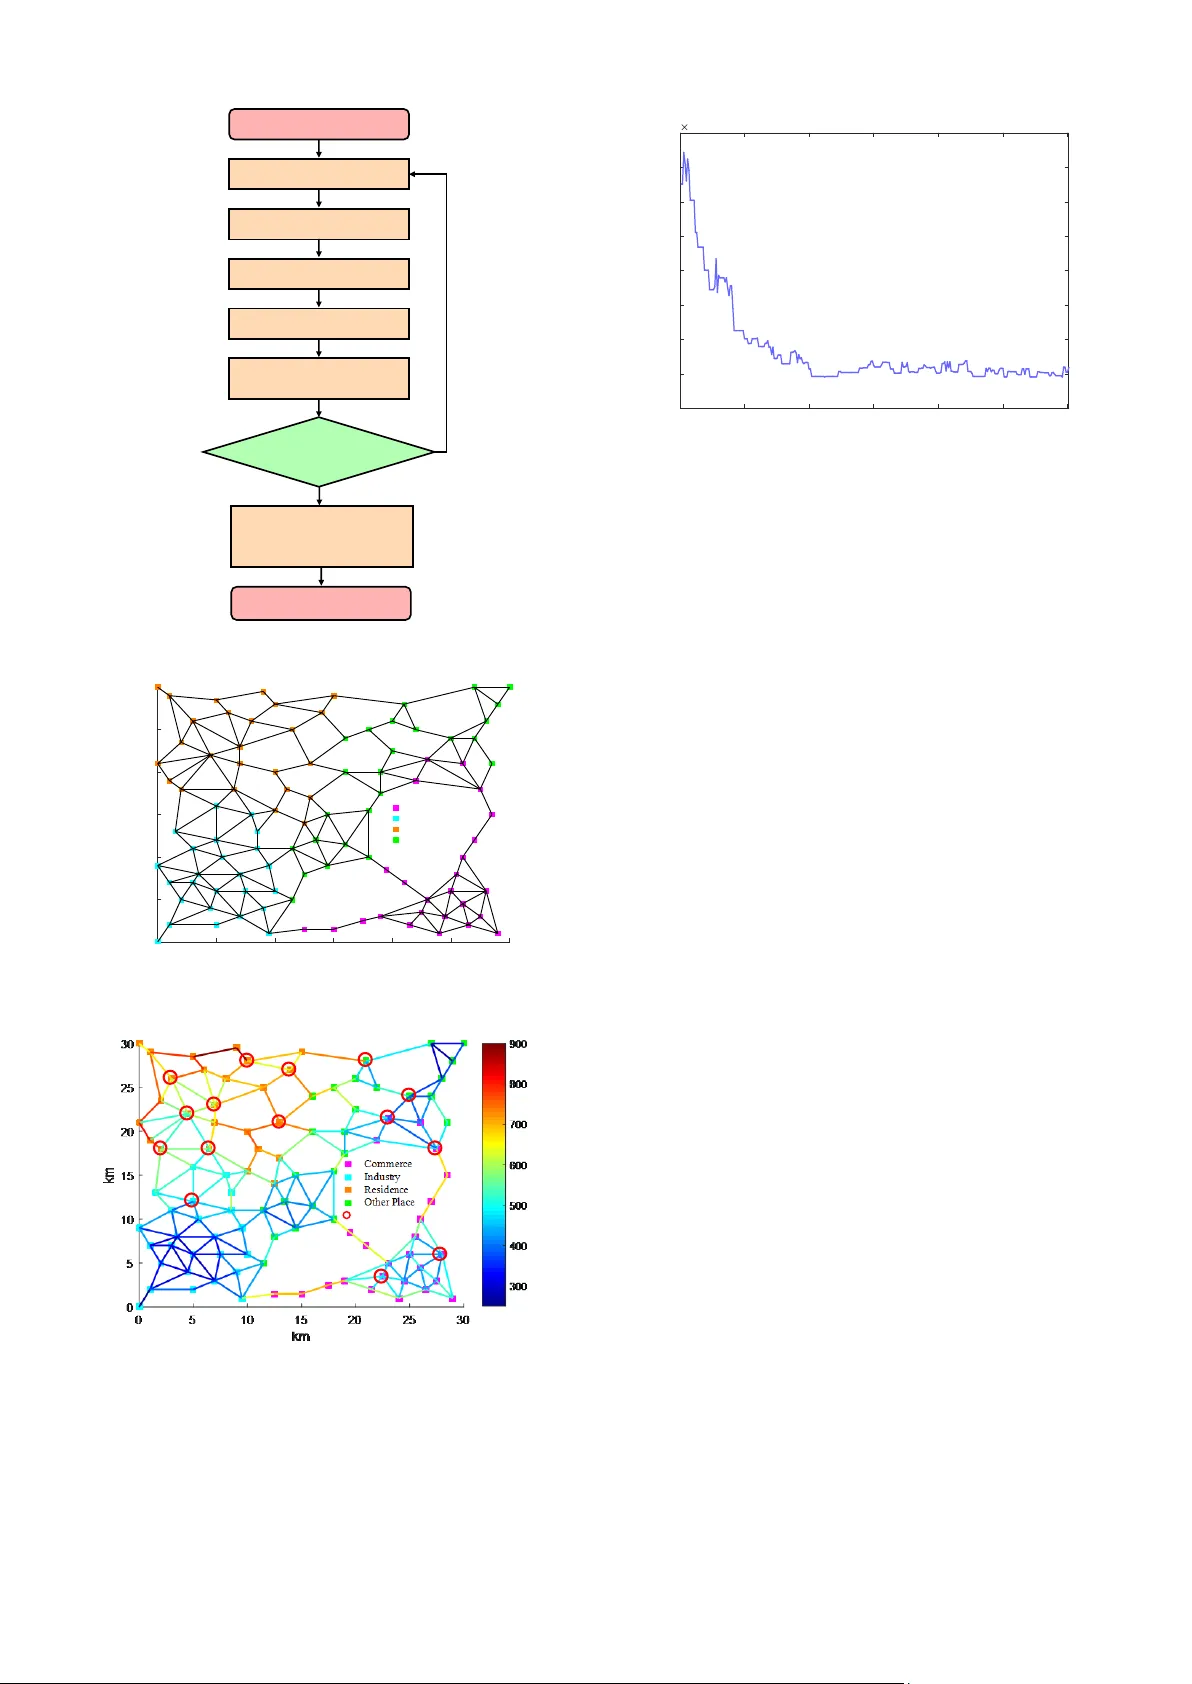
A Method of EV Detour-t o- Recharg e Behav ior Modeling a nd C harging Stat ion Deployment Tianshu O uyang †, 1 , Jia hong Cai †, 2 , Yuxuan Gao † , 3 , Xi n yan He † , 4 , Huimiao Chen † , 1 , * , Kexi n H ang 1 † These aut hors co ntribute d equa lly to t his work . 1 S parkzone I n stitut e ; 2 U nivers ity of C hicago; 3 The Wharto n School of th e Universi ty of Pennsyl vania ; 4 P rinceton U niversity * hche n@ sparkz one . org Abstract — El ectric v ehicles (EVs) are i ncreasin gly used in tran sp ortation. Worldwid e use of EVs, for their limited battery c apacit y, cal ls f or ef fect ive p lanni ng of EVs charg ing s tati ons to enhance the effici ency of usi ng EVs. This pa per provide s a metho d ology of d e scribing EV detouri ng behavio r for recha rging , and ba sed o n t h is, we adopt the extra driving l ength caused by deto uring and the le ngth of uncom pleted ro ute as t he in dicator s of eval uatin g a n EV charging stat ion deploymen t plan . In this way, we ca n simulate EV beh avior bas ed on tr avel d ata ( d emand ). Then, a g enetic algori thm (GA ) ba sed EV ch arging stati on sitting optim ization metho d i s developed to obtain a n e ffective p lan . A detai led case st udy based on a 1 00 - nod e 203 - bra nch tra nsportat ion net w ork within a 3 0 km × 30 km reg ion is included to test the effectivene ss of our meth od. I nsights from our method ma y be appl icab le for char ging s tat ion pl an ni ng in vario us trans por tati on netw ork s . Keyword s — electric veh icle s; detouring behavi or ; cha rging st ations; t ransportatio n networ k ; g enetic algo rithm . I. I N TR ODUCTION T h e continued g rowth in use of convent ional vehicles in tr an spo rtati on w ill u nav oida bl y caus e nat ura l gas oli ne re sour ce dw ind ling . As an unrene wable fuel source, gasol ine will be in sho rtage i n t he ne ar future due to human’ s immoderat e exp lo ita tion, which wi ll also r esu lt in sev ere environ ment al degrad ation, e.g. , exc essiv e emission o f greenhou se gases. With the awareness of the limited fossi l fuels, governments hav e imp leme nted nume r ous po lic i es to pr omo te pu rcha se an d use of elect ric v ehicl es ( EVs), w hich r ely on elect rici ty t hat ca n be genera ted from wind p ower, hyd r auli c pow er, et c. Howe ver, th e pec uli ari tie s of E Vs, in clu din g in suf fic ient ba tter y capacit y to r each a remo te d e stin at ion , co m monl y r ef er red a s “rang e a nxiety”, and fre quent d emand to charge, h ave been th e dom inant hind eran ces to m arke t ac cept ance of E V s . The refore, EV us ers are res tri cte d t o dr iv e onl y s hort tri ps a nd l es s an nual miles due to inconven ience to char ge, which no t o n ly dis co ur age s custom er ad option of EV s but also impedes the tran s ition f rom gasol ine - pow ered vehi cl es t o the mor e envi ron ment a lly fr iend ly E Vs. Therefore, effect ive EV charging station s planning is urg entl y ne eded to cou nt er the iss ues o f inaccess ibil i ty to c ha rgin g sta tio ns and ex cess ive inc reme nt of dr ivin g du e to r echar ging, or el se EVs w ill fail to r eceiv e pu blic market ac ceptan ce. I ncor por a ting EV charging station netwo rks into current transportat ion netwo rks require s thoroug h consi d er atio ns an d s i mulatio ns beca use of t he co mpli ca cies of urba n are as. Howev er, wi th th e rapidly grow ing populatio n densi ty and increa sing deman d for veh icles, eff e ctive planning of c har gin g s tati ons i n cit y a reas c an bri ng s iza ble so cial ben efits . In exis t i ng lite ra tur e, there a re stu di e s fo cus in g o n plann ing of dif fer en t type s of energy supply infr as tru ctur e in transpo rtation, e. g. , gas stat io n s a nd c har gi ng st ati ons. Refe ren ce [ 1] e xpl ores the choos in g of gas stat io ns and the fac tor s th at in flu enc e th e de c ision. In [2], the a ut ho rs introduce a model for po sitioning the opt imum location o f a sma ll s ize fuel statio n with the hel p of Geospati al Inf or mati on S ys tem , and meth ods such as Boolean logic, index overl ay, and fuzzy opera tors are d emon strat ed . Sweda et al . em ploy an a gent - ba se d decision suppor t syst em pr esented f or ide ntifying pa tter n s in residential EV owne rs hip an d dri vin g act ivi tie s to ena ble stra tegic deploym ent of new charging infrastruc ture [3]. The aut hors of [ 4 ] pre sen t a mu lti - obj ect ive co llabo r a ti v e planning s trat eg y to deal with th e optimal p lanning is sue in int egr ate d powe r di stribution a nd EV ch arg ing syst ems. The us er e qu ilib riu m - ba sed tr affi c assig nm ent mod el is integ rated to addre ss the m aximal tra ffic flow capturing pro blem, and deco mpos i ti on bas ed mul ti - objec ti ve e vo luti ona ry algo r ithm is empl oye d t o s eek the n on - domi nat ed sol ut ions . Ref erence [ 5 ] propose s a two - ste p mod el fo r al loca tin g E V recha rging stations tha t fir st qu an tif ies t he r oad inf orm ati on into dat a poi nts a nd s ubs equ ent ly c onverges into ‘ dem and cl uste r s ’ over an ur banize d area by hi erar chical cl usteri ng anal ysi s ; o ptimizat ion techn iques are then app li ed on t he de mand cluster s with the a im of mee ting the suppl ies and demand s, and cer tain con st raint s and co st fact ors are con s i dered . Dong et al . inv es tigate the influenc e of publi c charging s tations depl oym en t on increa sing EV ma rket p enetra tion ; a n act ivi ty - based as s essm en t meth od se rv es to te st th e fe asib il ity fo r the heterog eneous trave ling population, and gen etic algorith m (GA) is us ed t o f ind the o pt imal loca tio ns f or cha rgi ng st ati ons ; Don g et al . ba se o n GP S - ba sed trav el survey data to co ndu ct case studies [6]. Pay am et al . propos e a dy nami c ap proa c h to the opti miz ati on of c harg ing s tat ion loc ati ons an d siz in g th at b est su f fic e the ch arg i ng de ma nd s a nd mi nimi ze p ower loss in t he transportatio n of electri cit y fr om cent ra l pow er gr ids [7]. The research o f Xiong e t al . focus es on the charging b ehaviors an d mutual impact on var ied traff ic condi tions of EV dr ivers [8]. L i et al. [9] establish mathe matic al m odel ba sed on bi - lev el program ming to formu late governme nt's infrastru cture location strategy , the c ompany's f leet comp osition and routing plan in orde r to promo te EV ad opti on i n com pani es. A hy brid heur ist ic met hod is th en emp l oyed to solve the formu lated problems. Bou guerr a et al . [10] stu dy t he r eal ca se of the cent er o f Tuni s City, Tunisia wit h existing data to fi nd opt imized loca tion and size o f cha rging stati ons of this speci fic area . R efer ence [ 10 ] uses the c as e in the ce n tral urb an are a , a 30 km b y 30 k m area, in Beijing to stu dy th e d a ta -d riv en p lanni ng of ele ctr ic tax i s cons ide rin g the op tim iza tio n of bot h inve stm en t and oper ation costs . Despite th e already d one w ork , d es crib ing E V d rivi ng beh avior an d eval uating a n EV c harging sta tion si ttin g p lan ar e still challeng eable due to fact ors inc lu din g li mit ed data of E Vs. How t o m odel t he EV b eha vi or from co nventi o na l veh icl e r ou te da ta and u se i t in sta tio n p lanning is a m ea ning ful pro blem whi ch has not be en investigat ed ade q ua tely. Henc e, in this w ork, w e pr ovide a n EV be havi or mod el and a station planning method d er ived from it . T he main pro cedures and co n trib ut i ons of t he pape r are su mmar ized below . • P res ent a me th od ol ogy o f de scribing the EV de touring beha vio r for rec har gi n g. • A dopt the ext ra drivin g length caused b y detouring and the l engt h of uncompleted rout e as the indicator to evaluat e of station planning . • De velop a GA b ased method to p lan EV charg ing st at ion i n a tr ans po rt ati on ne twork with tr av el d a ta no t from EVs . • St udy a det ail ed case wi th a 1 00 - nod e 203 - bran ch transpo rtation ne twork within a 30 km × 30 k m region to test th e effect iven ess of the planning . The rem aind er of the p aper i s organiz ed a s fo l low s. S ec ti on II i llus trates t he methodology of descr ibing E V deto u r in g beha vior for r echarging . Sectio n III intro du ce s the G A for EV charg ing sta tion pla nni ng and Sec tion I V sho w s the cas e . Section V co n c lud e s. II. M ETHODOLOGY OF D ESCRI BING EV D ETOURING B EHAV IOR FOR R EC HARGING In thi s sec tio n, we i ntr oduc e our m etho dol ogy o f desc ribi ng the EV de touring behavio r for rech arg ing. We co nsid er a transpo rtation network con sisting of a series of nodes (in ters ecti on s) and br anches ( roads) wi th vehicle travel da t a given. The ne twork h er e is lim ited to a conn ected grap h beca use a n unco n nected g r aph ca n be tr eat ed as mu ltip le conne cted graphs. Vehicl e travel data i s in form of a set of routes , each of which includes a series o f nod es th at th e veh icl e needs t o p ass i n order. Bes ide s, for ea ch route re cord , ther e is a corresp onding ini tial stat e of charge ( SOC). Detouring t o rechar ge their batt eries is the key dif feren ce between EV and conventiona l vehicle travel beha vior. He re in, we firs t intr odu ce som e assu mpt io ns for the desc r ip tion of E V deto uri ng. 1) A n EV onl y c harg es once in a det o u r, bu t i t ca n detour mul tiple times in a rou te deviating f rom differ ent bra nches . Thi s co nsi dera tio n i s for th e pur pose of ma kin g th e detour r u le simp le, cl ear, reason ab le and pra cti ca l. 2) Th e len gth of ea ch br anch is t he shor test length between the two c onn ected n odes. This assumption ensures tha t t aking detour will absol ut el y make the le ngt h of dri vi ng lo nge r tha n not taking de tour, so th e t i mes of taking detour is intended to be m inimized. 3) Ev er y nod e in a rou te mu st be p assed to com pl ete th e rou te . I f an EV de tours from a node to charge, it mu st return to the o riginal rout e by p assing the next node afte r char gin g. In ot her wo rds , all nodes in a ro ute mu st be pass ed. Befo re elab o rating on th e d etou r r ul es, we def ine som e notation s. We u se ij L − ( i jk L −− ) to denote the length of the shorte st path from no d e i to n ode j (f rom node i to no de j to node k ) an d n detour L to d en o te th e d iffere n ce o f th e lengt hs o f the detou r path and the bran ch, i.e. , = n detour i c j i j LL L −− − − ( c is a no de wi th ch arg ing sta tion , n repres ents that node i i s the n th no de in the r out e ) , and use rest L to den ote t he len gth of t he unco mpl eted par t of t he ro ute. The deto ur rules i nclude mult iple st eps of ju dgi ng , computa tions, and record ing. Wh en an EV arrive s at a n ode of a rout e, it nee ds to co nd uct the fol low in g ste ps to d e ter min e wh ether and how to detour. Fo r a r oute r whose no des a re 123 ={ , , , , } rN xx x x N , if th e rem aine d SOC of t he EV at n x ca n ful fil l th e dr iv ing f ro m n x to +1 n x , we le t =0 n detour L . I f the remain ed EV SO C cannot f ulfill the dr iv ing fro m n x to +1 n x , we s elect all char gin g stat ions tha t can be reac hed w ith th e remain ed SOC as a set , 12 3 ={ , , , } n rx cc c C . I f , n rx C i s an empty set , i.e., n o cha rging stati on i s ac ces si ble, th e E V wil l no t be able to detour to c harge. We ca lcu lat e rest L and r ecord a ne w 1 1 i n rest detour i LL L − = = + ∑ . If , n rx C is no t empt y, th ere ar e cha rgi ng stations access ible for th e EV. If t he EV do es no t ch oo se to de tour t o char ge, w e ca lcul ate rest L and rec ord a n ew 1 1 i n rest detour i LL L − = = + ∑ . If EV detou rs to char ge, we cal culat e n1 n x cx L + −− for all , n rx c ∈ C and sel ect the s ta tion with the m ini mum va lue f or t his ch argi ng , and calculat e n detour L . If ther e ex ist mult ip le sta tio ns with the s ame min imu m n1 n x cx L + −− , wh ic h prod uce s a se t min C , we sele ct th e st ation with the m inimum n1 cx L + − for this charging and calculat e n detour L becau se in this way t he EV wi ll ha ve a hi ghe r SOC w hen arri vi ng a t th e n ext node. If there exist mor e than one sta ti on s w it h b oth the same min im um n1 n x cx L + −− a nd n1 cx L + − , we select one sta tion ran d omly fro m thes e cha rgi n g sta ti ons a nd ca lc ula te n detour L . Fig . 1 gives an example of how to select the station for c har gin g when the SOC is insu ff icie nt, whe re the green nodes wi thin th e yellow da sh circle, i .e., 1 c , 2 c , 3 c , 4 c and 5 c , are with access i ble cha rg ing stat ion s, w hil e th e sta tio n at 1 d is ina ccessi ble . The gree n no des o n the b l ue dashe d ellipse, i.e., 1 c , 2 c and 3 c , have the smallest n1 n x cx L + −− , and among them 2 c a nd 3 c have the smallest n1 cx L + − . T hus, 2 c and 3 c are bo th the op tim al loc atio n s for th e ch ar gin g, and the E V will ran domly d etour to cha r ge at 2 c or 3 c . C i r cl e w i t h center on and r a di us = m i n( ) Ellip s e w it h f o c i o n and and m a j or ax i s = m i n( ) C i r cl e w i t h center on and r adi us = E V r em ai ni ng dr i vi ng r ange S hor test path l engt h betw een tw o node s N ode w i thout c har gi ng stati on N ode w i th cha r gi ng s tati on B r anch w i th di r ect i on betw een tw o node s Fig. 1 . Diagram o f describing jud ging and computations in EV detouring be ha vio r. C alculate Calcu lating th e for all access ib le charg i ng s tation s Cha rgi ng s tation is acces sible Obtain initial SO C an d route n odes of an EV EV arrives at Ch oos e one detou r random ly Choos e the only available detour Ye s No Calculate Ye s No Ye s No Ye s R ecord + Start sim u lation R ecord a new = + Calculat e Ye s No Let n= 1 Let n= n+ 1 Rou te is com pleted No Rem ai ned SOC can fu lfill the drivin g fr o m to Mu ltiple ch arg ing station s hav e the sam e sm allest Mu ltiple ch arg ing station s hav e the sam e sm allest R ecord + Let = 0 Ye s Let n= n+1 L et =0 R ecord + Rou te is com pleted L et =0 EV does not detou r to char ge E V de t our s t o cha rge No End s im ula tion Select t he m i nim um value from all L as t he o ut p ut Fig. 2 . F low chart of describing EV detouring beha vior for recharging. Af ter d riv ing fr om n x to +1 n x , if the rout e is comp leted , i. e., the c urr ent no de i s N x , we let 0 rest L = , c alcu late 1 i n detour i L = ∑ , the t otal incre ment in drivi ng leng th due to detouring, an d rec ord a n ew 1 i n rest detour i LL L = = + ∑ . If the r oute is no t co mple ted , we le t 1 nn = + and continu e the simulation by repeating t he above d etour ste ps . A t la st, we sel ect th e min imu m va lue min L fro m a ll L as the output an d end si mulation. The abov e des cription of EV d etouring b ehavior is illu st ra ted b y Fig. 2. III. G ENETIC A LGORITHM FOR C HARGING S TAT ION S ITING O PTIMIZATION IN T RANSPORT ATION N ETWO RKS GA is adopted and utili zed to obtai n an op timal cha rg i n g statio n deployment plan in given t ranspo rtati on networ ks wit h EV travel data. In t his s ection, we des cribe our de signs of key steps, i.e., i ni tial ization, s electi on, cross over and mutatio n, of th e GA. A. I ni tializa tion The initial popu lation i s r andoml y g e nerated , wher e a chr omos ome of an i ndi vid ual cons ists of a give n numbe r of the nodes tha t are selec ted from all can didate n odes as char ging st at ion loca tio ns. A ll ind iv idu al s form a se t of c hargin g statio n depl oyment pl ans , aka pop ulat ion in th e GA. Ea c h p lan is u nique in the set, a nd the ser ial number s of node s are sorted i n ascend ing order in an individual’ s chr omosome, ma them atica lly expr ess e d by a vect or. No ne of the c hos en nodes h ave a d uplicat e in th e chromosome. The size of each chr omos ome e quals th e pred ete rmine d number of new st ati ons. B. S election S electi on is the part wher e the new ge nerati o n is sel ected from the old. In this proce ss, the roulette choo sing method is use d. T he proba bil ity of b eing c ho sen for each chromosom e is determ ined by the ir fi t v alu e s. I n our process , a smalle r ( be tter ) fi t va lue br ing s a hi gher pr obabil it y f or the ind ividual to be sel ected as a m embe r of a ne w gen er a tio n , which m ay have mul tip le same ind i vid uals . C. Cross o ver D ur i ng the p rocess of th e GA cr ossove rs, a predet e rm i ned cros sov er pr obabil it y rest ricts the occ urr ence of a cr oss ove r. If a cro ssover hap pens, two individu als’ ch romos omes are random ly selected to perform the opera tion. The mut ual and exclusi v e par t of tw o c hromo some s are collected i nto two separat e pa rt s. The elem ents in the ex clu sive part ar e ran domi zed a nd spli t in to tw o equ all y lon g parts , whi ch l ater ea ch com bin e wi th t he one s et of mutua l e l eme nts to for m two new chromo somes. Th e se n ew c hro moso m es r ew ri t e th e pare nt chr omos o mes in the po pulation fo r t h e purpo s e of m aint ain in g populat ion size. Fig . 3 giv es an exam ple. D. Muta tion Th e mutat ion proc ess c hanges a n ind ivi dual’s chr omos ome, in which sim ila r to th e cros sove r the oc curre nce i s con trol led by a li mi ting probab ility. If an i ndividua l is r e que ste d to mutate, a random node in its chromosome wi ll be replac ed by a new one r andomly selected from the r emaining node cand idates. The po pulation si ze is m ainta ined here . Fig . 4 gi ves a n e xample . IV. C ASE S T UD IE S A. T ra nsport ation Net work Settings and T ravel D emand Ge n eration In this sub section, an assumed transpor tation network with 100 node s and 203 branche s is const ructed to simulate a real - worl d trans po r ta tion n etw ork and v erif y the me thod olo gy proposed in the pr e vi o us text . The genera tio n of grap h obeys the f o l lo w ing cond iti ons : 1) any two bra nches do no t intersect except at nodes, which avo ids addition al nodes; 2 ) the node s and bra nches form a c onnecte d graph, whi ch ensures the connect ivity of th e tr ans po r ta tio n gr id. The network pr ojects to a r egion s izing 30 k m × 3 0 k m. Ea ch o f the n odes is as si gne d an id entit y fr om fou r types of fun ct ion alit ies , i.e ., co mmer c ial are as, in du str ial a reas , resid ential ar eas, and oth er pla ces. As show n in F i g. 6 , 10 0 node s are e v en ly distrib uted into the four categories with n ode s of each type c los ely ga th er in c lus ter. A ll th e 10 0 node s are reg arded as potentia l charging s tation po sitions . Th e leng th s of all the branch es are des igned t o be s mall er tha n 7 km, wh ic h be tter r esembl e s t he roads in urban ar eas. Around 10000 travel r ou t es (ve hi cle t rave l deman d n ot of EVs ) are gene rated with t heir origi ns distr ibuting i n residential, commerci al and i ndustr ial a reas and ot her places with a pro babi lit y of 45%, 30%, 15% , and 1 0%, re s pective ly . A route gener ally include s 2 to 24 n odes. On e n od e only e xists once i n a route, e nsurin g the resem blance of real - world trave l d eman d . The rou te distributio n in general refe rs to the analy si s o f traveling data in May 2016 Beijing. S ee Append ix for r ou te gene rat ion met hod. According to typ ica l E V s on t h e ma rket , the c apaci ty of EV batt er y i s set a s 50 k Wh and a con suming spe ed of 0.25 kWh/km . A corresponding initia l State of C harge ( SOC) o f a n EV is assigned to each r oute. The value i s random between t he SOC r equ ired to compl ete th e rou t e (EV w it h no ch a rging dema nd is usel ess to t he s imu lat ion since a deto ur is not necessa ry) a nd the minimu m SOC th at ens ures t he E V could rea ch th e near es t cha r gin g s tatio n. 4 12 15 16 32 33 40 1 4 12 15 16 32 33 40 17 19 20 22 27 30 39 6 21 26 36 37 46 48 49 6 21 26 36 37 46 48 49 4 12 15 16 32 33 40 1 17 19 20 22 27 30 39 4 12 15 16 32 33 40 6 21 26 36 37 46 48 49 1 17 19 20 22 27 30 39 46 48 49 1 17 22 27 39 6 21 26 36 37 19 20 30 4 12 15 16 32 33 40 4 12 15 16 32 33 40 4 12 15 16 32 33 46 48 49 1 17 22 27 39 6 21 26 36 37 19 20 30 4 12 15 16 32 33 40 40 Or i gi nal C hr o mo so me s Find M u tua l & E xcl usive P ar t s Ran dom ly Split the E xcl usive int o Two E qua l Lo ng P ar t s New Ch romos o mes Reorder Fig. 3. Pro ce ss d iag ram o f c rossove r . 4 12 15 16 32 33 40 6 21 26 36 37 46 48 49 4 12 15 16 32 33 40 6 21 26 36 37 46 48 49 4 12 15 16 32 33 40 6 26 36 37 46 48 49 39 4 12 15 16 32 33 40 6 26 36 37 46 48 49 39 Or i gi nal Chrom osome Random ly Select an Elemen t Random ly Select a New E lemen t Reorder F ig. 4 . Proce ss d iag ram o f mu tation . The number of times that a branch is included by a route is rec orded an d proj ect ed to a c orrespond ing col o r in th e “jet ” colo rbar. W i th red re pre senti ng the highest int ensi ty o f tra ff ic flow whic h is ab out 90 0 pa ssings a nd blue th e low est approx imately 250, Fig. 7 de monst r ate s th e d is tribu tio n o f traveling demand intensity for each branch. B. Results and Anal ysi s We s elect a popu lation of s ize 1500 and s et th e c ro ssover and mutation prob abilit ies as 0. 3 an d 0 .2 respect ive l y. The large pr obabili t y values are d ue to the extr em ely sm all r at io of the popu lation si ze to th e total solu tio n sp ac e, whi ch in clu des about 2.5 ×10 17 solutions . Th e m aximum iteratio n is set as 300 . Calc ula te Fit V alu e Ou tpu t Final Plan Popu lation I n itialization Selecti on C r o sso v e r Mu tation Find the Bes t Indiv idua l and Calcu late BFV If It is the Max im um Iteration ? Ye s No Cho o se t he F i na l I nd i vi d ual from th e Bes t Ind ivid ua ls of A ll Iteration s Fig. 5 . Flow chart of GA . 0 5 10 15 20 25 30 km 0 5 10 15 20 25 30 km Commerce Industry Residence Other Place F ig. 6 . 100 - n ode 203 -b ranch t ransportation ne twork . Chargi ng Stati on Fig. 7 . Branch t raf fic f lo w d ensity b ased on the g enerated r outes. 0 50 100 150 200 250 300 Iteration 7.1 7.2 7.3 7.4 7.5 7.6 7.7 7.8 7.9 Fit value 10 4 Fig. 8 . Best f it value s in all iter ations . Fig. 8 show s th e b est f it va lue in e ach it era tion , f rom w h i ch we can s ee that t he va lue decline s fas t before the 100 th iteration and tend s to con verge a fter t hat . T he b est f it valu e gen erat es af ter the 250 th iter ati on and the cor respondin g s t at io n depl oyment pla n i s sign if i ed by red circl e s in Fig . 7. The b ig sol u tio n space is the ma in facto r of t he slow converge nce ra te . From th e fi nal s ta ti on s itting plan, it can be obse rved th at most stations a r e l ocat ed a t the nodes with h igh t raf fic flo w or s ervin g as a hub of a sm al l reg ion . For e xam ple , t w o st ati ons are set in t he bottom rig ht cor ner of the networ k be ca us e th i s area is far from the ma in part . The code of our me tho d i s ed ited and run in M ATLAB 20 18 enviro n ment on a n i Mac w ith an Inte l C ore i5 p roces s or and 8 GB rand om - access memory . For o ur settings, each iteration costs less th an 1 m inu te an d the e nt ir e pr ocess tak es 4 to 5 h ours. V. C ONSLUSIONS In th is wo rk, we fi rst propo se a me thodology of de sc r ib ing the EV detour - to - rec harge behavi or w here a ne w ind ica tor is created to e valuat e EV c hargi n g station pl anning . Secon d, w e come u p with an EV cha rging statio n plann ing met hod usi ng this indicat or base d on GA . Fin all y, an assum ed t ranspo rtat ion ne two rk is formulated sim ilar to that of a full f unctional city, so th at th e re sul t can be c los e to th at of a real case as possi ble. T he fin al p lan sh ow s that sta tion s a re pr eferr ed to be l oc ated in areas with h igh tr af fic flo w and at distant places. In fu tur e wo rk , the computation eff iciency an d larg er net work optimization will be put on th e agen da. A P PE ND IX : R OUTE G ENERAT ION In this subsection, the generation of rou tes in a transpo rtation network is introd uced. Before generat ing a route, an or igin are a, wh ere the ori gin node lo cates in, and a de stina tion ar ea, wh ere the d estina tion node locates in, shou ld be p rede term ined . We g ener ate the no des o f a rout e fro m th e orig in t o the des tinat ion th rough adding next su ita ble nod e to a route. Fir st, a node is r andom ly sele cted from the or ig in are a a s the fir st node of a rout e. The last node i n a rou te is regard ed as t he cu rre nt no de (a t fir st, th e ran do mly sele cted nod e is s et as the current n ode) to generate the ne xt nod e. Before generat ing the next node of a rout e, an exam ination is conduc ted and sho w wh ether thi s rou te ha s met req uire ments . Thr ee re quir ement s are s e t: 1) if t he last node has been in the destination area; 2) if the length of the route is between the maximum and minimu m boundar ies; 3) if the route is different from any already gen erat ed rout e. Only when an sw ers of th e above th ree requ irem ent s are all “ Yes”, the rou te is l abeled a va lid one. For a va lid rou te , it w ill b e pu t in to the r ou te po ol and ther e is a given proba bility for it to con tinue genera tio n of ne w node s (note that if a ne w node i s added to a valid r ou te, the r oute may become invalid agai n ); otherwise, if t h e route’s l ength is la rger than the maximum boun dary, the ge nerated wil l be terminate d, and e lse , it is m andat ory t o ge nera te new n odes. While gener ating the next no de for a rou te, based on t he current nod e and othe r gener ated node s, we extract the eligible nodes set, in which any node can be the nex t node, from the whole nodes in the n etwor k acc ording t o the foll owing t hree c rit eri a: 1) t h e node is con nect ed to the c urrent n ode b y a branc h; 2) the no d e lies wi thin the a s pecial area (ex p lained in t he next pa ragraph) defined by the current node a nd the d estinat ion area; 3) the node has not bee n visite d before, i.e. , the n ode is dif fer ent fr om any n ode whi ch has be en in t he ro ute, that is, a rout e incl u ding a ri ng is n ot c onside red. Al l nod es satis f y these three crite ria will be put into the eli gibl e n odes set . T he fi nal next node wi ll be sel ected r ando mly fr om this s et. If the s et is empt y, th is gen erat ion w ill be stop ped. The Flow ch ar t of the g ener ati o n i s shown in Fig. A 1. Start Route Generation. Let i =1. Randomly Select A Node from Origin Area as First Node of Route i . Put Route i into Route Pool. Set Last Node of Route i as Current Node. Check If Route i has met Requirements. Check If Length of Route i Exceeds Maximum Boundary . No No Ye s Judge If to Continue Generation of New Nodes Appended to Route i (Based on A Predetermined Probability). No Let Route i +1 Be Same as Rou te i . Let i = i +1. Ye s Generate Special Area According to Current Node and Destination Area. Extract Eligible Node Set For Next Node. Check If Eligible Node Set Is E m p t y. No Select Next Node Randomly From Eligible Node Set And Add It T o Route i . Let i = i +1. Ye s Ye s F ig . A1 . Flo w c hart o f r oute g eneration . Th e speci al are a is deter mine d by the locati ons of the cur ren t nod e and the d es tina tion are a. Fir st, we id en tify the c ir cum sc ribed rectang le o f the de stin ation ar ea. Th en we d ivid e the s ur rounding area of the d estination a rea int o 8 par ts, as Fig. A2 shows. Whe n the curr ent node l ies in one of the 4 c orner surround ing area s , i.e., are as I, III , V, and VII, con nec t the current no de and three ver texes o f th e circ ums cribed re ctang le wh ich ar e the farthe st from th e current node to form a quad ril atera l as the spec ial ar ea. As Fig. A2 shows, w e connect the r ed cur rent node , D1 , D3 an d D4 (the re d quadr ilat eral s i n Fig. A2 ) . When th e cu rre nt node li es in othe r fo ur surroundin g areas , i.e., areas I I , IV, VI, and VIII, connect the current node and four vertexe s of the circ umscr ibed rectan gle t o form a pentagon as t he sp ecial area ( the blue pentago n in Fig. A2 ). I II III IV V VI VII VIII Nodes of Destination Areas Two Examples of Current Nodes Two Examples of Special Areas Vertexes of Circumscribed Rectangle of Destination Area D 1 D 2 D 3 D 4 Fig. A2 . Diagr am of speci al a rea s (c urrent node s outside the circumsc ribed rectangl e ). I II III IV V VI VII VIII D 1 D 2 D 3 D 4 Nodes of Destination Areas Example of Current Nodes Four Potential Special Areas Vertexes of Circumscribed Rectangle of Destination Area Fig. A3 . Diag ram of special area candidates (current node inside the circumscribed re ctangle). When the current node lies in the circ umscrib ed rect angle , we connec t the current node wit h th re e of f our v ertex es of destina tion node, and to tally fo rm four q uadri later als. Fig. A3 shows the four quad rila teral s : conn ecting the current no de , D1, D2 and D3 ( the gr een quad rilat eral s i n Fi g. A3 ); conn ect ing the current nod e, D1, D2 and D4 (the blue qua dr il ate ral s in Fig . A3 ) ; connect ing the current n ode, D 1, D3 an d D4 (the red quadrilate rals in Fi g. A3 ) ; conn ecting the current nod e, D2, D3 and D4 (the o range q uadr il ater al s in F ig. A3 ) . Then w e extr act the quadr ilaterals wh ich contain s over 40% of th e de st ina tio n area no des ( at least two quadrilate rals) and randomly c hoose one as the speci al are a. R EFERE NCES [1] T. Semih and S. Se yhan , “A mult i - criteri a factor eval uati on mo de l fo r gas sta tion si te sele ction ”, Journal of Gl obal Man agement , vol 2, n o. 1, 2011. [2] M. A slani and A . A. Ales heik h, “Si te se lect ion fo r smal l gas st at i on s usin g G IS”, S cien tifi c Res ear ch and E ssays , v ol . 6, no. 15 , pp . 1361 - 3171, 20 11 . [3] T. Sw eda and D. Kl abj an, “An ag ent - based d ecis io n sup port s ystem for electri c vehicle c harging infr astru ctu re de ployme nt,” in Proc. IEEE Vehi cle Pow er and Propul sion Con f . , 2011 . [4] W. Yao et al. “ A mult i - objec tive c ollabor ative pla nni ng str ate gy for inte g r ated power dis trib ut io n and electr ic veh icle c hargi ng syst ems,” IEE E Trans . on P ower Sy s. , vol. 29 , no. 4, pp . 1811 – 1821 , 2014 . [5] A. Ip, S . F ong, a nd E . Li u, “Opt imizati on fo r all ocati n g BE V r ec ha rging sta tion s in ur ban ar eas by u sin g hi erar chical c lusteri ng ,” i n Proc. 6th In t. Conf. Advanced Inf. Mana gement and Servi ce (IM S) , Seoul, K orea, 201 0. [6] J. Don g, C. Liu , a nd Z . Li n, “C har gin g infr astruc ture plan ning f or prom oti ng b att ery elec tri c vehi c les: an activi ty - ba sed approa ch us ing mult iday tr avel dat a,” Tra ns port ati on R esearch P art C: E merging Techno logie s , vol. 38, pp . 44 -5 5, 2013. [7] S. Pay am, R. Abbas , and K. Hos ein , “Op timal fa st char ging s tati on placin g and sizin g,” Ap plie d E ner gy , vol . 12 5, p p. 289 - 299, 2014 [8] Y. X iong et al. “Optim al elec tric vehicle charg in g stati on placem ent,” in Pro c. Twen ty - Fourth Inte rnational J oint Co nference on Ar tifici al I ntell igenc e , 2015. [9] Y . Li , P. Zha ng, and Y. Wu , “ Public rechar ging inf rastr ucture loca tion strateg y for promo ting electr ic vehicles : A bi - level pro gramm ing approa ch ,” Journal of Cleane r Production , vol . 172, pp. 2720 - 2734 , 2018. [10] S. B ouguerr a . and S. B. L ayeb , “ Det erminin g op timal depl oyme nt of electri c vehi cles c hargin g statio ns: C ase o f Tunis City, Tu nisia ,” Ca s e Stud ies o n Trans por t Pol icy , vol . 7 , no. 3 , pp . 628 - 64 2 , 2019. [11] H . Chen, Y. Jia, Z . Hu, G . Wu, a nd Z .-J. M. Sh en. “ Data - dri ven plann ing of plug - in h ybr id elec tric taxi c harg ing sta tions in ur ba n envir onme nts: A case in the ce ntral ar ea of Beij ing ,” In Pro c. 2 017 IEE E PES I nnovativ e Smart Gr id Tec hnol ogi es Co nference Europe ( ISGT - Eur ope) , 2017.
Original Paper
Loading high-quality paper...
Comments & Academic Discussion
Loading comments...
Leave a Comment