Eco: A Hardware-Software Co-Design for In Situ Power Measurement on Low-end IoT Systems
Energy-constrained sensor nodes can adaptively optimize their energy consumption if a continuous measurement exists. This is of particular importance in scenarios of high dynamics such as energy harvesting or adaptive task scheduling. However, self-m…
Authors: Michel Rottleuthner, Thomas C. Schmidt, Matthias W"ahlisch
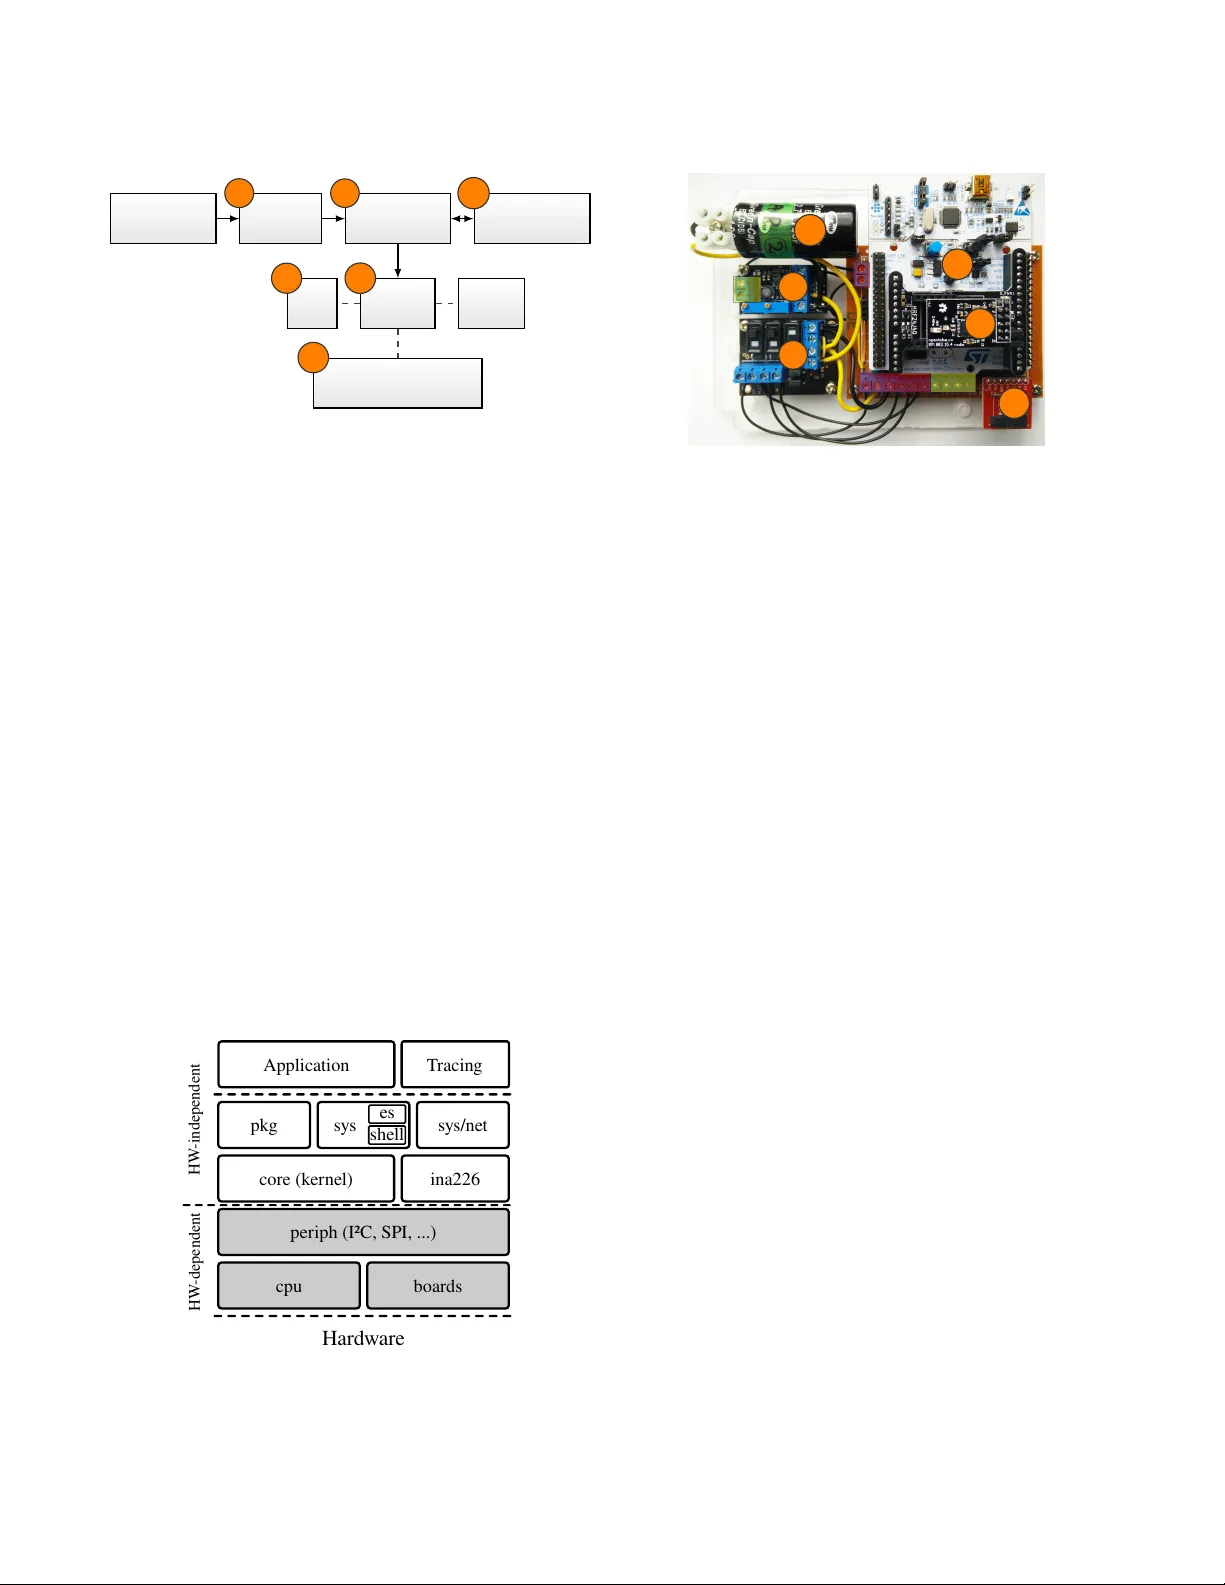
If you cite this paper , please use the ENSsys reference: Michel Rottleuthner , Thomas C. Schmidt, and Matthias Wählisch. 2019. Eco: A Hardware-Software Co-Design for In Situ Power Measurement on Low- end Io T Systems. In Pr oc. of the 7th Int. W orkshop on Energy Harvesting & Energy-Neutral Sensing Systems (ENSsys ’19) , ACM, 2019. Eco: A Hardwar e-Soware Co-Design for In Situ Pow er Measurement on Lo w-end Io T Systems Michel Rottleuthner HA W Hamburg michel.rottleuthner@haw- hamburg.de Thomas C. Schmidt HA W Hamburg t.schmidt@haw- hamburg.de Matthias Wählisch F U Berlin m.waehlisch@fu- berlin.de ABSTRA CT Energy-constrained sensor nodes can adaptively optimize their en- ergy consumption if a continuous measurement exists. This is of particular importance in scenarios of high dynamics such as energy harvesting or adaptive task scheduling. Howev er , self-measuring of power consumption at reasonable cost and complexity is unavail- able as a generic system ser vice. In this paper , we present Eco , a hardware-software co-design enabling generic energy management on Io T nodes. Eco is tailored to devices with limited resources and thus targets most of the up coming Io T scenarios. The proposed measurement mo dule combines commo dity components with a common system interfaces to achieve easy , exible integration with various hardware platforms and the RIOT Io T operating system. W e thoroughly evaluate and compare accuracy and overhead. Our ndings indicate that our commodity design competes well with highly optimized solutions, while being signicantly more versatile. W e employ Eco for energy management on RIO T and validate its readiness for deployment in a ve-week eld trial integrated with energy harvesting. CCS CONCEPTS • Computer systems organization → Embedde d systems ; • Hardware → Energy metering . KEY W ORDS Energy harvesting, power measurement, Io T 1 IN TRODUCTION Energy is a scarce r esource in the constrained Internet of Things (Io T) of independently powered nodes, many of which need to balance tasks with the amount of energy available for sustaining operation over their targeted lifetime. Software development paradigms for these Io T systems recently shift away from static bar e-metal code towards exible , platform independent applications that oer reusable functionality . Nonethe- less, building energy-aware systems is still a task that requires de- velopers to deeply engage with many low-lev el, platform-specic details. Partially this arises because energy availability and power consumption are much more dynamic than system properties such as processing and memory resources. Energy le vels uctuate, in par- ticular on nodes that harvest energy from environmental sour ces. This makes it crucial for a system to track its power input and consumption, so that runtime tasks can adapt to energy availability quick and eectively . Energy harvesting describes a process where the output of typi- cally weak power sources is collecte d and stor ed until a sucient amount of energy is available to perform a desired task. In the con- text of low-end Io T networks, energy har vesting allows for building independently powered systems with the potential to sustain per- petual op eration, thereby increasing performance and reducing maintenance cost [ 4 ]. Because of the volatile nature of common energy sour ces, energy harvesting demands for management mech- anisms to eectively use energy and avoid system outages. Tracking, contr olling, and optimizing energy consumption de- pends on many aspects and quickly be comes complex. Therefore, simulations combined with prior external measurements are often applied to estimate power ows. However , for systems that are subject to varying operational or environmental conditions, it is often infeasible to rely entirely on a priori lab testing. Simplied models and error-pr one parameter estimators imply further inaccu- racies. Accurate information about actual deployment conditions are required instead. For those reasons in situ measurement is a ke y strategy to obtain real-world data. For this a generic o-the-shelf solution is desired that is p ortable, reusable, and covers various settings of software and hardware components. M ea s u r e m en t M o d ul e C o m m o d it y Ha rd w a re T i m e I2 C Common system calls C P U L o a d p e r T h r e ad S o f t w a re P o w e r C o n s u m p t i o n T i m e P o w e r C o n s u m p t i o n T i m e Figure 1: Eco measures energy in situ by monitoring power sources and consumers. In this paper , we intr oduce Eco , a hardware-software co-design enabling generic energy management on low-end commodity Io T devices (see Figure 1). As a generally applicable approach, Eco is based on two key principles. First, it connects a simple external measurement mo dule via the standard I 2 C interface which is widely available on all targeted microcontrollers. Only the control pins require connecting and the power supply line nee ds to be routed through this module. Se cond, it uses platform-indep endent software interfaces that allow for an easy change of microcontroller boards without any need of software adaptation. In detail, we contribute: Michel Roleuthner, Thomas C. Schmidt, and Mahias Wählisch • A novel key component enabling energy management on autonomous Io T nodes that are battery-driven, have few kilo- bytes of memory , and MHz of CP U power . • An implementation of Eco in the IoT operating system RIOT that fosters deployment, and allows for online energy evalua- tion of individual tasks and threads. • An evaluation of Eco including its cross-platform validation and the detailed quantication of errors and overheads. • An extensive r eal-world deployment within an energy har- vesting system as a comprehensive proof of concept of the vertical integration of hardware and softwar e in the eld. Eco outperforms the current state-of-the-art. The closest related results from the literature [ 11 ] focus on the plain measurement problem without higher level system integration. This spe cialized, component-free approach has lower current measurement accuracy (them 10% vs. Eco 1%), lower resolution (them 10 µ A vs. Eco 1 . 25 µ A ), but lower energy ov erhead (them ≈ 0.05% vs. Eco ≈ 1%). It consists of a few commodity components, only , and allows for measuring current and voltage over adjustable ranges and with exible sampling rates. Hence , it is easy to reproduce and can be attached to a large variety of Io T boards. The remainder of this pap er continues with discussing the energy management problem together with related work. The design of our measurement module in hardwar e and software is pr esented (§ 3), followed by a thorough evaluation (§ 4). W e report on our deployment experiment and the lessons learned thereof (§ 5). Finally , we conclude with an outlook in Section 6. 2 THE PROBLEMS OF DYNAMIC ENERGY MANA GEMEN T AND RELA TED WORK Any approach to managing energy on constrained devices relies on accurate knowledge of the actual conditions. Overestimating the available energy may quickly put a node out of service, underrating energy may hinder its operational utility . In a variable, dynamic setting it becomes important to obtain a thorough understanding of the various energy ows, including the consumption of dierent application tasks and potentially available inows. The key problem of dynamic energy management arises from the diculty to determine power consumption timely , with su- cient accuracy , and at tolerable overhead. Methods for quantifying consumption include theoretical or (semi-) empirical estimation, simulation of simplistic models, as well as e xternal or online self- measurements. Pr evious work on measuring consumption of nodes typically focuses either on local lab setups for very accurate moni- toring or very light-weight in situ evaluation. 2.1 Simulation and Estimation of Power Consumption Software approaches r ange from simulation of large scale sensor networks [ 25 ] to estimations based on oine reference measure- ments [ 8 , 10 ]. The prediction accuracy of the power consumption and battery lifetime is signicantly aected by its level of abstrac- tion [ 19 ]. Neglecting low-level system ev ents such as scheduling and timer related interrupt handling can lead to substantial er- rors be cause they often account for a relevant part of the p ow er consumption. Consumption simulation can be performe d from a generic high level perspective [ 1 ] down to estimating CPU cycles [ 25 ] or even on the instruction level [ 29 ]. The full control over relevant system parameters eases isolate d analysis of individual aspects. Down- sides relate to the inaccurate reproduction of reality due to envi- ronmental changes, varying hardware tolerances, and many other dynamics. Even if conditions and hardware are exactly the same, dierent device instances can exhibit signicant variations in their consumption [ 20 ]. Also, simulations mainly focus on improving a priori adjustments, leaving runtime optimizations open to other solutions. Dunkels et al. [ 8 ] developed Powertrace, a software solution to allow network le vel proling of applications for Contiki [ 9 ]. It feeds static values from oine measurements into a linear power model. This light-weight software-only solution has many benets compared to hardware solutions. Unfortunately , it does not apply to dynamically powered systems such as Energy-Harvesting systems with varying supply voltage. It is also unsuitable when the individ- ual consumption of the various components are tied together with non-linear dependencies. Estimating the energy consumption online allows incorporating more runtime specic criteria from actually tracking the system states [ 8 ]. As an example, energy usage caused by packet retransmis- sions can be accounted with higher accuracy , if the exact number of transmissions is known and considered at runtime. While this var y- ing size can be easily determined in software, other changes such as the eciency of various electric comp onents are more challeng- ing to estimate. Incorporating runtime information on the actual consumption as feedback for the energy management algorithm was already shown to impr ove application lev el performance and robustness against uncertainties [13]. 2.2 Measuring Power Consumption A core problem of measuring the power consumption of Io T nodes comes with the heavily varying power demands required by the dierent power states of the micro controller unit (MCU). These can span over ve orders of magnitude [ 14 ]. Additionally , the mea- surement itself should have little to no side ee cts on the observed system. Combining both introduces further complexity . External Observers. Many systems were designed as external observers to record detailed behavior of the sensor node. The un- derlying architectures range from Linux-capable systems based on single board computers which cannot be deploy ed in the eld [ 16 , 21 , 22 , 26 , 27 ], to small add-on boards that ar e e quipped with ad- ditional hardware like an MCU [ 24 , 32 ] and in some cases also eld programmable gate arrays (FPGA) [ 24 , 28 , 31 ]. Energy-Harvesting is specically targeted by custom mobile measurement platforms to even allow observation of multi source harvesters [ 26 ] and by providing tools to record and replay harvesting conditions [31]. With Ro cketlogger , Sigrist et al. [ 26 ] introduce d a portable device intended to provide a balance between top notch lab equipment and mobile measurement. The platform provides four v oltage and two current channels besides the option to interface digital sensors for additional environment metering. Though, the device is base d on a BeagleBone Green that alone consumes 7 mW in deep sleep mode Eco: A H W -SW Co-Design for In Situ Power Measurement on Low-end Io T Systems and multiples of 100 mW when active. Thus, long term o-grid deployment is out of scope. Kazdaridis et al. [ 16 ] use classic shunt metering with two re- sistors in series. For dynamic switching, a load switch bypasses the measured current around the high resistance when the burden voltage becomes to o high. The switch is controlled by an analog high spe ed comparator . The measurement module is interface d over I 2 C by a BeagleBone Black, which introduces power consump- tion of 8 . 7 mW to 14 . 2 mW , still ignoring two additionally needed operational ampliers. Continuous measurement without MCU interaction are not possible with the module, because no internal sampling buer or averaging is available. FlockLab by Lim et al. [ 21 ] targets distributed tracing and prol- ing. Only a single shunt is used and linear regression is utilized for calibration. Additional focus is laid on precise time stamping with an accuracy of around 50 µ s to correlate events of dier ent nodes. They also use hardware with relatively high computational pow er based on a 624 MHz CP U with 128 MB of RAM, disqualifying it for in-situ usage. Self-Measurement. A typical way to keep track of the energy ow on the no de itself is to utilize coulomb counters. While the temporal resolution is high enough to assess the state of charge, it is insucient to attribute energy usage to specic tasks or periph- eral hardware. T o overcome this issue, custom har dware for faster sampling is required. When the measurement function is implemented within the Io T device itself, it is crucial to know the overhead that is associate d with the measurement. This overhead concerns power usage of the measurement circuit, memor y usage, and CP U time allocated to performing measurement and calculation. The power measurement based on voltage to frequency conver- sion introduced by Jiang et al. [ 14 ] is suited to b e directly deployed together with a sensor node. The system called SPOT leverages a voltage to frequency based digitization pr ocess to overcome a lot of the previously describ ed measurement challenges. While this solution keeps processing overhead low for infrequent reading, it is high for fast sampling. Furthermore, the discrete components require around 1 . 7 mA , which introduces overhead that conicts with battery powered nodes in the eld [11]. An implementation by Dutta et al. [ 11 ] simplies SPOT by es- sentially eliminating the need for any hardware if the platform is powered by a switching regulator . With this, a resolution down to the 1 µ J scale is achieved while staying within a ± 20 % error mar- gin. By using an MCU-internal counter peripheral a read latency down to 15 µ s can b e achieved, leading to a power overhead of only 0 . 01 % to 0 . 1 % . Shortcomings of the solution are related to inherently high manufacturing tolerances for inductors (around ± 10 % ), the frequency dependent pow er o verhead, and that the v olt- age is assumed constant instead of being actually measured. Other approaches either use highly sp ecialized FPGA implementations for the measurement task [ 2 ], or indirectly assess the consumption by measuring voltage changes at the energy storage element [23]. 2.3 Attributing Energy to Software The software running on a wireless sensor node denes how energy is spent, e.g., by issuing a sensing cycle or requesting the hardware to transmit data. As resources such as CP U, RAM, or hardware peripherals are dynamically shared b etween a multitude of soft- ware components, attributing the exact amount of used energy to the correct software instance is challenging. Therefore, the main problem in this domain is correlating power consumption with the executed software. The granularity and constraints for such attribution mechanisms vary a lot depending on the targeted area of use. For operators of data-centers it may be enough to know how much energy is used per virtual machine and a little overhead is basically negligible. On mobile devices the constraints are already much tighter and attributing energy to individual applications is crucial, e.g., to pre- vent faulty ones from draining the batter y . T ypical low-end Io T devices further tighten the room for overhead and the granularity is scaled down to smaller entities such as threads, specic tasks or even single function calls. The simplest base metric for power usage correlation is utiliza- tion , derived from the time a thread occupies the CP U. A much more accurate measure to assess CPU-utilization and correlated power consumption is based on monitoring CP U-internal performance counters [ 3 ]. With p T op [ 7 ], an implementation for desktop-scale devices was shown that uses this information to attribute power consumption to running processes. Further accuracy improvements to online estimations can be achieved by tracking pow er states of individual components. For TinyOS, Kellner [ 17 ] uses a common model to estimate the overall power consumption which is then attributed to dierent individual TinyDB queries with the help of resource containers. Fonseca et al. [ 12 ] augment the tracking of component p ow er states with real power measurement and activity tracking to allow ne-grained oine analysis of energy usage. As TinyOS does not provide threads by default, both solutions introduce abstract entities ( i.e., activities and resource containers) to which the energy use is attribute d. This allows grouping seman- tically related resource usage and ther eby improves its high level visibility to the developer but requires additional instrumentation of the target application. T able 1 gives a brief qualitative overview on the discussed work. In the following sections, we introduce a exible measurement setup that uses readily available parts and is easy to integrate over an I 2 C bus. It spans a wide congurable measurement range, provides dierent sampling rates and is compatible with common Io T Plat- forms. Using various congurations the accuracy is veried with reference measurements. A dditionally , the ov erhead ( i.e., invasive- ness) induced by the measurement action itself and communication with the module is analyzed to show what cost is tied to more ne-grained energy proling. The results can b e used to choose an appropriate measurement conguration for specic use cases by weighing between tolerable overhead and additional granularity . 3 IN TEGRA TED ENERGY MANAGEMEN T: DESIGN AND IMPLEMEN T A TION The integrated hardware-software co-design is outlined in the fol- lowing. First, a exible modular har dware platform is introduced. Figure 2 shows the abstract har dware architecture consisting of a wireless sensor node and a power subsystem. The power subsystem Michel Roleuthner, Thomas C. Schmidt, and Mahias Wählisch T able 1: Comparison of related work V ariant In situ † Adaptive Physical Measurem. Portability Measurement Control Power TOSSIM [25] ✗ ✗ ✗ ✗ Oine Simulation Kazdaridis et al. [16] ✗ ✗ ✓ ✓ Passive HW Interface Rocket Logger [26] ✗ ✗ ✓ ✓ Time-triggered Logging FlockLab [21] ✗ ✗ ✓ ✗ Time-triggered Logging A VEKSHA [28] ✗ ✗ ✓ ✗ Time-triggered Logging Powertrace [8] ✓ ✓ ✗ ✓ Programmable Tracing Kellner [17] ✓ ✓ ✗ ✓ Container Tracking SPOT [14] ( ✓ ) * ( ✓ ) ✓ ✓ Passive HW Interface Nemo [32] ( ✓ ) * ( ✓ ) ✓ ✗ Time-triggered Logging iCount [11] ✓ ( ✓ ) ✓ ✗ Passive SW -Interface Quanto [12] ✓ ( ✓ ) ✓ ✗ Event-triggered Logging Eco ✓ ✓ ✓ ✓ Thread Tracking & Programmable Tracing † Referring to usability in o-grid in situ deployments ( i.e., some of the solutions marked as unsuitable may still be usable for wired in situ) * depending on sucient power supply (refer to T able 3 for details) includes a power source , modules for charging and measurement and an energy storage element. The node itself is built as a fully modular combination of MCU, radio transceiv er , sensors and per- sistent data storage. In the second part, we discuss the RIOT software integration of energy measurement primitives. RIOT is an open source operating system for constrained Io T devices focusing on op en network stan- dards and well-known programming interfaces. Software sitting on top of the RIOT operating system can be moved to other plat- forms without requiring changes to the source code thanks to its extensive hardwar e abstraction. It supports multi-threading with priority based tickless scheduling. A major benet of using RIOT comes with portability and extensive librar y and driver support. Thereby it enables fast development of highly modular and loosely coupled application designs leveraging reusable co de that is not tied to specic hardware. T wo orthogonal concepts are implemented for the online mea- surement that pr ovide dierent trade-os between integration com- plexity and accuracy . T o add energy awareness to new applications, we provide an API to explicitly gauge the energy consumed on an individual task base i.e. for predened code-se ctions. A dditionally , we implement an extension to the OS scheduler to provides energy statistics on a per-thread level. With this implicit consumption at- tribution to software entities, the system can even provide energy usage information without requiring any changes to the application code. 3.1 Hardware The hardware is composed of an o-the-shelf e valuation board, a super capacitor as energy buer and a measurement mo dule to quantify the charging and discharging rate . The entire setup is built as an orchestration of independent mo dules. All of them can be exchanged, which leaves the design e xible regarding the selection of specic components. T o r epresent typical Io T use cases, an IO- interface serves connectivity to external peripherals like sensors for data acquisition. A network uplink is provided by an IEEE 802.15.4 module base d on the A T86RF233 radio chip. When there is no network access available, a micro-SD card provides cost eective persistent storage for long term data logging. A bare development board with the low-power STM32L476 MCU is used as base. But the setup is not tied to this sp ecic development board, as we will show later . Using a bare development platform facilitates the use of dierent radio modules, voltage regulators, energy storage elements, or sensors, while keeping low level control. Analyses of specic component properties is thereby simplied. For the power measurement we design a congurable, yet simple module with the T exas Instruments INA226 shunt monitor . It is interfaced via I 2 C and allows changing the slave address to use more than one module in a single setup. With a xed maximum burden voltage of 81 . 92 mV the measurement range can be man- ually switched based on three dierent shunt resistors for simple adaption. Enabling a high dynamic range can b e achieved by us- ing an additional module with a higher value shunt resistor in combination with a bypass switch as shown in [16]. The assembly of all interconnected parts for the deployment- ready Energy-Harvesting system are depicted in Figure 3. The bare development board A with the external IEEE 802.15.4 radio de- vice B on top is plugged into an interface board which in turn provides connection to persistent storage via a micr o-SD slot C , the power subsystem and various external sensors. A 100 F ( 2 . 7 V ) super capacitor D in combination with a custom photovoltaic charging circuit E and the previously introduced measurement module F form the external modular power subsystem. All com- ponents like the radio, micro-SD card and external sensors can be powered down completely by individually switchable transistors. These are integrated on the interconnect-board below the MCU and are controlled by plain GPIO control. 3.2 Integrated System Software Integration into RIOT is achieved by providing a peripheral driver for controlling the INA226 over I 2 C via the respective interfaces of the hardware abstraction lay er . Apart fr om raw register access the driver provides functions for conv ersion to physical units and calibration. Required calibration values are gathered by connecting a trusted refer ence multimeter and the measurement module to the same load of a test application. The calibration is enabled by then feeding the values into compile time conguration. W e extend the simple command line interface of RIOT with an additional command named es . It builds on top of the existing ps command and adds information on power draw and energy consumed per thread, similar to the default statistics like stack usage and context switching count. The logic for that is implemented with a separate background thread that controls the measurement, reads samples from the external module, and p erforms required calculations. By that, the thread priority control of the OS can be used to adjust between precise timeliness of the measurements and less invasiveness. The attribution schema splits the samples according to the time each thread was active and accounts it to the dierent involved threads. This appr oach has the benet that not a single line of code needs to b e changed to give an overview on energy expenditure by Eco: A H W -SW Co-Design for In Situ Power Measurement on Low-end Io T Systems Power Source Converter Measurement Energy Storage MCU TX Sensors Persistent Data Storage A B C D E F Figure 2: Model of energy harvesting wir eless sensor node with self-measurement of power consumption A B C D E F Power interface Sensor IO PV Figure 3: Mounting plate with interconnecte d modules of the energy-harvesting system dierent parts of the application. How ever , depending on applica- tion properties this method may be inaccurate. Energy consumed by threads that trigger an action of high energy demand and then go back to sleep immediately , cannot be evaluated very accurately by this approach. T o overcome this limitation, a tracing mechanism is implemente d to let an application explicitly r ecord energy traces of specic tasks dened by the developer . T racing can be controlled by the interface calls trace_start() and trace_stop() . It may r ecord a full series of energy samples or return a single aggr egated value. Using this tracing, an application can re-evaluate its energy use per task in varying conditions like ambient temperature, state of charge, or degraded component health. When the measurement function is not in use, the module is put to a low-power mode and consumes less than 2 µ A . Figure 4 visualizes a simplied RIOT software stack that inte- grates the aforementioned components. The dashe d line in the middle separates the stack into hardwar e dependent parts on the bottom and hardware independent parts above. The lower line il- lustrates the border between OS modules and the specic hardware it is running on, and the upper line splits user- or application-code from the OS. In particular , the driver of the INA226 is situate d HW -independent HW -dependent H ar d w ar e pk g s y s s y s/ne t c or e (k er ne l) ina226 per iph (I²C, SP I, ...) cpu boar ds she ll e s Applic a t ion T r acin g Figure 4: RIOT module architecture with integrate d es com- mand and application level tracing on top of the hardware abstraction and is thus available on every platform that supports I 2 C. The es command is implemented as a sys component using the shell mo dule. Next to the application the explicit tracing mechanism resides as an independent module. 4 EV ALU TION OF IN SI T U MEASUREMEN T W e validate Eco on four largely diverse MCU-platforms and evalu- ate measurement accuracy and introduced overhead. In particular , the conguration of the physical communication layer and runtime settings for the shunt monitor are considered. Relevant adjustments regarding I 2 C communication are the clock speed and the selection of suitable pull-up resistance. Increasing the clock speed reduces the time spent for communication but demands for low er resistances to actually achieve the faster switching times. On the other hand, the lower resistance raises the power loss for the time in which the signal lines are held lo w . Apart fr om the electrical properties, we analyze the impact of mo dule parameters that are adjustable at runtime. For this, the sampling rate related settings consisting of conversion time and averaging are examined in dier ent com- binations. Conversion time her e refers to the duration of a single internal sampling step that may then be additionally averaged be- fore being processed as a sample on the MCU. Setup. A Keithley DMM7510 bench multimeter is employed as an accurate ground truth for reference measurements. T o ensure high accuracy , all measurements are performed after the 90 min warm-up period of the multimeter and an auto calibration cycle is performed in advance. Measurements are repeatedly executed using automated scripts leveraging the remote control features of the employed bench multimeter and p ow er supply (Siglent SPD3303C). Accordingly , the sensor node is controlled by a custom RIOT -shell interface that can start test runs and handles conguration of all runtime parameters. 4.1 Measurement Errors Errors of the measurement and digitization process itself are quan- tied by comparing results for measurement of the same variable metric between the device under test and the multimeter ground truth values. The digital resolution is deduced from values given in the data sheet combined with the properties of the shunt resis- tor . Factors that contribute to the sampling latency ar e described Michel Roleuthner, Thomas C. Schmidt, and Mahias Wählisch 0.2 0.4 0.6 0.8 1.0 1.2 1.4 1.6 1.8 2.0 Supply Current [mA] 0 . 0 0 . 5 1 . 0 1 . 5 2 . 0 2 . 5 Measurement Error [%] Figure 5: Relative measurement error at constant load with 332 µ s bus/shunt conversion time and 16 avg. steps (IQR: 25th-75th percentile, whiskers: Q1-1.5*IQR and Q3+1.5*IQR) 0 10 20 30 40 Supply Current [mA] 0 10 20 30 40 Measurement Deviation [ µ A] Linear Fit Measurement Deviation [ µ A] Figure 6: Absolute measurement deviation in 40 mA range at constant load (2.5th to 97.5th percentile) further down in Section 4.3. For this we focus on the o verall time needed for reading measurements without considering interrupt latency separately . The bare interrupt latency is platform specic but insignicant compared to the read duration. 4.1.1 Accuracy . T esting the accuracy of the measurement is done using a xed resistor as static load. The applied voltage is varied for dierent current values. Measurements of the device under test and the reference are run simultaneously and repeated 1000 times. Figure 5 shows the distribution of the relative errors for cur- rent measurements ranging fr om 200 µ A to 2 mA . The successive increase towards the lo wer end of the scale is attributed to bigger relative impact of noise and the digitization resolution. For loads of 200 µ A the median error stays very close to 1 % , which is well suited for self measurement. Currents higher than 1 . 8 mA are much more stable around a median of 0 . 5 ‰ . Extending this measurement up to the full range of 40 mA (for the selected 2 Ω shunt) conrmed that the pattern of negligible deviation stays true for higher currents, as can b e seen from the absolute measurement deviation shown in Figure 6. The plot also highlights that a function for error com- pensation can be derived with a simple linear t. W e refrain from implementing that for now b ecause the absolute measurement error has no signicant impact. 4.1.2 Resolution. The voltage resolution has a xed value of 1 . 25 mV by design. Current measurement resolution depends on the active shunt resistor value ( R s h u n t ) and the xed 2 . 5 µ V LSB step size of the shunt voltage as indicated by Equation 1. I L S B = 2 . 5 µ V R s h u n t (1) W e select a 2 Ω shunt that allows currents of over 40 mA , thus covering most typical Io T devices including conne cted sensors, while still maintaining a reasonable burden voltage around 80 mV . This shunt resistor value grants a resolution of 1 . 25 µ A . For tracing of the active node consumption this is considered accurate enough. Though, for determination of low power sleep mode consumption additional provisioning of a separate measurement range would be benecial. In this work, we do not focus on this aspect as related work already cov ers this in great detail [11, 14, 16, 26, 32]. 4.1.3 Latency . The dominating share in read latency is added by I 2 C communication, which depends on the wiring and clock spe ed conguration. Selecting an appropriate priority for the power mea- surement thread is also important. Choosing the priority too low may starve the thread on high utilization and signicantly incr eases latency and jitter . With a high priority it is important to select the sampling rate of the module low enough to not be invasive to the application. For deriving reasonable values, an application should be compiled for the target platform with the ’ps’ command func- tionality included. The overall computation o verhead induced by the self-measurement can then be investigated and tweaked for the specic use-case and available hardware resources. 4.2 Cross-Platform V alidation A major goal of Eco is to enable energy measur ement on the major- ity of Io T platforms, which requires a seamless way to integrate the module with existing platforms. W e selected four largely hetero- geneous boards to validate the cross-platform applicability of Eco . For a representative set of samples from dierent manufacturers and architectures, we explicitly chose two devices from a higher performance class – 32-Bit Cortex M4 based nucleo-l476rg and slstk3402a, one midrange device – samr21-xpr o running 32-Bit Cor- tex M0+, and the 8-Bit A VR8 arduino-mega2560 at the lower bound of the target devices. With this choice, we spread our tests over three dierent manufacturers (STMicroelectronics, Silicon Labs, and Atmel/Microchip) and the two completely dierent architec- tures ( ARM and A VR). The names refer to the unique board names within RIOT . With the chosen I 2 C connectivity we already cover one hundred of the RIOT supporte d boards as of now and extending this list just requires to provide an I 2 C peripheral driver . Apart from the low-level driv er , enabling Eco for a ne w platform only requires to physically connect six pins from the microcontroller to the mea- surement module, which in turn is connected to the energy storage . Eco: A H W -SW Co-Design for In Situ Power Measurement on Low-end Io T Systems Fast Fast+ High 0 2 4 Energy [ µ W s] 330 Ω Fast Fast+ High 1 k Ω Fast Fast+ High 2.2 k Ω Fast Fast+ High 4.7 k Ω E read [ µ W s] t read [ µ s] 0 100 200 Time [ µ s] Figure 7: Energy and time overhead for a single register read at dierent I 2 C congurations Enabling the software support is done by providing pin mappings for the hardware (i.e. which pin of the MCU is conne cted to the measurement peripheral) and a dep endency declaration for the driver module to the project Makele. While the general approach is not strictly tied to RIOT , some specic capabilities simplied the implementation. The tick-less scheduling keeps the system load low in the absence of events. With multi-threading the consumed energy can be implicitly attributed to separate parts of the application. Also, prioritize d sche duling provides direct control o ver the measurement invasiveness. The general applicability of the proposed solution comes at the cost of a higher computational overhead compared to a highly specialized alternative but the following se ction reveals that the approach is still usable on low-end 8-bit platforms. Considering that in the eld of wireless sensor networks these architectures are even expected to be replaced with more capable 32-Bit variants [ 18 ], we argue that the external module together with its tight OS integration can be considered generically applicable for the targeted devices. 4.3 Overhead T o quantify the overhead of the self measurement, we investigate the bus communication overhead in terms of time and p ow er usage , power usage for the measurement itself and computation o verhead to process the samples. Power usage and computation complexity depend heavily on conguration parameters of the measurement module. In contrast to that, the memory overhead depends mainly on the measurement application and is much bigger when a longer history of measurements or higher temporal resolution needs to be stored. In this case an aggregated quantity like a mo ving average can save plenty of memory . 4.3.1 Power . The power o verhead is generated by three contribu- tors. The measurement module consumes power during sampling, the bus spends energy on communication, and the shunt resistor introduces power loss. Because I 2 C is used, the related communica- tion ov erhead directly depends on the congured bus clock and the wiring. The maximum bus spe ed is only achievable with low value pull up resistors to ensur e fast signal switching times. Though, a lower resistance increases the power consumption when the line is pulled low , making it necessar y to nd an appr opriate balance between high spee d and low consumption. The main factor to determine the necessary pull-up resistance is the bus capacitance ( C b ) that needs to be charged by the current 1 4 16 64 128 256 512 1024 # of A veraged Samples 1 2 3 4 Power [mW] Conversion Time 140 Âţs 588 Âţs 2116 Âţs 8244 Âţs Figure 8: Power consumption of the measurement module for dierent congurations (I 2 C spe ed high) through the pull-up. In the used setup C b is measured to be 158 pF . According to the I 2 C bus specication, the maximum sucient pull-up resistance can be calculated using Equation 2, where t r is the rise time specied by the respective I 2 C speed. Table 2 lists the maximum resistor values for the given C b at the dierent bus speeds. R p ( max ) = t r 0 . 8473 · C b (2) Accordingly , Figure 7 depicts the overhead caused by reading values from the external measurement module in the time and energy domain for multiple bus congurations. Both, energy and time refer to a single register read. The energy values contain the supply for the mo dule itself as well as losses through pull-ups. Plotted time values include all delays introduced by layers up to the reading application. The changed parameters are the spee d mode of the MCU I 2 C peripheral and the pull-up congurations of the wiring. It can be deduced from the data that selecting the pull-up values according to the specication consumes signicantly more energy , while the time spent for communication doesn’t decrease with a similar magnitude. The results can be used to sele ct the most energy ecient conguration from the o verall system view . Our measurements show that the energy cost p er read can vary from 4 . 5 µ W s ( 330 Ω pull-up, fast mode) down to 100 nW s ( 4 . 7 k Ω pull-up, high mode). Because the read duration does not improve with the same ratio, the energetic optimum is between those two points and also depends on how much energy is spent by the MCU during this transaction. With Equation 3 we identify the high speed Michel Roleuthner, Thomas C. Schmidt, and Mahias Wählisch T able 2: Pull-up resistances base d on I 2 C spe cication I 2 C mode t r R p ( max ) Fast 300 ns 2200 Ω Fast+ 120 ns 900 Ω High 40 ns 300 Ω conguration with a 2 . 2 k Ω pull-up as most energy ecient for an average MCU consumption of 12 mA . This stays in contrast to the I 2 C specication recommendations and ee ctively le verages safety margins of the by imposing stricter wiring requirements. E r e a d = ( P M C U + P r e a d ) · t r e a d (3) Using this conguration, we check whether dierent conversion times or averaging steps show a signicant impact on the energy usage. Respectively , Figure 8 shows the average p ow er consumption while sampling. Short conversion times together with low averaging ( i.e., a high sampling frequency) shows signicant impact compared to the overall measurement consumption. With 16 averaging steps the overhead is only visible for the fastest sampling conguration which becomes completely negligible when 64 averaging steps or more are used. Comparing the values with no averaging to the equivalent value with four averaging steps sho ws no noticeable dependence on how a targeted sampling interval is achieved. The shunt resistor introduces a power loss that depends on the current drawn from the sensor node and the supply voltage. A lower supply v oltage implies the xed maximum drop across the shunt has higher relative impact. For a supply voltage of 2 . 7 V and a load of 10 mA the power wasted in the shunt amounts to 0 . 2 mW corresponding to around 0 . 75 % of the overall pow er used. At 1 V using the maximum current of 40 mA the loss equals 3 . 2 mW which already corresponds to 8 % . For systems using such low voltage either a smaller shunt can be used – reducing the r esolution – or another measurement component with higher gain is nee ded. So for systems using voltages as low as 1 V we recommend using a lower resistance shunt to trade eciency for resolution. Concluding the evaluation of the dierent power overhead contributors, yields the static consumption of the sampling process itself as the dominant factor for most cases. The mo dule communication becomes only relevant for ver y fast sampling and the shunt losses are only of concern when very low voltages and high resolution ar e required at the same time. Compensation for the measurement consumption can b e achieved by subtracting a xed oset in case of medium to high sampling rates. Maximum sampling rates require a linear correction taking the communication overhead into account. 4.3.2 Computation. W e need to quantify the CP U occupancy while collecting the samples from the measurement module in or der to select an appropriate sampling rate for the target domain. When the CP U is busy with time sensitive computation, a high sampling rate and its overhead can be invasive. Conversely , for an application that only waits for an external sensor measurement to nish and is interested in a ne-grained power trace while the sensor is running, a high overhead for sampling is tolerable. T o measure the CP U 10 − 4 10 − 3 10 − 2 10 − 1 10 0 10 1 10 2 Sampling Intervals [s] 10 − 3 10 − 2 10 − 1 10 0 10 1 10 2 CP U Utilization [%] arduino-mega2560 slstk3402a nucleo-l476rg samr21-xpro Figure 9: CP U utilization for dierent sampling intervals utilization, the ps command of the RIOT shell is used. The module is set to continuous sampling conguration with interrupt asser- tion enabled. A dedicated thread for the measurement is woken up by each interrupt and reads the values for v oltage and current. This operating mode is left running for ten minutes before the ps command is executed to list the percentage of active time for all threads. The values include every step from reading the device reg- isters to physical unit conversion. The whole procedure is run for eight dierent sample interval congurations. Figure 9 sho ws the results of this evaluation on four exemplary platforms ranging fr om a 32-Bit Cortex-M4 board running at 80 MHz (nucleo-l476rg) down to an 8-Bit A VR running at 16 MHz (arduino-mega2560). While the more capable nucleo-l476rg board stays at 54 % utilization for a sam- pling time of 280 µ s , the arduino-mega2560 is working on its limits and is not able to allocate any CP U resources to other application threads. All values drop linearly ov er almost the full range down to 0 . 16 ‰ and 0 . 57 ‰ respectively at around 1 s . It is noteworthy that exhausted computational power at the highest sampling rate does not prohibit using Eco on that platform. Limite d computational capabilities are also expe cted to de crease the required sampling rate due to the lower rate of ev ents that need to b e measured. Comparing these values with the raw computational perfor- mance of the MCUs shows that the utilization on arduino-mega2560 only increases by a factor ≈ 4 compared to the nucleo-l476rg whereas the performance diers by a factor of 6 (16 million in- structions p er second (MIPS) vs. 100 MIPS). The CP U utilization is thus dominated by the I 2 C transfer time and not limited by the raw instruction performance. As the slowest sampling rate only generates 35 context switches to the measurement thread, its CP U values are subject to inaccuracies of the ps command. Using the module ’s integrated power calculation instead of read- ing current and voltage separately can about halve the time for I 2 C reading. More room for impro vement exists in the I 2 C periph- eral drivers of RIOT , which often do not leverage all the hardware features such as interrupt control or direct memory access. 4.3.3 Memory . Memory overhead can be considered from three dierent perspectives. The static memory used by the module dri- ver , the measurement thread, and a buer for storing a history if necessar y . The driver itself uses up to 560 B , depending on the Eco: A H W -SW Co-Design for In Situ Power Measurement on Low-end Io T Systems T able 3: Performance comparison of sele cte d measurement solutions V oltage Accuracy Power Overhead CP U Overhead Read Duration SPOT [14] ✗ 3 % ∼ 5 mW unpublished * unpublished * iCount [11] ✗ ± 15 % ( 5 µ A - 50 mA ) 0 . 3 µ W - 30 µ W unpublished † 15 µ s Nemo [32] ✗ 1 . 34 % avg. 8 % max. 0 . 4 µ W - 12 mW 0 . 6 % ( 10 s @ 0 . 5 Hz , 10 ms @ 8 kHz ) 1 ms ‡ Eco ✓ < 1 % (> 0 . 2 mA ) 6 µ W - 1 . 1 mW 0 . 16 ‰ @ 1 Hz 1 . 5 % @ 100 Hz 33 µ s * A longer duration for reading samples is indicated because multiple steps are required per sample and the I 2 C is running with a slower clock ( 100 kHz ) † By using an internal hardware counter the overhead is assumed to be very low , but hardwar e dependent ‡ Best case for stated bandwidth, ignoring protocol overhead, assuming 16 bit samples actually used functionality . The application uses additional 36 B for the ISR callback, 32 B for a message queue, 268 B for measurement thread code and additional 256 B of thread stack size, but the overall memory requirement slightly diers with target architecture and enabled features. Depending on whether separate voltage and cur- rent samples need to be stored or a single power value is enough, a history nee ds either additional two or four bytes per sample . 4.4 Discussion: Rating Eco Eco was designe d as a highly portable approach that can b e de- ployed with ov er one hundred dierent boards using a har dware shield carrying only commo dity components, and software tightly integrated with the RIOT OS. In contrast to many existing solu- tions, Eco neither exploits special asp ects of individual boards, nor takes advantage of highly specialized or expensive components. Correspondingly , it is natural to question its qualitativ e positioning with respect to the current state of the art as outlined in Section 2. W e compare the key performance indicators of Eco and those solutions that are roughly comparable and have published corre- sponding measurements in T able 3. The indicators are ( i ) availability of voltage readings, ( ii ) relative err ors, ( iii ) overhead in power and CP U utilization, and ( iv ) reading performance. Overall we nd Eco in the vicinity of the best performers for each indicator . In par- ticular , our system appears to b e the most balanced with respect to the considered metrics, and it is the only solution that actually measures voltage. SPOT [ 14 ] and iCount [ 11 ] do not keep track of voltage and instead assume a constant value. In particular for super capacitor based energy-harvesting systems, this assumption is not valid and leads to erroneous results. Accessing measurement values of SPOT is also done via I 2 C, but the related communication overhead (in terms of power and CPU utilization) is not evaluated. In contrast, Eco takes I 2 C cost carefully into consideration and can adapt to its dierent congurations. By using an internal hardware counter and a signal of the switch- ing regulator , iCount almost completely removes the need for addi- tional hardware components and hence has low power overhead. This comes at the cost of losing general applicability for dierent supply circuits and has the vital downside of requiring complex per device calibration. It is also noteworthy that supply circuit properties and sampling rate aect the achievable resolution [32]. Nemo [ 32 ] brings an additional MCU-board which guarantees good measurement accuracy , high sampling rates, and relatively low CP U overhead. The major downsides are its high complexity and p ow er overhead. With 150 µ A in sle ep mode it already con- sumes almost halve the power of our setup during measur ements. In active operation this incr eases to 4 . 6 mA , eectively requiring an additional power supply for long term in situ deployments. Nemo is focused on seamless integration into one specic plat- form and avoiding additional wiring by using modulation of the supply voltage to transmit its information to the measured node. The authors give an example of the overhead based on a use case of sampling at 0 . 5 Hz for 10 s and then sampling at 8 kHz for 10 ms while buering all data on the measurement node. Transmitting the buer to the obser ved node after wards results in an average overhead of 0 . 6 % . The communication bandwidth implies that the achievable continuous meter-to-node data rate is over 60 times slower than with the I 2 C conguration we are using. For use cases where the node continuously needs timely information of its power consumption ( e.g., when correlating power usage with software tasks), this slower data rate combined with buering is inadequate. From these observations, we conclude that specically optimized custom solutions for spe cic use cases can slightly outperform our generic approach, but the commodity design of Eco proves to be signicantly more versatile without sacricing performance. 5 V ALID A TION IN FIELD TRIAL For a eld trial under realistic conditions we equipped ve energy harvesting sensor nodes with Eco and deployed them outdoors for environmental sensing of temperature, humidity , air pressure, and particulate matter . The data Eco provided was use d to sus- tain persistent energy neutral operation by controlling sensing and transmission intervals. During ve weeks the temperatures ranged from 1 . 5 ◦ C ( 34 . 7 ° F ) to 40 . 1 ◦ C ( 104 . 18 ° F ) with intra-day uctuations of over 32 ◦ C ( 57 . 6 ° F .). Deployment Setup. W e deployed ve individual Eco -equipped systems on a r ooftop directly exposed to the w eather , see Figur e 10. T o meet harsh conditions, a waterproof IP65 enclosure box and a tube protecte d each node and environmental sensors. W e diversied the setting by employing sensors of various manufacturers with dif- ferent power requirements while using the same generic rmware on all of them. Energy-har vesting was based on top mounted solar panels. T o conne ct the Io T devices via IEEE 802.15.4 to the Internet, we used a Raspberry Pi gateway that ran Raspbian Stretch Lite with wpan-tools and radvd . The Io T netw ork was congured as a pure star topology with node distances from 2 m to 10 m . Michel Roleuthner, Thomas C. Schmidt, and Mahias Wählisch Figure 10: Eco energy-har vesting system deployed in a wa- tertight box with a tub e connector for environmental sens- ing 5.1 Software Logic The rmware continuously re-quanties the charging pow er and the energy consumed by the task execution, and adapts the duty cycle according to the available energy . The consumption of the application tasks is quantied by the explicit tracing mechanism introduced in Se ction 3. T o determine the charging current, the system issues a measurement cy cle with enabled alerting and en- ters low-pow er sleep mode immediately . Once nished, the module wakes up the no de, which reads the value. This procedure is compat- ible with the lowest possible shutdown modes, which only provide asynchronous wakeup-sources on many MCUs. Isolated consump- tion is assessed by disabling the charging circuit to ignor e energy provided by the solar panel. Depending on available and consumed energy , the duty-cycle and inter vals for recording ne-grained traces are also adapted. With the precise and timely knowledge about incoming energy , the no de can adapt as early as p ossible to achieve higher utilization. The MCU-internal real-time clo ck (RTC) provided an absolute time reference for the measured data. A clock drift compensation was implemented to lower the time synchronization interval for the RTC. Data provided by the simple network time protocol of the RIOT sntp module is therefore used to calibrate the RTC at runtime. T o prevent data loss be cause of wireless transmission failures, data is logged to the local persistent storage for later investigation. Sensor data is encoded in a JSON format, transmitted to the gateway via Co AP messages, and nally stored in an external database for post-processing. 5.2 Results Figure 11 shows a one-day snapshot of the interplay b etween power consumption and charging. Negative bars indicate used power by the node when active , positive bars show charging pow er when the 00 02 04 06 08 10 12 14 16 18 20 22 Day Time [hour] − 150 − 100 − 50 0 50 100 Power [mW] P use [mW] P charge [mW] U SC [V] 0 1 2 3 V oltage [V] Figure 11: Power consumption and charging over one day observed at one Eco -enabled Io T device ( 750 m Ω shunt resis- tor) node is inactive. Each power value represents an average over a two- hour binning. The super cap voltage represents the state at the end of each tw o-hour slot. A typical sun-cycle can be identied based on the voltage of the super cap as well as the available charging power . The much high power consumption of the activ e node shows the need for energy har vesting and duty cy cling. The local memor y was utilized to store detailed energy traces of individual task executions for further analysis. With this onboard data storage, we were able to distinguish erroneous node behavior and failing radio transmissions. As we also monitored clock drifts, we were able to correlate these drifts with temperature uctuations. A lesson learne d was that the measurements of the charging power for the inactive nodes need careful parameterization at high energy availability . The rmware was congur ed to limit the duty cycle to a minimum of 10 seconds to keep link stress low for other nodes. With high energy availability , the time to recharge the su- per cap after a measurement cycle was sometimes shorter than the selected measurement duration for the charging p ow er . This eect is visible in Figure 11 at 10:00am to 2:00pm where the p ow er consumption P u s e drops. In this case, the charging current was limited because the energy buer was full and the active period did not consume enough energy to fully utilize availability from the solar panel. Albeit the measurements still show the average of the actually charged power , it may be of interest to know ho w much could have been charged with more energy storage capacity . This allows to proactively schedule more energy before charging starts again, eectively increasing the utilization of the system further . Additionally , a dynamically switchable load may be helpful in those cases. For the energy tracing, we used a lower thread priority compared to the rest of the system thr eads, which proved to be problematic when long-running blo cking operations occur . For example, le system op erations sometimes blocked simultaneous tracing. T o circumvent this, either higher priority tracing is required which Eco: A H W -SW Co-Design for In Situ Power Measurement on Low-end Io T Systems 0 2 4 6 8 t [s] 0 100 200 Current [mA] enable 5v boost and dust sensing fan start enable pressure sensor disable dust sensor tx start I MCU [mA] U SC [V] 2 . 62 2 . 64 2 . 66 V oltage [V] Figure 12: Power trace of a dust sensor execution cycle further increases the invasiveness of the measurement. Or a non- blocking SD card driver needs to be implemente d, which would actually lower the CP U utilization. A ne-grained trace of the current for a no de equippe d with a power demanding dust sensor is shown in Figure 12. The con- sumption of individual sensing steps of the application can be in- vestigated further with this sample. Shortly after bo ot, the pressure sensor is powered up and initialized. Before the dust sensor starts, the boost converter creates a short spike on the power line. Once the initialization is done, the sensor starts its fan. It is clearly visible how the startup curr ent slowly settles when the fan reaches its nal speed. Thereafter , the dust sensor is disabled and the collected data is transmitted. With this kind of self-measurement the node can not only adjust itself to environmental changes but also detect critical component health like raising equivalent series resistance of the super cap or faulty behavior of mechanical components like friction or blocking. Our eld trial showed that Eco is suitable in practice and the collected performance data also underlines that it can b e used in even more constrained scenarios e.g., with smaller solar panels. Alternatively , a bigger capacitor could be used to allow higher utilization during nighttime. With its persistent storage the system could also buer processing work that is not time critical to perform calculation when energy oversupply occurs. 6 CONCLUSIONS AND OU TLOOK W e presented a hardware-software co-design for self-measuring energy consumption of class-1 IoT nodes [ 5 ]. Its generic design is easily portable to many boards due to commodity hardware connected via a standard bus and its seamless integration into a popular Io T OS. It provides functions to trace code sections on the application level and threads on the system level. The module was successfully validated in a comprehensive eld trial. W e evaluated the portability and accuracy of our in situ mea- surement module, as well as its overheads. Our ndings indicate that the solution successfully competes with specialize d, highly op- timized designs at high accuracy and low overhead. The exibility conjoined with accuracy achieved by Eco helps with adding energy awareness to applications via OS-provided primitives. In future work, we will fo cus on providing a generic, light-weight management to ol-set. Extending the support for other types of measurement modules is also considered helpful to make the so- lution more versatile. As a rational addition to the OS supp orted self-measurement, we will work on a separate module that pro- vides default implementations of common energy management algorithms such as EWMA [ 15 ], ENO-MAX [ 30 ], and LT -ENO [ 6 ]. REFERENCES [1] Muhammad Hamad Alizai, Qasim Raza, Yasra Chandio, Aan A. Syed, and T ariq M. Jadoon. 2016. Simulating Intermittently Powered Embedded Networks. In Proceedings of the International Conference on Embe dded Wireless Systems and Networks (EWSN ’16) . Junction Publishing, Canada, 35–40. [2] Panagnos Anagnostou, Andres Gomez, Pascal A. Hager, Hamed Fatemi, JosÃľ Pineda de Gyvez, Lothar Thiele, and Luca Benini. 2018. T orpor: A Pow er- A ware HW Scheduler for Energy Har vesting Io T SoCs. In 2018 28th International Symposium on Power and Timing Modeling, Optimization and Simulation (P A T- MOS) . IEEE, 54–61. [3] Frank Bellosa. 2000. The Benets of Event-Driven Energy Accounting in Power- Sensitive Systems. In Proceedings of the 9th Workshop on ACM SIGOPS European W orkshop (EW 9) . ACM, New Y ork, NY, USA, 37–42. [4] Naveed Anwar Bhatti, Muhammad Hamad Alizai, Aan A Syed, and Luca Mottola. 2016. Energy Harvesting and Wireless Transfer in Sensor Network Applications: Concepts and Experiences. A CM Transactions on Sensor Networks (TOSN) 12, 3 (August 2016), 24:1–24:40. [5] C. Bormann, M. Ersue, and A. Keranen. 2014. Terminology for Constrained-No de Networks . RFC 7228. IETF. [6] Bernhard Buchli, Felix Sutton, Jan Beutel, and Lothar Thiele. 2014. Dynamic Power Management for Long-term Energy Neutral Operation of Solar Energy Harvesting Systems. In Proceedings of the 12th ACM Conference on Embe dded Network Sensor Systems (SenSys ’14) . ACM, Ne w Y ork, NY , USA, 31–45. [7] Thanh Do, Suhib Rawshdeh, and W eisong Shi. 2009. pT op: A Process-lev el Power Proling T ool. In Proce e dings of the 2nd W orkshop on Power A ware Computing and Systems (HotPower’09) . A CM, New Y ork, N Y , USA. [8] Adam Dunkels, Joakim Eriksson, Niclas Finne, and Nicolas T siftes. 2011. Power- trace: Network-level Power Proling for Low-power Wireless Networks . T echnical Report. Swedish Institute of Computer Science. [9] Adam Dunkels, Björn Grönvall, and Thiemo V oigt. 2004. Contiki - A Lightweight and F lexible Operating System for Tiny Networked Sensors.. In Proc. of IEEE Local Computer Networks (LCN) . IEEE Computer Society , 455–462. [10] Adam Dunkels, Fr edrik Osterlind, Nicolas T siftes, and Zhitao He. 2007. Software- based On-line Energy Estimation for Sensor No des. In Proceedings of the 4th W orkshop on Emb edded Networked Sensors (EmNets ’07) . ACM, New Y ork, N Y , USA, 28–32. [11] Prabal Dutta, Mark Feldmeier , Joseph Paradiso, and David Culler . 2008. Energy Metering for Free: Augmenting Switching Regulators for Real- Time Monitoring. In Proce e dings of the 7th International Conference on Information Processing in Sensor Networks (IPSN ’08) . IEEE Computer So ciety , Washington, DC, USA, 283– 294. [12] Rodrigo Fonseca, Prabal Dutta, Philip Levis, and Ion Stoica. 2008. Quanto: Track- ing Energy in Networked Embedded Systems. In Proceedings of the 8th USENIX Conference on Operating Systems Design and Implementation (OSDI’08) . USENIX Association, Berkeley , CA, USA, 323–338. [13] Kai Geissdoerfer , Raja Jurdak, Brano Kusy , and Marco Zimmerling. 2019. Get- ting More Out of Energy-harvesting Systems: Energy Management under Time- varying Utility with Pre Act. In Proceedings of the 18th International Conference on Information Processing in Sensor Networks (IPSN ’19) . A CM, New Y ork, NY, USA. [14] Xiaofan Jiang, Prabal Dutta, David Culler, and Ion Stoica. 2007. Micro Power Meter for Energy Monitoring of Wireless Sensor Netw orks at Scale. In Pr oceedings of the 6th International Conference on Information Processing in Sensor Networks (IPSN ’07) . ACM, New Y ork, N Y , USA, 186–195. [15] Aman Kansal, Jason Hsu, Sadaf Zahe di, and Mani B. Srivastava. 2007. Power Management in Energy Harvesting Sensor Networks. ACM Transactions on Embedded Computing Systems 6, 4 (September 2007), 32–44. [16] Giannis Kazdaridis, Ioannis Zographopoulos, Polychronis Symeonidis, Panagiotis Skrimponis, Thanasis Korakis, and Leandros T assiulas. 2017. In-situ Power Consumption Meter for Sensor Networks supporting Extreme Dynamic Range. In Proceedings of the 11th W orkshop on Wireless Network T estbeds, Exp erimental Evaluation & CHaracterization (WiN TECH ’17) . A CM, Ne w Y ork, NY, USA, 97–98. [17] Simon K ellner . 2010. Flexible Online Energy Accounting in TinyOS. In Real- W orld Wireless Sensor Networks (LNCS) , V ol. 6511. Springer Berlin Heidelberg, Berlin, Heidelberg, 62–73. [18] Hyung-Sin Kim, Michael P. Andersen, Kaifei Chen, Sam Kumar , William J. Zhao, Kevin Ma, and David E. Culler . 2018. System Architecture Directions for Post- SoC/32-bit Networked Sensors. In Proceedings of the 16th ACM Conference on Embedded Networked Sensor Systems (SenSys ’18) . ACM, New Y ork, N Y , USA, 264–277. [19] Olaf Landsiedel, Klaus W ehrle, and Stefan Gotz. 2005. Accurate Prediction of Power Consumption in Sensor Networks. In Proceedings of the 2nd IEEE W orkshop on Emb edded Networked Sensors (EmNets ’05) . IEEE Computer Society , W ashing- ton, DC, USA, 37–44. Michel Roleuthner, Thomas C. Schmidt, and Mahias Wählisch [20] Qiang Li, Marcelo Martins, Omprakash Gnawali, and Rodrigo Fonseca. 2013. On the Eectiveness of Energy Metering on Every Node. In 2013 IEEE Interna- tional Conference on Distributed Computing in Sensor Systems (DCoSS 2013) . IEEE Computer Society , W ashington, DC, USA, 231–240. [21] Roman Lim, Fe derico Ferrari, Marco Zimmerling, Christoph Walser , Philipp Sommer , and Jan Beutel. 2013. FlockLab: A T estbed for Distributed, Synchronized Tracing and Proling of Wir eless Embedded Systems. In Procee dings of the 12th International Conference on Information Processing in Sensor Networks (IPSN ’13) . ACM, Ne w Y ork, NY , USA, 153–166. [22] Roman Lim and Lothar Thiele. 2017. T estbed Assisted Control Flow Tracing for Wireless Embedded Systems. In Proceedings of the International Conference on Embedded Wireless Systems and Networks (EWSN ’17) . Junction Publishing, Canada, 180–191. [23] Christian Renner , V olker Turau, and Kay RÃűmer . 2014. Online energy as- sessment with supercapacitors and energy harvesters. Sustainable Computing: Informatics and Systems 4, 1 (March 2014), 10–23. [24] Rinalds Ruskuls and Leo Selavo. 2010. EdiMote: A Flexible Sensor Node Prototyp- ing And Proling T ool. In Real- W orld Wireless Sensor Networks (LNCS) , V ol. 6511. Springer Berlin Heidelberg, Berlin, Heidelberg, 194–197. [25] Victor Shnay der , Mark Hempstead, Bor rong Chen, Geo W erner Allen, and Matt W elsh. 2004. Simulating the Power Consumption of Large-Scale Sensor Network Applications. In Proceedings of the 2nd International Conference on Emb edded Networked Sensor Systems (SenSys ’04) . ACM, New Y ork, NY, USA, 188–200. [26] Lukas Sigrist, Andres Gomez, Roman Lim, Stefan Lippuner, Matthias Leubin, and Lothar Thiele. 2017. Measurement and V alidation of Energy Harvesting Io T Devices. In Proceedings of the Conference on Design, Automation & T est in Europe (DA TE ’17) . European Design and Automation Association, Leuven, Belgium, 1159–1164. [27] Philipp Sommer and Branislav Kusy. 2013. Minerva: Distributed Tracing and De- bugging in Wireless Sensor Networks. In Pr oceedings of the 11th A CM Conference on Emb edded Networked Sensor Systems (SenSys ’13) . ACM, New Y ork, N Y , USA, 12:1–12:14. [28] Matthew Tancr eti, Mohammad Sajjad Hossain, Saurabh Bagchiand, and Vi- jay Raghunathan. 2011. A VEKSHA: A Hardware-Software Approach for Non- intrusive Tracing and Proling of Wireless Embedded Systems. In Proceedings of the 9th A CM Conference on Embedded Networked Sensor Systems (SenSys ’11) . ACM, Ne w Y ork, NY , USA, 288–301. [29] Ben L. Titzer, Daniel K. Lee, and Jens Palsb erg. 2005. A vrora: Scalable Sensor Network Simulation with Precise Timing. In Proceedings of the 4th International Symposium on Information Processing in Sensor Networks (IPSN ’05) . IEEE Press, Piscataway , NJ, USA, 477–482. [30] Christopher M. Vigorito, Deepak Ganesan, and Andre w G. Barto. 2007. Adaptiv e Control of Duty Cycling in Energy-Harvesting Wireless Sensor Networks. 4th A nnual IEEE Communications Society (June 2007), 21–30. [31] Hong Zhang, Mastooreh Salajegheh, Kevin Fu, and Jacob Sorber. 2011. Ekho: Bridging the Gap Between Simulation and Reality in Tiny Energy-Harvesting Sensors. In Proceedings of the 4th W orkshop on Power- A ware Computing and Systems (HotPower ’11) . ACM, New Y ork, N Y , USA, 9:1–9:5. [32] Ruogu Zhou and Guoliang Xing. 2013. Nemo: A High-delity Noninvasive Power Meter System for Wireless Sensor Networks. In 12th International Conference on Information Processing in Sensor Networks (IPSN ’13) . ACM, New Y ork, NY, USA, 141–152.
Original Paper
Loading high-quality paper...
Comments & Academic Discussion
Loading comments...
Leave a Comment